- Elliott Wave
- May 26, 2026
- 2 min read
SP500 Elliott Wave: Five Waves Up
Executive Summary
- Topping Trend: SPX is nearing the end of an impulse pattern that would lead to 6-10% decline.
- Initial Downside Target: $7,045 – 38% Fibonacci retracement of the March-May rally.
- Wave Count: Wave ‘v’ of (v) impulse pattern nearing completion.
SPX continues its rally from the March low. The rally counts best as an impulse pattern and the structure is mature, nearing its end. The top may be in place today or with one more jab higher to all-time highs.
Current Elliott Wave Analysis
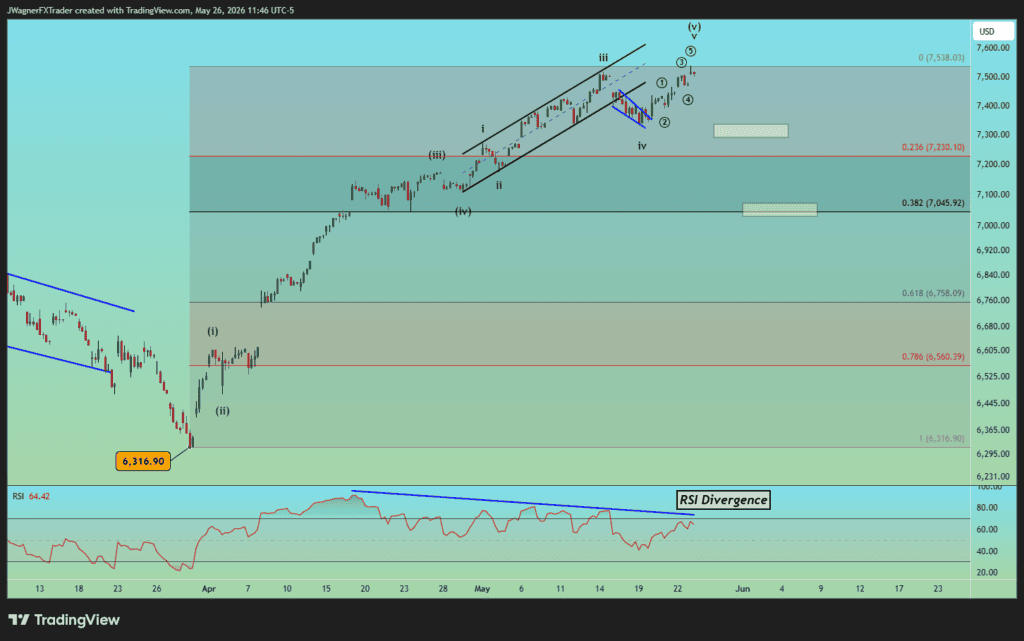
An Elliott wave impulse pattern counts as 5 waves. It appears the rally from March 30 is in the fifth wave of that 5-wave structure. Aside from counting out 5 waves from the 6,316 low, the heavy RSI divergence is another clue this rally is mature and ripe for a correction.
Beginning in mid-April to now, SP500 continues to grab new all-time highs. However, the RSI oscillator is not matching those new price highs, creating a divergence signal. This signals momentum is slowing and a turn lower may be just around the corner. Within wave v of (v), we can count out a smaller 5-wave impulse so the minimum waves are in place for a 6-10% price correction.
Assuming a top is reached soon, the decline typically reaches at least at the 38% Fibonacci retracement relationship of the entire impulse pattern. That could signal a decline back to 7,045, depending on where the top forms. Even lower levels are possible as retracements often make it to the 61% level, in this case near 6,758.
Bottom Line
SPX is in the latter stages of a bullish impulse pattern. We can count the minimum waves in place for a completed bullish impulse pattern from the 6,316 price low. If a top is in place, then a correction back to 7,045 and possibly 6,758 may be developing soon.