


- Elliott Wave
- June 29, 2026
- 2 min read
SP500 Elliott Wave: Continued Rally
Executive Summary
- Trend Bias: Shifting higher after a month-long downward correction.
- Wave Count: Wave ((iii)) bullish rally.
- If SPX pushes below 7,237, then a deeper decline is likely to 7,103 or 6,929.
After correcting sideways for the month of June, SPX appears poised to continue its rally to new all-time highs.
Current Elliott Wave Analysis
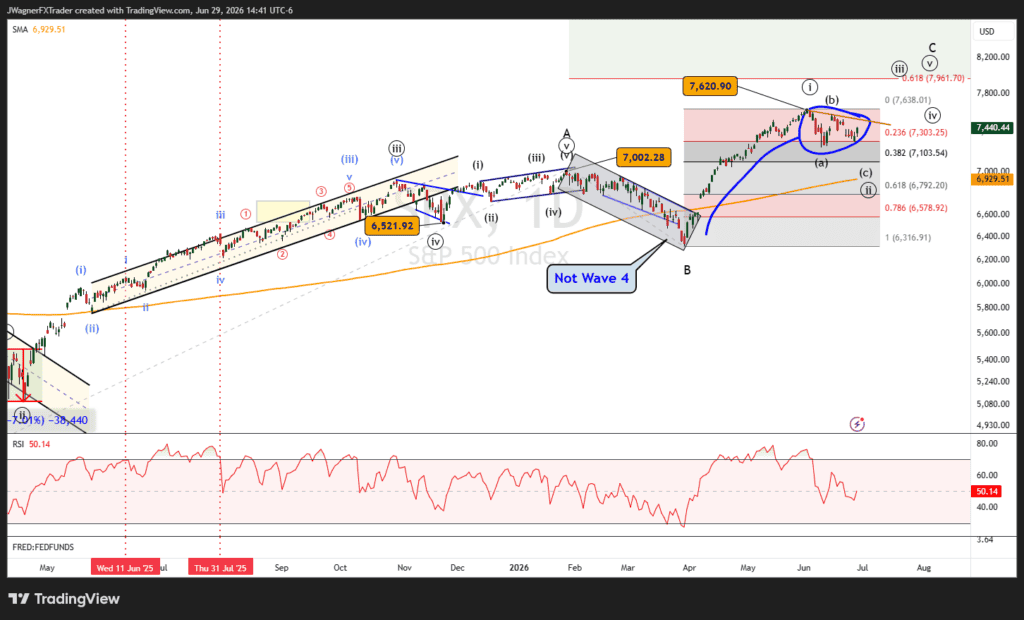
An Elliott wave impulse pattern counts as 5 waves. It appears the rally from March 30 has completed five waves while registering RSI divergence into the high.
SPX did correct lower. However, the decline was sloppy and choppy, indicative of a corrective decline and not an impulsive decline. This behavior suggests the decline would be temporary and lead to new all-time highs.
It is possible to consider that the month-long zigzag decline in June is complete, labeled (a)-(b)-(c). Prices may decline further, possibly reaching the 38% Fibonacci retracement level near 7,103.
However, SPX doesn’t have to decline further as it has reached the 23.6% retracement level, which is considered the minimum retracement zone.
Keep an eye on the brown resistance trend line. If SPX breaks above this trend line, then it would be a clue that perhaps wave ((iii)) is trending higher to new all-time highs.
Failure to break above the resistance trend line, currently sitting near 7,525 may signal that a deeper correction in wave ((ii)) is not complete.
Regardless on the depth of the decline, we anticipate that SPX will hold above the 200-day simple moving average at 6,929.
Bottom Line
SPX is in the latter stages of a corrective decline for wave ((ii)). This means a strong wave ((iii)) bullish rally is about to begin to push SPX up to new all-time highs.
If the June low of 7,237 is broken, then wave ((ii)) is still carving and pushing lower, possibly to 7,103 and 6,929.


