


- Elliott Wave
- June 18, 2026
- 2 min read
DJIA Elliott Wave: Divergence Signals Caution
Executive Summary
- Trend Bias: Potentially Topping.
- Key Level: 51,398 – which is Wednesday’s post FOMC low.
- Downside Target: If 51,398 breaks, then DJIA is likely to trend down to 48,708 – 49,848.
Current Elliott Wave Analysis
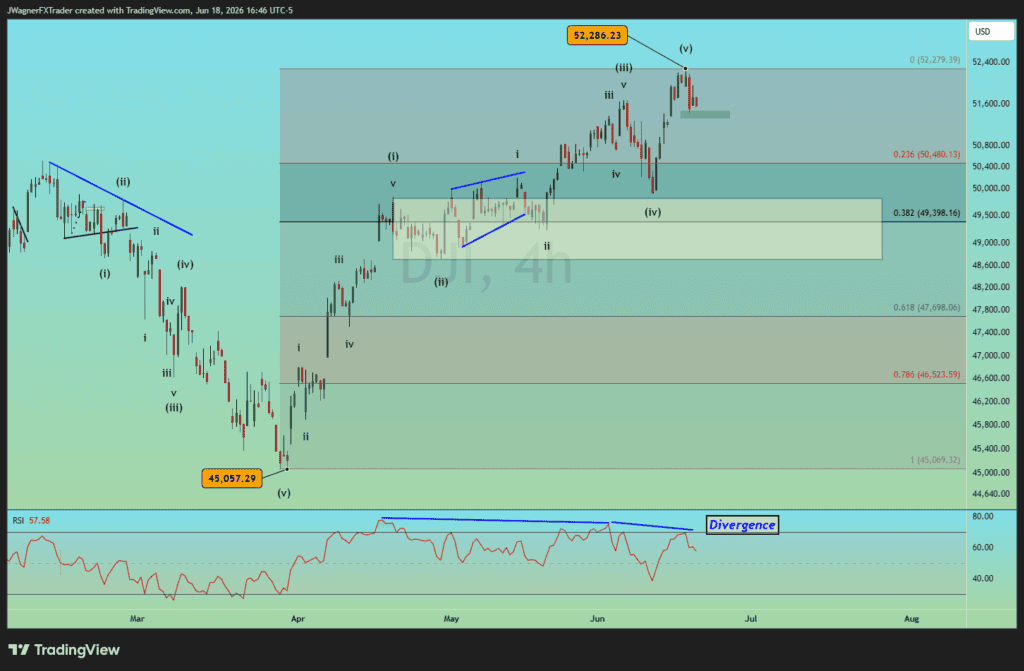
The rally from March 30 appears to be a completed Elliott Wave impulse pattern.
We can count 5-waves up from the low labeled (i)-(ii)-(iii)-(iv)-(v). Within the impulse, it would be wave (i) that was the extended wave. Therefore, it is common for the 38% Fibonacci retracement level to pass through wave (ii), just as it does in this case. Additionally, wave (v) may have topped at yesterday’s high and Dow Jones may be on the front edges of a large decline.
If this wave count is correct, then the Dow Jones Industrial Average would likely decline to the wave (ii) price zone which is also guarded by the 38% Fib retracement. This price zone can act like a magnet and attract prices to 48,708 – 49,848, with even lower levels possible.
RSI divergence hints that momentum is slowing while prices have continued to rally.
If the support zone cited above doesn’t support prices, the next level of support is at the 61% Fibonacci retracement level near 47,698.
This forecast gets kicked off when DJIA prices fall below Wednesday’s low of 51,398. If DJIA prices rally above 52,286, then this wave count as pictured is incorrect and we’ll need to reconsider alternate wave counts.
Bottom Line
As long as the Dow breaks below 51,398, then we anticipate further declines down to 48,708 – 49,848.
If DJIA trends above 52,286 first, then the wave count we’ve used is incorrect and we’ll need to consider alternative counts.


