


- Elliott Wave
- June 22, 2026
- 2 min read
USD/CHF Elliott Wave Forecast: Dollar Rally Continues
Executive Summary
- Trend Bias: Upward trend in Elliott wave 3rd wave.
- Key Levels: Bullish above 200-day simple moving average.
- Target Zone: Wave (iii) near .8212.
Current Elliott Wave Analysis
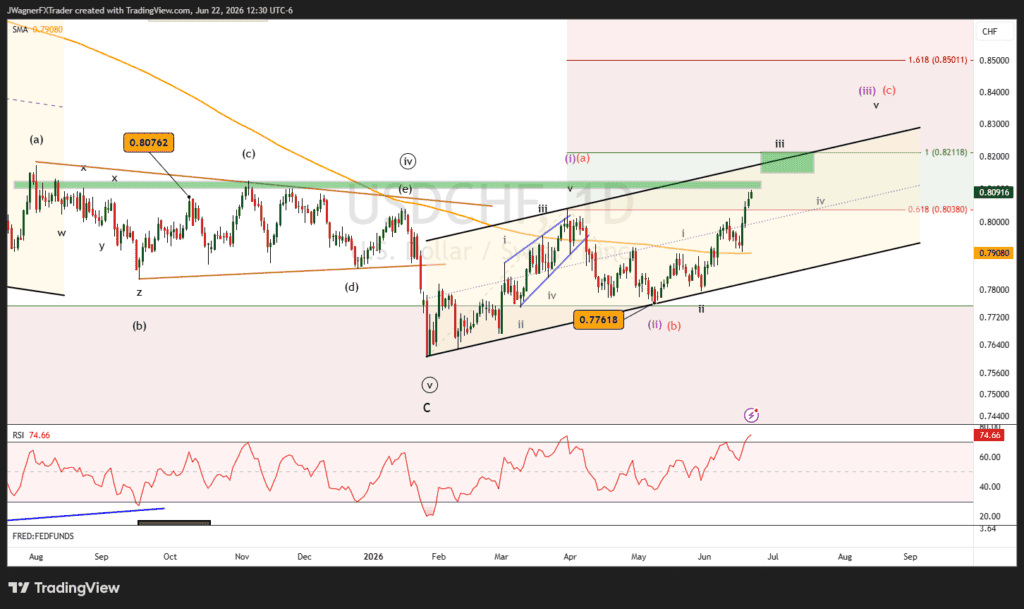
The Elliott wave analysis for the USD/CHF daily chart illustrates the middle of a 3rd leg higher from the 2026 low.
The rally from January 27 low is considered to be an impulse (purple labels) or zigzag (red labels).
Regardless, we are anticipating 5-waves higher from the May 8 low of .7761 labeled i-ii-iii-iv-v.
It appears USD/CHF is currently in the middle wave wave iii. We suspect this wave may rally to meet the upper portion of the parallel price channel near .8212.
From there, a sideways consolidation may build for wave iv, while USD/CHF prices hold above .7907.
Then, another blast higher in wave v to finalize the rally from .7761.
For the next several weeks, we suspect USD/CHF will hold comfortably above the 200-day simple moving average.
Signs of a medium-term top would appear if we begin to see bearish RSI divergence.
In the event that USDCHF prices push below the 200-day simple moving average, then we’ll need to reassess the wave count including the possibility that red wave © topped.
Bottom Line
USD/CHF is likely running higher in a 3rd wave rally. We suspect this rally may carry up to .8212 to finalize the wave (iii).
If USD/CHF begins to fall below the 200 day SMA, then we’ll consider alternative wave counts including red wave (c) has already topped.


