


Written by:

Reviewed by:

- March 5, 2026
- 25 min read
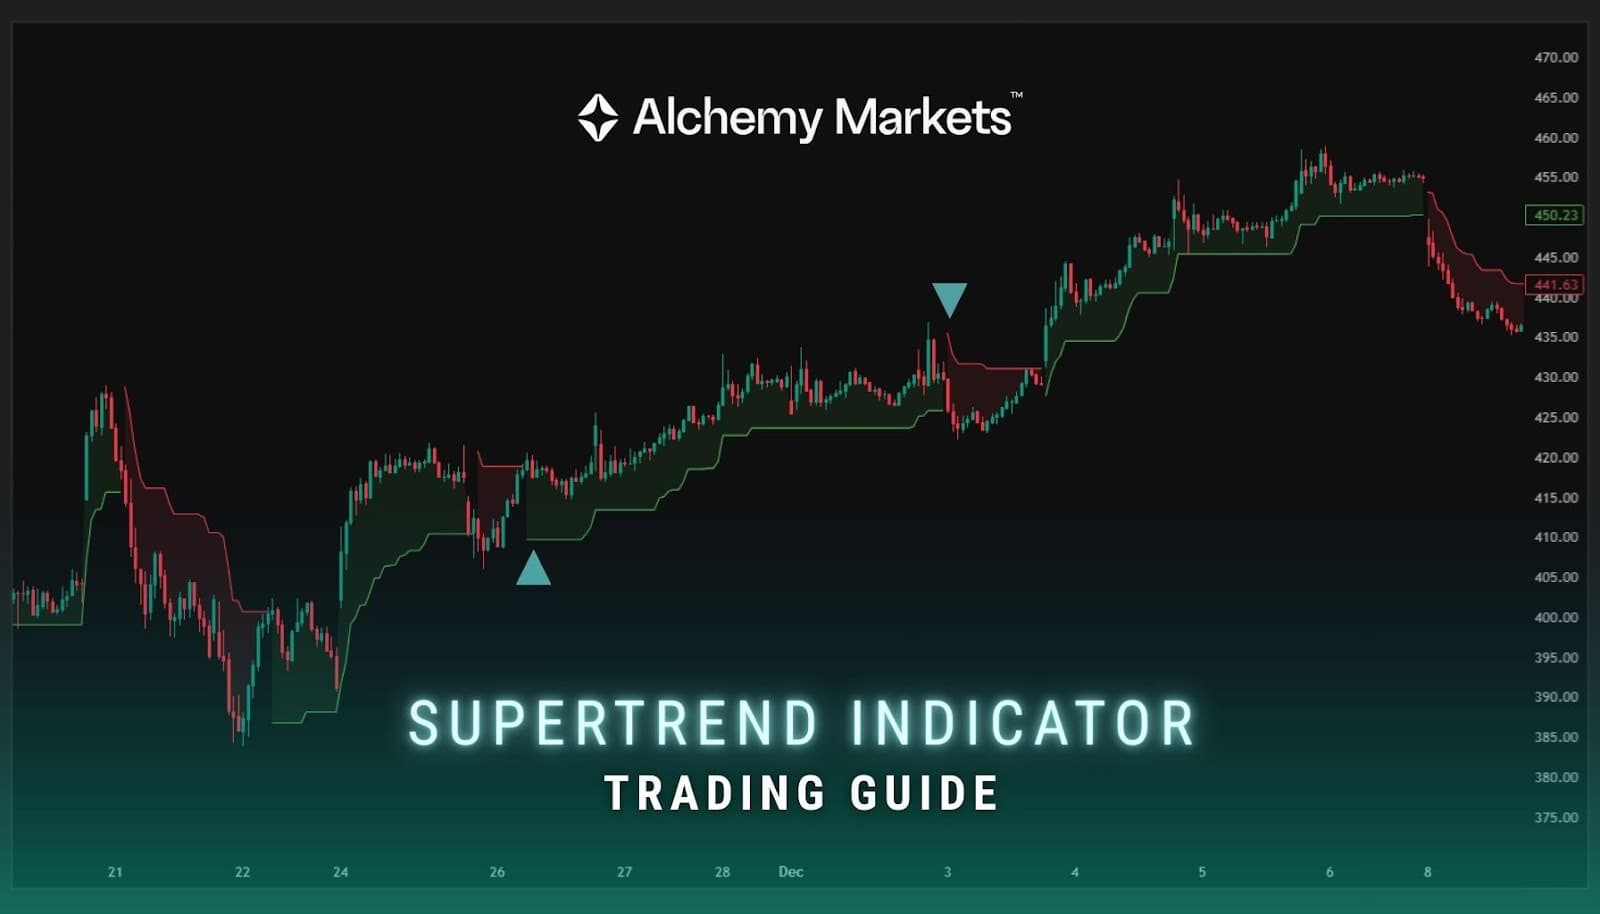
Supertrend Indicator Explained
What if an indicator could tell you when to trade, and even provide a visual guide to where to place stop losses?
That’s the Supertrend indicator for you.
Despite the “unserious” name — think the Awesome Oscillator by Bill Williams — the Supertrend isn’t some paid add-on. It’s a free, widely recognised indicator that traders use to track trend and volatility.
In practice, it can show when a swing is losing momentum, when the trend has flipped, and when a trade is worth considering.
It works like a volatility-based trailing stop, automatically switching sides as price strength changes and giving traders a clear framework for trend bias and risk. While it isn’t as universally cited as moving averages or RSI, Supertrend has become a go-to tool for traders who want simple, rule-driven trend and risk definition.
In this guide, we’ll break down how the Supertrend indicator works, why traders use it to define trend and risk, and how to apply it effectively across different market conditions.
What is a Supertrend Indicator?
The Supertrend indicator is a trading tool that has become popular over the last several years.
It helps identify market trends and provides clear buy and sell signals due to a specific set of rules. The indicator is plotted on the price chart and is used in trending markets.
The Supertrend indicator is widely followed because it simplifies the decisions made by traders by clearly showing the direction of the market trend, and when you should be long or short of an asset.
How Does the Supertrend Indicator Work?
The Supertrend indicator works as a way to visualise the Average True Range in relation to the price action on a chart. The Average True Range measures an asset’s volatility, giving traders an idea of how large or small the trading range might be.
When the price moves above or below a preset ATR value, it will change the direction of the buy or sell signals, allowing traders to get a clear read on the price chart and the underlying action.
This is one of the biggest appeals to this indicator: the clarity and straightforward nature of the output, as it is clearly shown on your price chart.
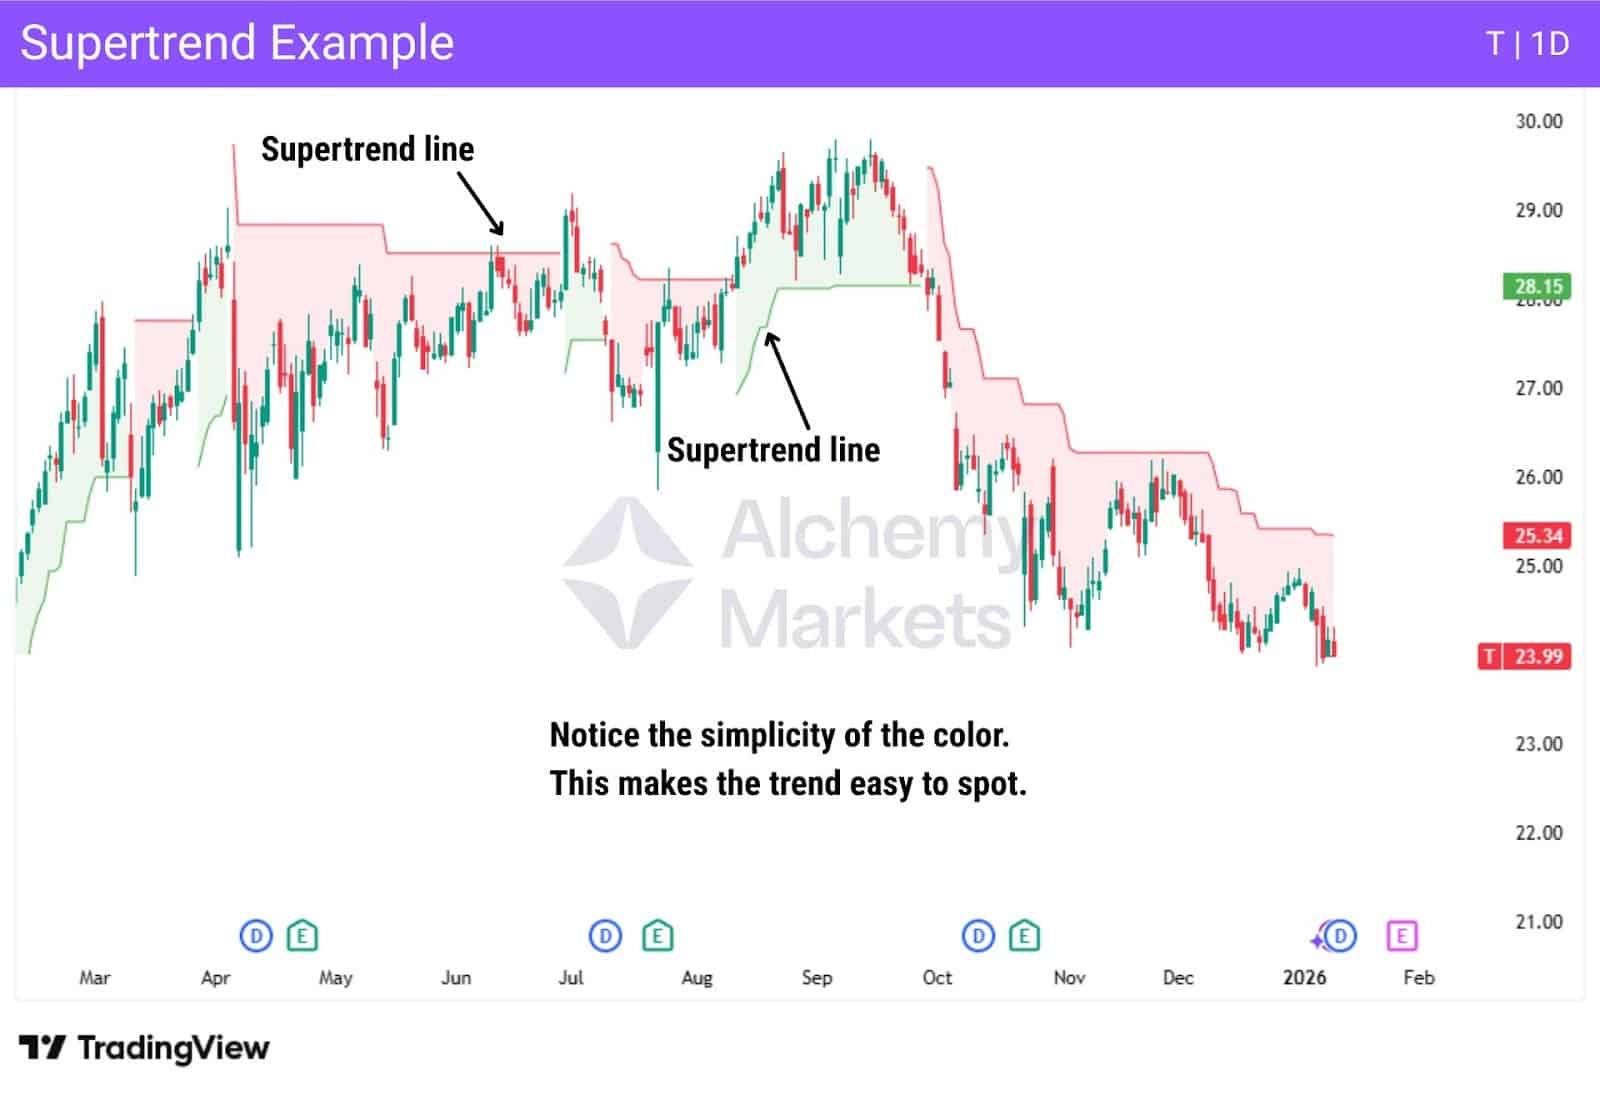
On TradingView, the Supertrend usually appears as a line with a coloured band. On some platforms, you’ll only see the line itself. That’s fine. The visual extras don’t change the logic. What matters is the colour and where price sits relative to the line:
- If the price is above the Supertrend, the market is bullish.
- If the price is below it, the market is bearish.
Most traders use it as a trend filter first, then manage risk around it. In an uptrend (green), stops are placed below the line. In a downtrend (red), stops go above it. When the colour flips, it signals a potential trend change rather than a guaranteed entry.
ATR
Average True Range is the key component for the Supertrend indicator. It dictates how far price has to move in order for a trend shift to occur. Then, the Supertrend draws a line above or below the price, to indicate the trend direction, and also where a stop loss could be placed.
Generally speaking, the most common setting for Supertrend’s ATR is based on 10 periods. The higher the number, the less sensitive the supertrend will be.
The most popular settings for Supertrend’s ATR is as follows:
- The default setting is 10,
- The aggressive setting is often 7, making the indicator more sensitive,
- The conservative setting is often 14, making the Supertrend slower in changing directions.
Multiplier
The “multiplier” is the other key component, as it is part of the overall calculation. It is part of how much “leeway” you give the calculation, to either speed up or slow down trend changes.
The general settings for the multiplier component is as follows:
- The default setting for the multiplier is 3,
- The aggressive setting is often 2,
- The conservative setting is normally 4, making signals less frequent but suitable for capturing longer trends.
Now that you understand the typical Supertrend settings, here is a quick overview:
| Setting: | ATR Setting: | Multiplier: |
| Default: | 10 | 3 |
| Aggressive: | 7 | 2 |
| Conservative: | 14 | 4 |
Lower settings can create a more sensitive indicator, just as higher settings can make it less so. The faster signals are generally preferred by short-term traders, and the slower ones by trend traders.
Making the Supertrend indicator reliable through “tweaking” the inputs is a highly personal thing, and will rely on the trading style and system you are using. However, the previous table can give you a framework from which to begin.
How to Identify Buy and Sell Signals Using Supertrend Indicators?
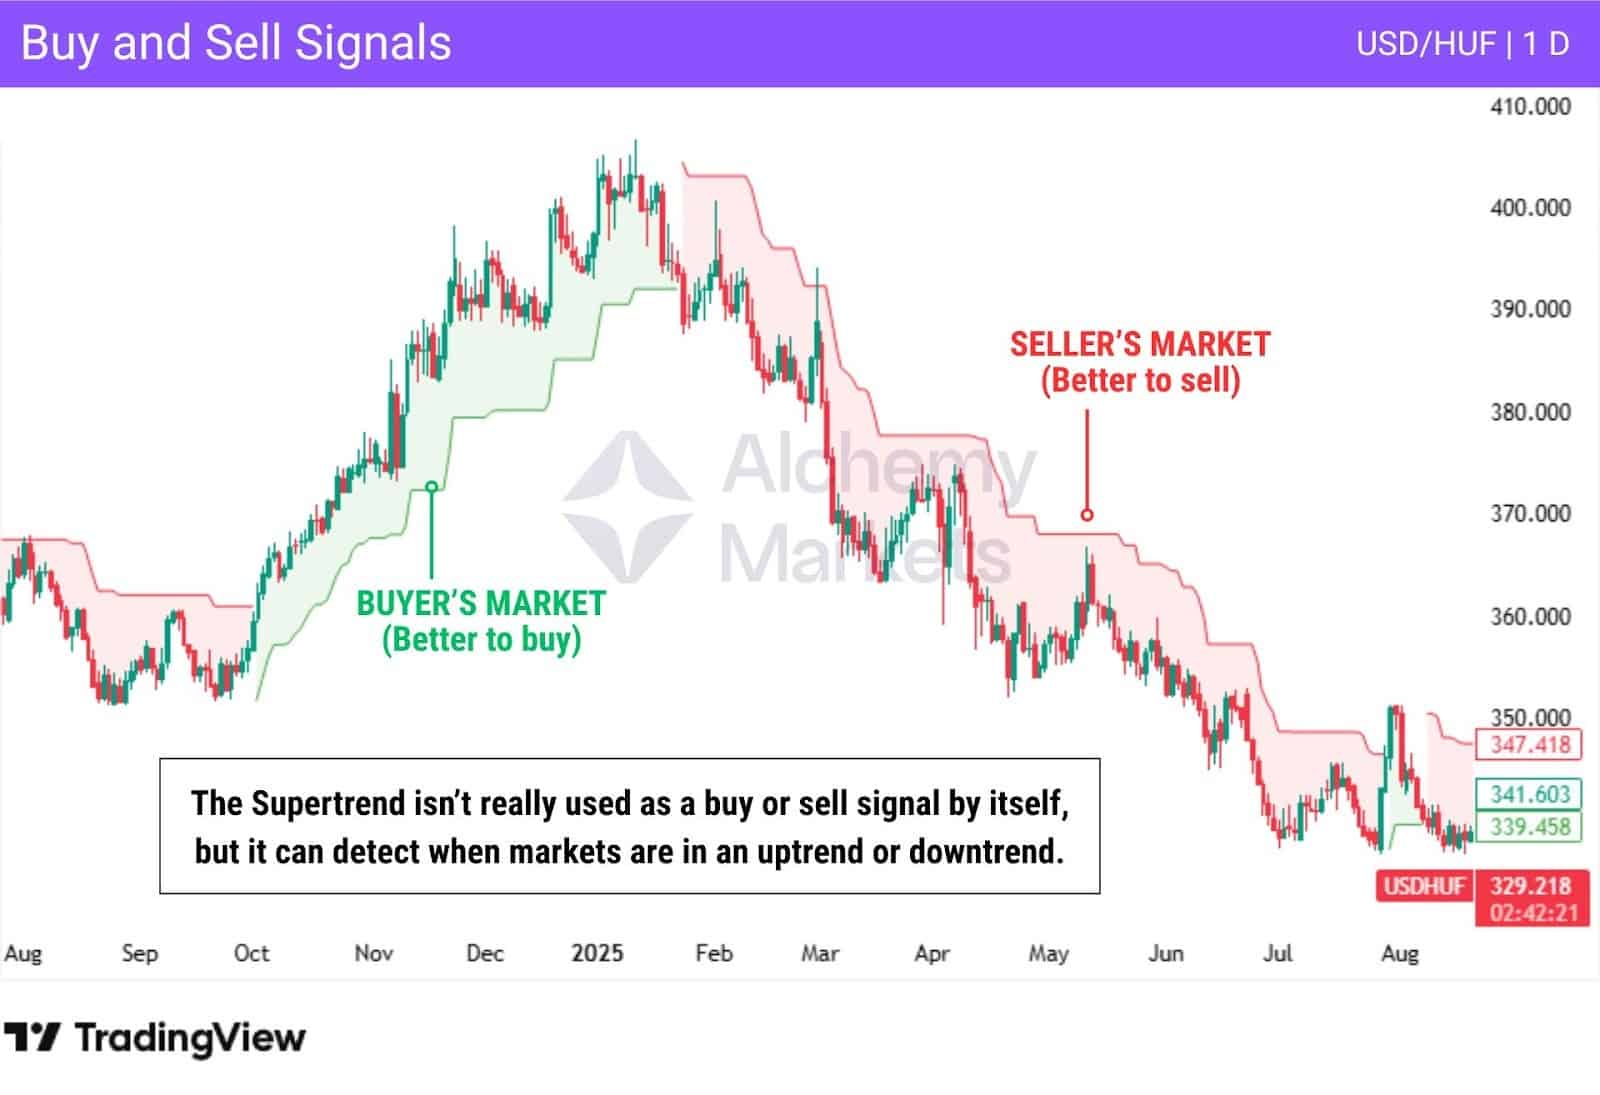
The Supertrend’s main strength is identifying the dominant market direction. When price moves aggressively against that direction, the indicator “flips” its bias, signalling a potential shift in trend.
While some traders treat this flip as a buy or sell signal, the Supertrend works best as market context, not a standalone trigger.
| Price is above Supertrend (Buyer’s Market): Long trades tend to perform better here, with smaller drawdowns and stronger upside follow-through. |
| Price is below Supertrend (Seller’s Market): Short positions have the edge, while long setups become lower probability. |
As such, many traders use the Supertrend only to identify the dominant trend, then use another trigger to enter the market in the determined direction.
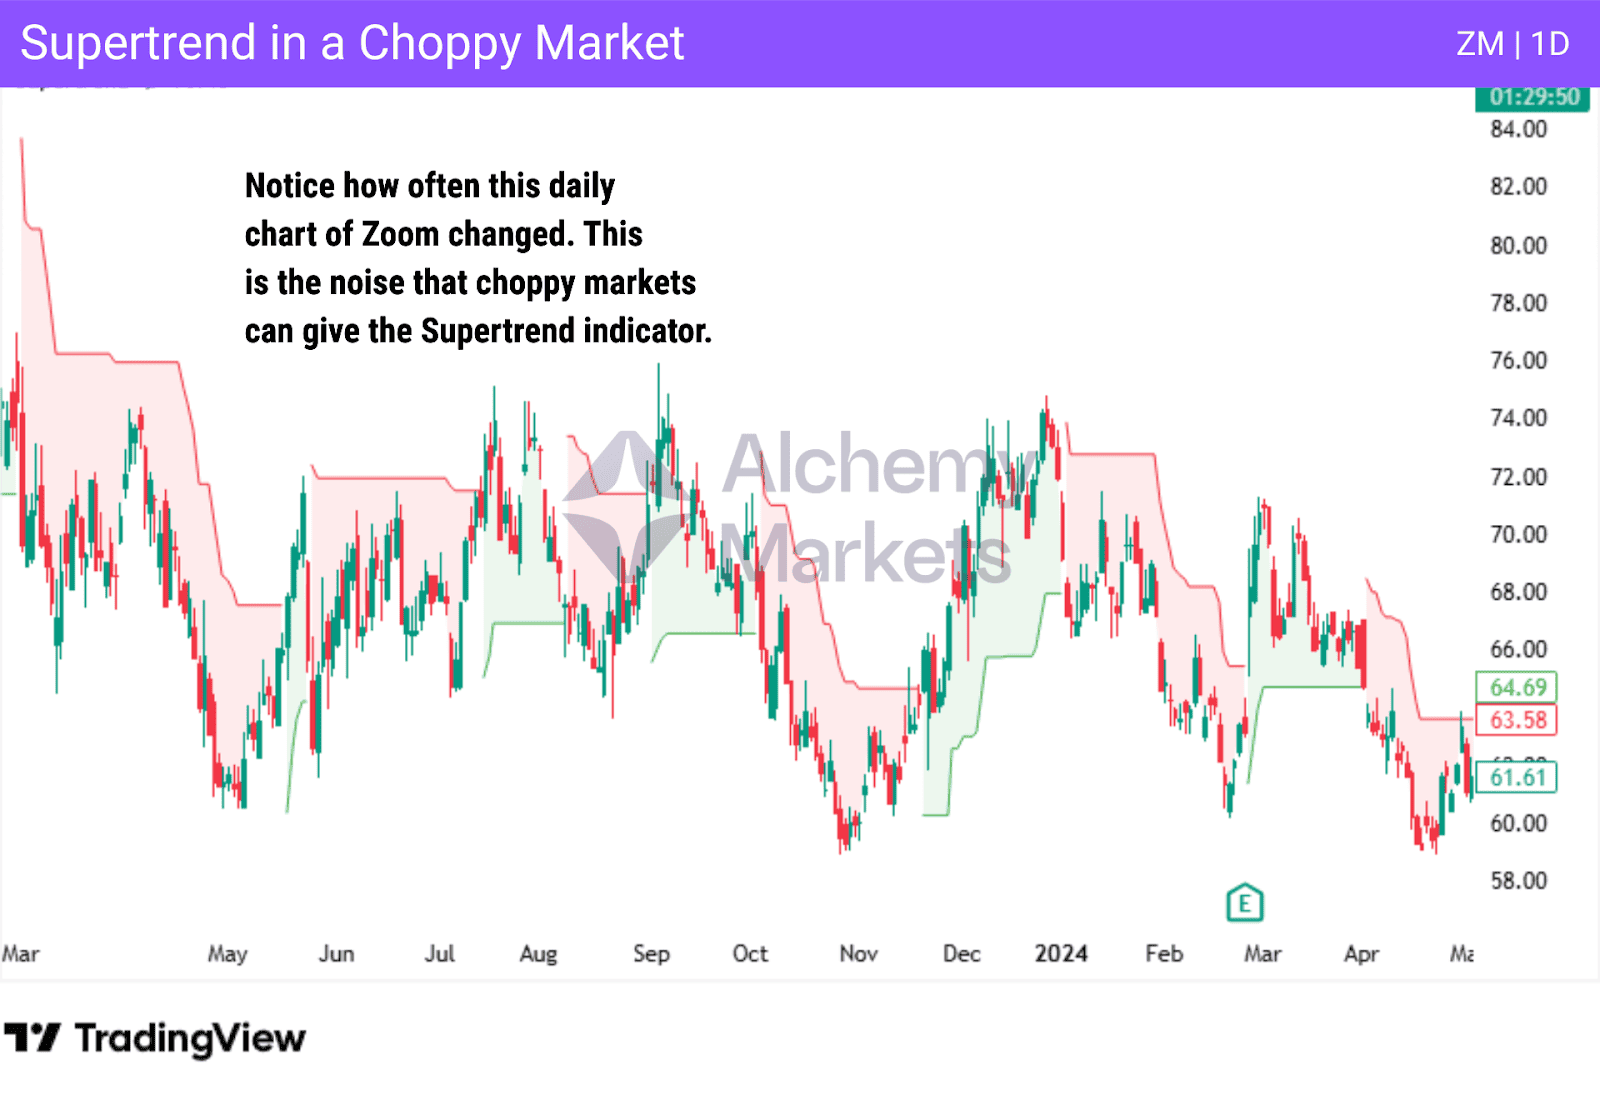
After entering a trade, some traders use the Supertrend as a trend following signal; only exiting the trade when a trend shift is detected. This can have mixed results, being extremely effective in trending markets — as one would imagine — and less effective in choppy, sideways markets.
What is the Importance of the Supertrend Indicator?
The importance of the Supertrend indicator has been steadily growing over the last several years due to its simplicity and ease of use. Additionally, this indicator fits nicely into many trading algorithms.
Here are a list of reasons why people use the Supertrend:
- Simplicity: Supertrend tends to be much simpler to use than most other indicators.
- Dynamic levels: Supertrend offers support and resistance levels in a dynamic fashion, adjusting with volatility.
- Trend identification: The indicator can help with identifying the trend. Trend detection is one of the first things a trader can see using it.
- Volatility: By including the ATR in the formula, it allows the indicator to adjust for volatility in markets, allowing it to be used almost anywhere.
- Risk management: Supertrend indicators offer clear trend detection, as well as upper and lower bands, showing the trader where entry and exit signals may occur.
- Any timeframe: Supertrend indicators can be used with any timeframe.
- Confirmation: The Supertrend indicator can be used as confirmation in other technical indicators.
How to Calculate the Supertrend Indicator
The Supertrend is built using the Average True Range (ATR), which measures market volatility.
ATR measures how much price normally moves over a given number of bars, most commonly 10 or 14. The Supertrend uses this volatility value to decide how far its trend line should sit away from price.
Because the distance is volatility-based, the Supertrend doesn’t flip direction on small price noise. A trend shift is only triggered when price moves beyond a predefined volatility threshold.
For example, if the ATR shows that price typically moves $2, and the Supertrend uses a multiplier of 2, price must move $4 before the indicator flips direction. Until that threshold is breached, the trend remains unchanged.
With that logic in place, let’s break down how the Supertrend formula is actually calculated using ATR.
Supertrend Indicator Formula
Once the ATR is calculated, the Supertrend uses it to create a volatility-based threshold around price. This threshold is what determines whether the indicator remains in the current trend or flips direction.
Instead of thinking in terms of “upper” and “lower” bands, it is easier to understand the Supertrend by how it behaves relative to price.
If price is above the Supertrend (Bullish):
The indicator assumes the market is in an uptrend, and presents an active line below the price.
The distance between the price and this lower line is calculated via:
| Basic Lower Band = (High + Low) / 2 − (Multiplier × ATR) |
Here, Supertrend acts as a dynamic support level. As long as price remains above it, the Supertrend stays bullish.
If price is below the Supertrend (Bearish):
The indicator assumes the market is in a downtrend, and presents an active line above the price.
The distance between the price and this upper line is calculated via:
| Basic Upper Band = (High + Low) / 2 + (Multiplier × ATR) |
Here, Supertrend acts as dynamic resistance. As long as price remains below it, the Supertrend stays bearish.
Only one of these calculations is used at a time, which is why the Supertrend appears as a single line on the chart. When price closes beyond the active line, the Supertrend flips and recalculates using the opposite condition, signalling a potential change in trend.
This price-relative logic explains why the Supertrend works best in trending markets and tends to produce false flips in sideways or low-volatility conditions.
Supertrend Indicator Example
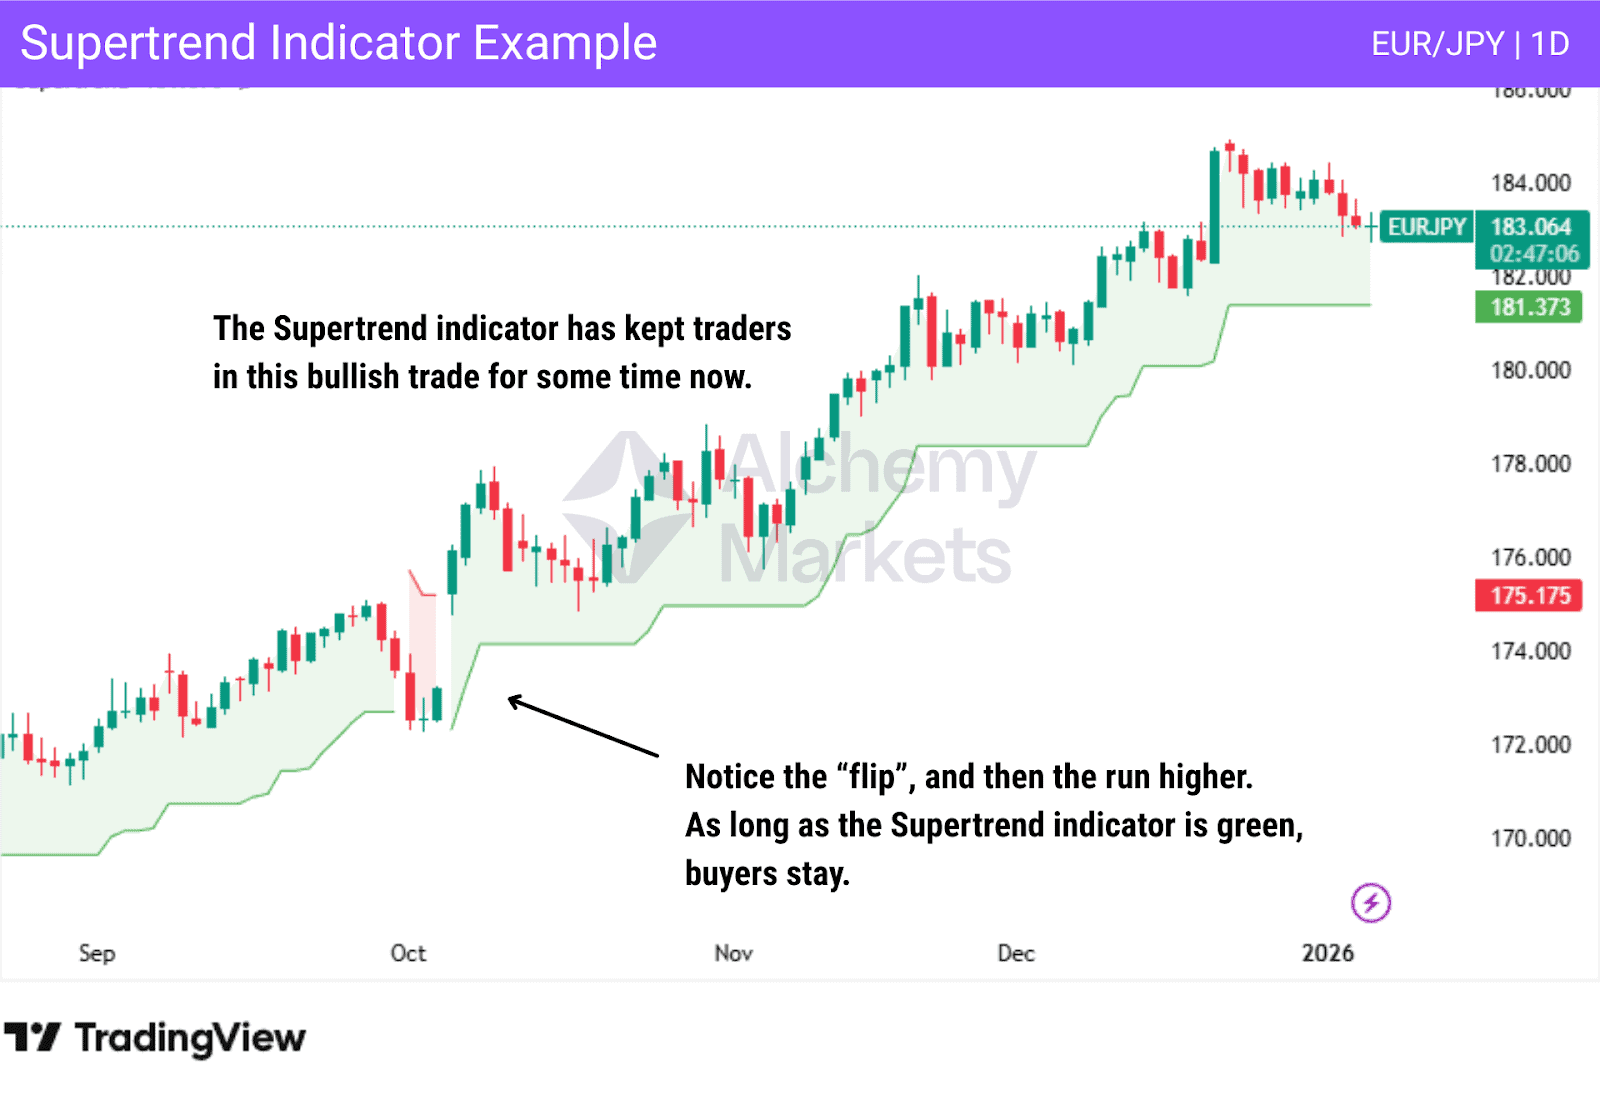
The Supertrend indicator is used to catch the trend, as it turned green, suggesting bullish behavior. The gap was also important, as it shows buying pressure, and the trader could have held onto this long position until the indicator changed to red, suggesting sellers entering the market.
Supertrend Indicator Trading Strategies
The Supertrend indicator strategy isn’t typically used with just the Supertrend indicator.
Most traders will attach another indicator to their strategy to find confirmation of the Supertrend signal. Below are some of the most common variations:
Supertrend Indicator with EMA Crossover
A common way traders love to execute positions in the market is by looking at EMA (Exponential Moving Average) crosses.
This is when a faster EMA (shorter length) visually crosses above or under a slower EMA (longer length). It signifies a shift in short term momentum, and hints at a potentially large move.
How you pair this with the Supertrend would be as follows:
- Only trade EMA cross ups IF the Supertrend is green.
- Only trade EMA cross downs IF the Supertrend is red.
- Should the Supertrend flip bias, or the EMA crosses in the opposite direction of the bias, exit the trade.
As demonstrated in the example below, this can be a very simple yet effective strategy, given that you apply the suitable settings to an asset and timeframe.
Below, we have EMA 20 and 50, with Supertrend ATR 20 x 3 on AUDJPY (1D):
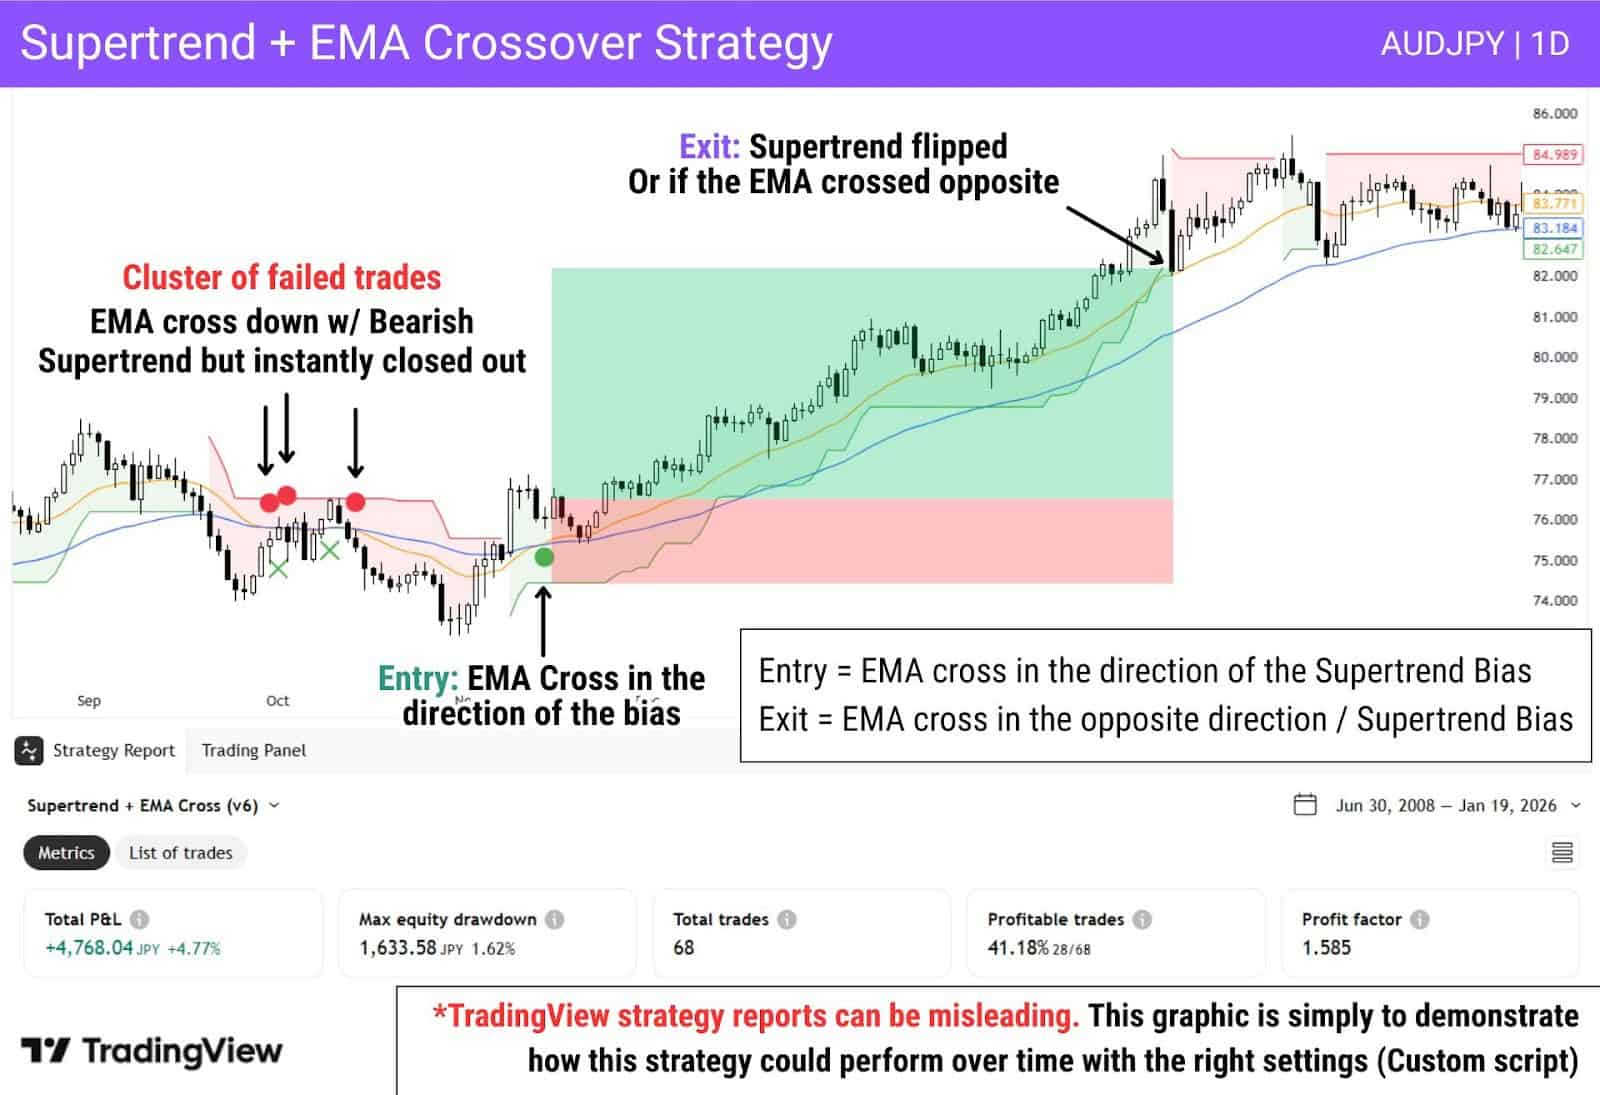
| *The test above covers the period from 30 June 2008 to 19 January 2026 and assumes zero commissions. Alchemy Markets offers commission-free trading on FX, metals, and indices. |
Notice how not every single signal — not even the majority — in this example generates a win. And that’s okay.
The purpose of this chart in particular is to show you that signal accuracy may not be the best, even with multiple indicators in Supertrend setups.
However, it’s about the final generated report after a series of trades. And here, the Supertrend EMA Cross strategy performs well despite having a 41.18% win rate, as profits from the wins overshadows the losses.
Supertrend Indicator with RSI
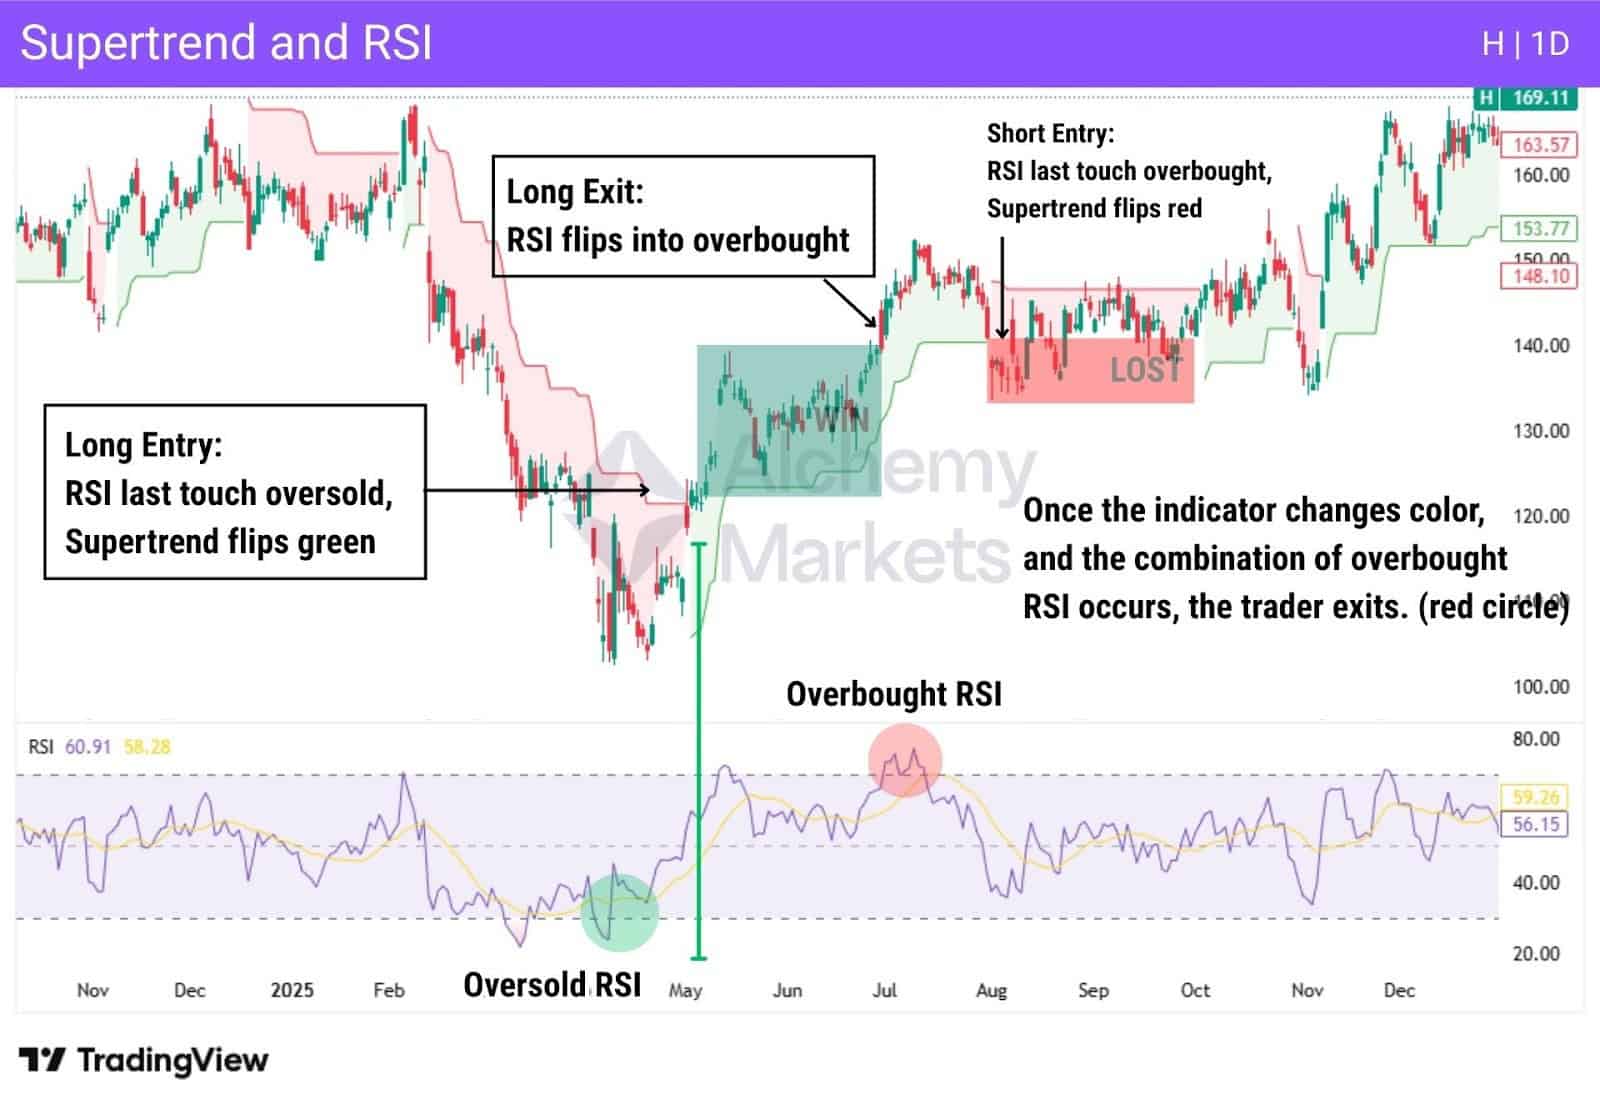
The Relative Strength Index is a popular indicator that measures price momentum. Notably, it can signal when price has moved too far, too quickly. There are two signals:
- Overbought (Short Bias): Price has moved too high, too quickly – it may begin to drop.
- Oversold (Long Bias): Price has moved too low, too quickly – it may begin to rise.
Traders can use these overbought/oversold signals to validate whether or not Supertrend flip signals are “healthy”; in that price hasn’t already exhausted its movement and has room to go.
In the example above, one could identify where the RSI last touched, then based on that, take a trade if the Supertrend flips in the same bias direction. So in short, use the RSI as the trend bias and the supertrend as the entry signal(s).
Supertrend Indicator with MACD
The MACD (Moving Average Convergence Divergence) is an indicator which measures the momentum of a market.
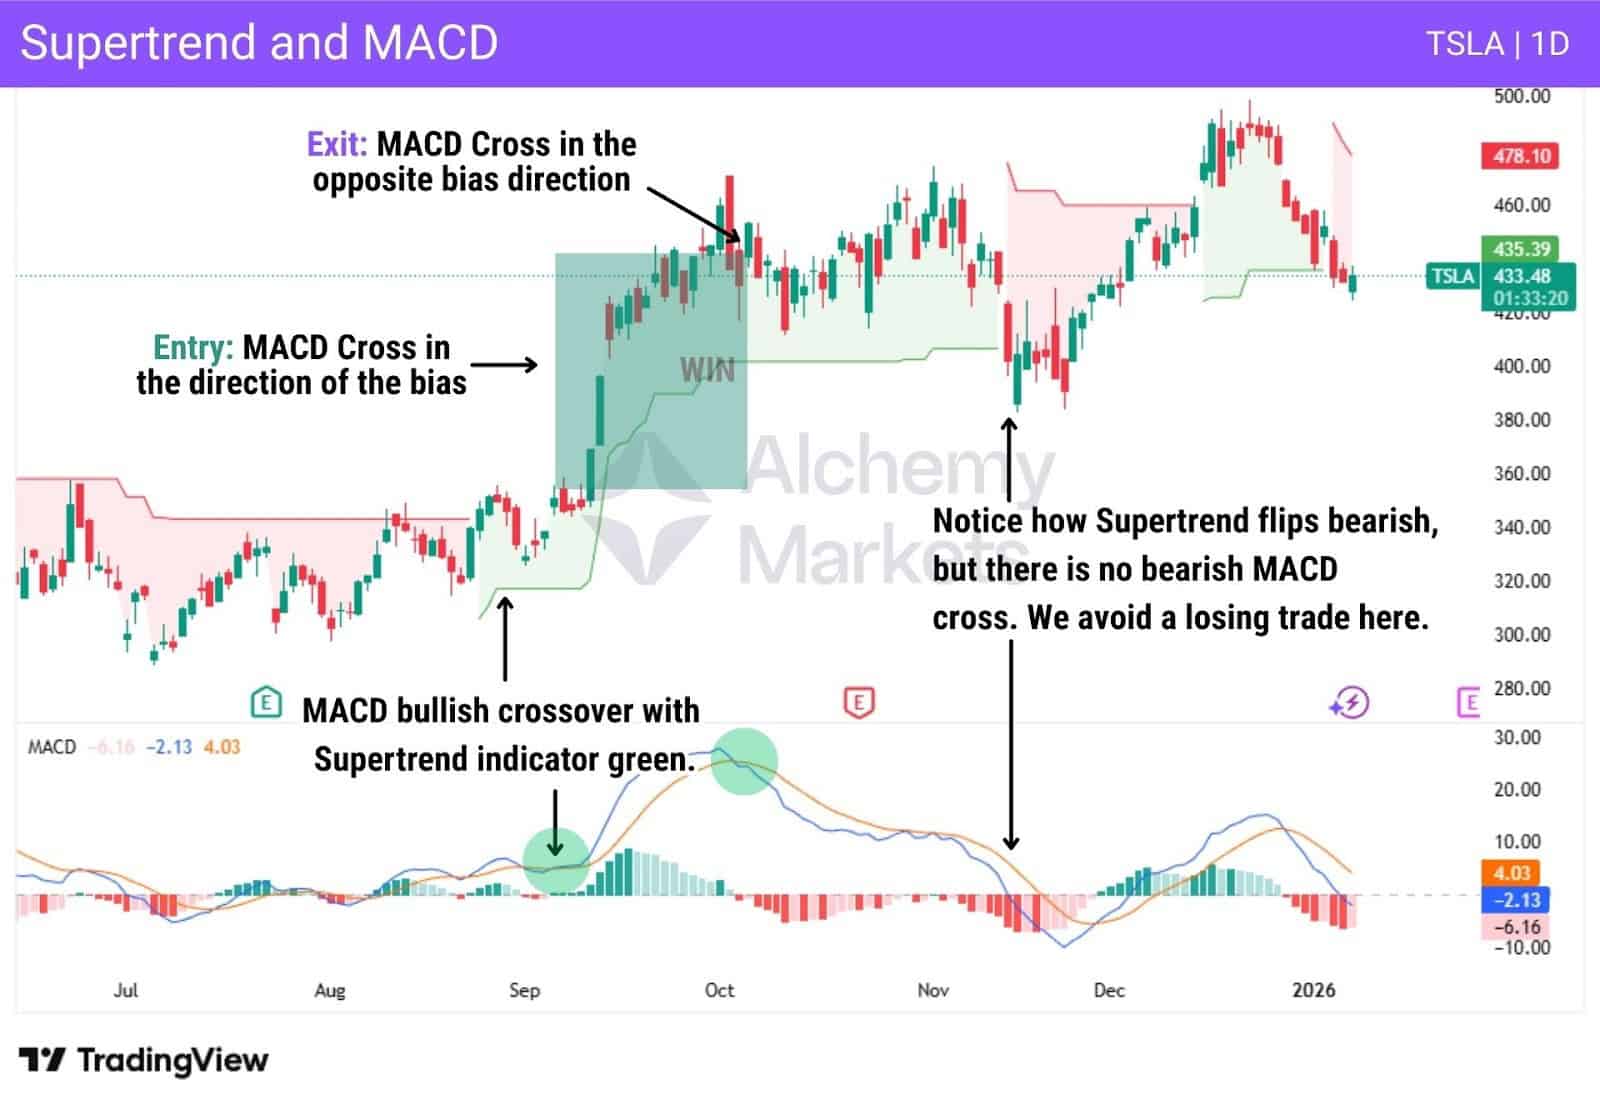
This setup works like the EMA crossover strategy, but instead of using price-based averages alone, it uses the MACD lines to confirm momentum. Supertrend sets the directional bias. MACD provides the entry and exit trigger.
Trades are only taken when a MACD crossover occurs in the direction of the Supertrend bias, and positions are exited when MACD crosses back against that bias.
- Buy: MACD crosses up and price is above the Supertrend (or MACD holds above zero).
- Sell: MACD crosses down and price is below the Supertrend (or MACD holds below zero).
The key advantage is filtering. As shown above, even when Supertrend briefly flips bearish, the absence of a bearish MACD cross keeps traders out of a low-quality trade.
Using trend bias and momentum together helps avoid false signals that often appear when relying on a single indicator.
Supertrend Indicator with Fibonacci Retracement
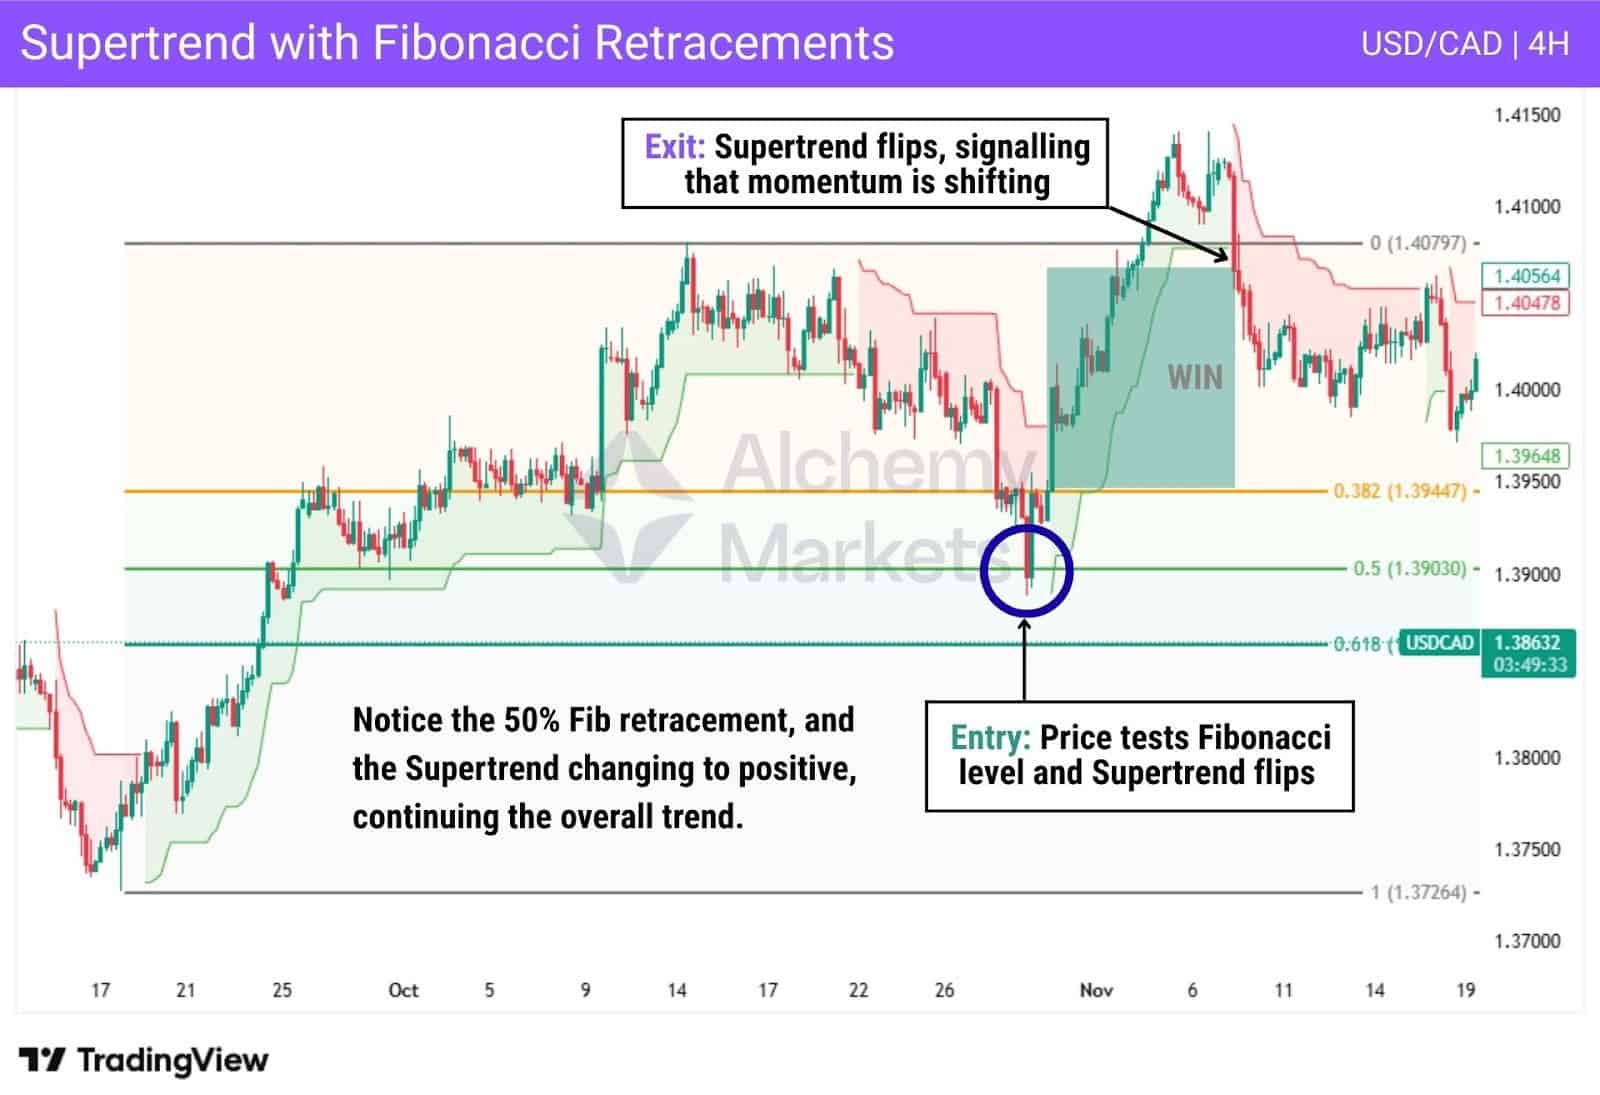
This setup combines the Supertrend indicator with Fibonacci retracement levels to add structural confirmation to the trend.
Supertrend defines the directional bias, while Fibonacci highlights where pullbacks are more likely to find support or resistance within that trend.
Trades are only considered when price retraces into a key Fibonacci level and the Supertrend flips back in the direction of the prevailing bias, signalling that momentum is resuming.
- Buy: If the price bounces at a bullish Fib, and the Supertrend flips bullish, enter a long.
- Sell: If the price rejects at a bearish Fib, and the Supertrend flips bearish, enter a short.
- Exit: Supertrend flips in the opposite direction of your trade.
The key advantage is confluence. Fibonacci identifies high-probability reaction zones, while Supertrend confirms when momentum has actually turned. Using both together helps traders avoid chasing price and instead enter on pullbacks that align with the broader trend.
Supertrend Indicator with Stochastic Oscillator

The Stochastic Oscillator can be paired with the Supertrend’s directional bias to identify favourable conditions for short-term reversals that align with the broader trend.
When the Stochastic Oscillator produces a crossover in overbought or oversold territory, it signals that buying or selling pressure may have temporarily peaked.
On its own, this is not an entry signal. Instead, it acts as a timing filter, highlighting moments where it makes sense to start hunting for setups in the direction of the prevailing trend.
Supertrend Indicator with Average Directional Index
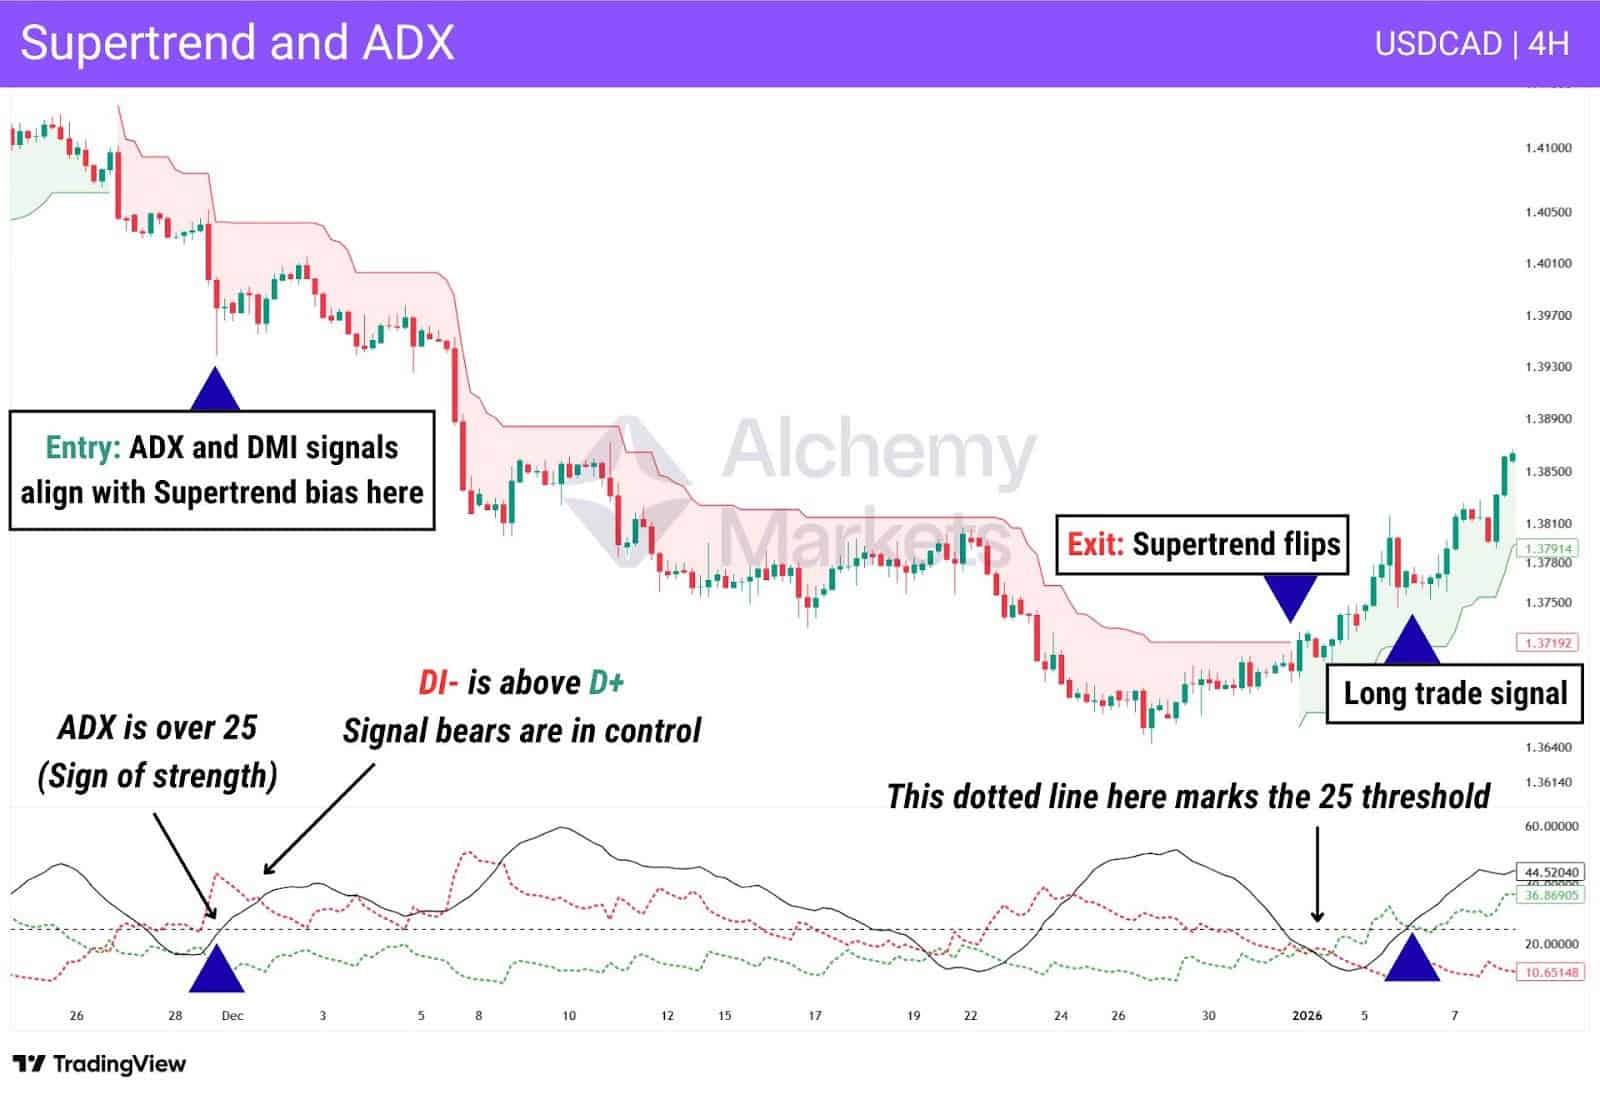
Some traders combine the Supertrend with the Average Directional Index (ADX) and Directional Movement Index (DMI) to gauge trend strength, not just direction.
The ADX measures how strong a move is, regardless of whether price is moving up or down. The DMI lines then show who is in control:
- DI+ (green) signals bullish pressure
- DI− (red) signals bearish pressure
A commonly used benchmark is the 25 ADX level. When ADX rises above 25, it suggests the market is transitioning from range-bound behaviour into a stronger, more directional move.
When this strength signal aligns with direction, it becomes more actionable. For example:
- ADX above 25 confirms momentum
- DI− above DI+ confirms bearish control
- Supertrend is bearish, reinforcing downside bias
When all three point the same way, traders may look for entries in the direction of the Supertrend, while using a Supertrend flip as a potential exit signal.
In short, Supertrend defines the bias, ADX confirms whether the move has enough strength, and the DI lines clarify which side is in control.
Supertrend Indicator with Bollinger Bands®
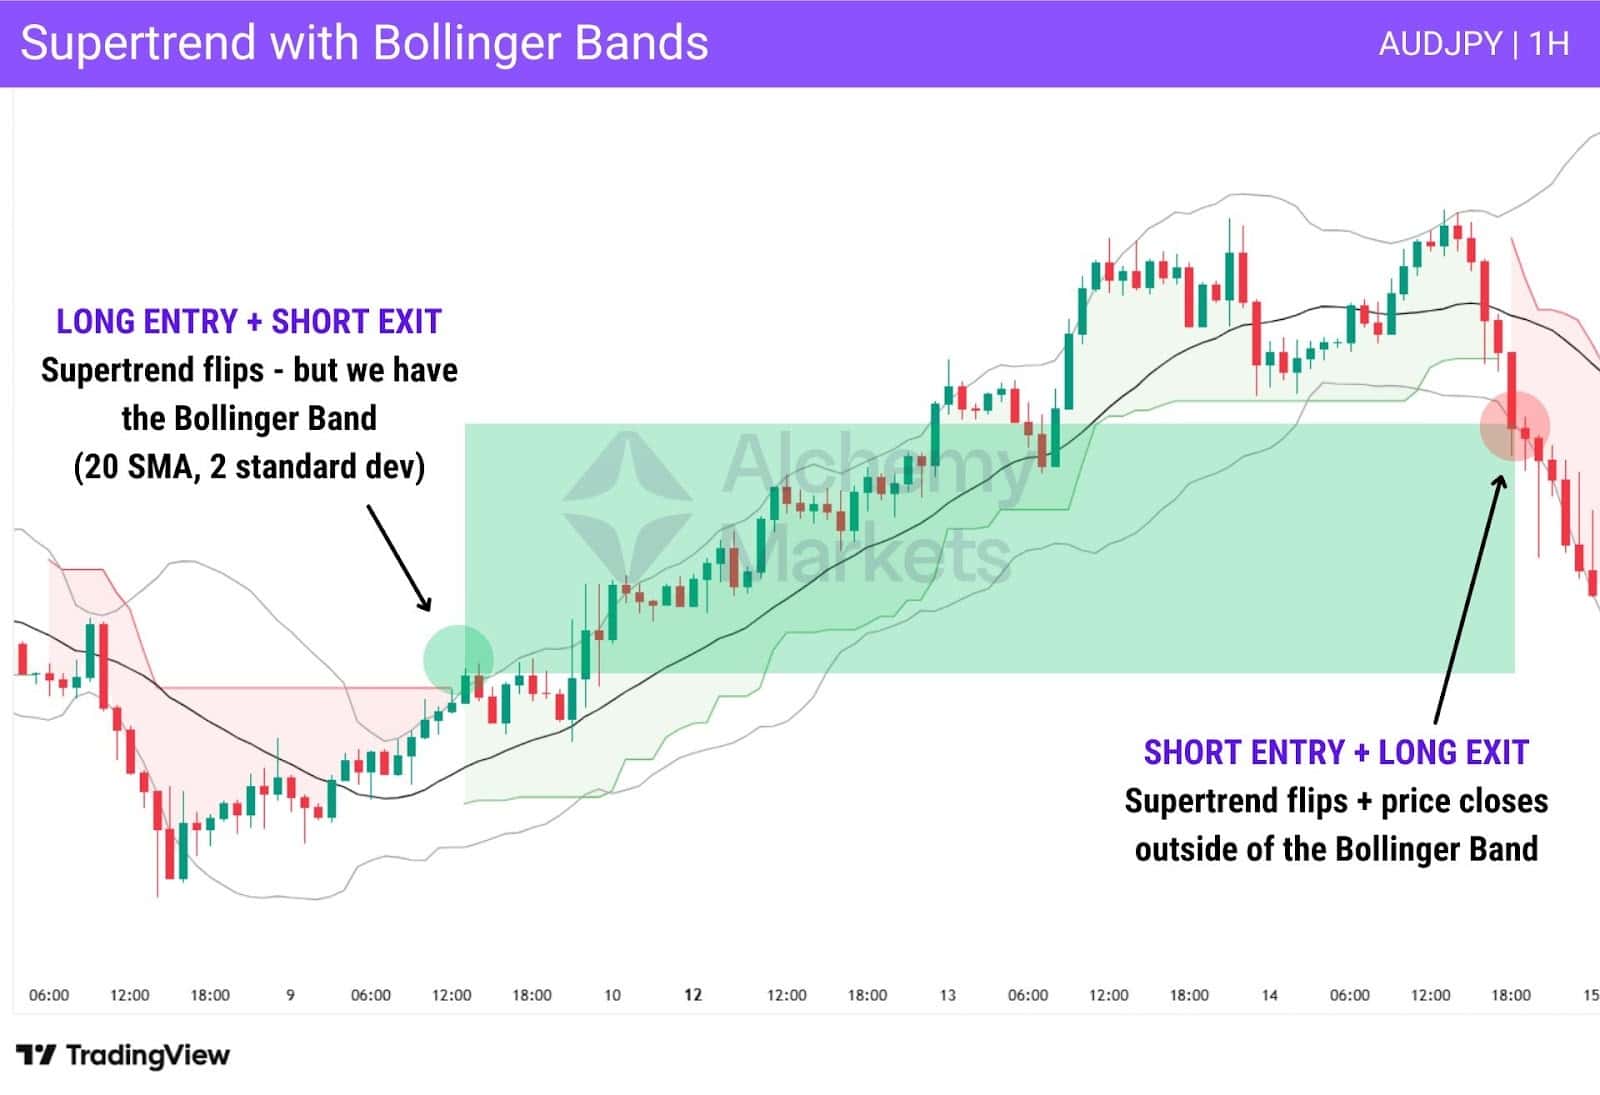
On their own, Bollinger Bands are typically used as a mean-reversion tool. When price stretches to the outer band, it signals short-term exhaustion, increasing the odds of a pullback back toward the mean.
The problem is that in strong trends, price can ride the band for far longer than expected.
That’s where most traders get shaken out early.
By introducing the Supertrend, the role of the Bollinger Bands changes. Instead of treating touches of the outer band as immediate exit signals, the Supertrend acts as a trend filter.
As long as the Supertrend remains aligned with the position, Bollinger Band extensions are treated as continuation, not reversal. The mechanics of this combination are as below:
- Bollinger Bands highlight short-term extremes
- Supertrend decides whether those extremes are tradable pullbacks or trend continuation
This allows traders to stay in winning trades longer, because exits now require both:
- a Supertrend flip, and
- a decisive Bollinger Band expansion or failure.
The result is a hybrid approach: mean reversion logic for timing, combined with trend-following logic for holding. In other words, Bollinger Bands help you enter better, while the Supertrend helps you exit later.
Supertrend Indicator with Ichimoku Cloud
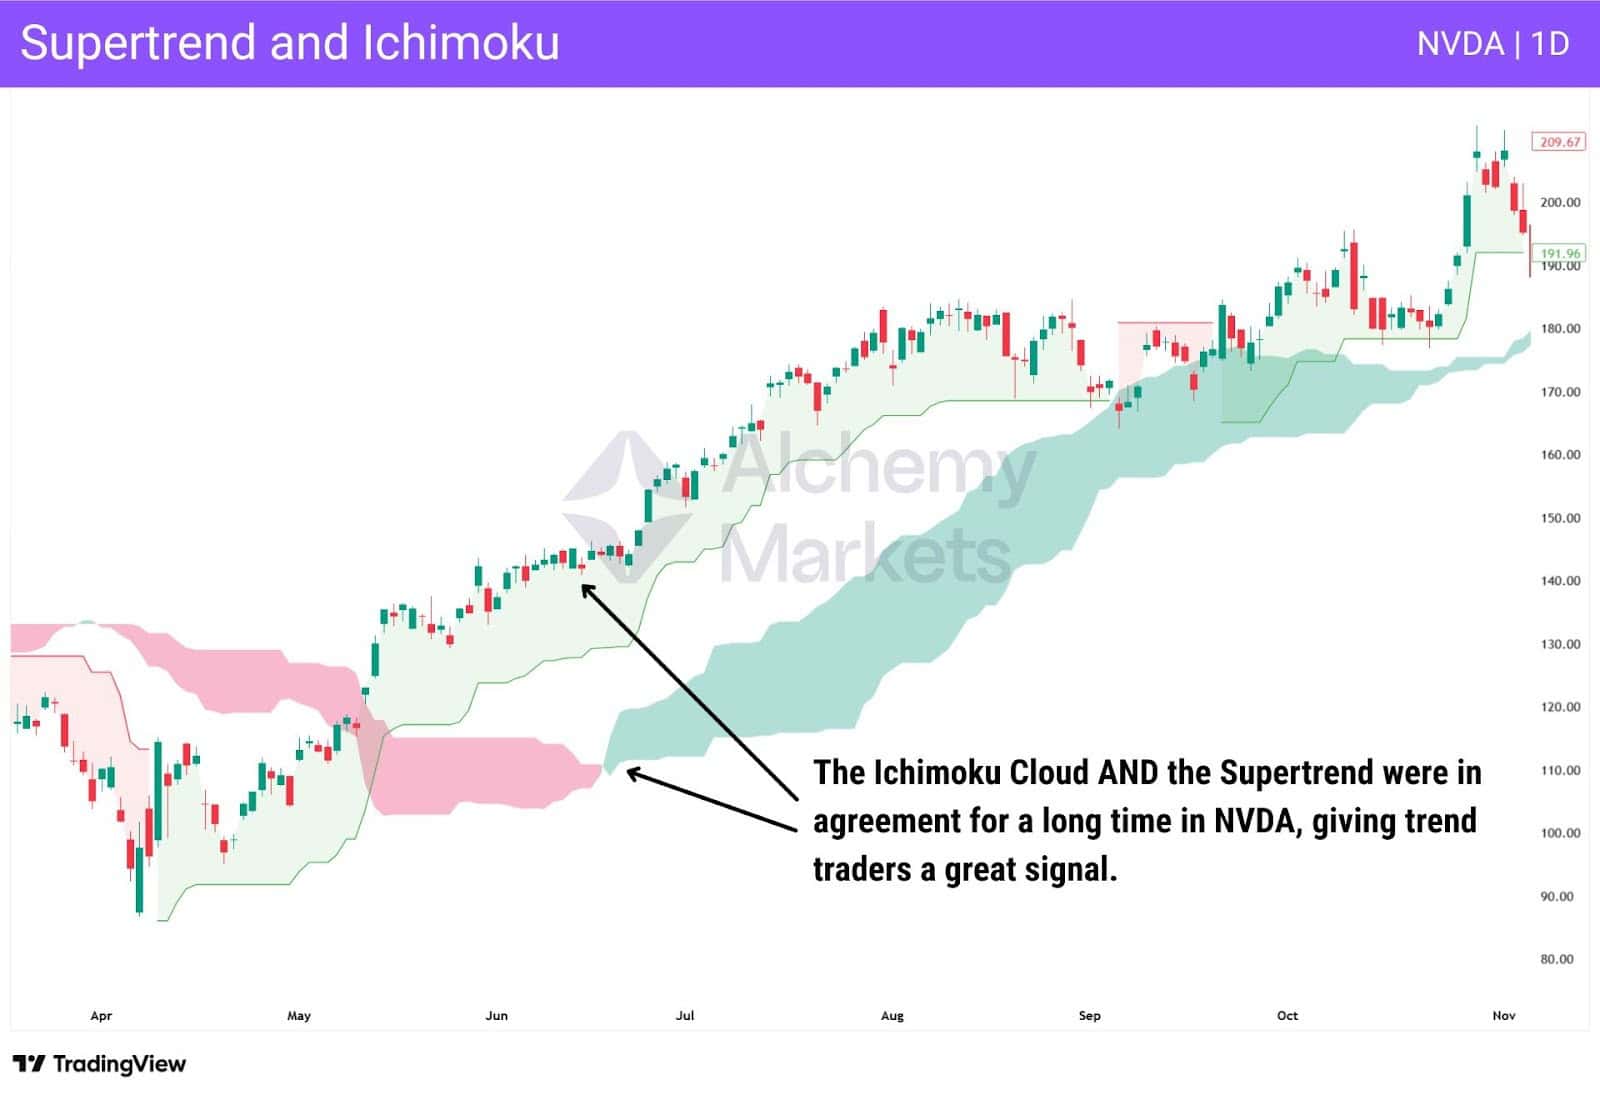
While the Ichimoku Cloud indicator isn’t as popular in the West, there are some traders who watch it closely. By having the Supertrend indicator line up with what the Ichimoku Cloud is telling you, it confirms momentum and trend overall. This isn’t as common, but it is a method of trading that you can use.
One common complaint about using the Ichimoku is that the price action can be a bit obscured, so make sure you understand the indicator before attempting to put the Supertrend on it. That being said, those who use Ichimoku tend to be very loyal to it.
Supertrend with Support and Resistance Levels
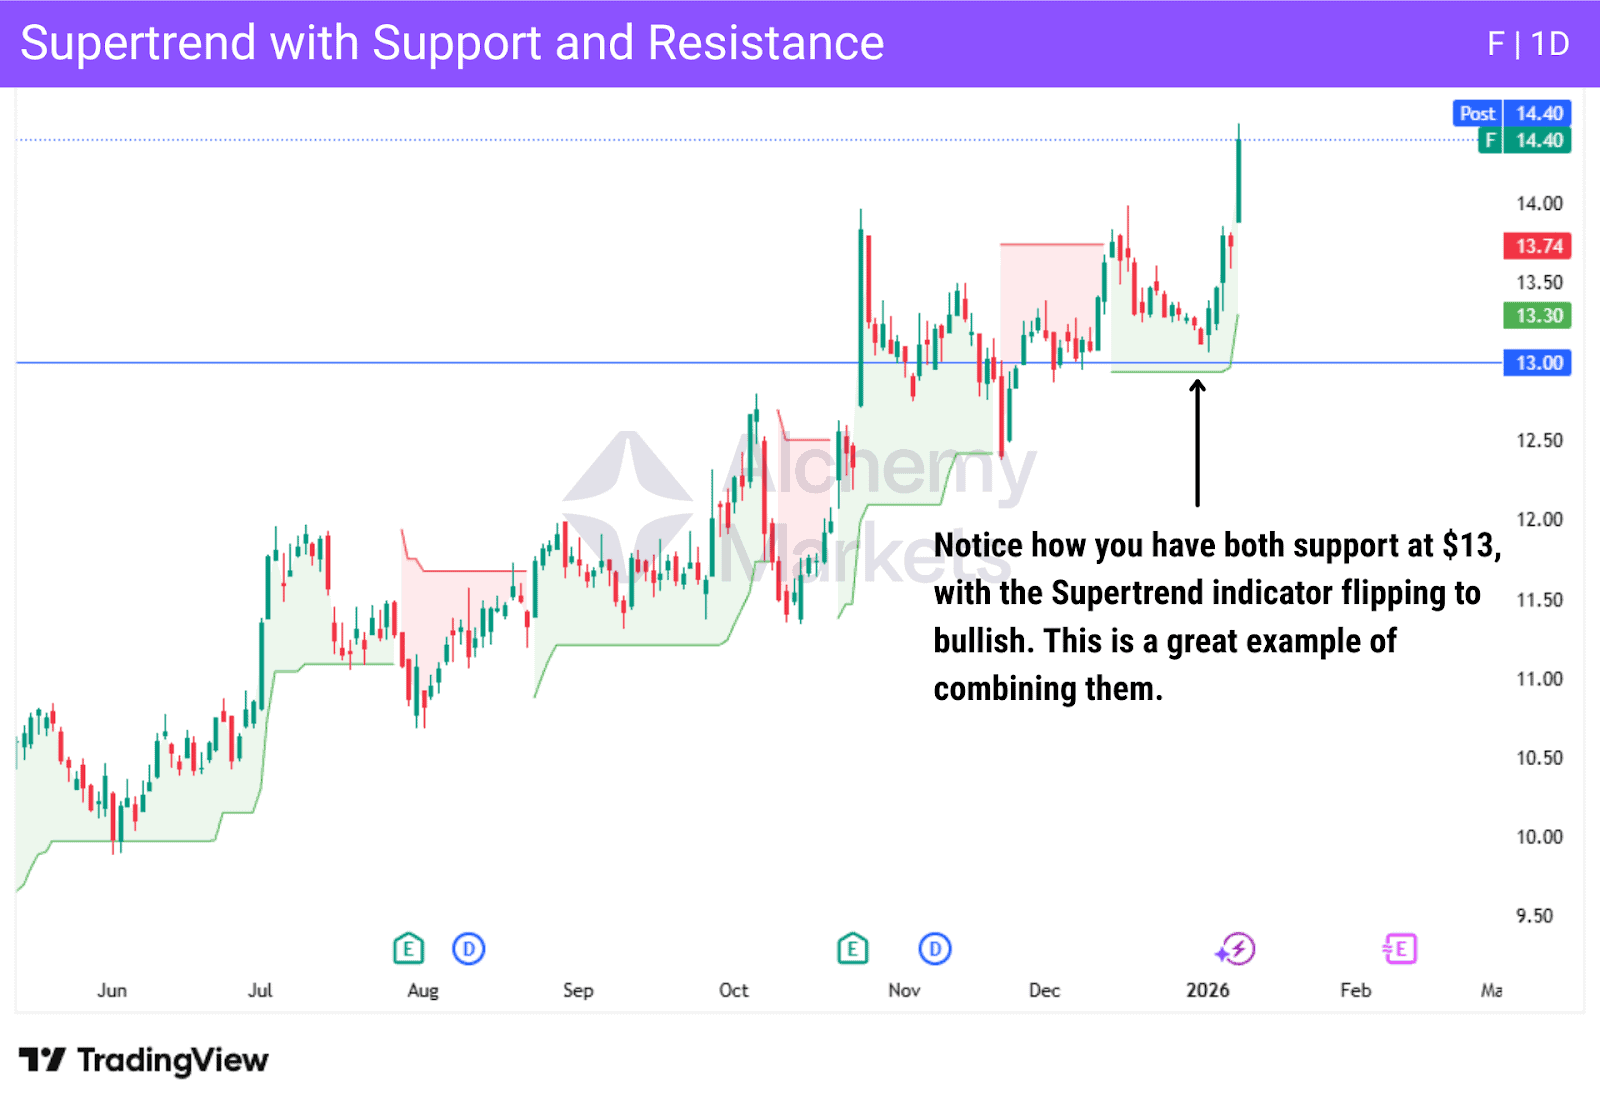
The most basic way to use the Supertrend indicator with another influence would be the use of support and resistance.
This makes sense, as the support and resistance levels on a chart are the most basic areas of importance for technical analysis.
In fact, as support and resistance is typically where the average trading strategy starts, this makes combining the Supertrend and those levels a natural choice.
Even the most fundamentally driven traders will understand where the support or resistance in a market sits.
Supertrend Breakout
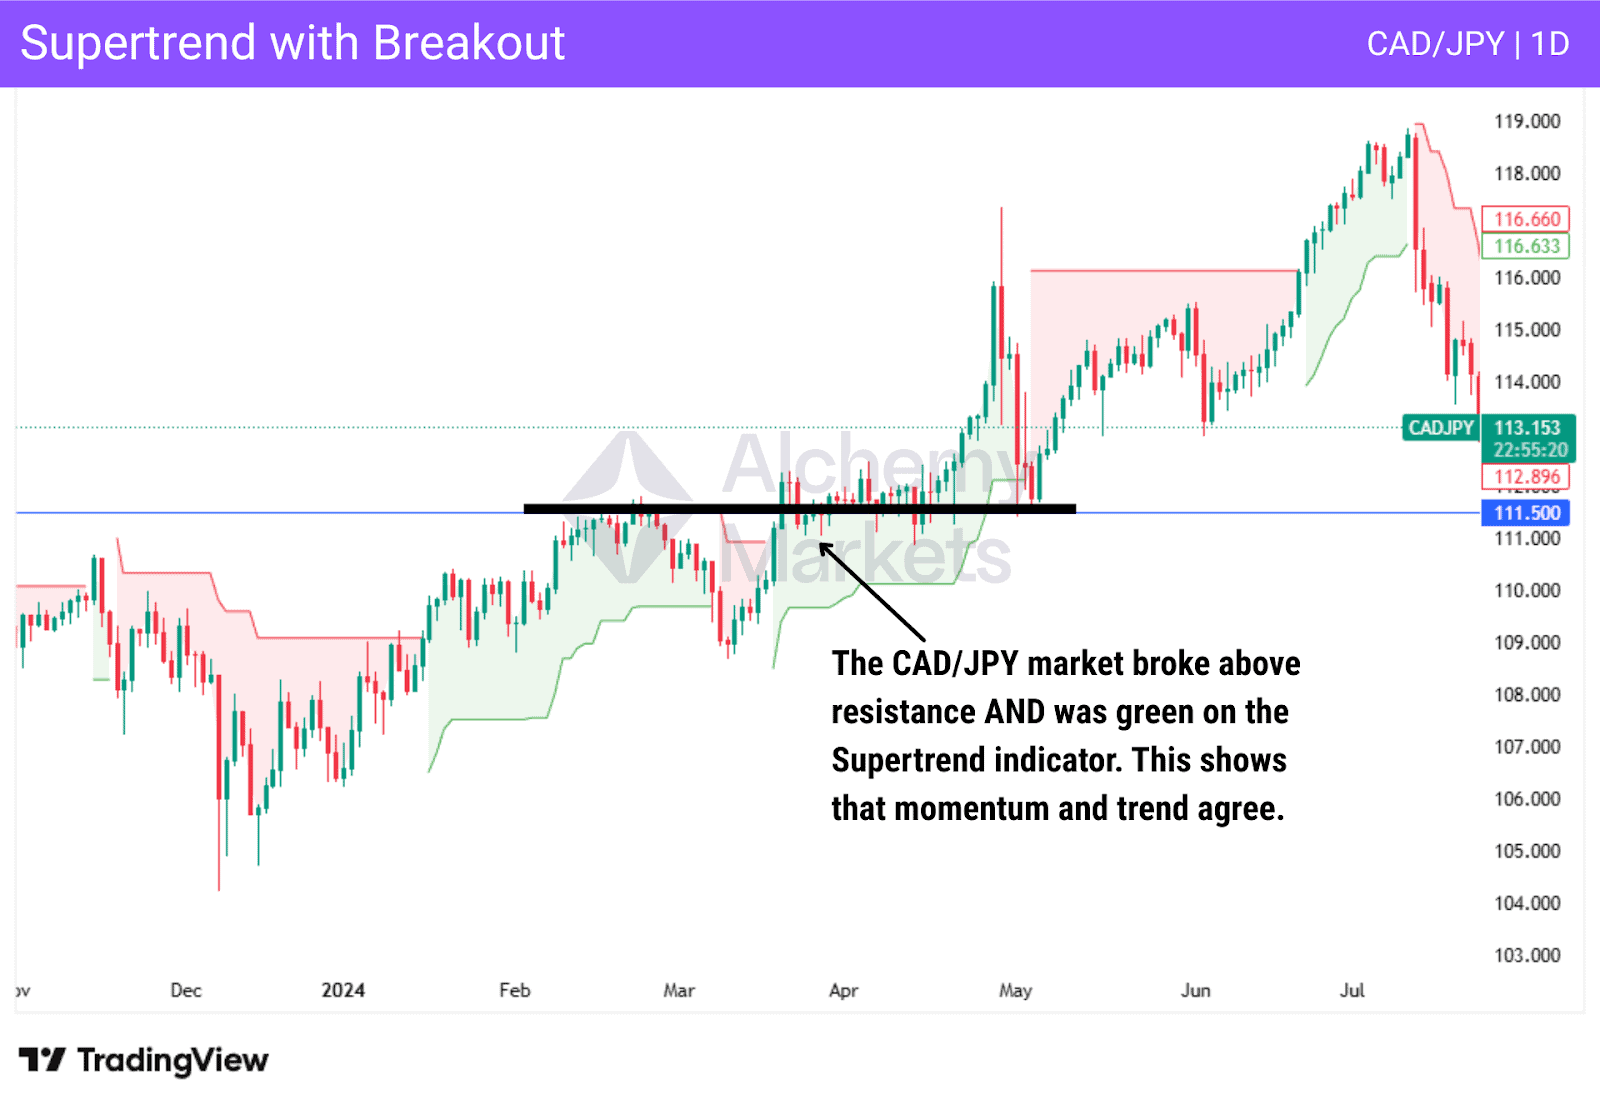
The Supertrend Breakout strategy is fairly simple and one that a lot of traders will be comfortable with.
In this scenario, traders will take a trade once we make a new high in the case of buyers, or a new low in the case of sellers.
This allows traders to see pricing through the range of prices, confirming the trend, and the Supertrend indicator lining up with that is a signal that a lot of people pay attention to.
Supertrend Pullback
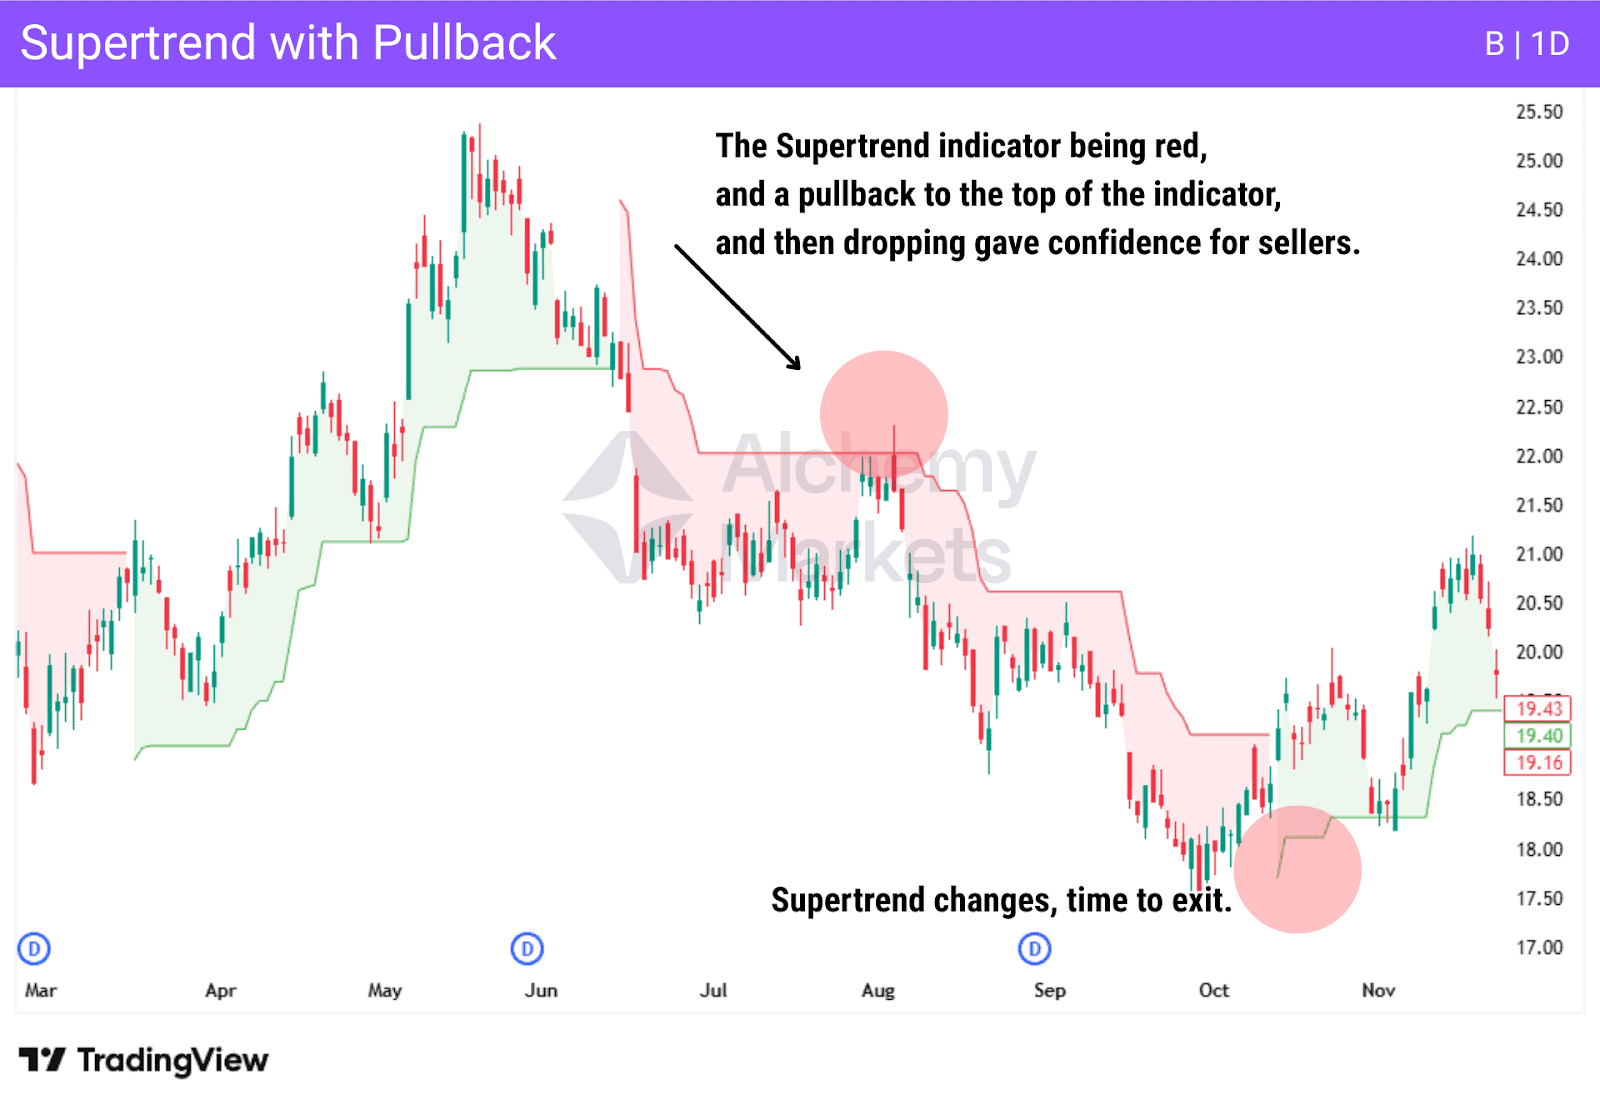
Using the Supertrend with pullbacks is very similar to using other indicators with pullbacks. The idea is that you will be in a trend, but find “value.”
This is done by waiting for a pullback that tests the indicator itself as a support or resistance zone, and then failure to break the zone acts as our entry signal.
Traders will sometimes use a trailing stop, or just wait for the Supertrend indicator to switch colors. This is also often combined with a test and rejection at the Supertrend line for those who are a bit more conservative.
Supertrend Range Breakout
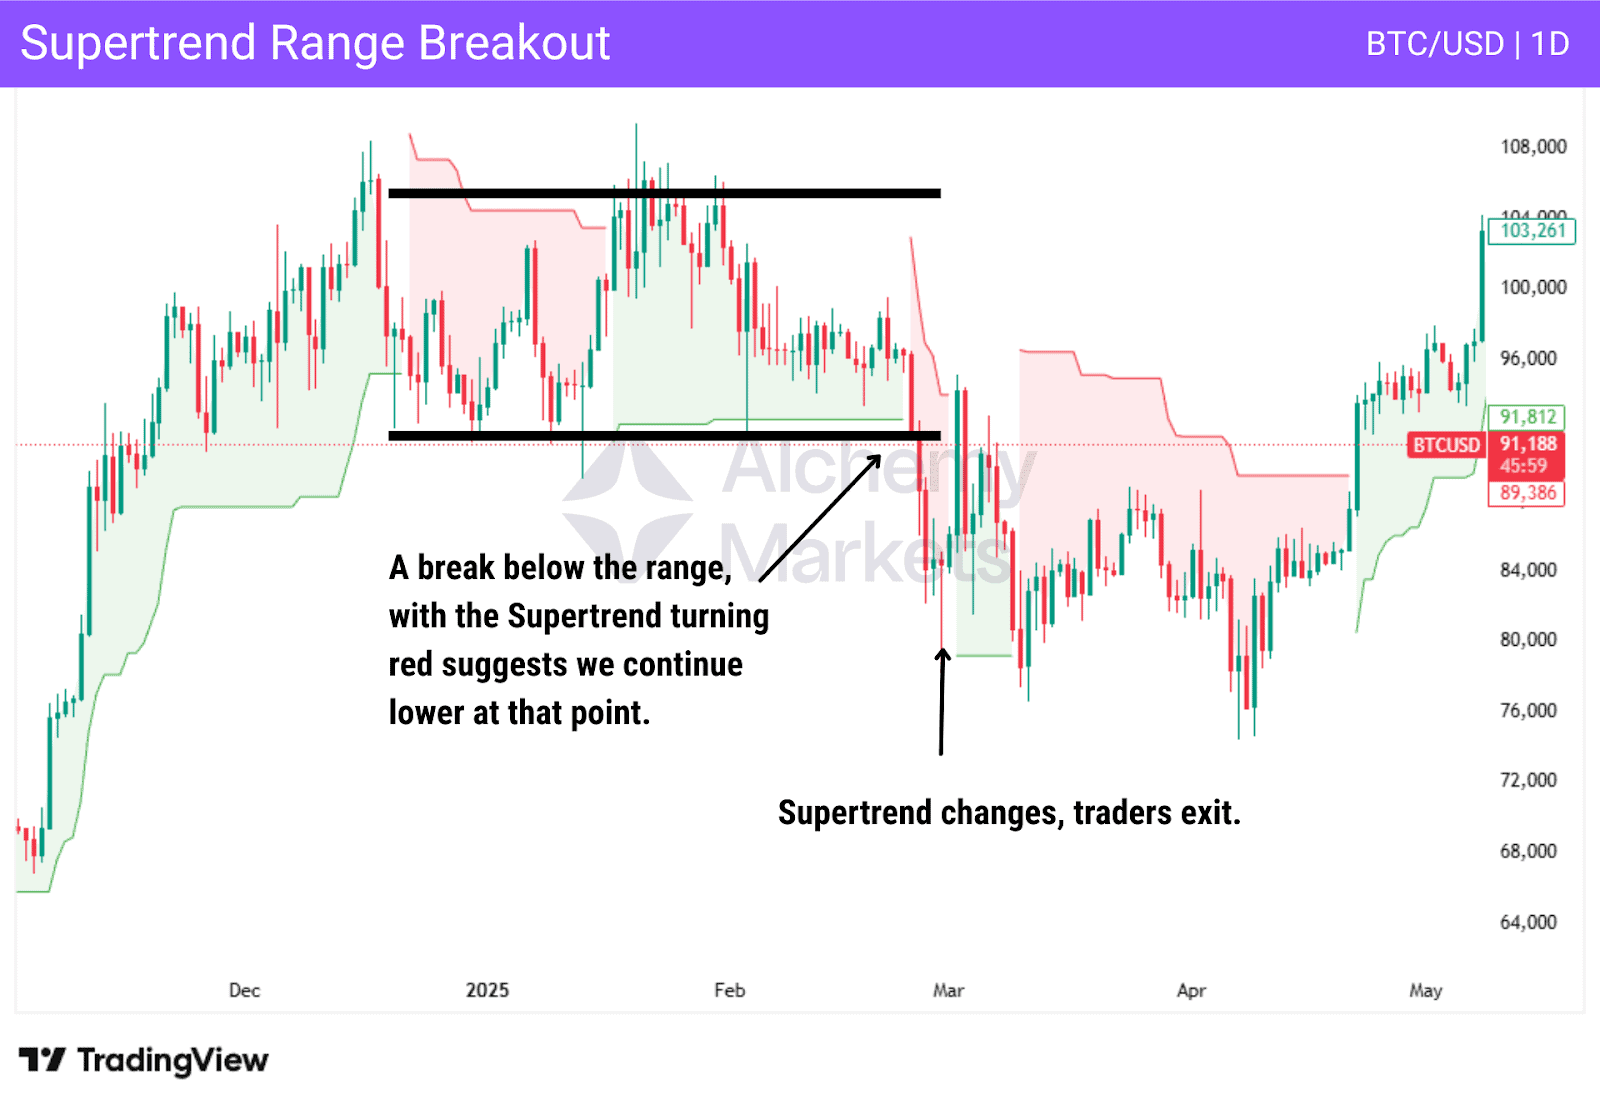
In well defined sideways markets, the Supertrend can struggle to produce reliable signals.
However, if you allow the indicator to take a backseat to the horizontal range, and instead use it to confirm a breakout, the Supertrend can help with timing your trades.
This allows traders to have more confidence in that breakout, and is a simplistic way to attempt to “get on the right side of the trade.”
Some traders will use an oscillator for confirmation as well. However, the main idea is that a major area of rejection has been broken through.
Supertrend Reversal
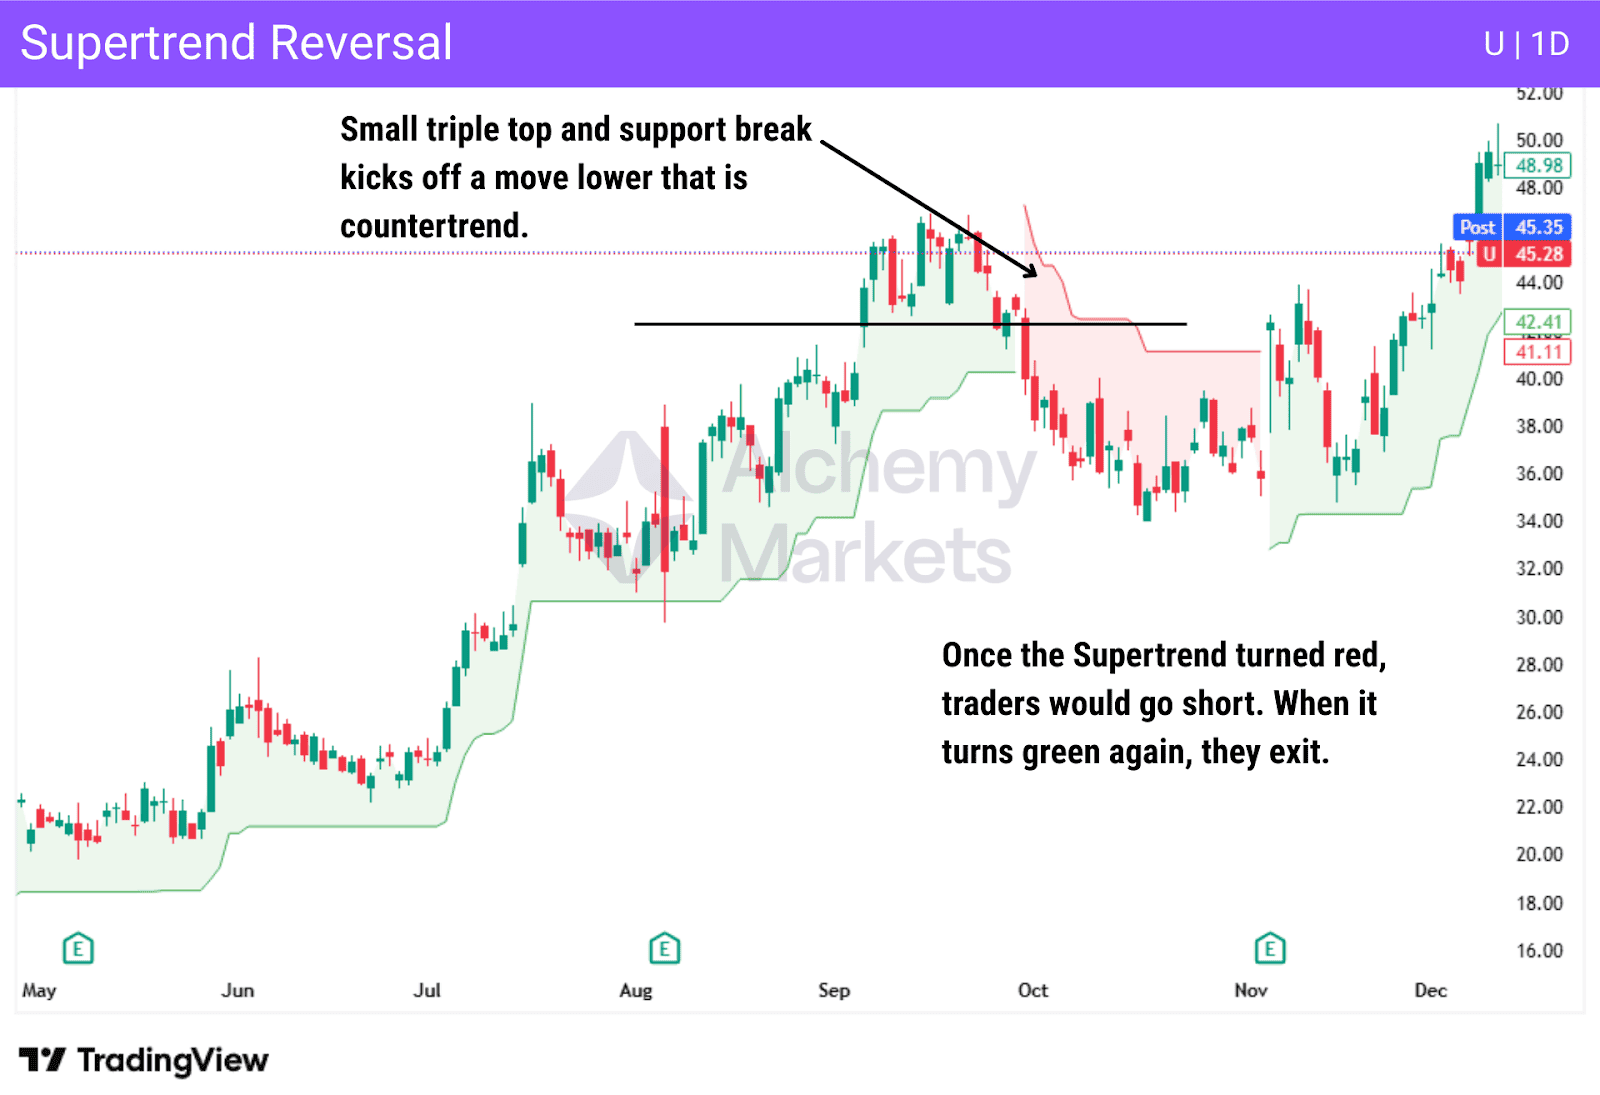
The Supertrend Reversal strategy uses the indicator to spot possible trend reversals and jump on countertrend trades.
The trader will look for candlestick patterns or chart formations that could indicate a reversal. Once the Supertrend swings in the other direction from the longer-term trend, traders will enter a countertrend trade.
Exits can be done via waiting for the Supertrend indicator switch, or perhaps a candlestick pattern to tell you when the move may be over.
Supertrend Trend Following
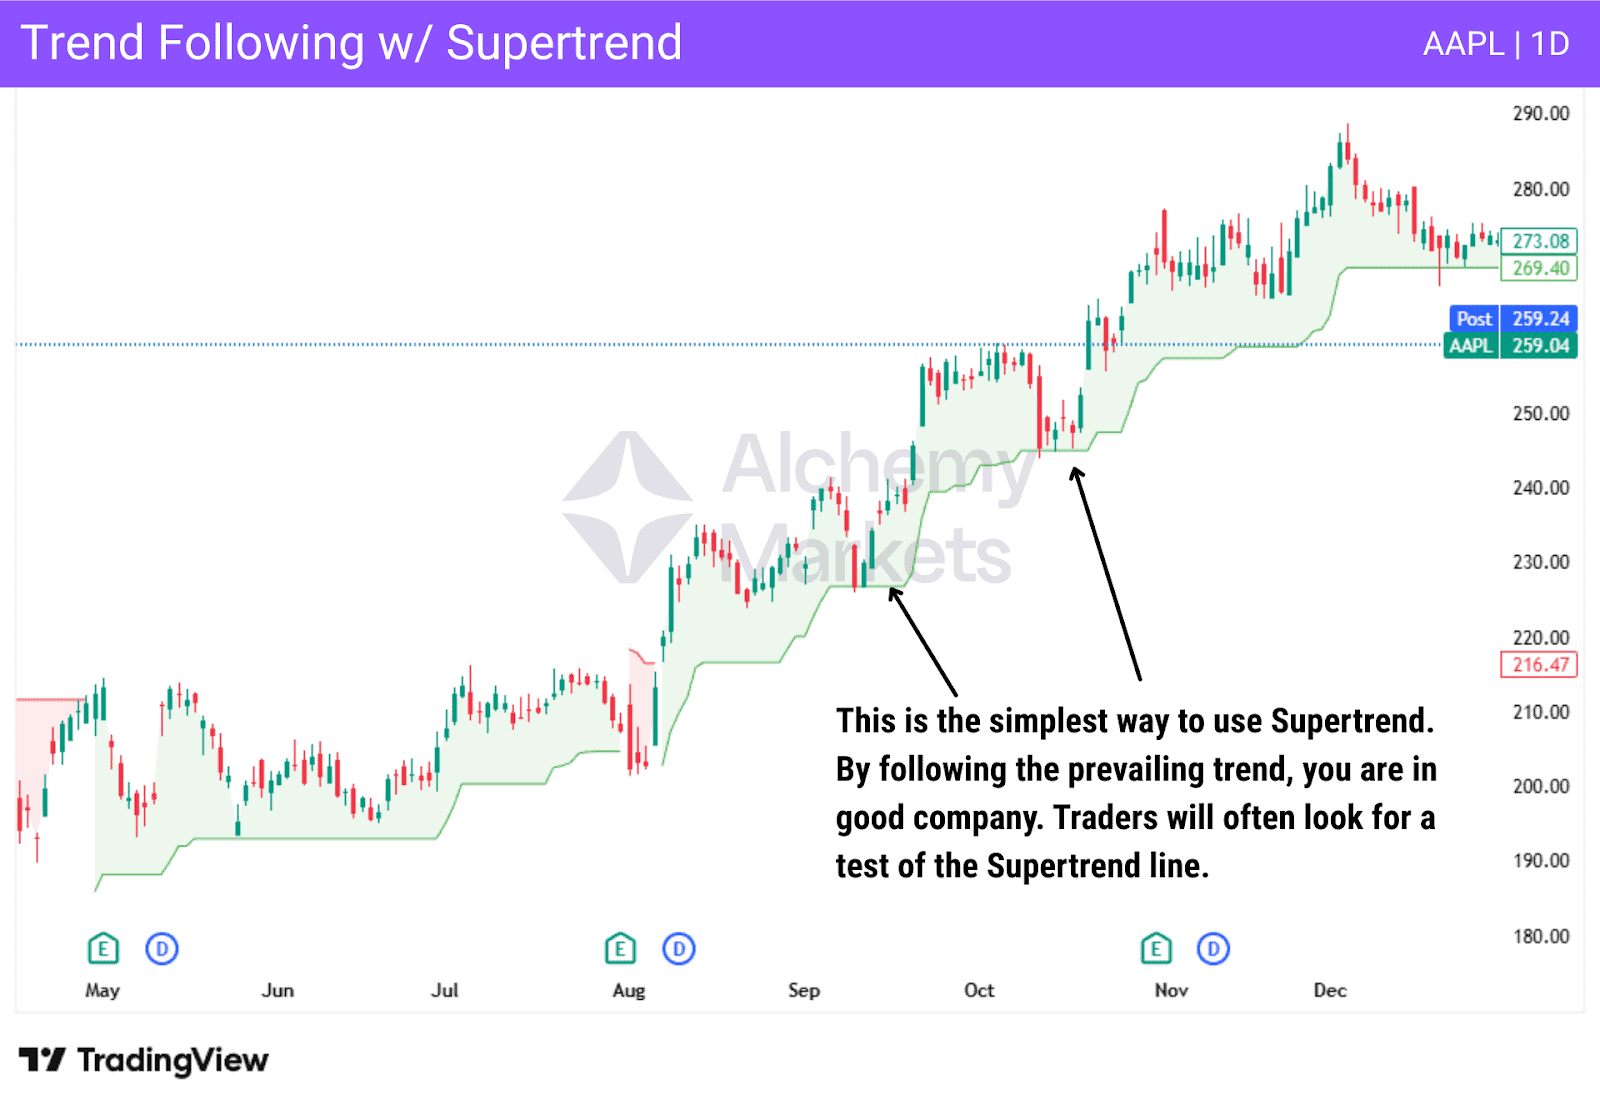
By following the overall direction of the Supertrend, traders can catch large moves over the long term, and simply hang onto the position until the Supertrend indicator changes direction. This is the easiest way to use Supertrend, and is one of the most common.
Trend following, in and of itself, is a trading strategy that is commonly employed and can be effective if you catch strong trends.
However, be aware that trend identification is crucial, and many times a trader will also use a moving average to help “pad the results” with this method.
Supertrend Breakout for Swing Trading
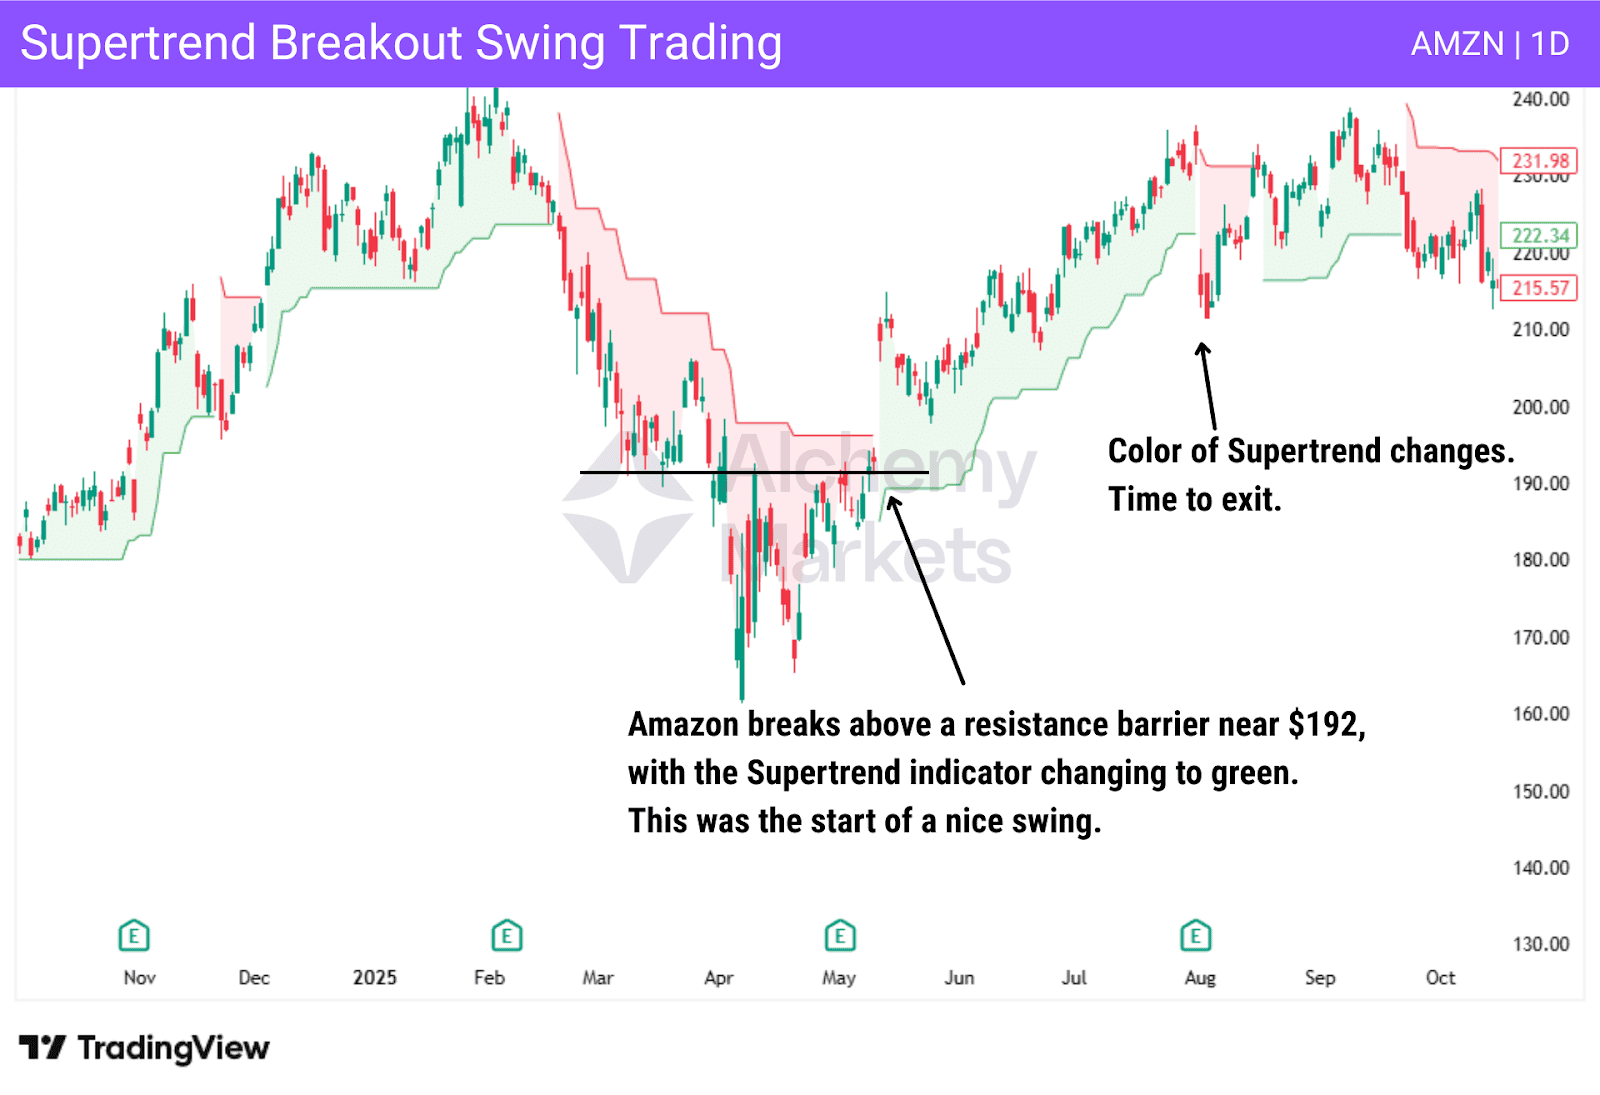
Supertrend breakout trading for swing trading is the trader waiting for a breakout of a previous high or low, and trying to catch the swing, or longer-term move.
This is typically done on 4-hour or above charts, with a default setting of 10 ATR and 3 multiplier. The idea is that once the breakout occurs, the Supertrend indicator will reflect this new move.
Double Supertrend Strategy
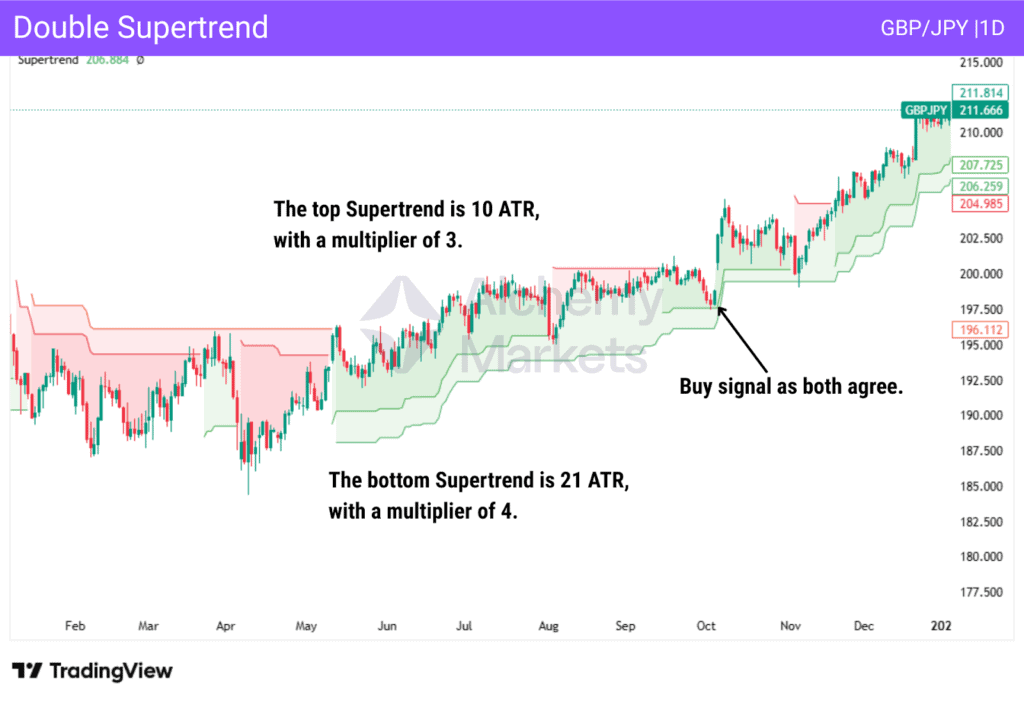
The Double Supertrend Strategy is when a trader will use two Supertrend indicators at the same time to have a short-term look and a longer-term look at a market.
One supertrend indicator would get added to the say the Daily chart time frame and a second supertrend indicator would get added to a 4-hour chart time frame. The idea is that the indicator on both timeframes agree.
Triple Supertrend Strategy
The triple Supertrend Strategy is simply using three Supertrend indicators to determine when short, intermediate, and long term trader are all in agreement of the momentum and trend of the market.
This adds a third chart time frame to the mix. This is extra confirmation that some traders will use.
Advantages of the Supertrend Indicator
The Supertrend indicator is popular, and for many different reasons. Below are some of the biggest advantages:
- Simplicity: The Supertrend indicator is a simple indicator for traders to quickly identify the overall trend, and potential stop loss and trend change levels.
- Removes Market Noise: Supertrend can remove a lot of the market noise. The ability to help the trade with identifying market trends and trend reversals is a huge benefit.
- Entry and exit levels: Supertrend allows for simple reading of entry and exit points, helping the trader trade with the market.
- Works in all timeframes: Supertrend works in all timeframes, as it is based on the average true range, something that is a mathematical calculation that is widely followed by the industry.
- Risk management: Supertrend allows traders to see trend reversals and continuations, allowing them to add another tool to risk management.
Disadvantages of the Supertrend Indicator
While the Supertrend indicator is a great indicator, it isn’t perfect. In the wrong conditions, it loses its effectiveness, so if you are using the Supertrend indicator in your trading, you should recognize some of the potential issues:
- Lagging: Supertrend is a lagging indicator. This means it reacts to price movement on a chart rather than “front run” them.
- Sensitivity settings: Traders need to choose the correct multiplier and ATR period. This is something that can take a bit of “tweaking.”
- Limited Function: The indicator is a trend-following tool, so it is necessary to know the trend to avoid false signals when possible.
- Market noise can hurt effectiveness: Market noise can cause chaos for this technical indicator. While it is loved by many, there are times when the market is simply too volatile to get a good Supertrend indicator calculation.
- It isn’t stand-alone: While a great indicator, the Supertrend indicator is rarely used alone. This is an indicator that tends to work best with other tools.
- False signals: The indicator can produce false signals, like any other one. If there is no clear trend, the Supertrend indicator can have plenty of false entry and exit signals.
- Magnitude hidden: While the Supertrend indicator can give great signals, it doesn’t tell you the magnitude of a move, such as the Relative Strength Index.
What Are The Different Super Trend Indicators?
There are several potential Supertrend indicators that you can use, although the standard one is by far the most commonly used one.
- Standard Supertrend Indicator: This is the version that uses the average true range ATR and the moving average of price. It will produce buy signals when the price closes above the indicator line, and sell signals when the price closes below it.
- Adaptive Supertrend Indicator: The adaptive Supertrend indicator will adjust its inputs dynamically based on volatility or other customizable data. This can help the indicator perform better across different conditions.
- Modified Supertrend Indicator: The version of the Supertrend indicator adjusts the method of calculation of the standard version to provide more timely signals or to suit specific styles and methodologies of trading.
- Double Supertrend Indicator: The version uses two Supertrend lines, using two different sets of parameters, generally short-term and a longer-term one, as it can show when both groups of traders agree on the overall move.
- Color-Coded Supertrend: This is basically the same as the standard version, but instead of displaying buy and sell signals with arrows or lines, it will change the color of the indicator line to show shifts.
- Multi- Timeframe Supertrend Indicator: This version allows the trader to overlay Supertrend signals from several different timeframes on a chart to provide the overall broader outlook on market trends. This is like having multiple charts open at once, but in a more readable format.
FAQ
Is the Supertrend Indicator for Beginners?
Yes, the Supertrend indicator is good for beginner traders, as the most important factor is knowing the trend direction. The color coding in the Supertrend indicator strategy makes it very simple. However, it isn’t to be used alone.
Is the Supertrend Indicator Profitable?
The Supertrend indicator cannot guarantee profitability, as it is just one tool among many others. However, being based on the Average True Range, it is handy as that is one of the most commonly followed technical analysis tools. Market volatility can also have a major influence on the indicator, and not always a good one.
How Reliable is the Supertrend Indicator?
The Supertrend indicator’s reliability can depend on a lot of different factors. Market conditions, the asset type, and the amount of risk a trader takes on will have a major influence on the outcome. The reliability of Supertrend indicators is essentially the same as all other technical indicators; it will come down to the user.
How Can I Avoid False Signals with the Supertrend Indicator?
To avoid false signals, a trader can use the Supertrend indicator with other indicators. This is commonplace in technical analysis, to “stack a set of tools” to analyze the market and make decisions. There is no such thing as a “100% sure thing” in trading.
However, by combining the Supertrend indicator with other commonly used indicators, this can increase the number of people agreeing on the same thing.
Can the Supertrend Indicator be used for crypto or forex?
The Supertrend indicator works in almost all markets, as it isn’t married to a particular market. However, you might have to tweak some of the settings depending on the asset being traded.
What are the best Supertrend Indicator settings?
While there are some very standard ways of approaching Supertrend indicator settings, it should be noted that there is no real ‘one size fits all” solution. The settings below are the most common ones for these situations, and you should always backtest and demo trade any new settings you wish to choose.
Best Supertrend Settings for Swing Trading
Using the Supertrend indicator for swing trading is a very common situation. This is because the Supertrend indicator is built to keep the trader in the trend. The settings can be the default, but sometimes, the trading strategy that a person uses aims for even longer-term moves, and might set the ATR to 14 or higher, and the multiplier to 4.
Supertrend Indicator for Day Trading
With day trading, the goal is to get into and out of the market before the end of the day. The Supertrend indicator can be used for daytrading, just as it is used for other time frames. The reaction time is typically the biggest concern, so it is common for traders to change the ATR to a lower level, such as 7, and the multiplier down to 2.
Is the Supertrend Indicator a Leading or Lagging Indicator?
The Supertrend indicator is considered to be a lagging indicator. It produces buy signals and sell signals from historical data, and gives insight into price movement and trends after the move has started. However, traders can adjust the Supertrend indicator settings to make it quicker to respond.
What are the origins of the Supertrend Indicator
The Supertrend indicator was developed by Olivier Seban in 2009. It is designed to help traders determine buy and sell signals, and of course, trend direction. However, it is worth noting that the indicator is often used with other indicators.
Can the Supertrend Indicator Be Used for Algorithmic Trading?
Yes, of course, and many traders do. However, it makes sense to have a “confirmation tool” such as the ” Relative Strength Index” or a moving average. Using the Supertrend indicator by itself can cause false signals, but smoothing out the signals can make using it as a core to the algorithm possible.


