- November 22, 2024
- 19 min read
Keltner Channels and How to Use It
In this article, you’ll learn about the Keltner Channels and its practical use cases. Without the fluff, we’ll show you what Keltner Channels are, how to use them, and their place in your trading toolkit.
Key Takeaways
- Keltner Channels use the EMA and ATR (Exponential Moving Average, and Average True Range) to indicate trend direction, price breakouts, overbought, and oversold conditions.
- The effectiveness of the Keltner Channels depends on proper application and adapting settings.
- Useful for swing and momentum traders, and can be combined with RSI and Stochastics for additional insights.
What Is a Keltner Channel?
Keltner Channel is a technical analysis indicator used by traders to gauge market volatility, by wrapping an asset’s price action within three lines that form a band. Traders can use these insights to find areas of interest (i.e. where the price could reject from), and get entry and exit signals.
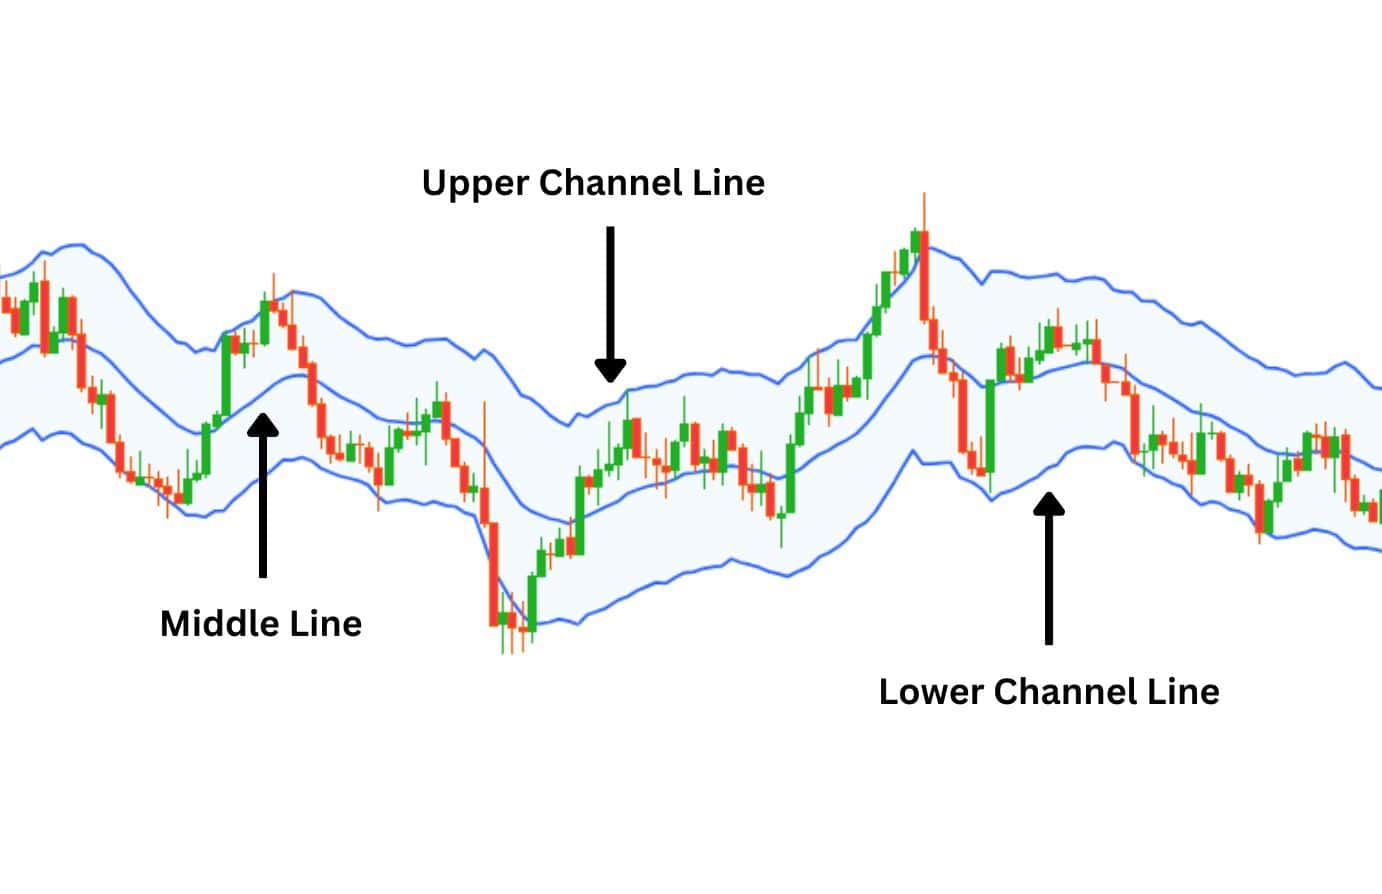
Originally created by Chester Keltner, these channels were introduced in the 1960s as a way to measure volatility and find overbought, oversold conditions, or volatility expansions. Today, the most commonly used Keltner Channels indicator is a variant updated by Linda Raschke in the 1980’s.
How to Calculate Keltner Channels
Keltner Channels weave together two common technical analysis indicators to create its unique form – the Exponential Moving Average (EMA) and the Average True Range (ATR).
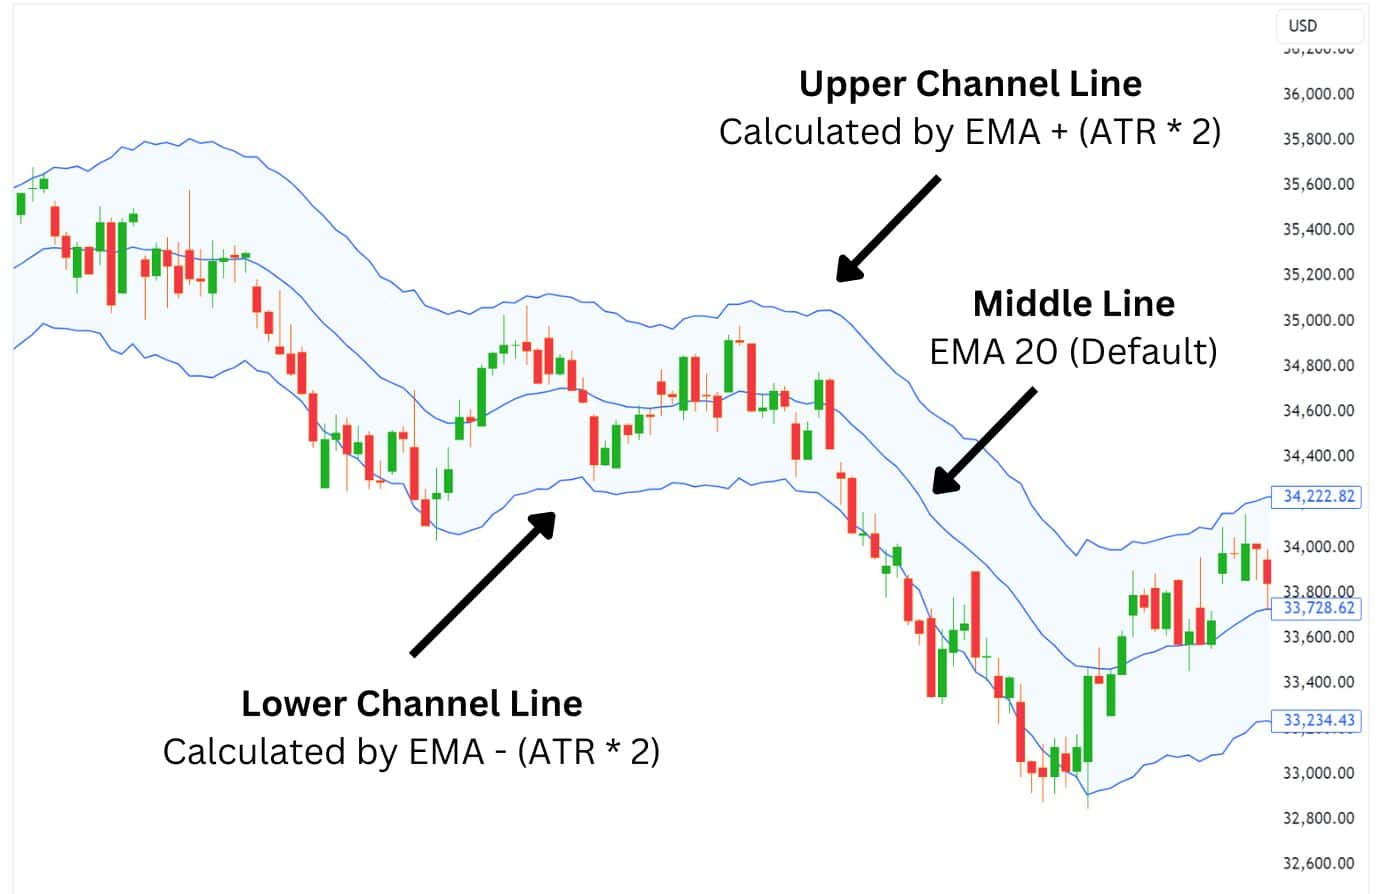
The middle line of the Keltner Channel is based on an exponential moving average (EMA), typically set at 20 periods. However, you can adjust this setting to better suit the specific asset or trading timeframe that you are trading, optimising the results of the indicator’s signals.
The channel lines are then formed by adding and subtracting two times the Average True Range (ATR) from the Exponential Moving Average (EMA).
Due to the average true range’s ability to calculate the expected price movements of an asset (based on previous data), it is rare for the price of an asset to exceed twice the ATR value – which allows the indicator to capture the bulk of the price action within its channel.
Keltner Channel Formula
At the heart of the Keltner Channel formula is a moving average of the typical price, which is the average of each period’s high, low, and close prices. This is the backbone of the channel, the centerline around which the upper and lower bands wrap around – forming a channel.
Determining the position of the lower line and upper line is the Average True Range. The ATR is multiplied by a predetermined multiplier, often set at 2, which is then used to calculate the distance of the upper and lower bands from the middle line.
This gives us the calculation formula of:
| Upper Line = EMA + (ATR * Multiplier)Lower Line = EMA + (ATR * Multiplier) |
The Keltner Channel indicator then continuously calculates this formula, which visualises a smooth looking channel on the chart.
Since the channel lines are calculated through the ATR, whenever there is an increase in volatility, the channel also expands with it, attempting to play catch up and keep the price bars / candlesticks encompassed… Almost like it’s playing cops and robbers.
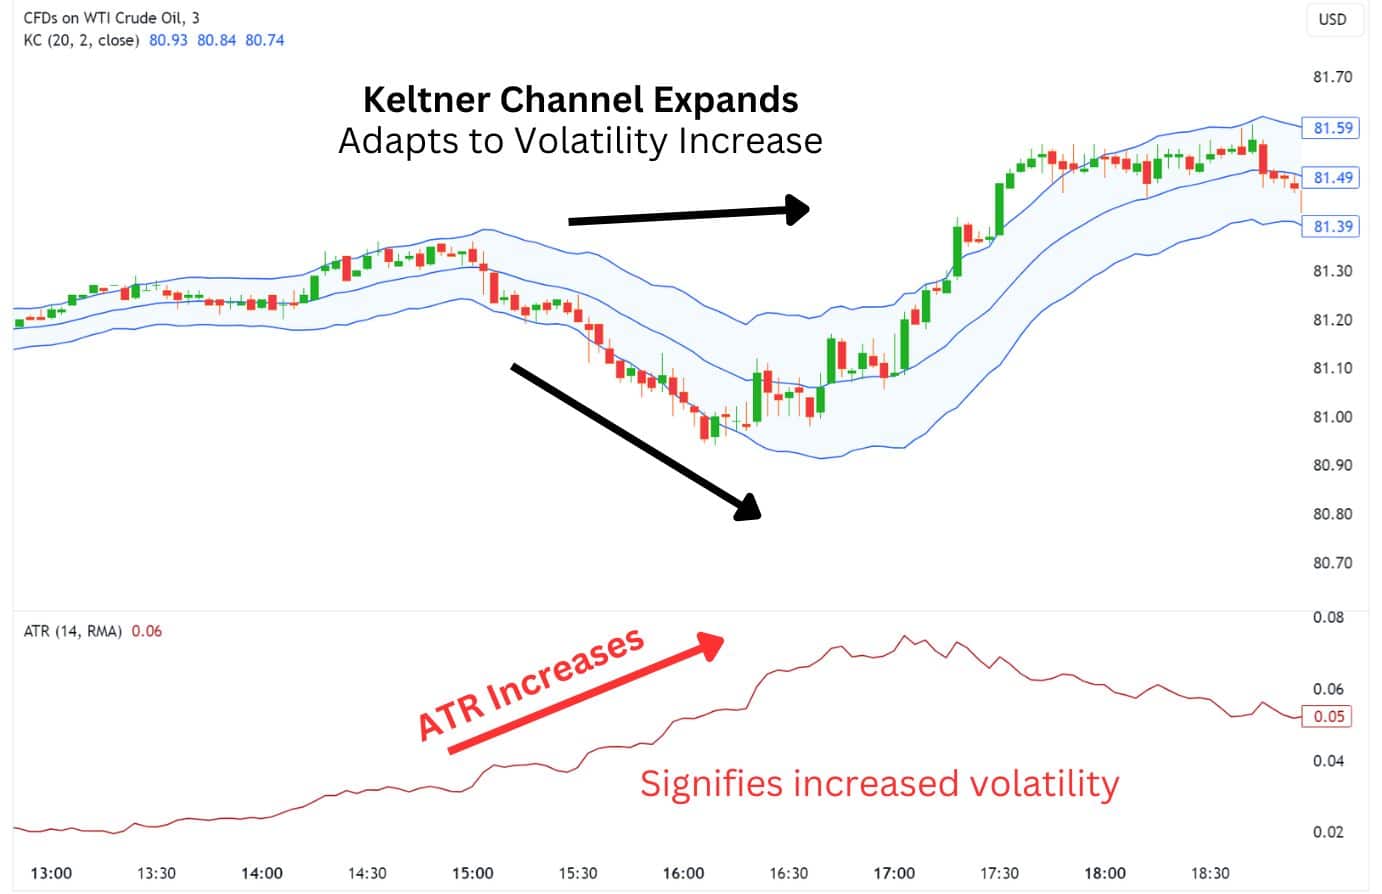
To form the upper Keltner Channel, the product of the Average True Range (ATR) and the multiplier is added to the moving average midline, while to form the lower Keltner Channel, it is subtracted.
How to Set the Keltner Channels
By default, the Keltner Channel’s middle line is set to 20 EMA, and uses ATR x 2 to calculate its upper and lower line positioning. However, traders have the ability to change these settings to better adapt to an asset’s unique movements, or to use in their personalised strategies.
These settings can be adjusted with the following general rules in mind:
- Using a higher EMA will lead to a less “enveloping” channel, which hugs the price less closely, but creates more opportunities to trade breakouts.
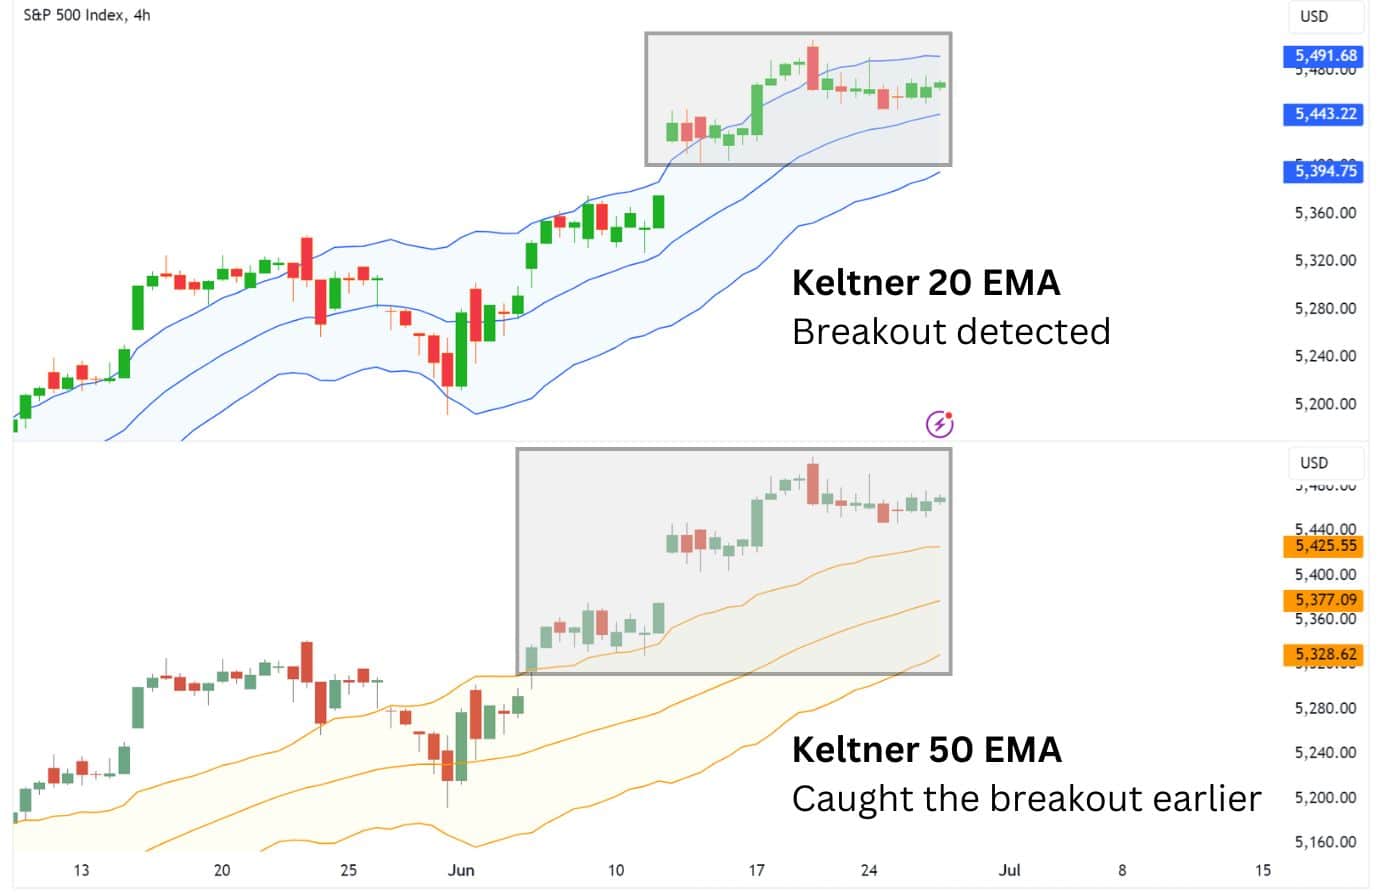
- Setting a higher ATR multiplier will generate stronger but less frequent signals. By default, the multiplier is set to two, and some traders will bump this setting up to three.
- Last but not least is the ATR itself. Many traders prefer using the Linda Raschke settings of 10 ATR, but personally, I have found the 14 ATR to produce more reliable signals.
If you are a scalper, using a less sensitive, smoother Keltner Channel settings could be more effective in generating longer-lasting trend signals. Meanwhile, using the default Keltner Channel (or more sensitive settings) can be more optimal for bigger timeframes such as the 4H, Daily or Weekly.
Keep in mind that in general the greater the EMA and ATR, the less sensitive the indicator is.
Here are preset settings to consider:
| Settings | EMA | ATR Multiplier | ATR | Suitable For |
| Linda Raschke Settings | 20 | 2.0 – 3.0 | 10 | Swing, Day |
| ATR Indicator Settings | 20, 50 | 2.0 – 3.0 | 14 | Swing, Day |
| Smoother Bands for Trend Breakout Strategy | 50 | 2.0 – 3.0 | 10, 14 | Scalping |
Keltner Channels Example
Let’s consider an example to illustrate the Keltner Channel indicator in action. Assume that we are observing an asset’s price movement that is encapsulated within a Keltner Channel.
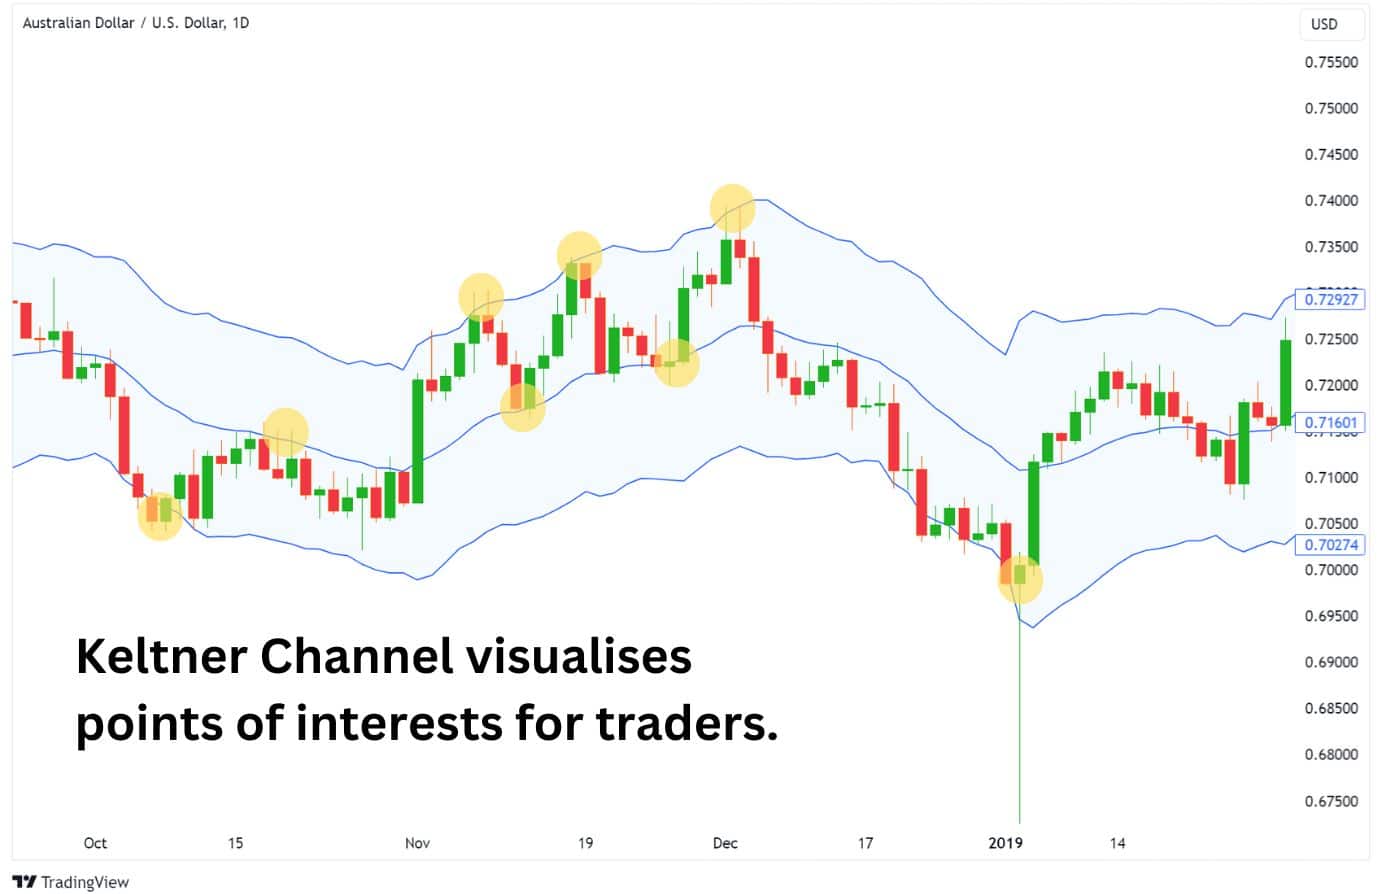
The Keltner Channel’s middle line, upper band, and lower band can act as dynamic support and resistance levels, with traders potentially buying at the lower band and selling at the upper band. The middle line acts as a versatile support or resistance depending on the trend direction.
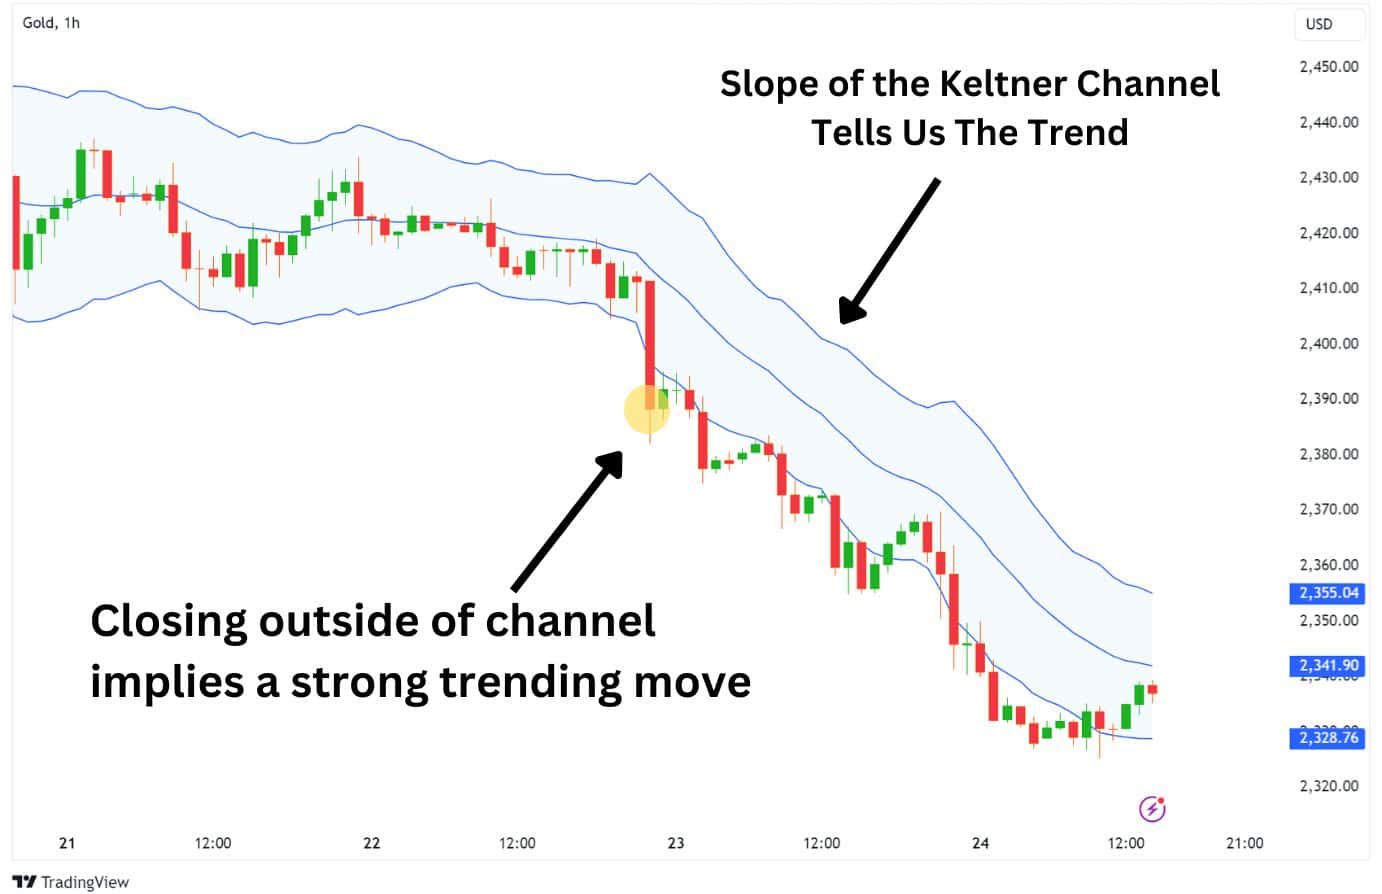
Another common use for the Keltner Channels is for detecting volatility expansion; moments where the price makes an abnormal move. These movements are characterised by a candlestick closing beyond the Keltner Channel. It tells traders that a powerful new trend is forming, and signals us to trade in the new trend’s direction.
Volatility expansion can be detected when the price closes above or below the channels – indicating that a powerful move is currently in the making. Traders can use this signal to enter a trade, betting on the continuation of the move.
Lastly, traders can use the slope of the Keltner Channel to identify the trend. When the Keltner Channel is sloping up, that means we are in an uptrend. When it slopes down, we are in a downtrend.
Keltner Channels Trading Strategies
Keltner Channels are primarily used for trading ranges and breakouts. This is made possible by the indicator’s usage of the Average True Range (ATR) in its calculations.
As the ATR logically calculates where the local price action is likely to top out or bottom out, the bands can be reliably traded in ranging conditions – given that the Keltner Channel settings are suitable for your asset and timeframe.
For breakouts situations, the price would pierce through the channel’s bands, and successfully close beyond them. An irregular move like this implies that large players are stepping in to push the price in a direction, which also signals a high likelihood of continuation in the price’s breakout.
The Mean Reversion Trading Strategy
Like the Bollinger Bands®, the Keltner Channels can be used to trade ranges. The idea here is to trade the mean reversion, a common occurrence where the price tends to return to its average point.
The average price can be determined by a simple moving average, an exponential average, or the vWAP. Since the Keltner Channel uses the EMA as its middle line, we will use that as our average price.
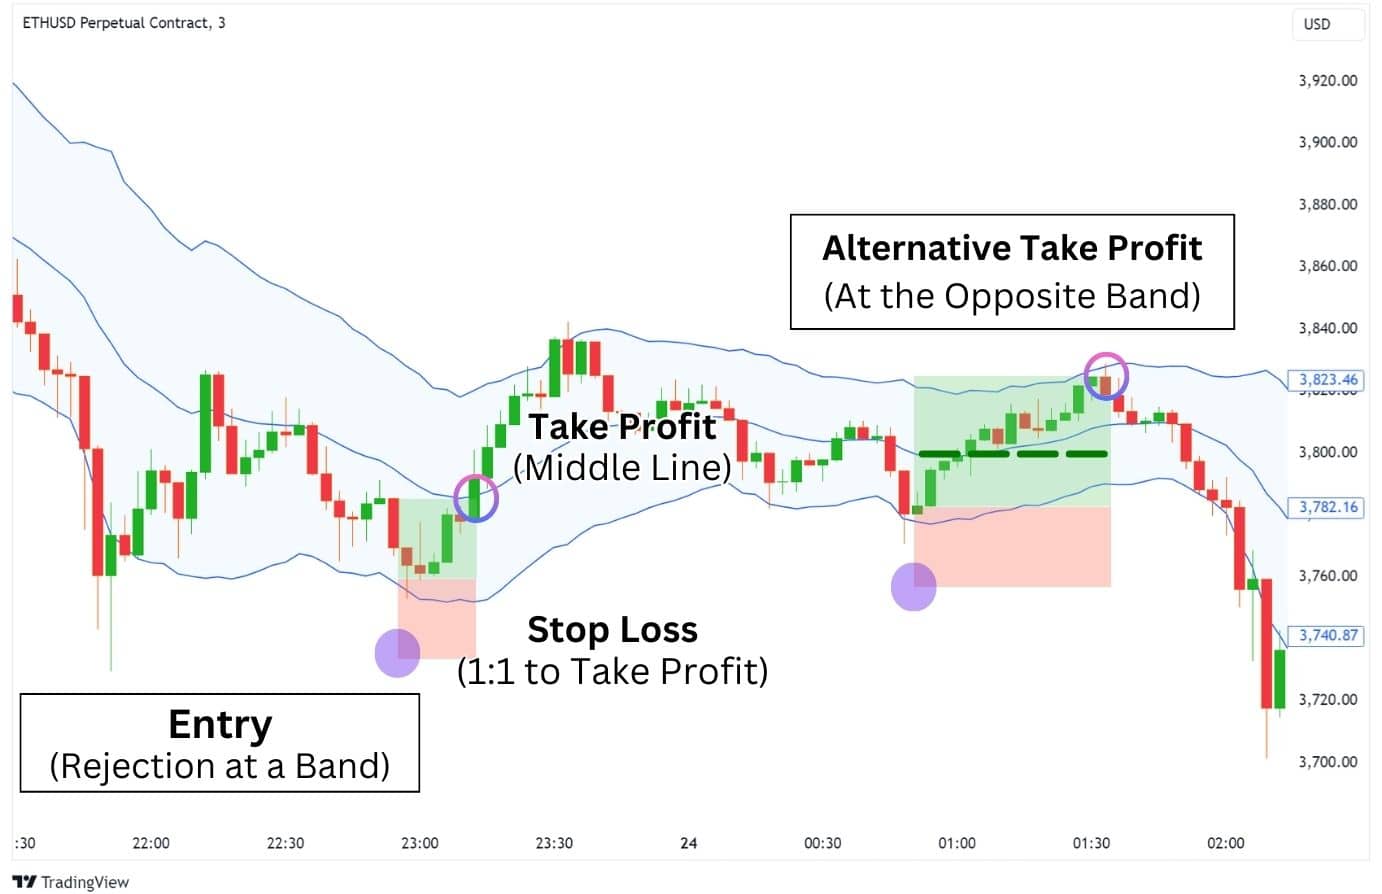
Entry: When the Keltner Channels are going sideways, take a long position when the price rejects from the lower band. Take a short position instead if the price rejects from the upper band.
Exits: Take profit at the middle line. Alternatively, you can only take partial profits, then extend the target to the opposite band.
Stop Loss: Place your SL above the upper band, or below the lower band. Set to 1:1 Risk-to-Reward.
This strategy is best used after a huge impulsive move, where the price is likely to correct and/or consolidate. It is also effective during trading hours with lower volatility.
The Trend-Pullback Strategy
Taking the opposite approach from the Mean Reversion Strategy, the Trend-Pullback Strategy involves watching for corrections in the prevailing trend, and waiting for price to reach the middle line.
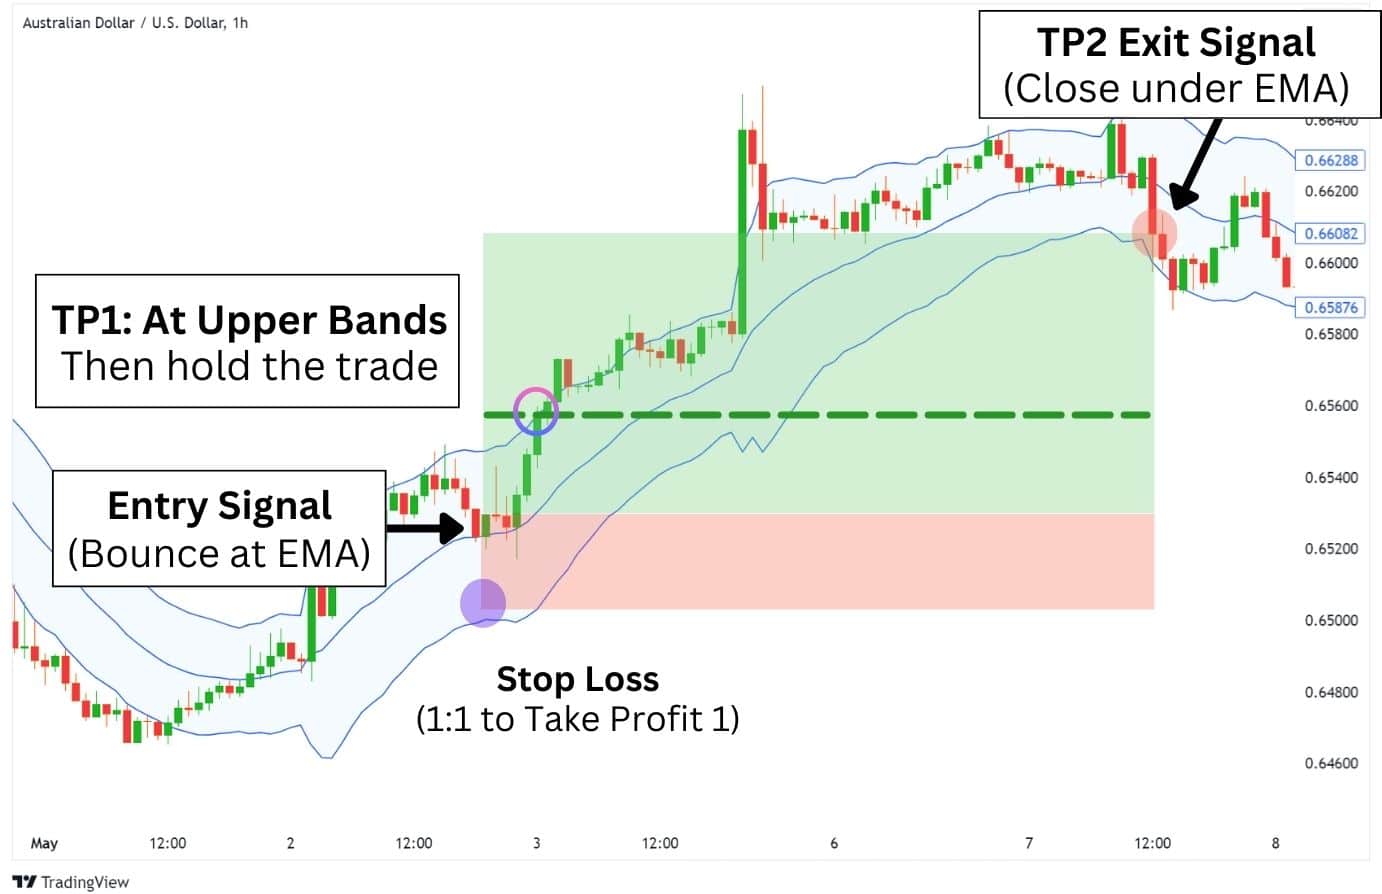
Entry: When the Keltner Channels are sloping upwards, take a long position when the price retraces to the middle line. When the channels are bearish (sloping downwards), take a short position instead.
Exits: Take partial profit when price reaches the upper or lower band to protect your capital, then hold the trade until the price closes beyond the EMA line against your trade.
Stop Loss: Place your SL below the EMA – a good trick is to set the stop loss to 1:1 Risk-to-Reward to your first take profit.
The Keltner Channel Breakouts Strategy
This strategy capitalises on strong price movements when channel breakouts occur in the Keltner Channel indicators.
This irregular move indicates that big players are stepping in to push the price in a direction. Whenever this happens, it is highly likely that the price will continue to push in the breakout direction.
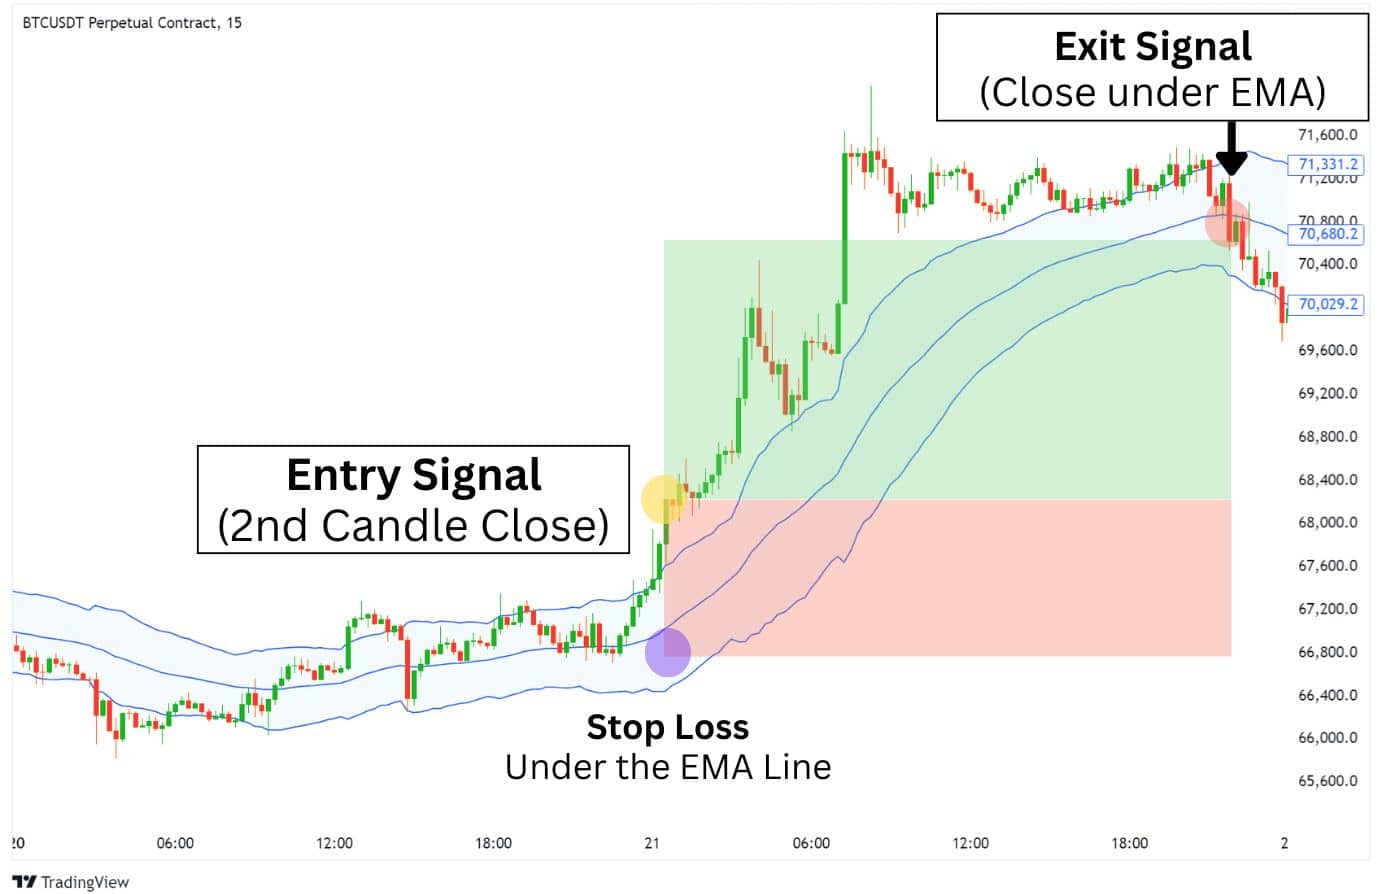
Entry: When the price closes 2 candles above or below the entire Keltner Channel, enter a trade going in the direction of the breakout.
Exits: Take profit when the price closes above or below the middle line (EMA).
Stop Loss: Place your SL above or below the middle line (EMA). You can set trailing stop loss to have it function as both a take profit and stop loss order.
This strategy is more effective when paired with a narrower Keltner Channel, which can be achieved with the 50 EMA configuration.
Combining the Trend-Pullback and Breakout Strategies
There are always opportunities in the market. Just because you missed an entry with the Breakout Strategy, doesn’t mean you can’t find another entry with the Trend-Pullback Strategy. You can apply both strategies for trading different situations.
Keltner Channels in Trend Following
When applying a Keltner Channel strategy to capture a trending move, it is very important to first identify the trend direction of the markets. If the Keltner Channels are flat, it may indicate that the trend may not be strong enough to make a significant move.
After identifying the trend, you must remain disciplined and only take trades in the direction of the trend, and only when the price reaches the points of interest:
These points of interest are:
- EMA (Middle Line)
- Upper Channel Line
- Lower Channel Line
Overbought and Oversold Conditions
Now, when the Keltner Channels are actually flat – this means that the market is moving sideways in a range. This provides an opportune time to trade the Mean Reversion Strategy.
In such scenarios, the Keltner Channels’ lower band and upper band can act reliably as overbought and oversold levels, allowing traders to enter short and long positions.
These conditions can provide valuable clues about potential price reversals or pullbacks.
Keltner Channels with Moving Averages
Beyond using the Keltner Channel’s middle line (EMA 20), we can add an EMA 200 to get a picture of the broader trend. This allows us to filter out trades that are not in the direction of the broader trend, which can improve our win rate by cutting down on our losses.
For example: The price is below the EMA 200 on the S&P 500 1 minute chart. This tells us to only look for short trade setups.
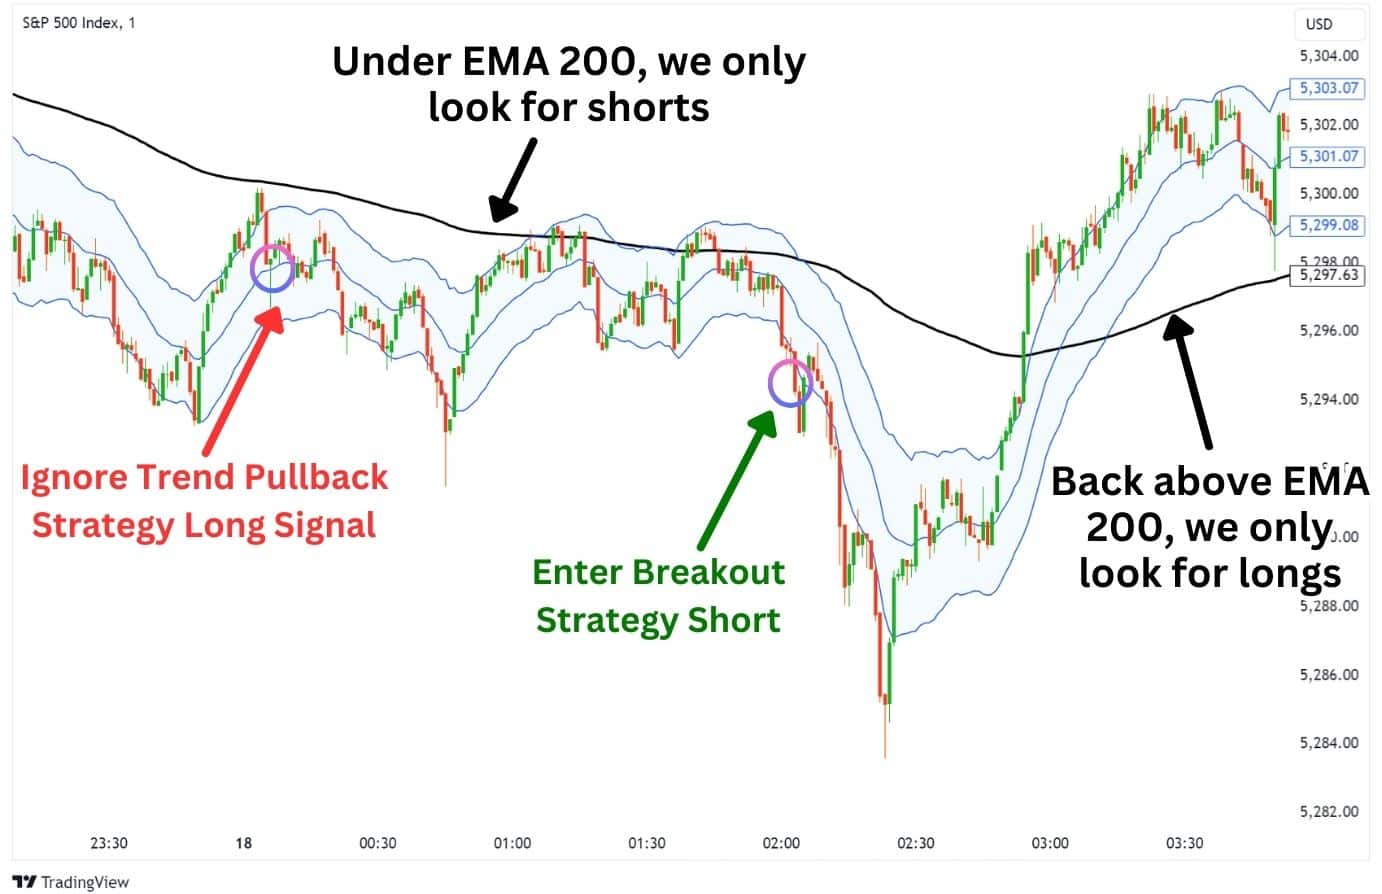
So even when the Keltner Channel is sloping up, we can avoid taking bad long trades by using a filter.
Keltner Channels with Average Directional Index (ADX)
The Average Directional Index (ADX) can help us identify flattening trends, allowing us to get into aggressive mean-reversion trades, and trend-pullback trades quickly.
A flat moving average along with a low and falling ADX reflects the absence of a trend, aligning with the trading range conditions where Keltner Channels can be used to identify overbought and oversold levels.
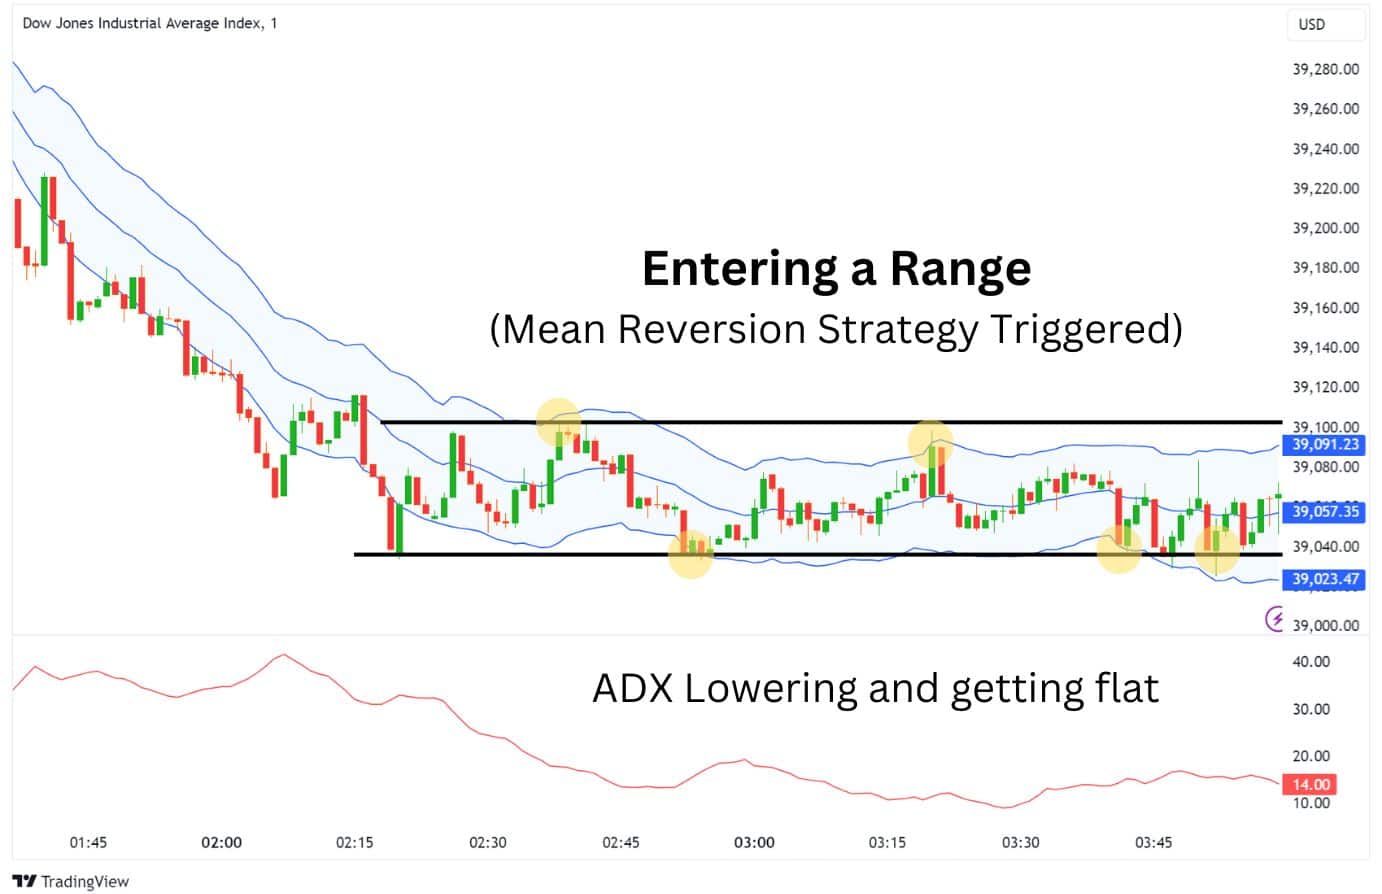
Using the ADX, we can also use the concept of the Trend-Pullback to enter a range trade, targeting the upper or lower channel line.
On the opposite end, we can use a rising ADX to enter a breakout trade with the Keltner Channel Breakout Strategy. When the ADX is rising, and there is a candle close above the Keltner Channel, we can enter a long trade.
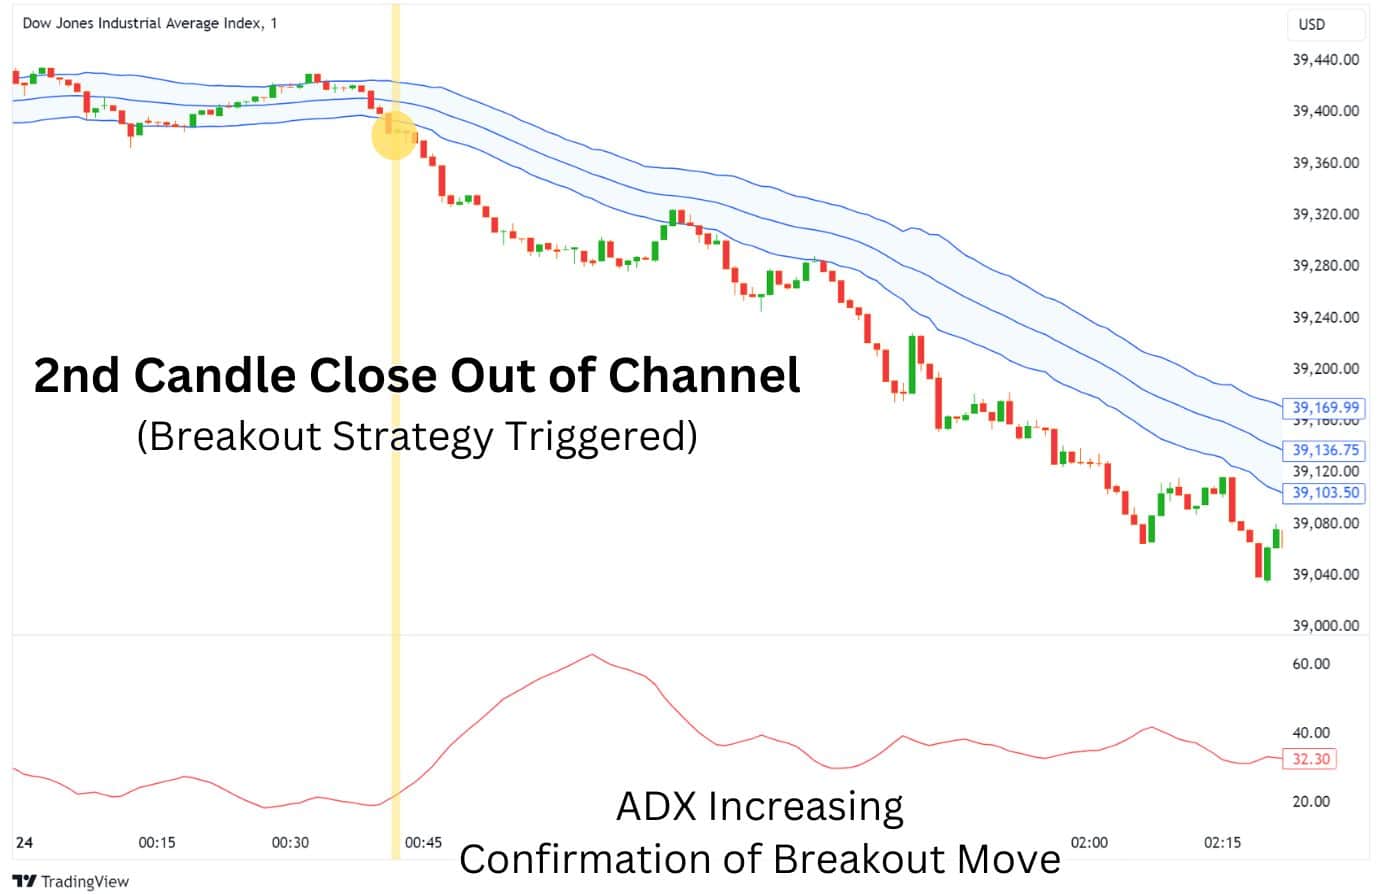
Keltner Channels with RSI
An RSI divergence can inform us that a reversal is likely to occur – this is when the price is moving in the opposite direction of the RSI. When paired with the Keltner Channels, we can use this to more accurately take trades from the EMA, lower channel line, and upper channel line.
A bullish divergence occurs when the RSI is forming a higher low, but the price is forming a lower low. This signals a bullish reversal and a long position at key levels, such as the EMA (middle line) or lower channel lines.
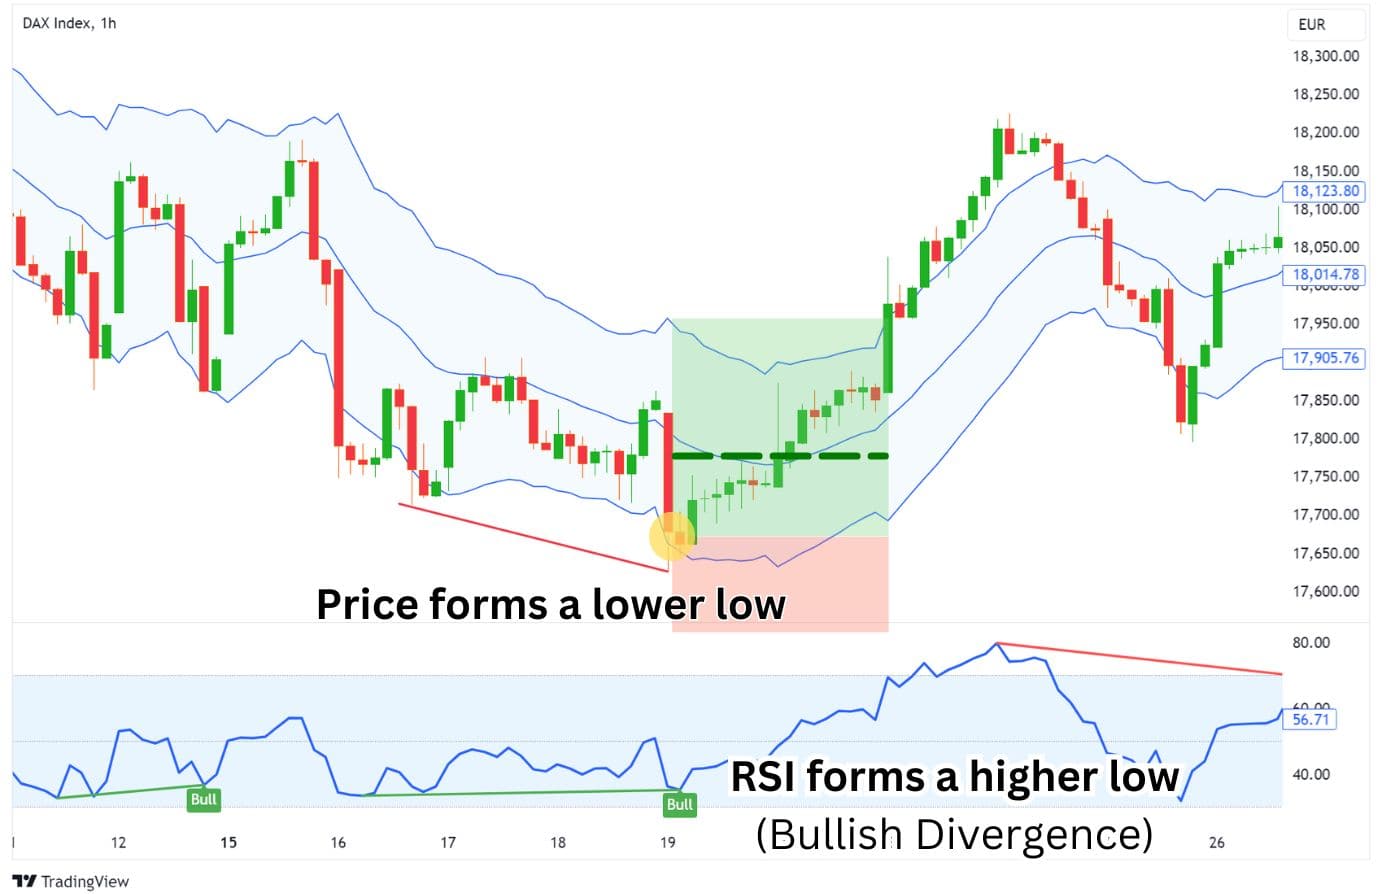
Conversely, the bearish divergence occurs when the RSI is forming a higher low, but the price is forming a higher high. This signals a bearish reversal at key levels, such as the middle or upper channel lines.
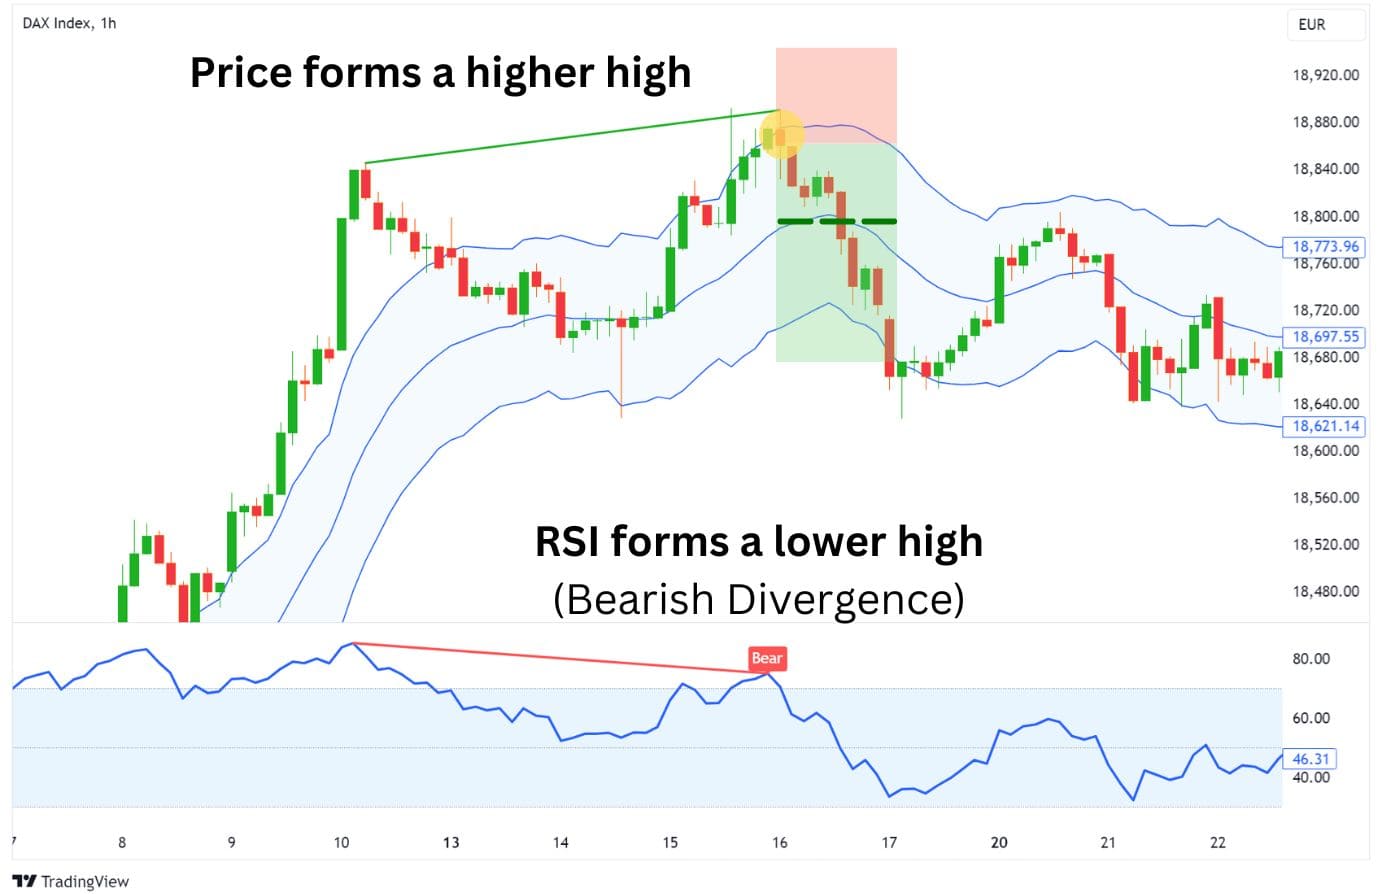
We can pair this concept with our Trend-Pullback Strategy and Mean Reversion Strategy to enter trades using the Keltner Channel, with more accuracy and confidence.
Keltner Channels with Stochastics
Similarly to the RSI indicator, the stochastics can signal divergences to help us enter trades. Again, you would look for a bullish divergence at the middle or lower channel line; and a bearish divergence at the middle line (in the context of a downtrend) or at the upper channel line.
However, there is an additional signal the Stochastics provide which the RSI does not: double tops and double bottoms. When the stochastics form a double top or double bottom at key levels, this is often a signal for a reversal.
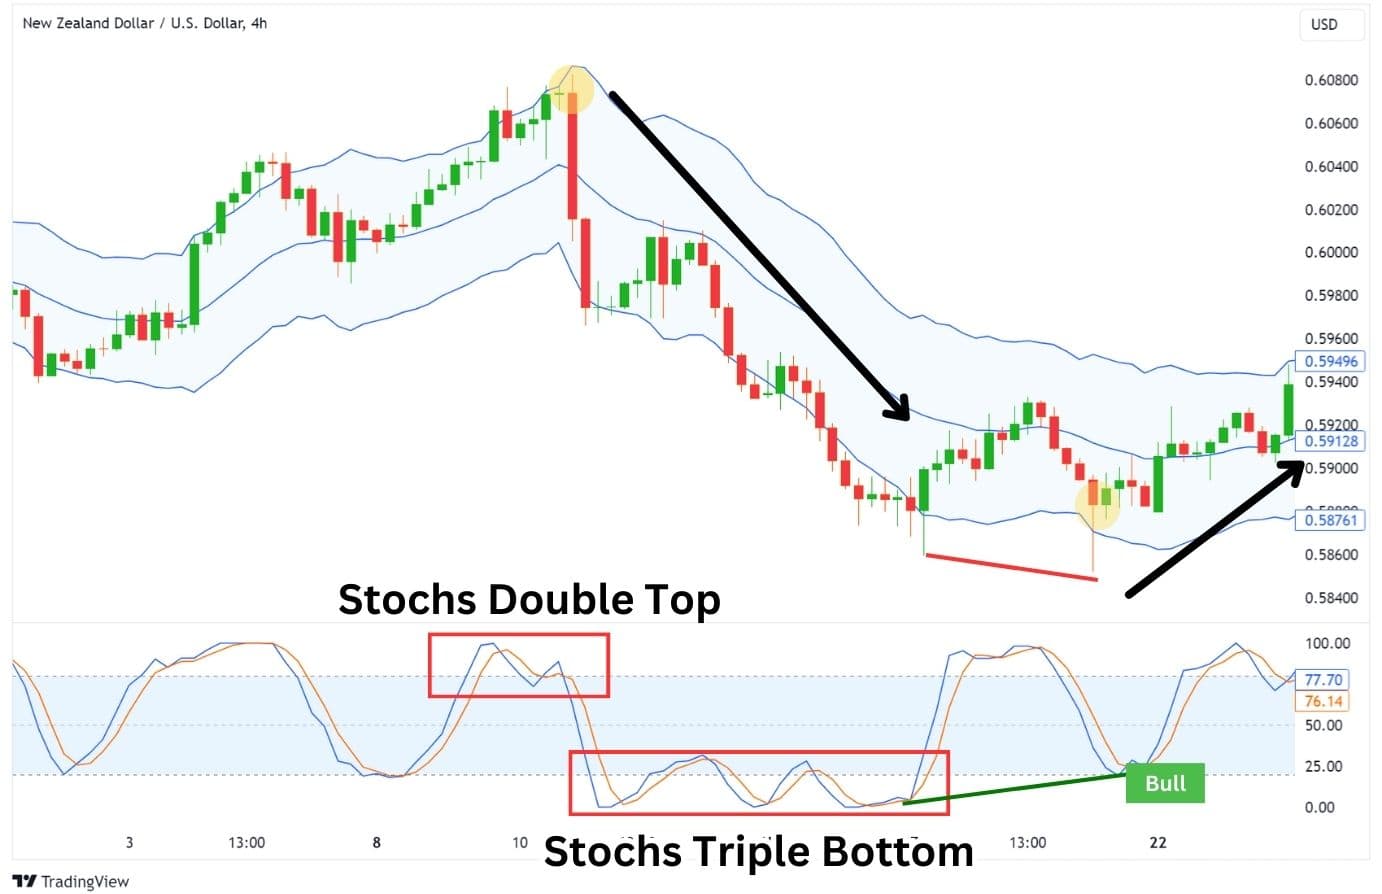
Using the Keltner Channels to plot out the key levels, we can find these reversal trade opportunities with the Stochastics indicator.
Trading Ranging Markets with Keltner Channel
Remember that when trading a ranging market, it is important to identify if the market is actually flattening out and ranging.
Combining all that we know in this article, you can go for a setup with the Keltner Channel, ADX, and a reversal indicator of your choice (Stochastics or RSI).
The ADX helps us filter out trending and ranging environments, whereas the reversal indicators help us more accurately time our entries. The Keltner Channels plot out our key points of interest, and also serve as an exit signal.
Identifying and Avoiding False Signals with Keltner Channels
The Keltner Channel is a powerful indicator that can provide breakout trade and mean reversion trade signals, however, it can also give false signals.
To identify and avoid false signals, you can combine trend and momentum filters with the Keltner Channel. For example, consider the following workflows:
- EMA 200: If the price is above the EMA, we will only look for long trades with the Keltner Channel. Conversely, if the price is below the EMA, we will only look for short trades.
- RSI Divergence: When an RSI divergence forms, we can use the directional bias of the divergence to filter which side (long/short) of trades to take.
- ADX: If the ADX is flat, then the markets are in a ranging environment. We’ll focus on using the Keltner Channel mean reversion trade strategy.
- Stochastics: When stochastics form a double top, double bottom, triple top, or triple bottom, it may signal a potential mean reversion trade from the Keltner Channel’s upper or lower bands.
For more in-depth information, check out the Keltner Channel Strategies section above.
Advantages of Using the Keltner Channels
- Versatile indicator that provides trend direction, points of interest, and trade signals.
- Predicts future movements with the ATR.
- Can be used for trading ranges and breakouts.
Disadvantages of Using the Keltner Channels
- Requires an accurate understanding of market trend conditions to utilise effectively.
- Can generate false signals if blindly traded.
- Choosing the optimal ATR, Multiplier, EMA settings can take a lot of trial-and-error.
Keltner Channel vs Bollinger Bands®
The Keltner Channel and Bollinger Bands® are “channel” indicators designed to measure volatility, and provide areas of interest for range trading and breakout trading. Their key difference lies in how they calculate these channels.
While the Keltner Channel uses the ATR (Average True Range), which simply averages the true ranges in a calculation period, the Bollinger Bands uses a standard deviation calculation from its central moving average to draw the bands. In principle, the standard deviation is designed to capture volatility such that 95% of the price action is contained within two standard deviations of the moving average. This involves squaring the differences (deviations) from the mean, making the Bollinger Bands much more sensitive to sharp fluctuations in price.
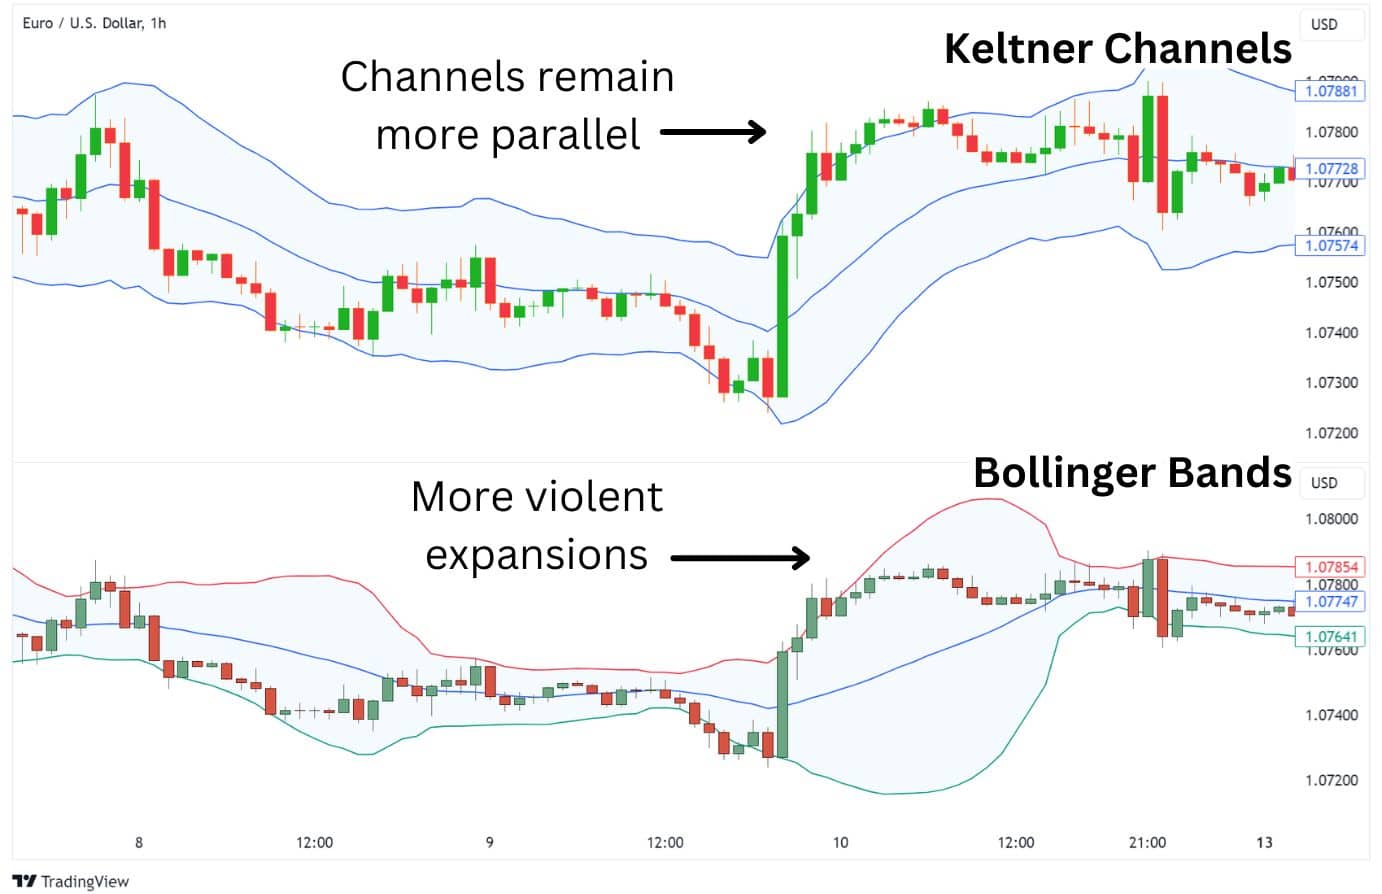
Additionally, the Keltner Channel uses an EMA (Exponential Moving Average) as its middle line, whereas Bollinger Bands uses a 20-period SMA (Simple Moving Average) as its default.
Keltner Channel vs Donchian Channel
Keltner Channels and Donchian Channels are both channel-based indicators that can help traders identify potential buy and sell signals.
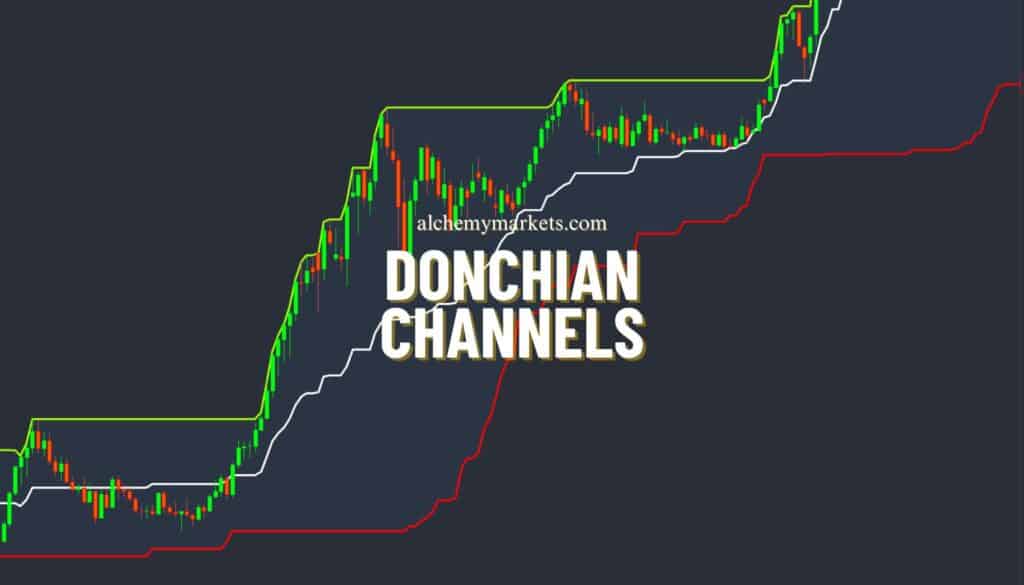
However, while Keltner Channels use the average true range (ATR) and an exponential moving average (EMA) to form their upper and lower bands, Donchian Channels do not use a moving average. Rather, the Donchian Channel plots the highest high and lowest low within a set number of price bars. The middle line is simply the 50% level in the channel.
For example, over the course of a week, the Keltner Channels’ bands would be fluctuating in their position. The Donchian Channels however, would only expand when a new high or new low has been formed throughout the week.
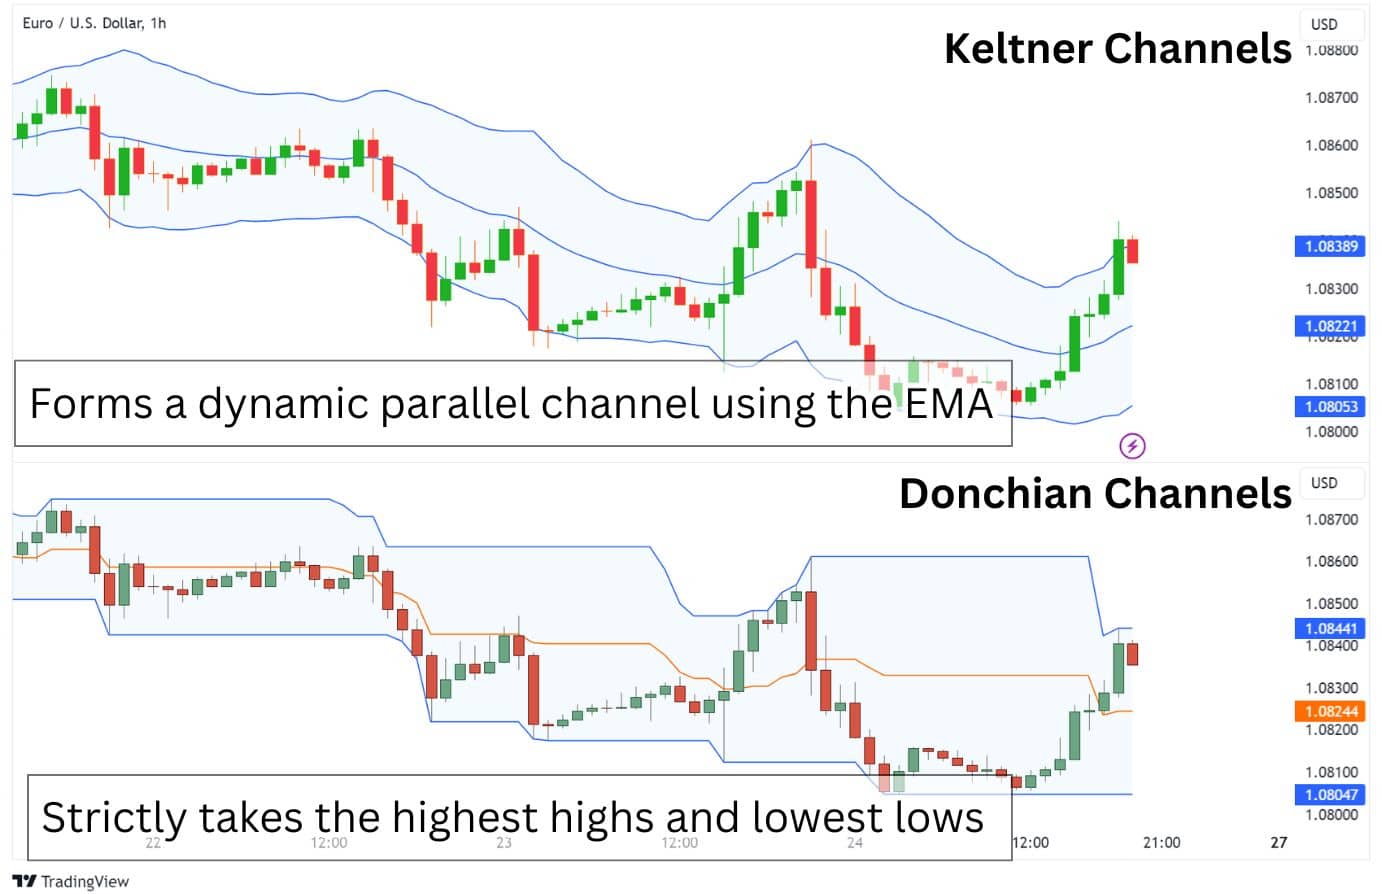
While the Keltner Channel can be used for range trading, as well as breakout trading – the Donchian Channel is primarily only used for breakout trading.
Compared to the Keltner Channel, the Donchian Channel is a much more simplistic indicator. It purely plots out the highest high and lowest low within a range. For example, if you set the Donchian Channel period to 7, it’s only going to mark out the highest highs and lowest lows from the past 7 candlesticks.
The middle line of the Donchian Channel is also just purely a 50% average of the upper band and the lower band – whereas the Keltner Channel’s middle line is based on an EMA.
Keltner Channel vs VWAP
Similar to the Keltner Channel, the vWAP is able to form a channel band of sorts. The vWAP channel bands are created using the standard deviation function from the vWAP line. The middle vWAP line is determined by a unique calculation which captures the average price, weighted with trading volume considered in the equation.
Traders use the vWAP as a benchmark to find the average price of an asset, and inform them if they should buy or sell. The idea here is to buy below average price, sell above average price.
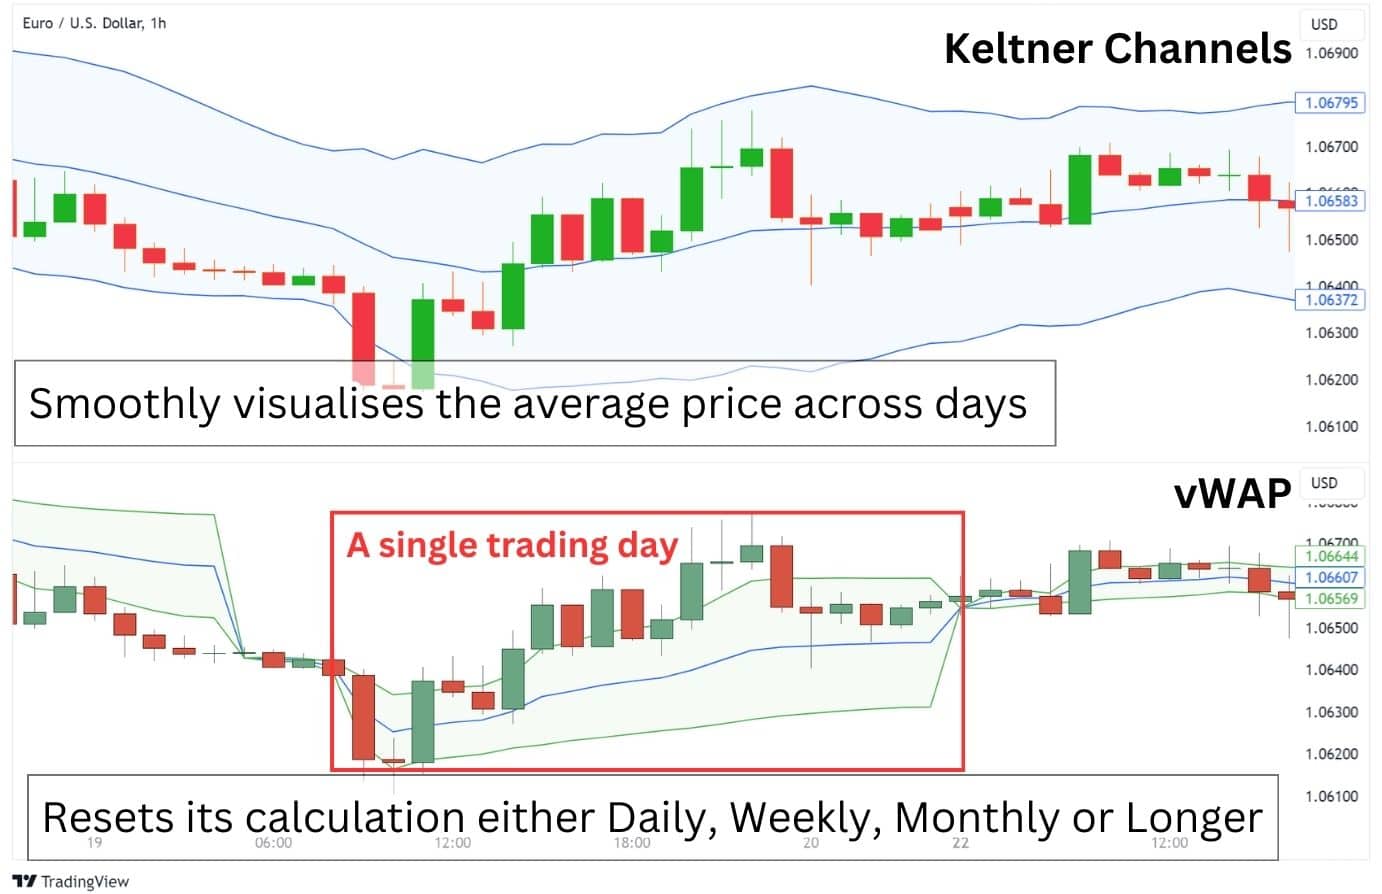
Unlike the Keltner Channel, the vWAP resets on an interval – this can be set to daily, weekly, or even a year. The Keltner Channel, on the other hand, is a continuous indicator that does not reset, as it is using a rolling EMA for its calculations.
Role of Center Line in Keltner Channel
The centre line serves three main purposes.
As mentioned previously, the central moving average line is the basis for calculating the upper and lower band. Without the centre line, the ATR bands cannot be calculated to provide traders with a price band of expected volatility. The area between the bands is where most price action is expected to occur.
Secondly, the centre line is a moving average and can provide clues about the trend’s direction. When the centre line and corresponding channel direction is pointed higher, the trend is considered up. If the centre line and channel direction are angled lower, it is considered a downtrend.
Lastly, when considering a longer term input value like 200, the centre line can act like support or resistance for longer term price action. Therefore, the Keltner channel provides traders with a zone where longer term support or resistance may lead to a reversal.
The default moving average is an exponential moving average. On the TradingView charting platform, you can switch to using the simple moving average as shown below.

Be warned that changing the central moving average type will change the location of the centre line and where the Keltner bands appear. This could have an impact on the use of Keltner Channels and traders may need to adjust their “Length” and “Multiplier” parameters in order to find the ideal settings.
FAQ
What are the best Keltner Channel settings to use when scalping?
The best Keltner Channel settings for scalping typically involve reducing the period and EMA period to capture smaller price movements.
For instance, one might choose a 10-period EMA and a 1.5 ATR to create tighter channels that respond more quickly to price changes. It’s important to note that these settings might increase the number of signals generated and the potential for false positives, so they should be used in conjunction with other indicators to confirm trading signals.
Is the Keltner Channel EMA or SMA?
The default is an exponential moving average (EMA) as the centre line for Keltner Channel. It is important to note that traders can change this setting to simple moving average (SMA) if desired.
What is the History of the Keltner Channel?
The Keltner Channel is the brainchild of Chester W. Keltner, an American grain trader who introduced the concept in his 1960 book, “How to Make Money in Commodities”. The original version of the channel used simple moving averages and high-low price ranges for its calculations. This approach formed the basis of its methodology..
However, the Keltner Channel evolved over time, with Linda Bradford Raschke introducing significant modifications in the 1980s. She incorporated different averaging periods, an exponential moving average, and the average true range (ATR) for calculating the channel lines. This is the modern version traders now use today.
How reliable is the Keltner Channel?
The reliability of the Keltner Channel largely depends on the user’s implementation into a strategy. While the Keltner Channel can provide valuable insights into market trends and potential trading opportunities, it’s also a lagging indicator based on historical price data and may not always accurately predict future market movements.
Moreover, Keltner Channels can generate false signals, particularly in highly volatile markets or when the price is moving sideways. Selecting the optimal parameters for the EMA, ATR, and multiplier can also be challenging and may require a trial-and-error approach.


