- January 9, 2025
- 33 min read
Average Directional Index (ADX)
What Is the Average Directional Moving Index (ADX)?
The Average Directional Index (ADX) is a powerful technical analysis tool that helps traders and investors identify the strength of a trend in financial markets. Unlike other indicators that merely signal the direction of price movement, the ADX provides a clear measure of how robust a trend is, whether it’s moving upwards or downwards. By analysing the ADX values, traders can determine whether the market is trending strongly or if the trend is weak and potentially prone to false signals.
When applied to a price chart, the ADX indicator becomes an essential component of any trading strategy, offering insights that help traders filter out noise and make informed trading decisions. By focusing not just on the direction but the strength of the trend, the ADX can be used alongside other technical indicators to pinpoint optimal entry and exit points in a trading system, making it an indispensable tool for both active investors and technical analysts alike.
Average Directional Index (ADX) Indicator
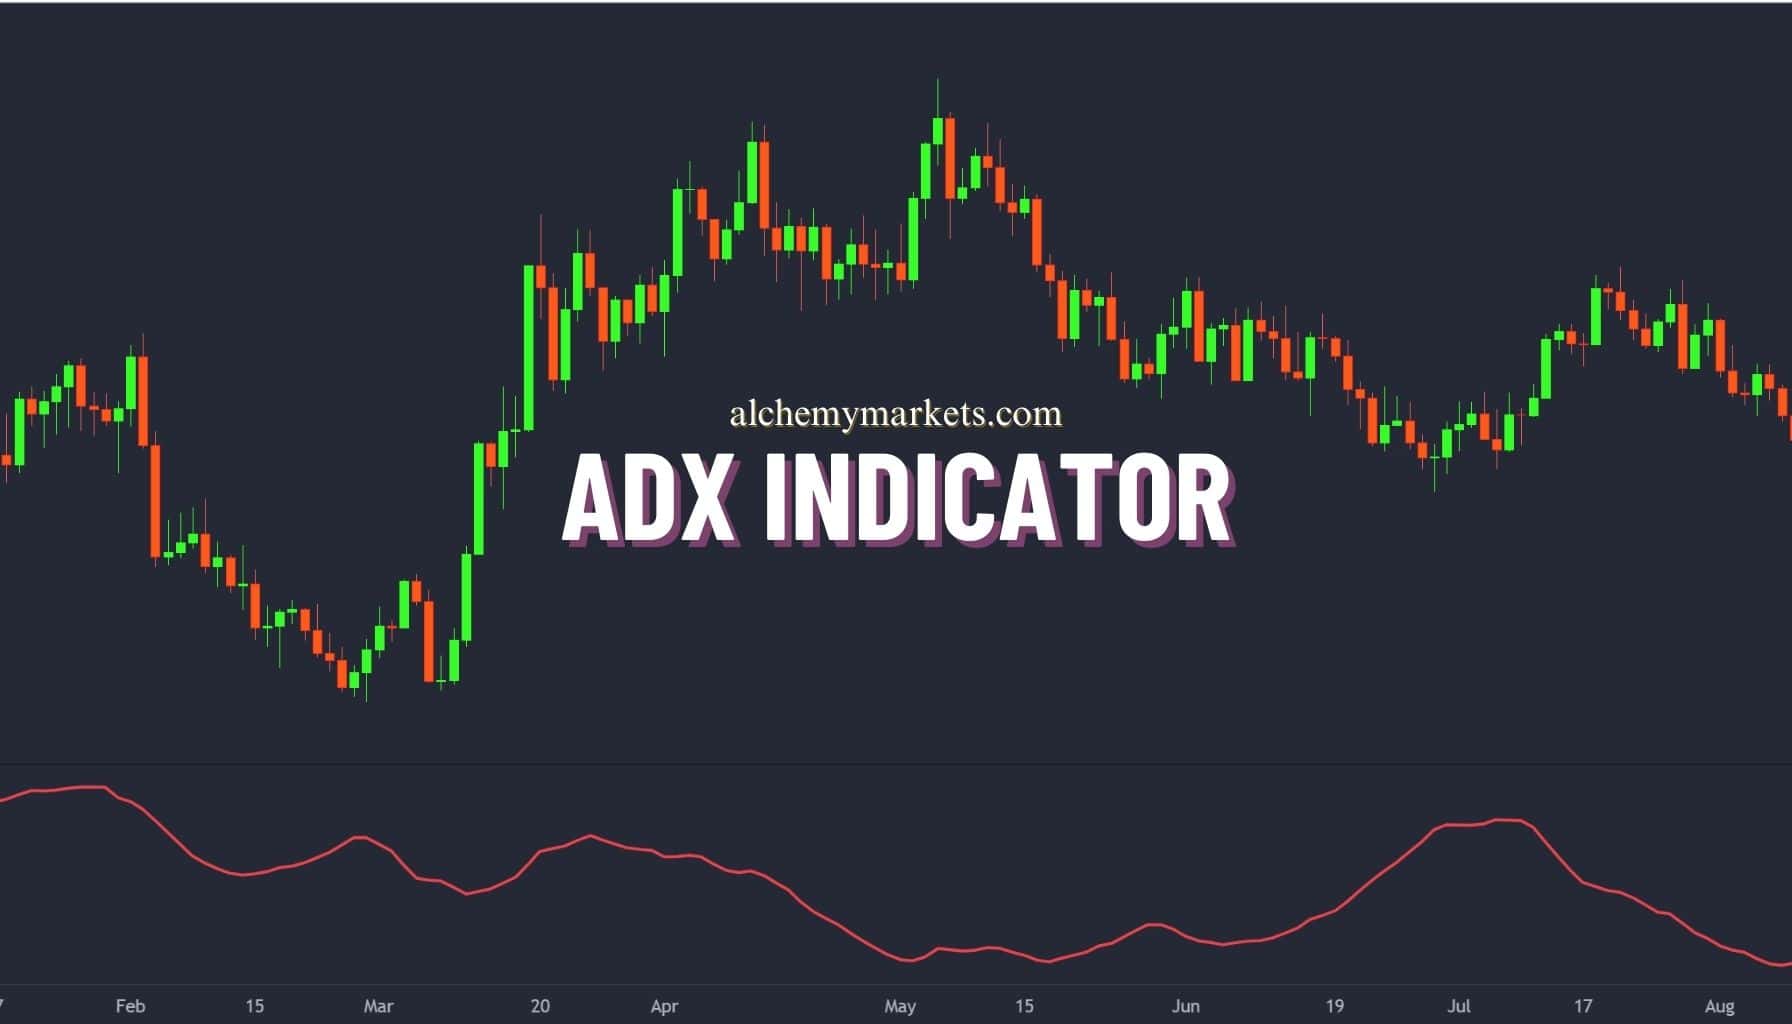
The chart above shows the ADX line applied to a daily price chart for Apple (AAPL) as one line plotted on a relative scale from 0 to 100. The indicator fluctuates between a high and low readings depending on the current trend’s strength, be it uptrend or downtrend.
Directional Movement Index (DMI) Indicator
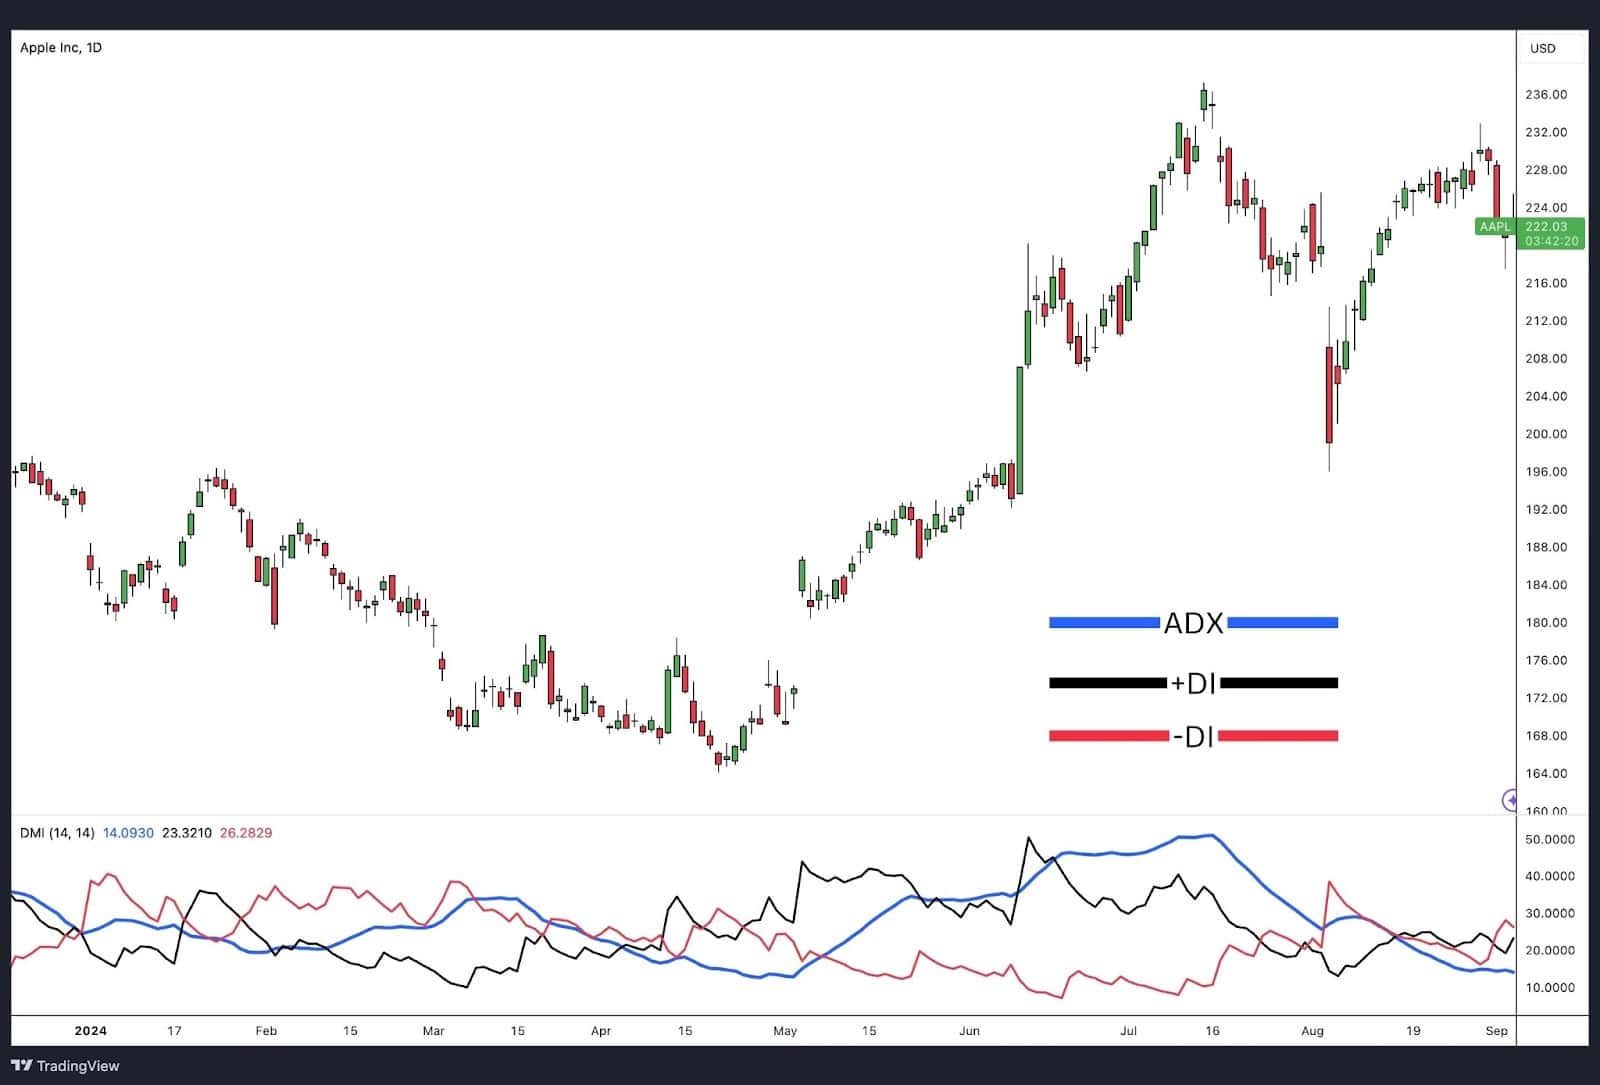
The Average Directional Index (ADX) is derived from a series of calculations that involve multiple directional movement indicators. At the core of this system are two crucial components: the Negative Directional Indicator (-DI) and the Positive Directional Indicator (+DI). Together with the ADX, these indicators form what is known as the Directional Movement Index (DMI). When plotted on a price chart, the DMI reveals the interplay between these three indicators, helping traders assess both the direction and determine trend strength.
On many trading platforms, the DMI is represented by three distinct lines—the ADX line, the +DI line, and the -DI line—often plotted together. In some instances, traders have the option to view these indicators separately, though the combined display is more common. Initially, the ADX plotted alone appears clean and easy to interpret, providing a straightforward view of trend strength. However, when combined with the Directional Indicators (DI), the DMI may seem like a confusing tangle of lines.
Despite its seemingly complex appearance, understanding the purpose and calculation of each line within the Directional Movement Index is essential. The +DI and -DI lines represent the directional movement system —whether positive or negative—while the ADX measures the trend’s strength without considering its direction. By deciphering these lines, traders can use the ADX to refine their trading strategies, enabling more precise trading decisions. This clarity transforms what initially appears chaotic into a powerful tool for navigating market trends and identifying potential trades.
Importance of ADX Indicator
Most technical analysis indicators are designed to forecast the direction of price movements, guiding traders on whether the market is likely to move up or down. However, the Average Directional Index (ADX) serves a different, yet equally critical purpose. Instead of predicting the direction, the ADX focuses on analysing and determining trend strength and momentum of a price. This unique role sets the ADX apart as a vital tool in any comprehensive trading strategy.
The ADX does not provide a directional signal on its own. Instead, it quantifies the trend strength, leaving the task of determining direction to other indicators, such as the Positive Directional Indicator (+DI) and Negative Directional Indicator (-DI), which are often used in tandem with the ADX. These directional movement indicators complement the ADX by helping traders identify the trend direction while the ADX measures the trend’s strength.
This distinctive characteristic of the ADX makes it indispensable in technical analysis. Many other indicators are effective at predicting the direction of price movements, but they fall short in determining trend strength or weakness of those movements. The ability to measure the strength of a trend is crucial, as it informs both the entry and exit points of a trade. For example, a strong trend, as indicated by a high ADX value, might signal a continued price movement, while a weak trend may suggest a potential trend reversal or price range expansion.
An ADX trading strategy enhances decision-making by providing clarity on whether a trend is strong enough to justify taking action. This can prevent traders from entering trades based on weak signals, thereby reducing the likelihood of false signals. By distinguishing between strong and weak trends, the ADX helps traders optimise their strategies, ensuring they only commit to trades when the trend’s momentum supports it.
In summary, the ADX is not just another technical indicator; it is the ultimate trend indicator that adds a critical layer of analysis to trading systems. By incorporating the ADX into your strategy, you gain the ability to filter signals, refine your trading decisions, and ultimately enhance your overall performance in the market.
How Does the ADX Work?
The primary function of the Average Directional Index (ADX) is to measure the intensity and momentum of a trend, regardless of whether that trend is upward or downward. Unlike other indicators that focus on the direction of price movements, the ADX provides insight into how strong a trend is, offering traders valuable information about the trend’s strength without indicating its direction.
Average Directional Index(ADX) Indicator
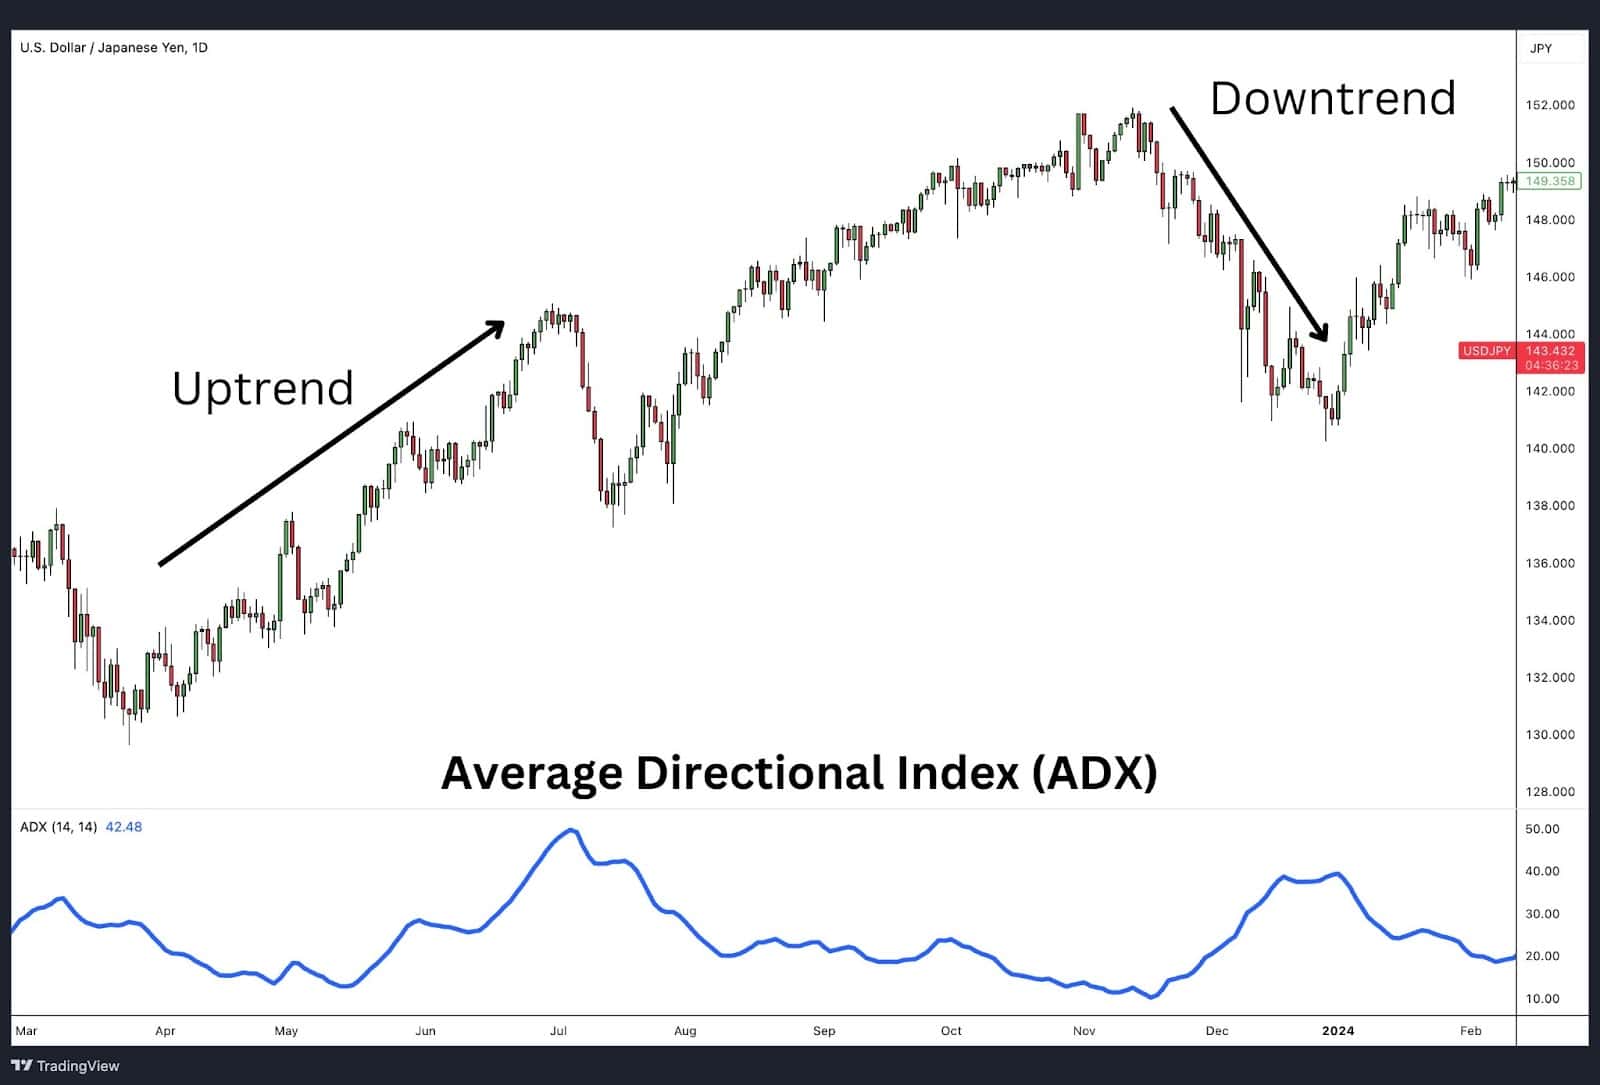
Consider the chart above, which displays the US Dollar/Japanese Yen (USDJPY) pair with daily price bars and the ADX plotted at the bottom. In the chart, the section marked “Up Trend” illustrates an upward price movement. Correspondingly, the ADX line also rises, signifying a strong upward trend. Similarly, the section labelled “Downtrend,” prices trend lower, yet the ADX continues to move upward, indicating a robust downward trend.
The ADX works by reflecting the momentum of a price movement—whether it’s an uptrend or a downtrend—through its readings on a scale. As the price movement gains momentum, either upward or downward, the ADX reading increases, signalling a stronger trend. The slope of the ADX line, or its rate of change, further helps traders gauge the strength of the prevailing trend. A steeper slope indicates a rapid increase in trend strength, while a flatter slope may suggest a weaker trend or a potential slowdown.
For many traders, these ADX readings are crucial for making informed trading decisions. A rising ADX line generally suggests that the trend—whether up or down—is gaining strength, while a falling ADX line may indicate a weakening trend or the beginning of a consolidation phase. By focusing on the ADX values and their changes, traders can better understand the trend’s momentum and adjust their strategies accordingly, enhancing their ability to identify potential trades and avoid false signals.
In summary, the ADX is an essential tool for any trader looking to determine trend strength. By understanding how the ADX works and interpreting its readings correctly, traders can make more informed decisions, improving their chances of success in the market.
What Does the ADX Tell You?
The Average Directional Index (ADX) is a unique technical indicator in that it does not predict the direction of price movements in financial markets. Instead, it is designed specifically to analyse and measure the strength and momentum of a trending price movement. Interestingly, the ADX can also reveal when a trend is lacking in strength, which can be just as valuable for traders. This versatility makes the ADX an essential tool for both the entry and exit points of a trading strategy.
Average Directional Index(ADX) Indicator
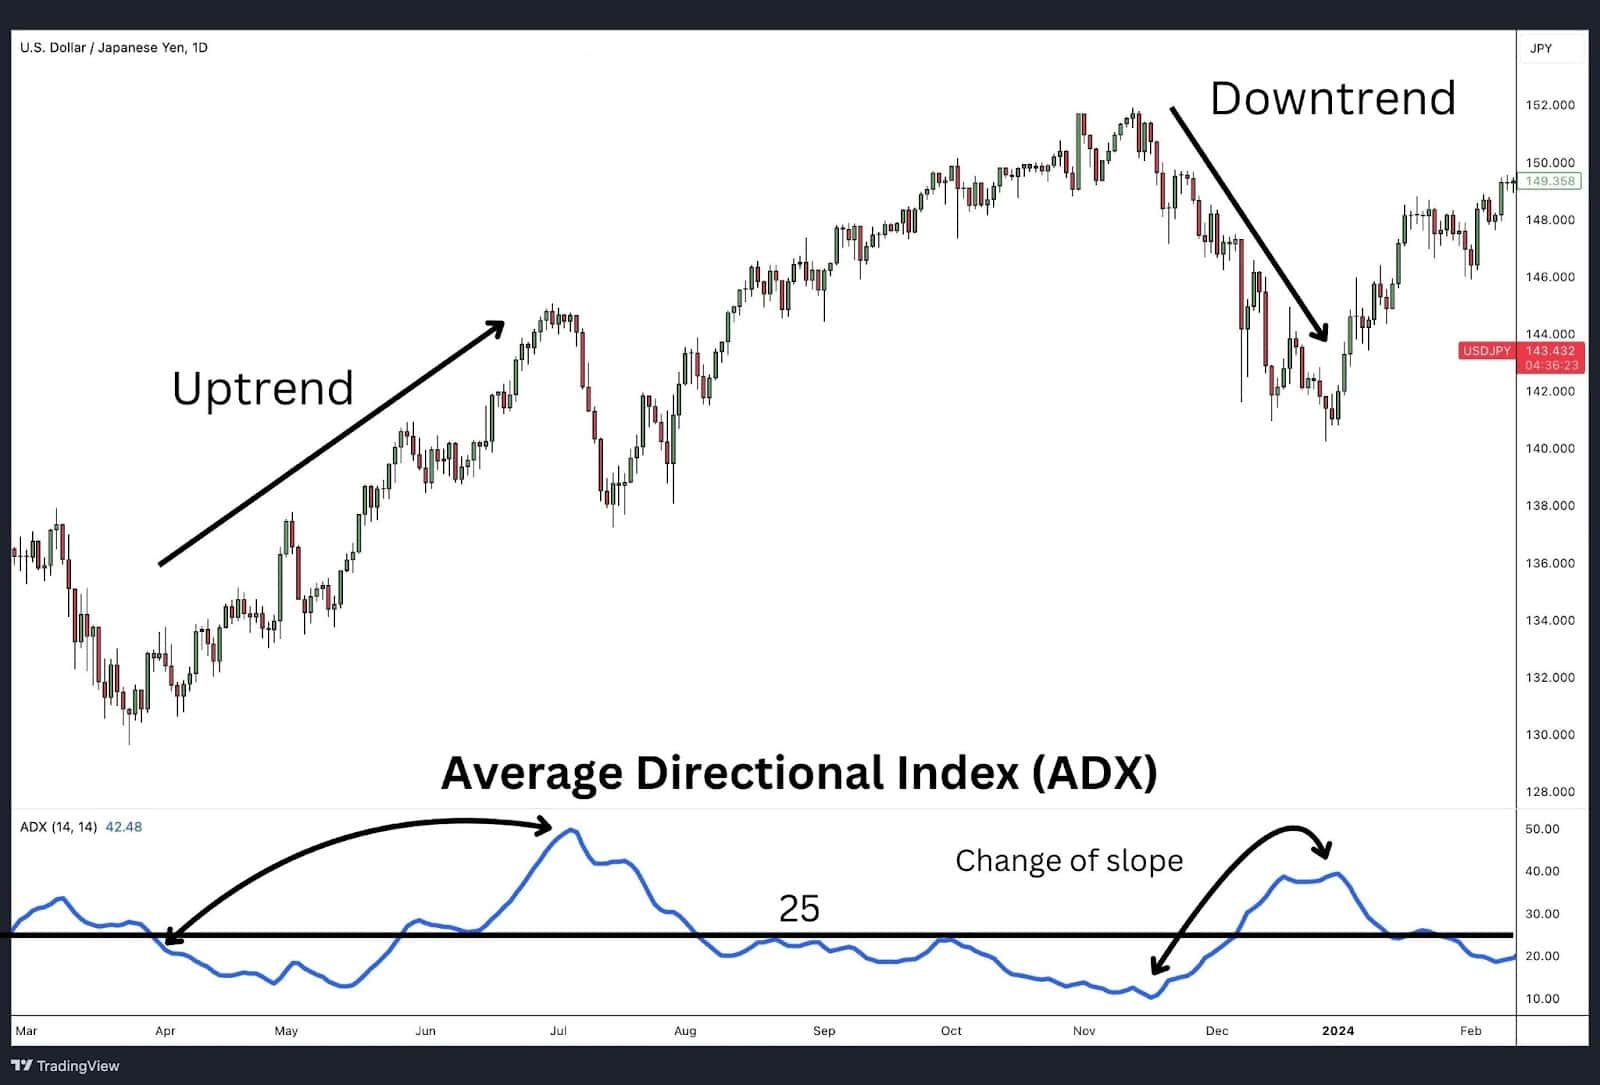
The chart above illustrates how significant changes in the slope of the ADX correspond with shifts in the strength of price movements, occurring in both uptrends and downtrends.
• Uptrend Example: In an uptrend move, the ADX slope turns upward and crosses above the critical level of 25, while the corresponding price action makes a strong upward move. As the ADX turns sharply downward, this indicates that the upward momentum is dissipating.
• Downtrend Example: Similarly, in downtrend move, the ADX slope again turns upward and crosses above 25, signalling a strong downward move in price. When the ADX begins to slope sharply downward, the strong downward momentum also starts to wane.
In both cases, a steep upward slope in the ADX suggests that there is sustained price movement, either up or down, with enough momentum to create a good trading opportunity. Conversely, a sudden pivot in the ADX’s direction may indicate the beginning or end of a trending price movement. On the other hand, a flat ADX with low readings typically signals a directionless, non-trending, and range-trading market where price movements are weak and uncommitted.
Flat ADX Example

In summary, the ADX is not just about identifying trends; it’s about understanding the strength and momentum behind them. By interpreting these signals, traders can make more informed decisions, avoiding false signals and capitalising on genuine trading opportunities. This makes the ADX an indispensable part of any trader’s toolkit, allowing them to adapt their strategies based on the trend’s strength and market conditions.
Quantifying Trend Strength
While the Average Directional Index (ADX) is effective at identifying the presence of a trend, it also excels in quantifying the strength of that trend. In the previous section, we discussed how the ADX can signal the existence of a trend when its value crosses above the 25 level, combined with an upward slope. This threshold is crucial for confirming that a trend—whether upward or downward—is underway. However, the ADX does more than just detect trends; it also measures their intensity.
Table: Average Directional Index (ADX) Scale Categories
| ADX Trend Strength Category | ADX Value |
| Extremely Strong Trend | 75 to 100 |
| Very Strong Trend | 50 to 75 |
| Strong Trend | 25 to 50 |
| Weak or No Trend | 0 to 25 |
As the ADX continues on an upward trajectory on the plotted scale, the strength of the trend increases as noted in the table above.
Average Directional Index (ADX) Below 25
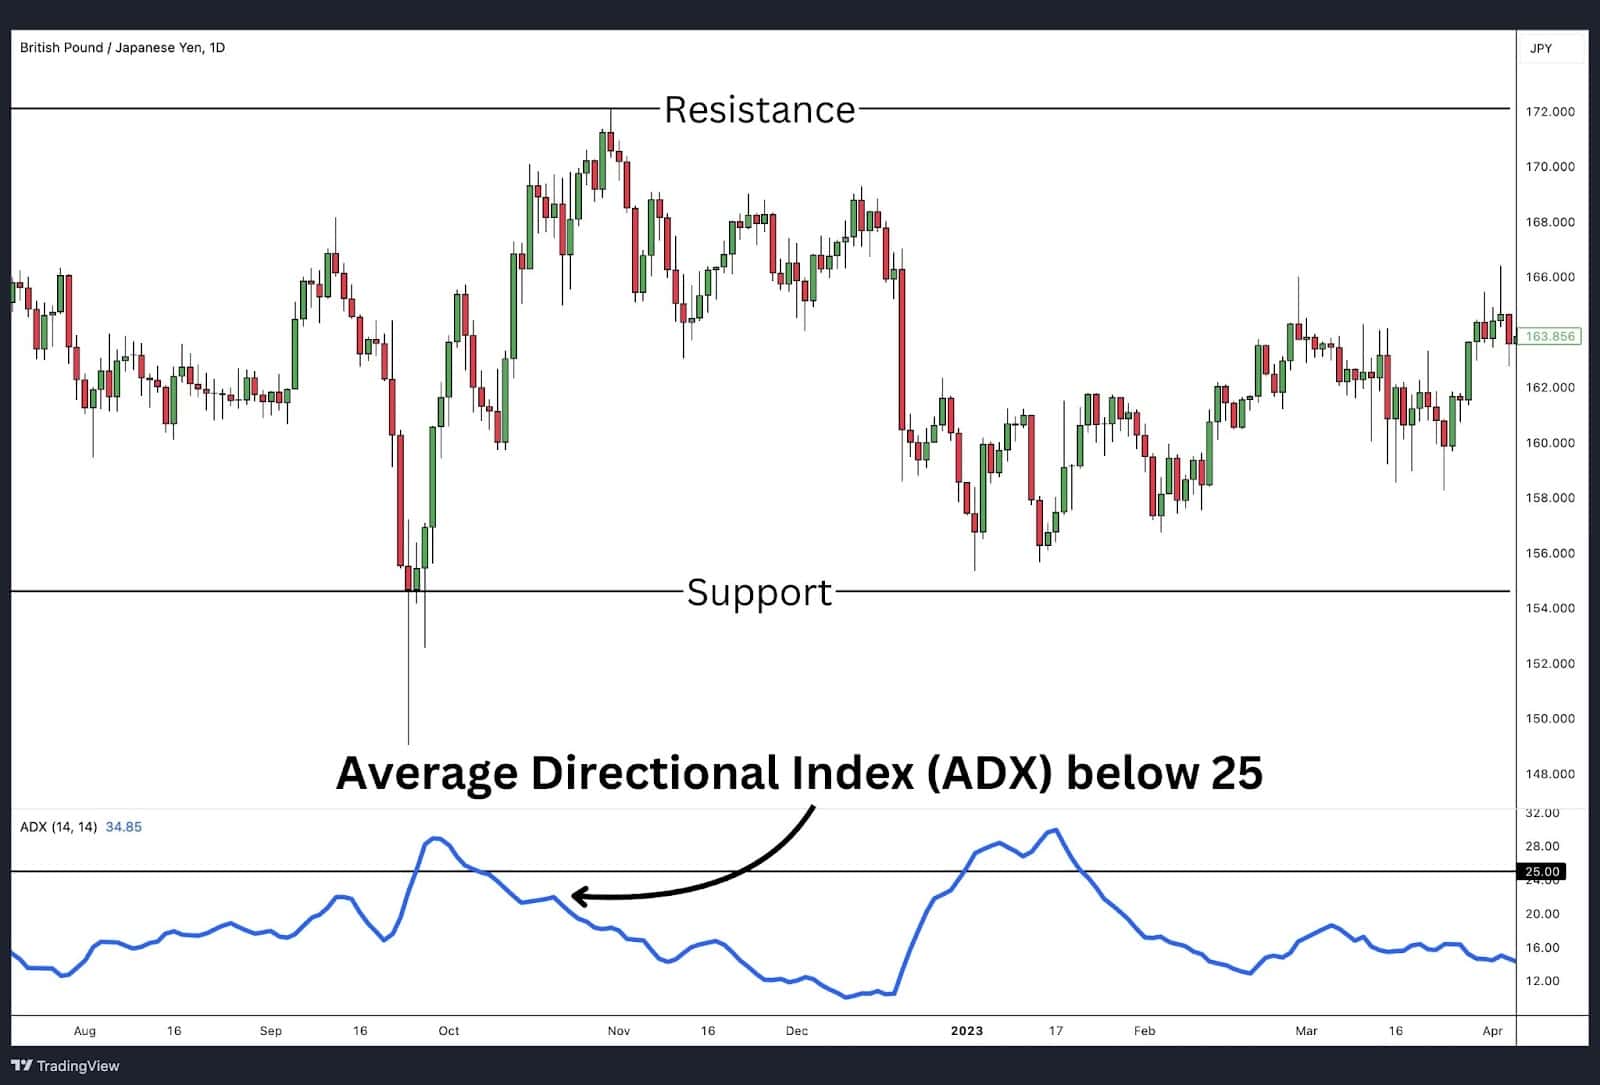
An ADX reading below 25 indicates a very weak trend or a lack of trend altogether. For example, the chart above shows the British Pound/Japanese Yen (GBP/JPY) forex pair, where price action remained in a sideways non-trending range from June 2022 to June 2023. Throughout this period, the ADX value stayed below 25, signalling the absence of a meaningful trend in either direction. Traders, depending on their strategy, would typically adjust their approach in such a low-trend environment, possibly focusing on range trading or waiting for stronger signals before entering a trade.
Average Directional Index (ADX) at 25 to 50
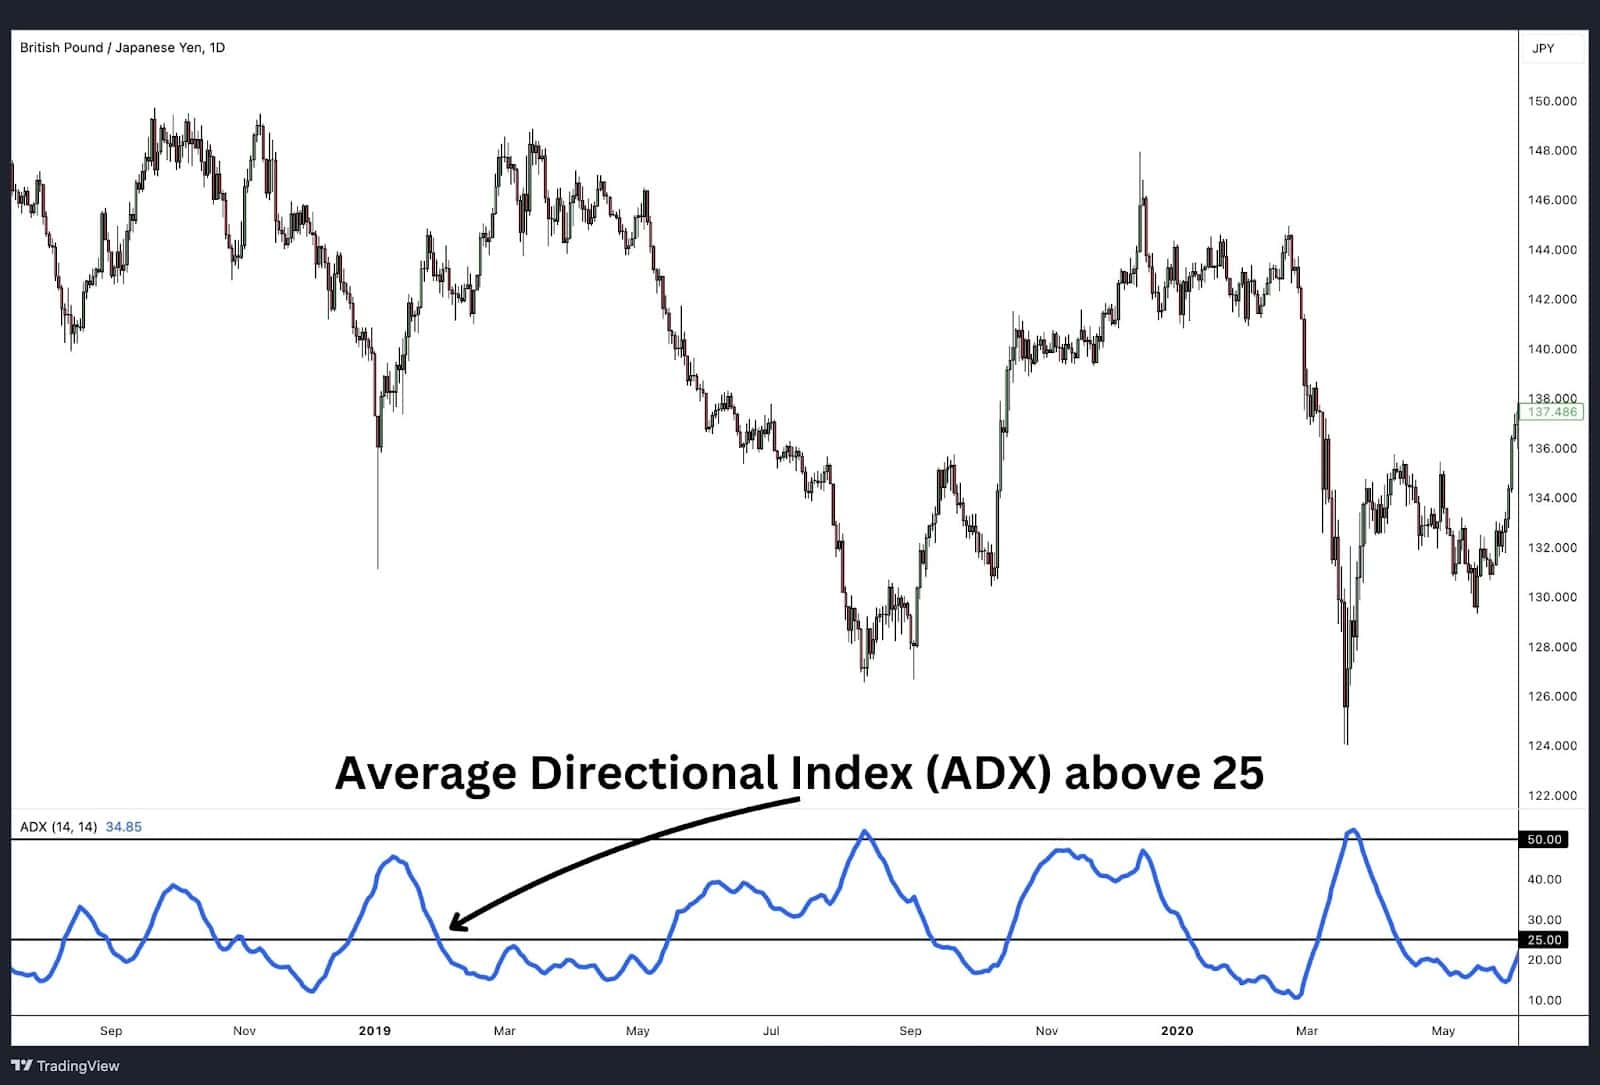
The range between 25 and 50 on the ADX scale is where most typical trends—whether uptrends or downtrends—are identified. The chart for the British Pound/Japanese Yen (GBP/JPY) pair, covering the period from July 2018 to October 2020, illustrates this well. During this time, the price experienced multiple strong, prolonged moves in both directions, with the ADX indicator spending the majority of the time ranging between 25 and 50. This level of ADX suggests a solid trend is in place, providing traders with confidence in the trend’s strength and guiding their trading decisions.
Average Directional Index (ADX) Above 50
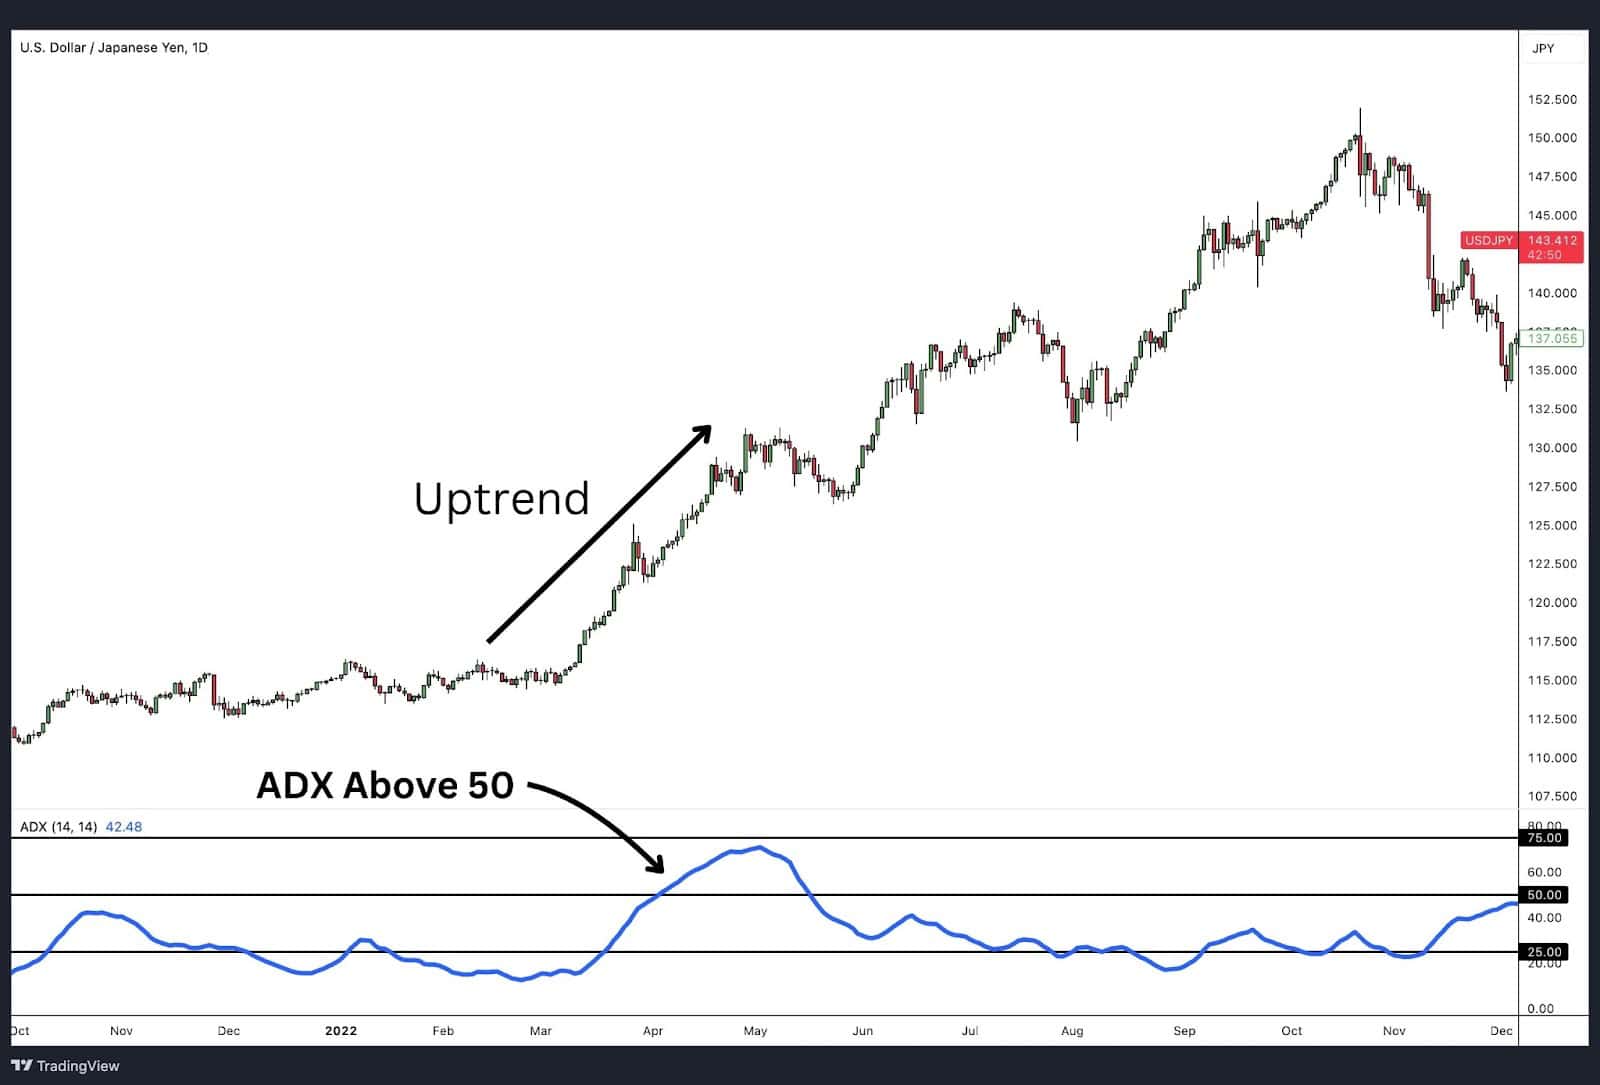
When the ADX rises above 50, it indicates the market is experiencing a very strong trend. As shown in the daily price chart of the US Dollar/Japanese Yen (USD/JPY) forex pair, these instances are relatively rare but signify powerful trending price movements. Such a high ADX reading suggests that the trend, whether upward or downward, has significant momentum, offering traders an opportunity to capitalise on a clear and robust trend.
ADX Above 75
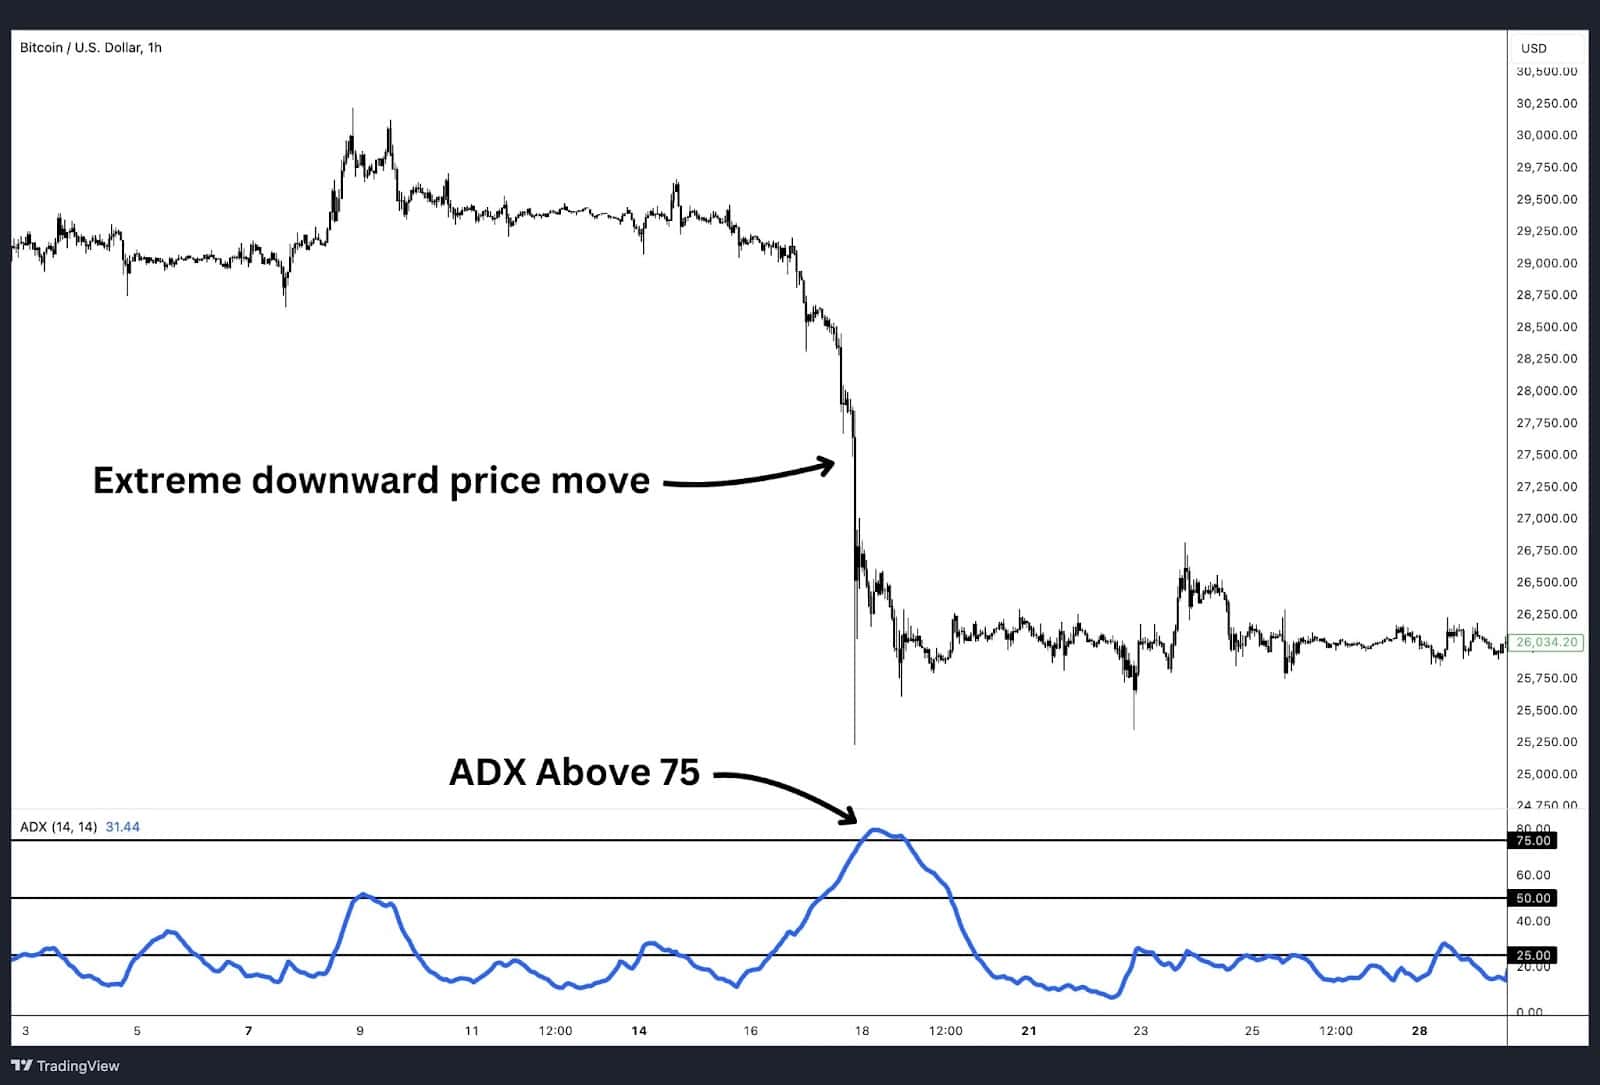
An ADX reading of 75 or higher is extremely rare and typically occurs in highly volatile markets, often on smaller time frames. For example, the 60-minute chart of the Bitcoin/US Dollar pair demonstrates this scenario. Bitcoin, known for its volatility, experienced an extreme downward price movement, which corresponded with a sharp spike in the ADX to the 75 level. Such extreme ADX readings usually indicate a market in a state of intense, rapid movement, presenting both high risk and potentially high reward for traders who can navigate the volatility.
Average Directional Index (ADX) Formula
The Average Directional Index(ADX) is derived from a series of calculations of which the final calculation is the following general formula:
ADX = [(Prior ADX x 13) + Current ADX] / 14
Where ADX is the average of DX. In the case of the above example ADX is a 14-period simple moving average of the Directional Index(DX). To understand the formula and how it functions it is necessary to breakdown and explain each component of the formula, beginning with the DX.
The formula for the Directional Index(DX) is as follows:
DX = ( |+DI – -DI| / |+DI + -DI| ) x 100
Where:
+DI is Positive Directional Indicator
-DI is Negative Directional Indicator
The formula above dictates that DX is equal to the absolute value of the difference of +DI and -DI divided by the absolute value of the sum of the same, all multiplied by 100.
Now to break down the DX calculation requires an explanation of the +DI and the -DI. First the formula for calculating the +DI is as follows:
+DI = 100 x Smoothed Positive Directional Movement (+DM) / Average True Range
Where:
Smoothed Positive Directional Movement (+DM) = 14-period simple moving average of (current high – previous high)
Average True Range(ATR) = 14-period simple moving average of True Range (TR)
True Range (TR) = the greater of the (current high – current low) OR (current high – previous close) OR (current low – previous close).
Similarly, the formula for calculating the -DI is as follows:
-DI = 100 x Smoothed Negative Directional Movement (-DM) / Average True Range
Where:
Smoothed Negative Directional Movement (-DM) = 14-period simple moving average of (current Low – previous Low)
Average True Range(ATR) = 14-period moving average of True Range (TR)
True Range (TR) = the greater of the (current high – current low) OR (current high – previous close) OR (current low – previous close).
In oversimplified terms, the ADX starts by taking the average of the positive directional movement and the negative directional movement separately. It uses a 14-period smoothed moving average to make the DX values less volatile.
Those DX values are then run through a calculation for the ADX with the resulting DX values averaged again. There are two different smoothed moving averages taking place to even out the results of each calculation so the ADX value does not wildly gyrate based on typical market movements.
Calculating the ADX
Calculating the Average Directional Index (ADX) involves a series of steps that start with the most basic calculations and build up to the final ADX value. Each step in this process relies on the preceding one, making it essential to follow the sequence accurately. Below is a detailed breakdown of the calculation steps:
- TR (True Range)
- Average True Range (ATR);
- Positive Directional Movement (+DM);
- Negative Directional Movement (-DM)
- Positive Directional Indicator (+DI)
- Negative Directional Indicator (-DI)
- Directional Index (DX)
- Average Directional Index (ADX)
Step 1: Calculate the True Range (TR)
The first step is to calculate the True Range (TR). This measures the greatest difference between:
- The current period’s high and low,
- The absolute value of the difference between the current period’s high and the previous period’s close,
- The absolute value of the difference between the current period’s low and the previous period’s close.
The TR represents the largest price movement over a given period, reflecting the volatility of the market.
Step 2: Calculate the Average True Range (ATR)
Next, take a simple average of the last 14 TR values to obtain the Average True Range (ATR). The ATR smooths out the TR values over a given period (typically 14 periods) and serves as a key component in the calculation of the directional movement indicators.
Steps 3 & 4: Calculate Positive and Negative Directional Movement (+DM and -DM)
Now, calculate the Positive Directional Movement (+DM) and Negative Directional Movement (-DM) for the prior 14 periods:
- +DM is the difference between the current high and the previous high, if the current high is higher.
- -DM is the difference between the previous low and the current low, if the current low is lower.
Take a simple moving average of the 14 +DM and -DM values to obtain the “smoothed” +DM and -DM calculations. This helps keep the average relatively stable over the past 14 periods.
Step 5: Calculate the Positive Directional Indicator (+DI)
To calculate the Positive Directional Indicator (+DI), divide the smoothed +DM by the ATR, then multiply the result by 100. This step standardised the directional movement system as a percentage of the ATR, making it easier to compare across different markets and timeframes.
Step 6: Calculate the Negative Directional Indicator (-DI)
Similarly, calculate the Negative Directional Indicator (-DI) by dividing the smoothed -DM by the ATR and multiplying by 100. Like the +DI, this standardised the directional movement system, allowing traders to gauge the relative strength of upward versus downward movement.
Step 7: Calculate the Directional Index (DX)
With both the +DI and -DI calculated, the Directional Index (DX) can be determined. The DX is calculated by taking the absolute value of the difference between +DI and -DI, dividing it by the absolute value of the sum of +DI and -DI, and then multiplying by 100. This value represents the divergence between the upward and downward movements, highlighting the strength of the prevailing trend.
Step 8: Calculate the Average Directional Index (ADX)
Finally, take a 14-period simple moving average of the DX values to obtain the Average Directional Index (ADX). The ADX smooths out the DX values over time, providing a clear measure of trend strength by removing the noise and whipsaws of the market prices. This formula works regardless of whether the market is trending up or down.
By following these steps, traders can accurately calculate the ADX and use it to assess the strength of market trends, helping to make more informed trading decisions.
Adjusting the ADX Inputs and Values
The ADX is usually set to 14 periods by default, which offers a good middle ground between being quick to react and reliable. Shortening the period (e.g., to 7 or 10) makes the ADX more sensitive, so it picks up trends faster, but this can also mean more false alarms. On the other hand, using a longer period (e.g., 20 or 28) smooths out the noise and focuses on stronger, long-term trends—but it may lag behind when a trend is just starting.
Another thing to consider is optimizing ADX thresholds, often set at 25. In markets that are more volatile or unpredictable, increasing this threshold (to 30, for example) can help filter out the smaller, less meaningful trends. In quieter markets, lowering the threshold to 20 can help catch trends earlier. Adjusting both the period and optimizing ADX thresholds allows the ADX to fit better with different market conditions and trading styles, making it a more flexible tool for traders.
Average Directional Index (ADX) Example
Average Directional Index (ADX) on MSFT
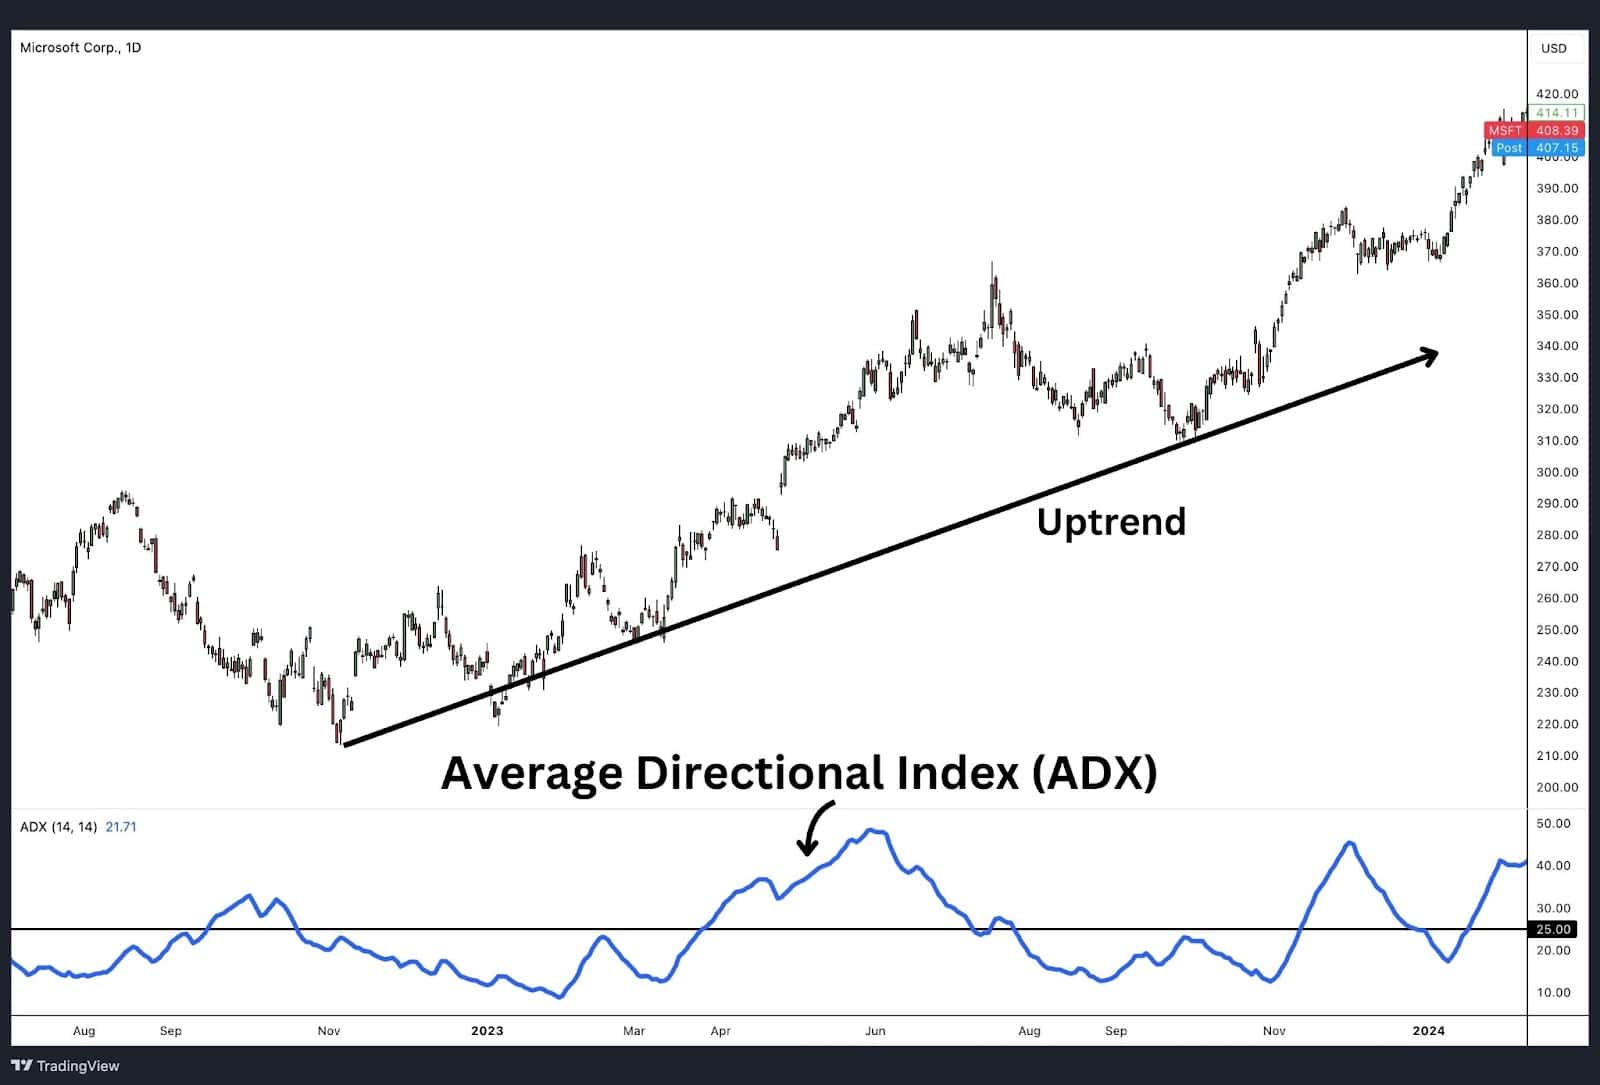
The chart above presents a daily view of Microsoft (MSFT). The price action shows a steady uptrend, with the Average Directional Index (ADX) consistently reflecting this strength. As the price makes upward movements, the corresponding ADX readings remain mostly above the critical level of 25, signalling a strong trend. However, when the upward momentum begins to wane, the ADX dips below 25, indicating a weakening trend. This behaviour of the ADX helps traders identify when a trend is gaining or losing strength, providing valuable insights for both entry and exit strategies.
Average Directional Index(ADX) on GBP/USD
In the daily chart of the British Pound / US Dollar (GBP/USD) forex pair, the price action demonstrates a steady downtrend. Similar to the MSFT chart, the ADX readings increase above 25 as the price moves downward, confirming the strength of the downtrend. When the downward momentum diminishes, the ADX dips below 25, signalling a potential reduction in trend strength. This pattern highlights how the ADX can be used to gauge the intensity of downtrends, helping traders make informed decisions about their trading strategies.
Average Directional Index(ADX) on Bitcoin

The chart above shows a 60-minute view of the Bitcoin / US Dollar (BTC/USD) pair. This chart illustrates a market with two distinct uptrends with a trendless period in the middle. Swing traders may see these uptrend phases and use them to position long when the ADX indicator rises above 25, confirming the strength of the upward price movements. However, during the trendless period, the ADX dips below 25, indicating a lack of strong directional movement in the market. This example demonstrates the ADX’s ability to differentiate between trending and non-trending markets, providing traders with critical information on when to engage or hold back from trading.
By examining these examples across different assets—Microsoft, GBP/USD, and Bitcoin—it becomes evident how the Average Directional Index (ADX) can be effectively used to measure and confirm the strength of trends in various markets. Whether in stocks, forex, or cryptocurrencies, the ADX remains a versatile tool for traders seeking to capitalise on both strong trends and periods of market consolidation.
Average Directional Index Trading Strategies
The Average Directional Index (ADX) is a powerful tool for measuring the strength of a trend, but it does not predict the direction of price movements. As a result, it is effective when combined with other technical analysis indicators that can provide directional cues. Below are some popular trading strategies that integrate the ADX with other indicators to enhance trading decisions.
Trend Strength: ADX with Moving Average
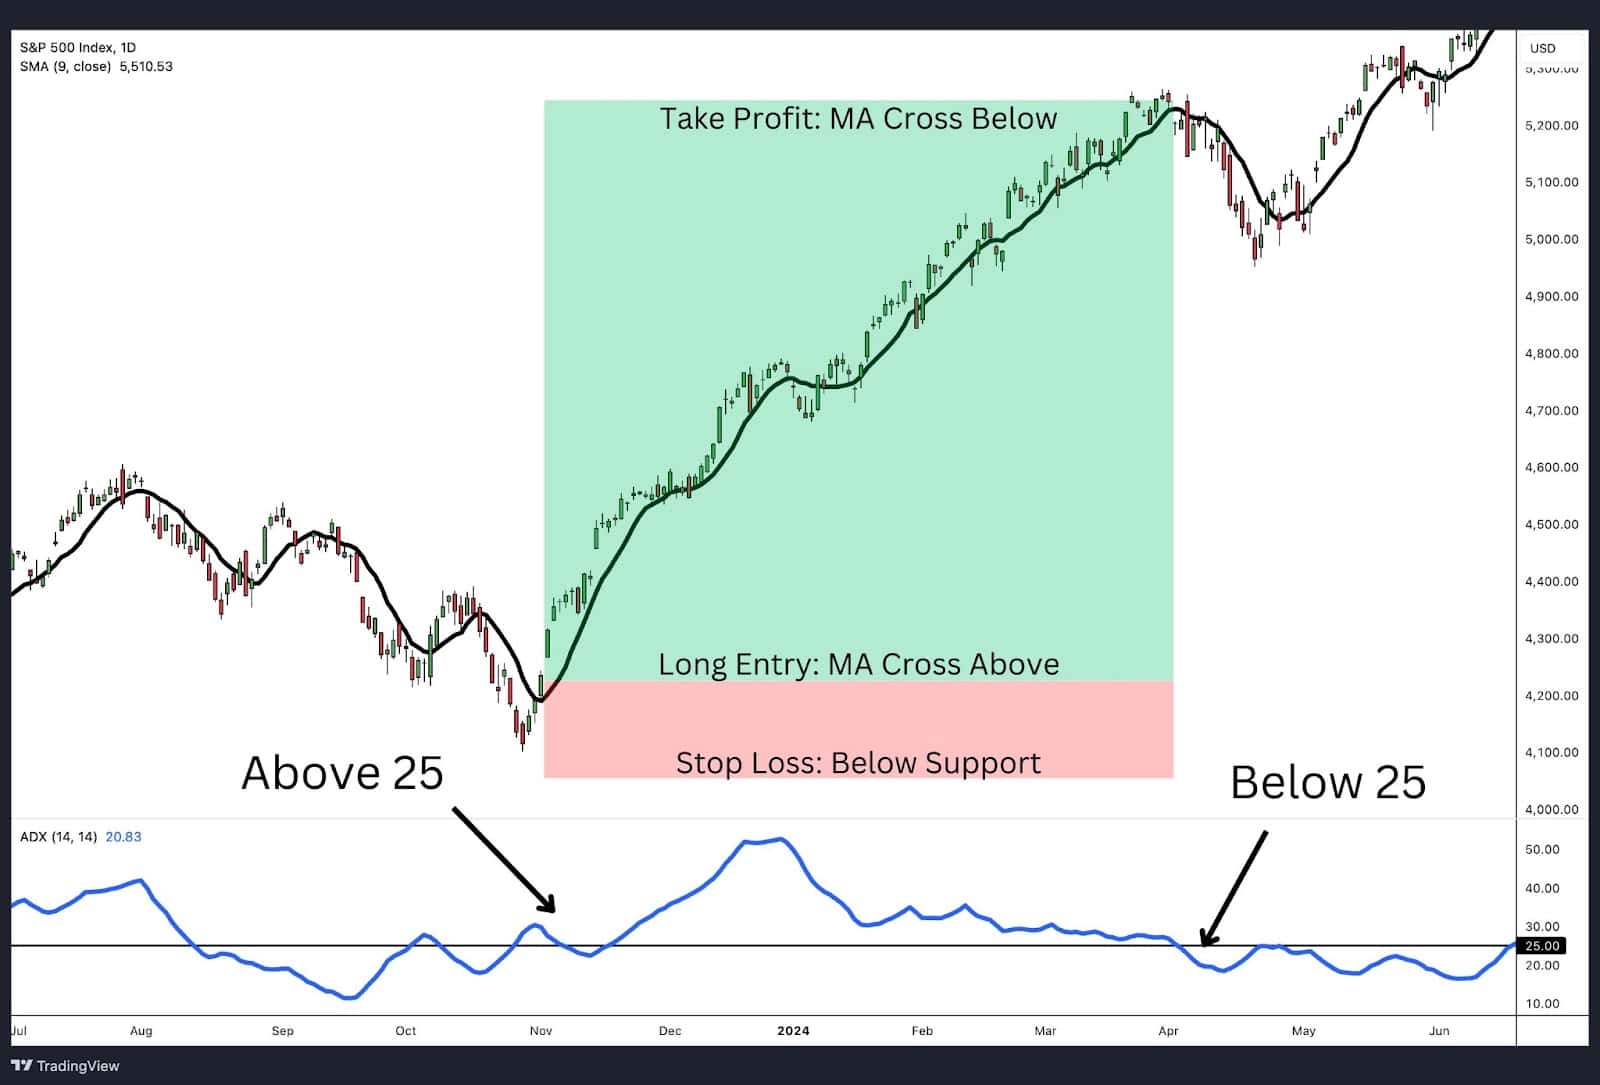
One effective strategy involves using the ADX in conjunction with a moving average. The chart above illustrates an ADX trading strategy for S&P 500 Index Futures where an ADX reading above 25 is required as a condition for trade entry, and a moving average crossover serves as the entry trigger. Specifically, the trade is initiated when the ADX indicates a strong trend (above 25) and the price crosses above the moving average.
For trade exits, the strategy is the reverse: as long as the ADX remains above 25, the uptrend is considered strong. However, if the ADX dips below 25 and the price crosses below the moving average, it signals that the trend’s strength is diminishing, suggesting it is time to exit the trade. This combination helps filter out false signals and ensures trades are only taken when the trend has sufficient momentum.
Crossovers: ADX with MACD Crossover
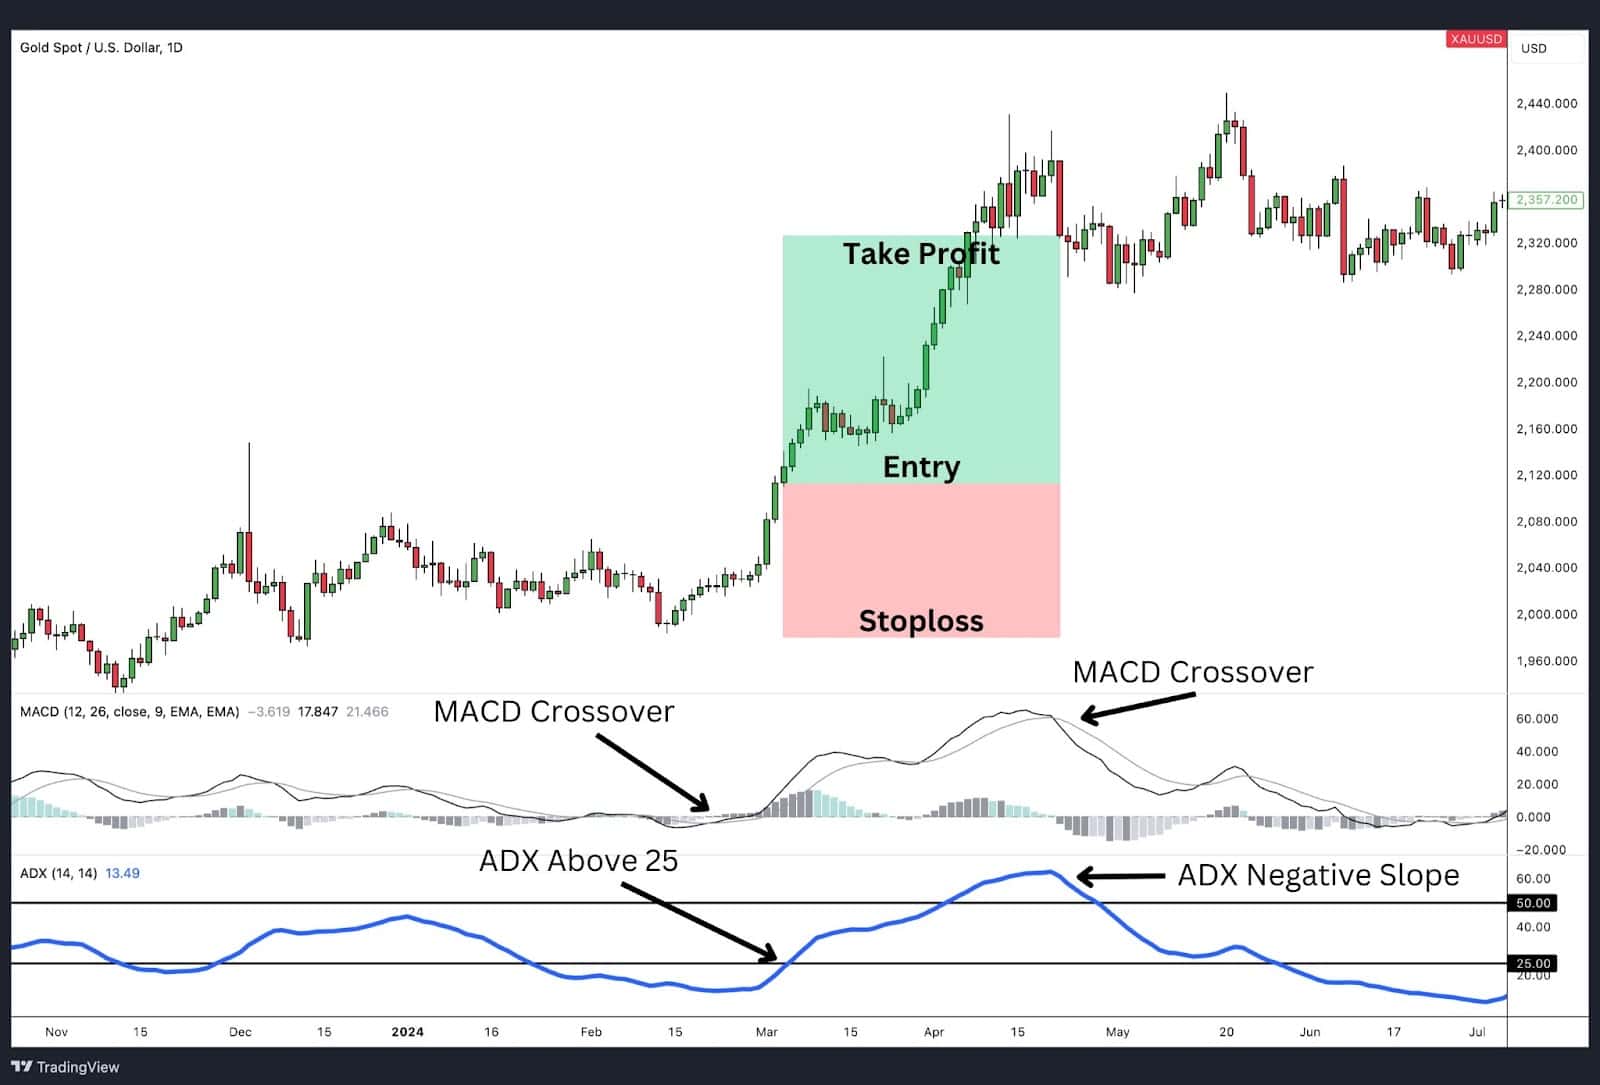
Another popular approach is combining the ADX with the MACD (Moving Average Convergence Divergence) indicator, which uses crossover signals to trigger trades. The chart above shows an ADX trading strategy for Gold Futures where a MACD crossover, combined with an ADX reading above 25 and a positive slope, triggers a trade entry.
The exit strategy is activated when the MACD crosses in the opposite direction, and the ADX slope turns negative, even if the ADX reading is still above 25. For instance, in the example provided, the ADX reading is above 50 at the time of exit, but the downward slope indicates a weakening trend momentum. This strategy is particularly useful for capturing strong trends and exiting before the trend loses its steam.
Finding Ranges: ADX with Range Bound Price Action
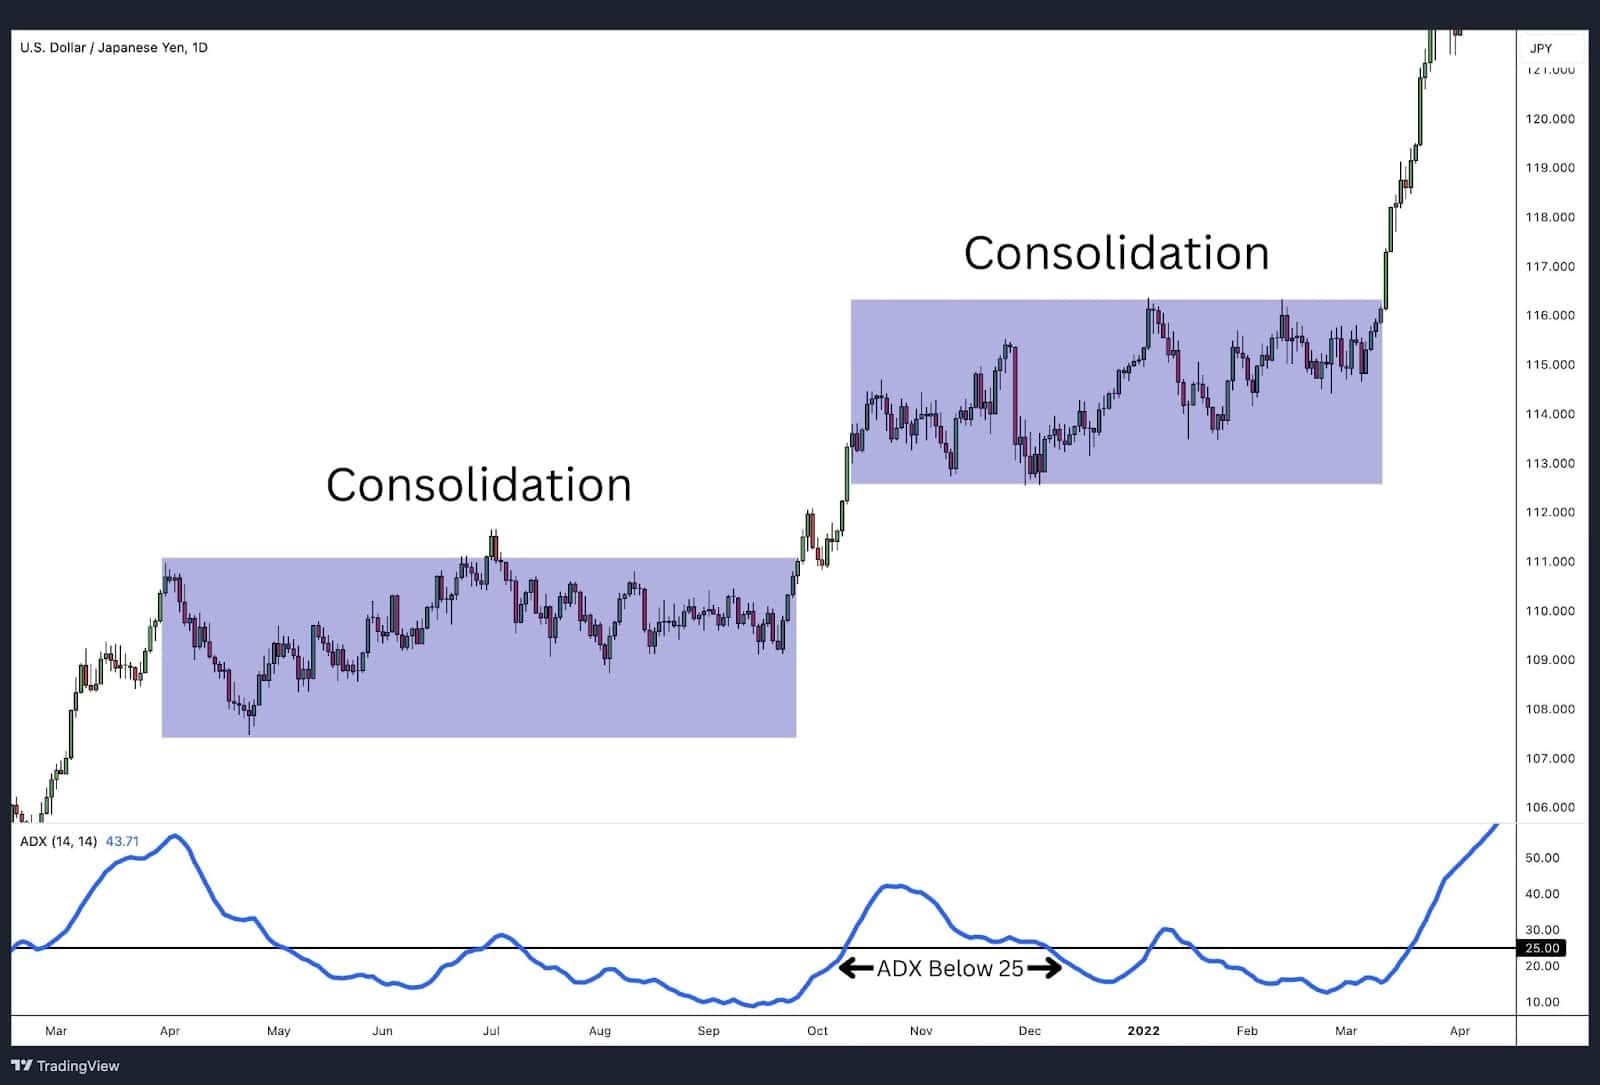
The ADX is also useful for identifying price ranges when used in conjunction with support and resistance levels. The chart above displays a daily view of the US Dollar/Japanese Yen (USD/JPY) forex pair, where two distinct trading ranges are visible. During these non-trending markets, the ADX typically stays below 25, reflecting the lack of a strong trend.
By recognising these low ADX readings within defined support and resistance levels, traders can identify non-trending markets and adjust their strategies accordingly, perhaps opting for range trading rather than trend-following strategies.
Identifying Breakouts: ADX with Range Breakout

The same technique used to identify price ranges can also be employed to spot breakouts from these ranges. The chart above illustrates a breakout strategy for the US Dollar/Japanese Yen (USD/JPY) forex pair. When the price breaches a significant resistance level, the ADX reading subsequently crosses above 25 (marked in green), confirming the breakout.
This strategy allows traders to distinguish between genuine breakouts and false signals, ensuring they capitalise on new trends as they emerge from previously non-trending markets.
Common Challenges that Traders Faced When using ADX?
While the Average Directional Index (ADX) is a valuable tool for assessing the strength of price movements, it does come with certain limitations that traders need to be mindful of. Understanding these challenges can help traders use the ADX more effectively and avoid common pitfalls.
1. Lack of Directional Indication
One of the primary limitations of the ADX is that it does not indicate the direction of price movement. The ADX solely measures trend strength, which means it cannot be used in isolation to generate trading signals. Traders must pair the ADX with other technical indicators that provide directional cues, such as Moving Averages, MACD, or Directional Movement Indicators (DMI), to make informed trading decisions.
2. Lagging Effect
The ADX, due to the complexity of its calculation, can suffer from lagging effects. This lag is especially noticeable during periods of high volatility, where the market experiences rapid accelerations or sharp reversals. In such scenarios, the ADX may react too slowly, potentially causing traders to miss out on timely entry or exit points. Being aware of this lag is crucial, particularly in fast-moving markets.
3. Need for Optimisation
The standard ADX settings—such as the 14-period lookback and a level threshold of 25 may not be optimal for all instruments or timeframes. Different markets and timeframes can exhibit different price behaviours, meaning the ADX settings may need to be adjusted to suit specific conditions. For some trends, the standard settings might work well, but for others, they might not capture the true strength of the trend effectively. Traders should consider experimenting with different lookback periods and optimize ADX threshold levels for their specific trading strategy.
Advantages of Using Average Directional Index (ADX)
Despite some challenges, the Average Directional Index (ADX) offers several compelling advantages that often outweigh its limitations. Here are the key benefits of an ADX trading strategy:
1. Measures Trend Strength
The primary advantage of the ADX is its ability to measure the strength of a trend. By quantifying both momentum and trend strength, the ADX provides clear signals when a trend is gaining or losing momentum. This makes it an invaluable tool for traders who need to know not just the direction of the market, but the intensity of the trend behind it.
2. Versatile Across All Time Frames
Unlike many technical indicators that perform better on longer time frames, the ADX is effective across all time frames—whether you’re analysing a minute-by-minute chart or a daily chart. This versatility allows traders to use the ADX consistently, regardless of the time frame they prefer to trade in.
3. Simplicity and Ease of Interpretation
The ADX is also praised for its simplicity. With just two inputs and a single line output, the ADX is straightforward to use and interpret. Traders can easily determine trend strength with the following guidelines:
• Readings below 25 indicate a weak or non-existent trend.
• Values between 25 and 50 signal a strong uptrend or downtrend.
• Readings above 50 suggest a very strong trend.
• Values over 75 reflect an extremely strong trend, whether up or down.
Disadvantages of Using Average Directional Index (ADX)
Like any technical indicator, the ADX is not without its limitations. Here are some of the drawbacks traders should be aware of:
1. Susceptible to Whipsaws and False Signals
The ADX can be prone to whipsaws and false signals, especially in highly volatile markets. Since the ADX measures averages over several calculations, sudden market movements can cause large swings in the ADX readings, potentially leading to inaccurate signals.
2. Less Effective in Range-Bound Markets
While the ADX excels in trending markets, it is less reliable in non-trending or range-bound markets. During periods where the price is moving sideways, the ADX may provide weak or misleading signals. For this reason, it is often beneficial to use the ADX as part of a broader strategy that filters out range-bound market conditions.
Average Directional Index vs. The Aroon Indicator
The Average Directional Index (ADX) and the Aroon Indicator share a common purpose: measuring the strength of a market trend. However, there are significant differences in how they achieve this goal and the information they provide to traders.
1. Calculation Methods:
• The ADX is calculated based on the price differences between current highs/lows and prior highs/lows. This calculation focuses on the magnitude of price movements, which helps in assessing the overall trend strength.
• In contrast, the Aroon Indicator is calculated based on the amount of time between the most recent highs and lows. This time-based approach provides insights into how long it has been since the market made new highs or lows, which helps identify emerging trends.
2. Directional Indication:
• A key distinction between the two indicators is that the ADX does not provide any directional information. The ADX solely measures the strength of the trend, whether it is an uptrend or downtrend, without indicating which direction the market is moving.
• On the other hand, the Aroon Indicator offers both directional and strength indications. The Aroon consists of two lines: the Aroon Up (orange line) and the Aroon Down (blue line). When the Aroon Down line is above the Aroon Up line, it indicates a downtrend, and vice versa for an uptrend.
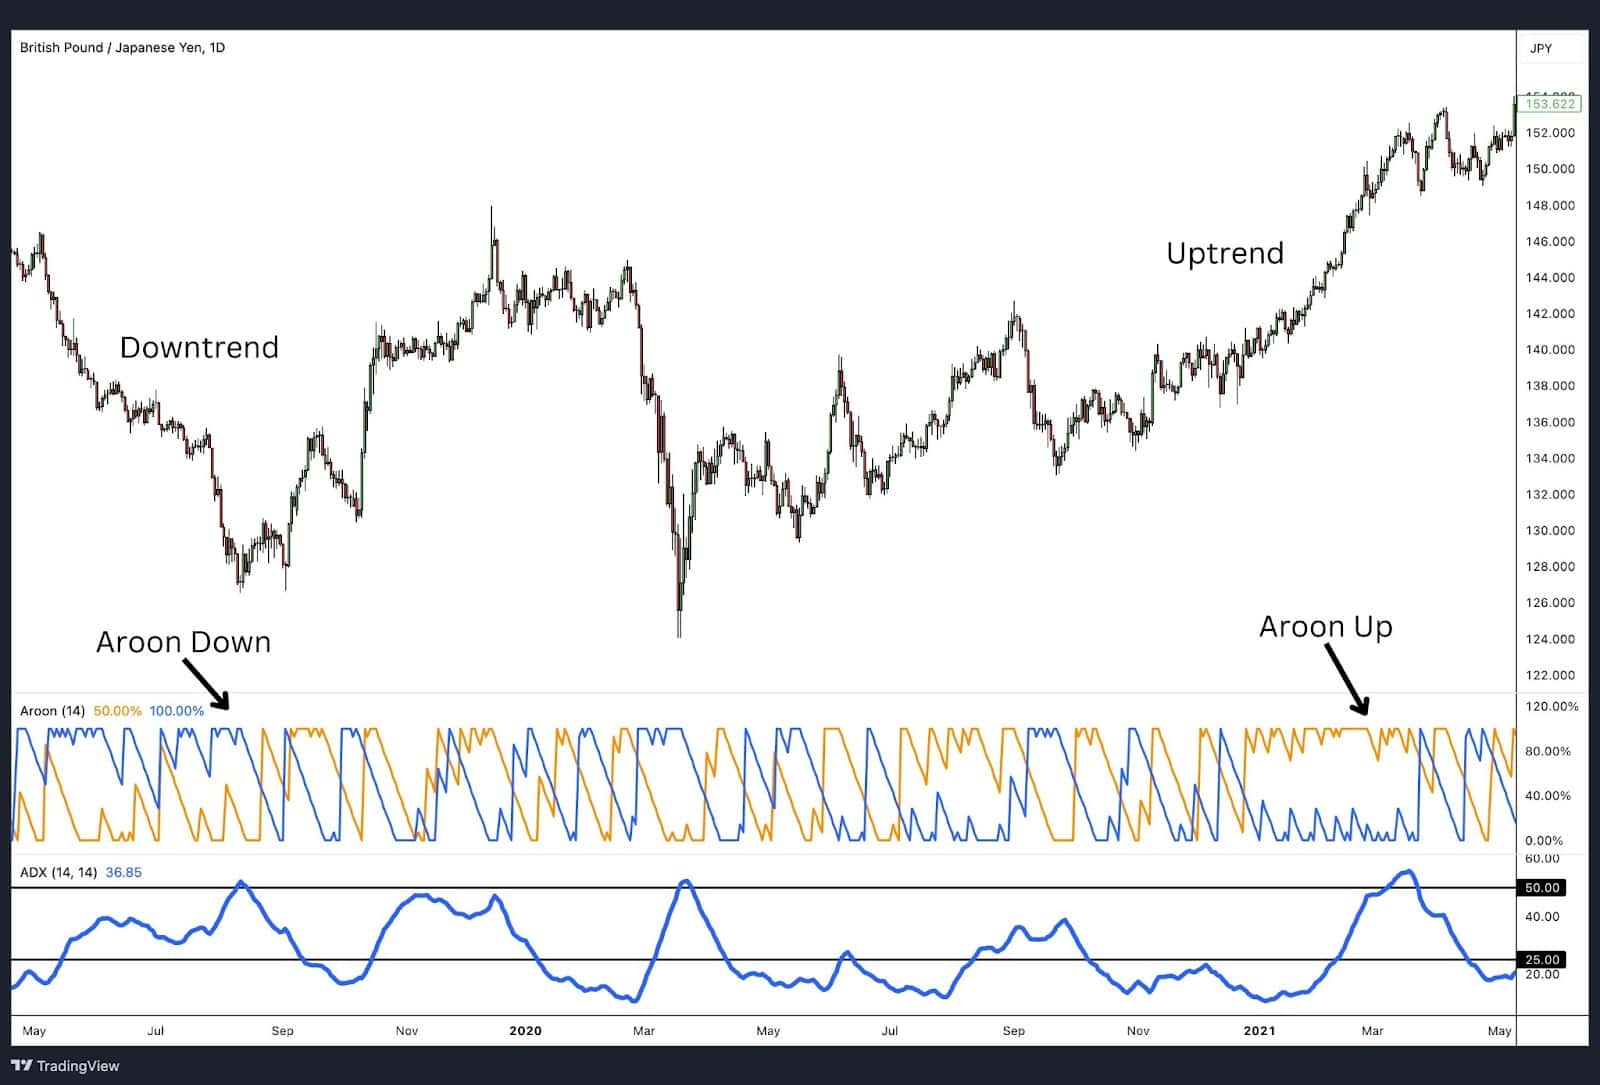
The chart above illustrates the British Pound/Japanese Yen (GBP/JPY) forex pair, where both the ADX and Aroon indicators are plotted.
• Aroon Indicator: When the Aroon Down line (blue) is above the Aroon Up line (orange), it signals a downtrend. Conversely, when the Aroon Up line crosses above the Aroon Down line, an uptrend is indicated. This dual-line approach allows traders to see both the direction and the strength of the trend simultaneously.
• ADX Indicator: The ADX line (plotted in blue) runs parallel to these directional signals, providing a measure of the trend’s strength. However, it does not indicate whether the trend is up or down—only that a strong trend exists if the ADX reading is above a certain threshold (typically 25).
Choosing Between ADX and Aroon
When deciding whether to use the ADX or the Aroon Indicator, traders should consider their specific needs:
• ADX is ideal for traders who are primarily concerned with how strong a trend is, regardless of its direction. It is particularly useful when combined with other indicators that can provide directional signals.
• Aroon is better suited for traders who want both directional and strength information in one indicator. It simplifies the analysis by providing clear visual cues about the market’s trend direction and the strength of that trend.
What Is the Best Indicator to Use With ADX?
The Average Directional Index (ADX) is a powerful tool for assessing the strength of a trend, but because it does not indicate the direction of price movements, it is most effective when used in combination with other technical indicators that provide directional signals. Here are some of the best indicators to use alongside the ADX:
Relative Strength Index (RSI) With ADX
Average Directional Index(ADX) with RSI
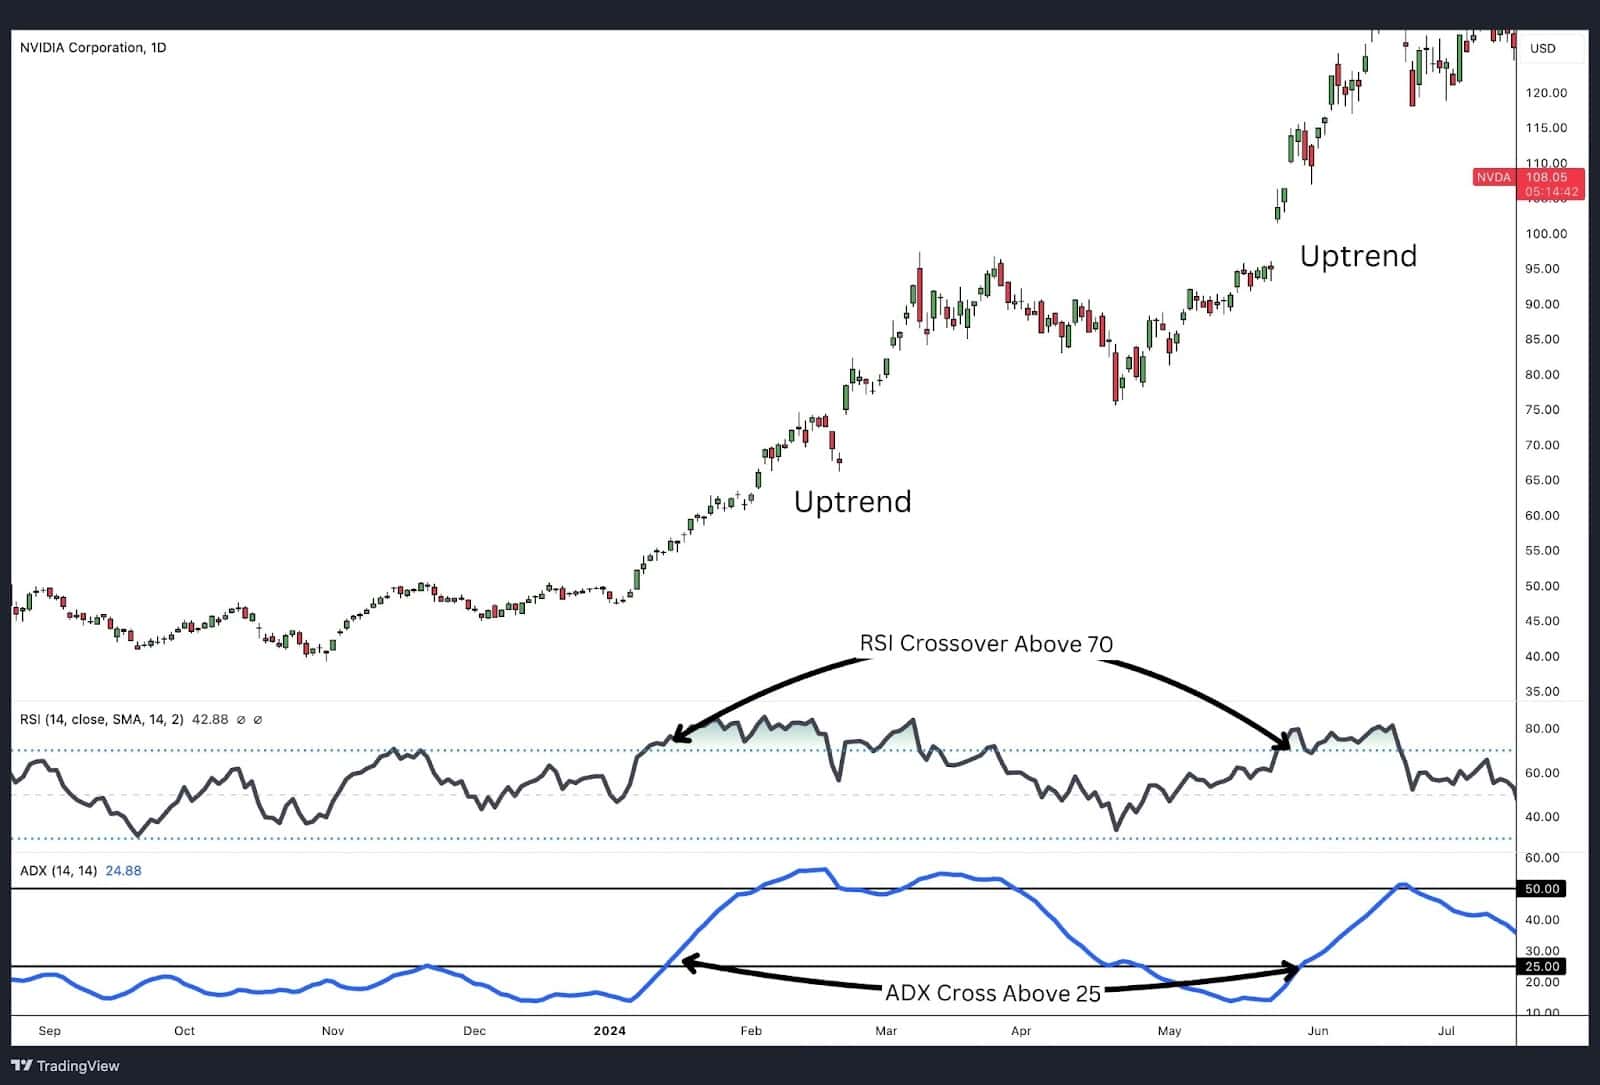
The Relative Strength Index (RSI) is a popular momentum oscillator that provides directional signals, making it an excellent complement to the ADX. When the RSI indicates an oversold condition, it suggests either strength in a trending market or an impending reversal in a trendless market. If the ADX also crosses above 25 around the same time and the RSI stays in the overbought or oversold zone, this typically confirms the strength of the trend rather than a reversal, enhancing the reliability of the trading signal.
Parabolic SAR With ADX
Average Directional Index(ADX) with Parabolic SAR
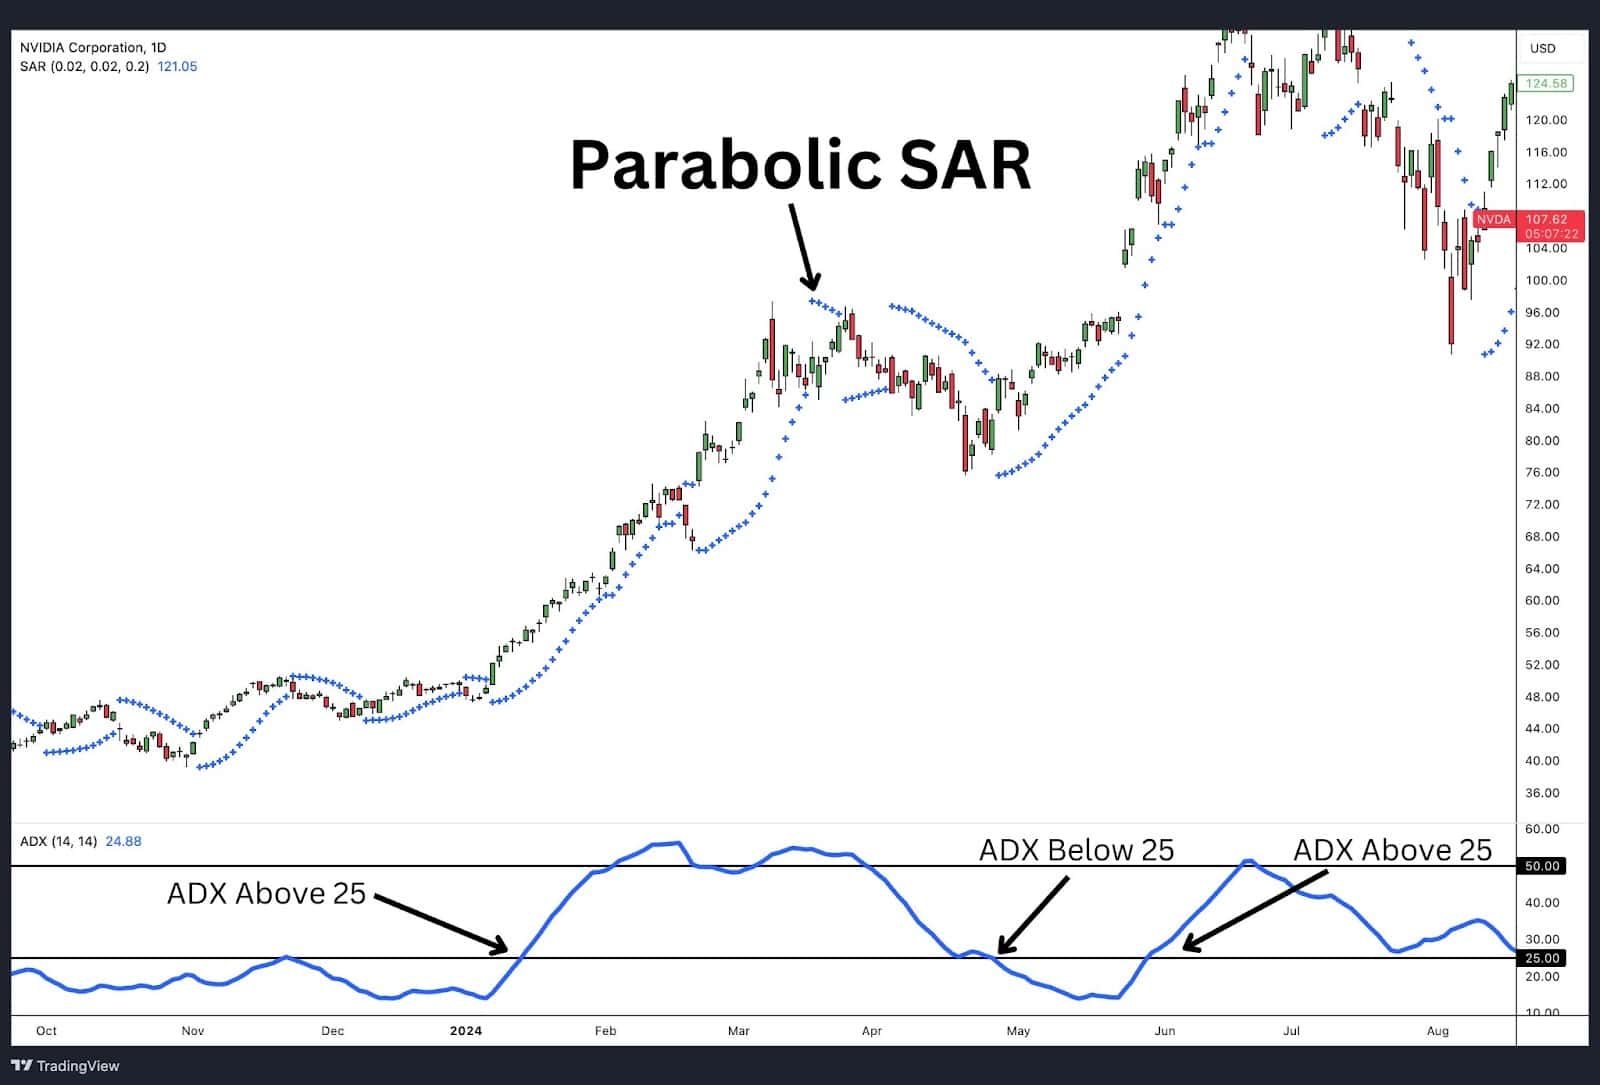
The Parabolic Support and Resistance (PSAR) indicator provides price direction by plotting points above or below the price, indicating potential reversals. However, when paired with the ADX, the two indicators may not consistently align, as seen in the chart where no strong correlation is observed between ADX crossings and PSAR signals. This inconsistency suggests that while PSAR can provide directional cues, it may not always be the best match for the ADX in all trading scenarios.
MACD With ADX
Average Directional Index (ADX) with MACD Crossover
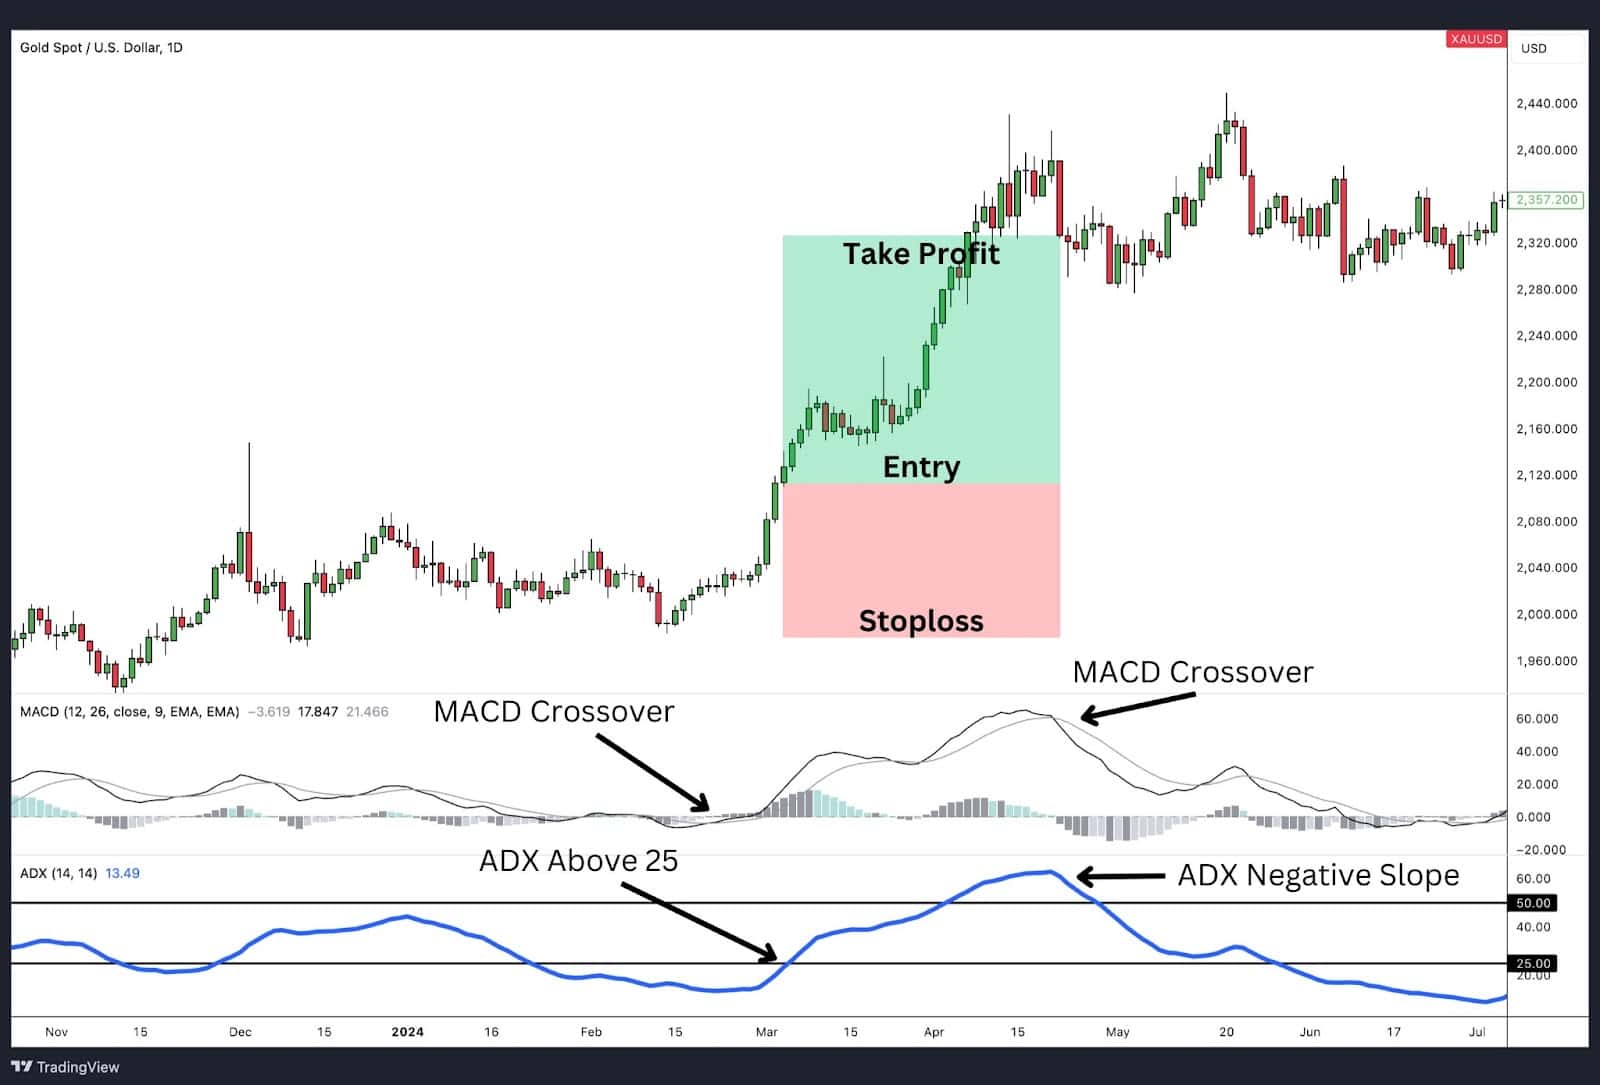
The Moving Average Convergence Divergence (MACD) is another popular indicator that works well with the ADX. MACD crossovers are commonly used to signal trade entries, and when confirmed by an ADX reading above 25, they provide strong indications of a robust trend. This combination is particularly effective in trend-following strategies, as discussed in the trading strategy section where MACD crossovers are used alongside the ADX.
Moving Averages With ADX
Average Directional Index(ADX) with Moving Average
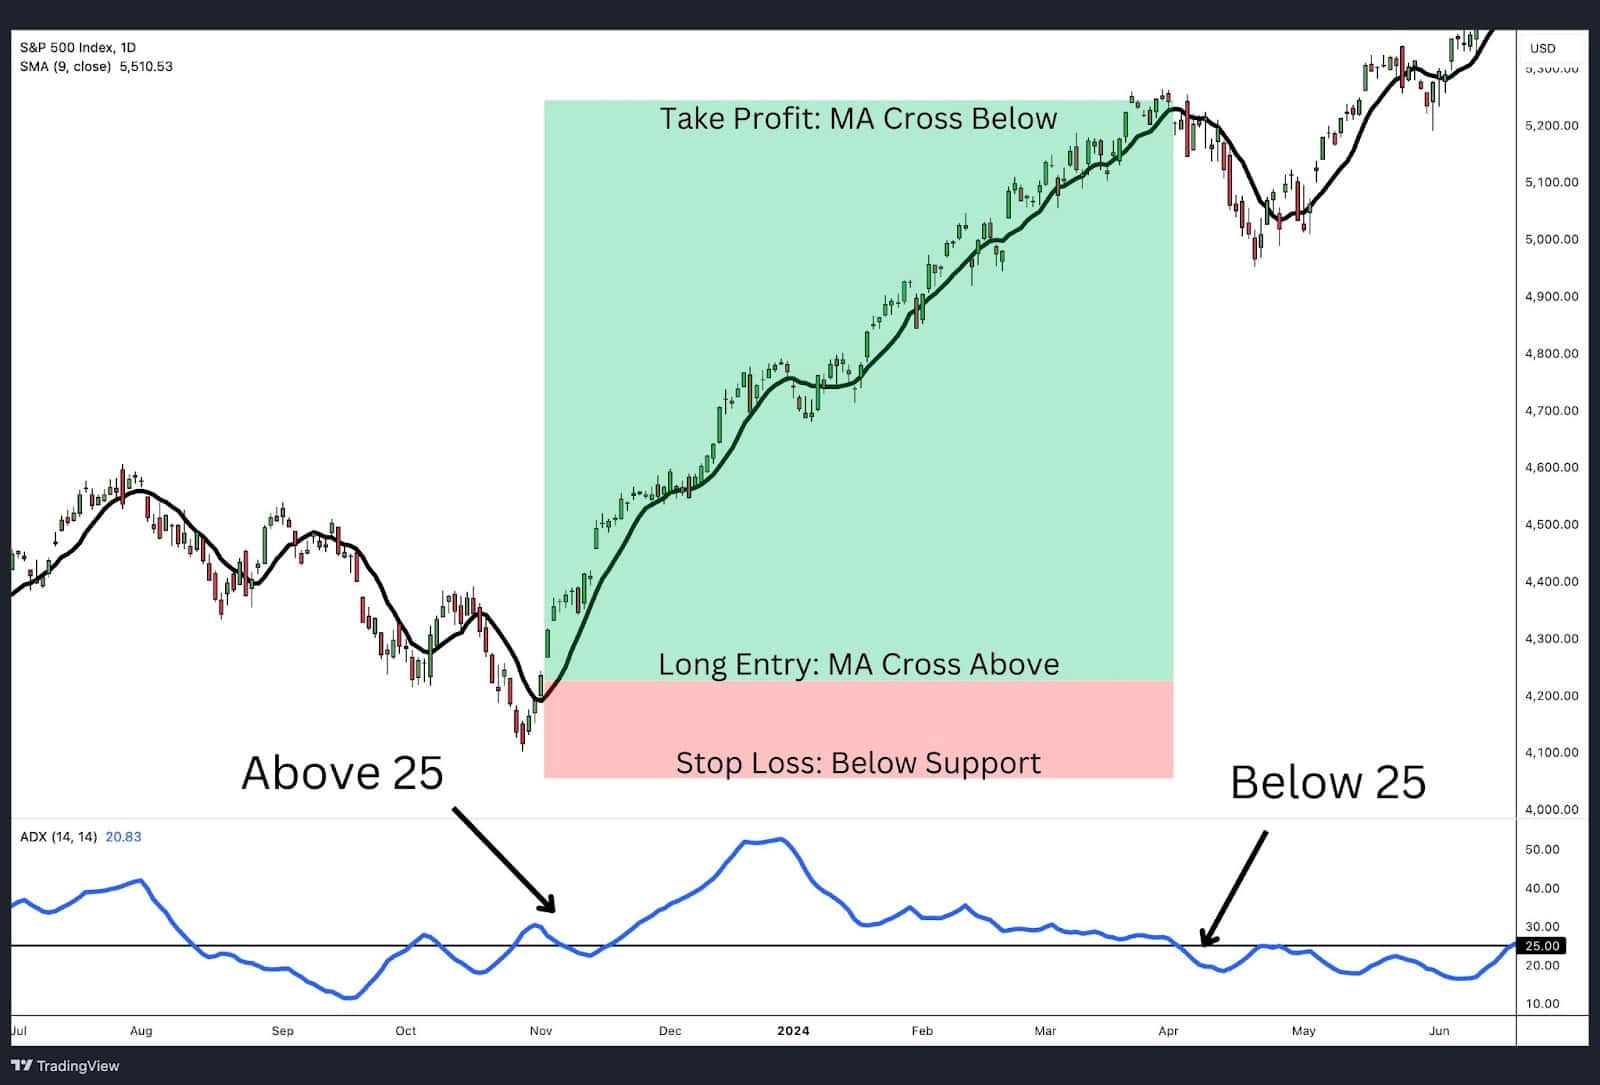
Moving Averages are among the most frequently used indicators in combination with the ADX, especially in trend-following strategies. A moving average crossover, confirmed by an ADX reading above 25, signals that the trend is strong enough to justify entering a trade. This strategy, explored in the trend strength example, helps traders filter out weak trends and focus on high-probability trading opportunities.
Bollinger Bands® With ADX
Average Directional Index(ADX) with Bollinger Bands
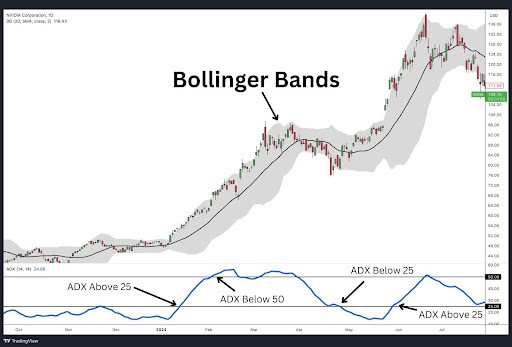
Bollinger Bands® can be used to detect trends, especially when employed in a trend-following context rather than for mean reversion. When a Bollinger Band indicates an upward trending market with the bands sloped higher, the ADX confirms this by crossing above 25 or 50 and maintaining an upward slope. This combination is effective for confirming trends and reducing the risk of entering trades during non-trending or range-bound markets
Stochastics With ADX
Average Directional Index(ADX) with Stochastic
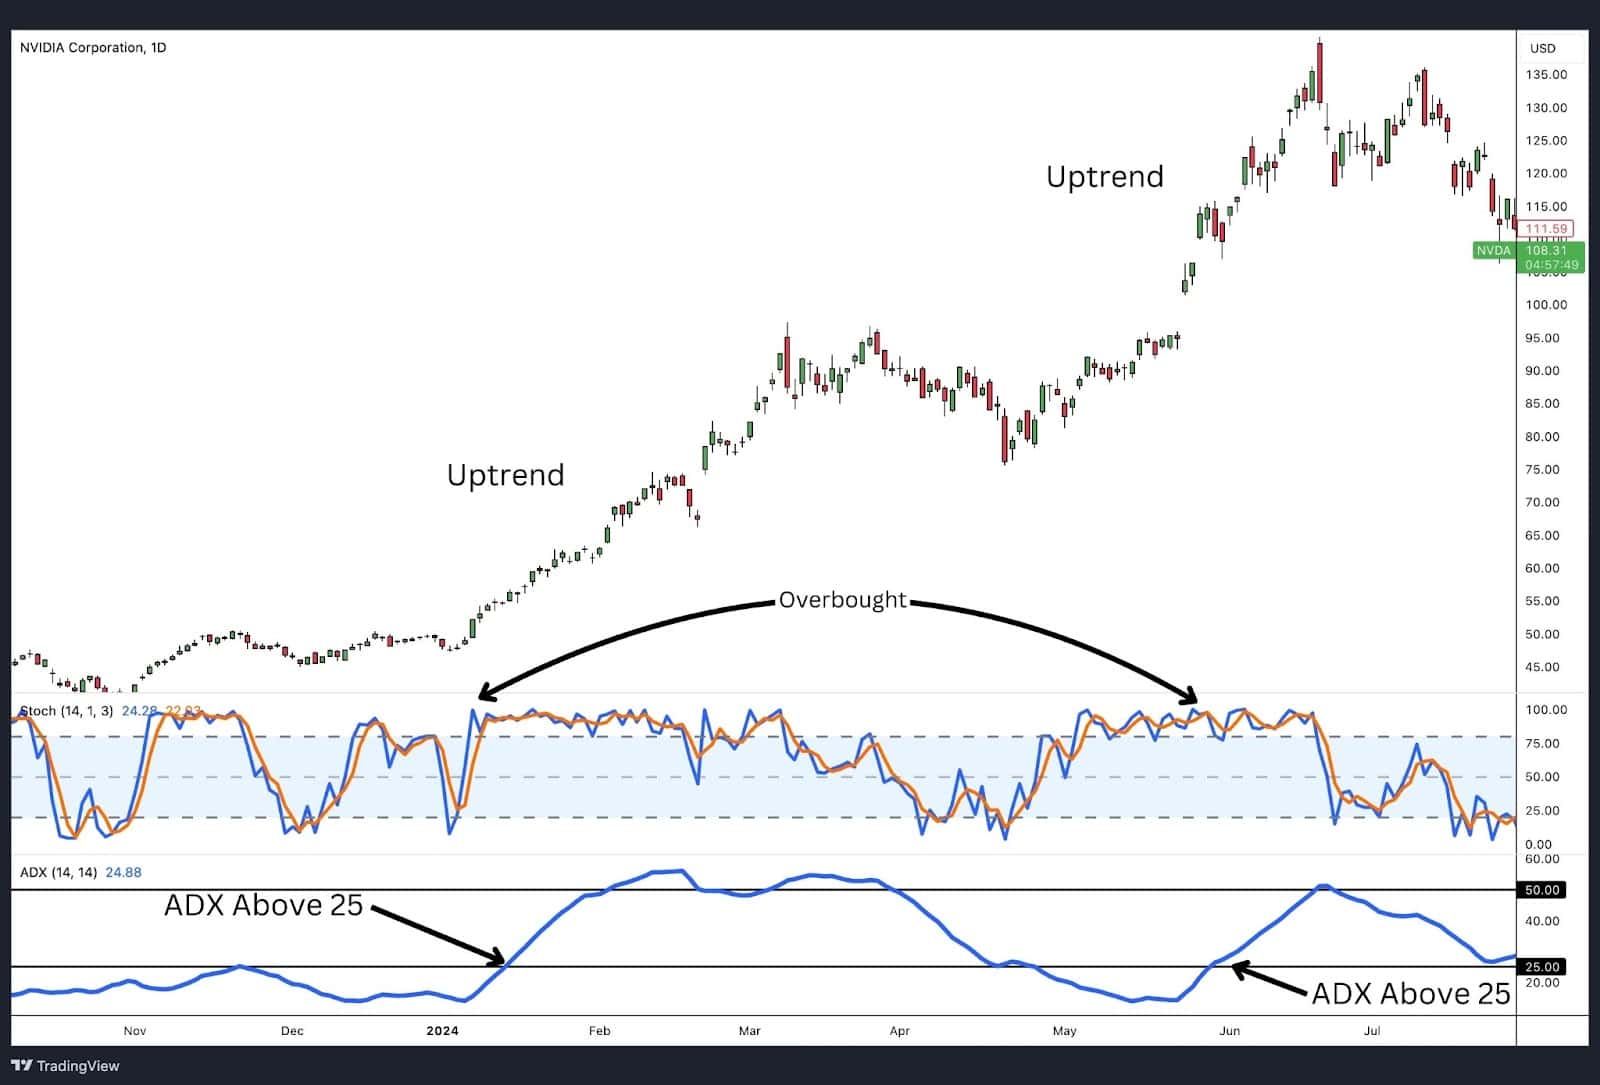
The Stochastic Oscillator is a price momentum indicator that works similarly to the RSI, with overbought and oversold zones. When the Stochastic Oscillator enters these zones, it can suggest either a reversal in a trendless market or strength in a trending market. If the ADX confirms the presence of a trend by reading above 25, while the stochastic lingers in an extreme zone, it provides a strong indication of a trending market, making it a useful combination for traders looking to confirm trend direction and strength.
Pivot Points With ADX
Average Directional Index(ADX) with Pivot Points
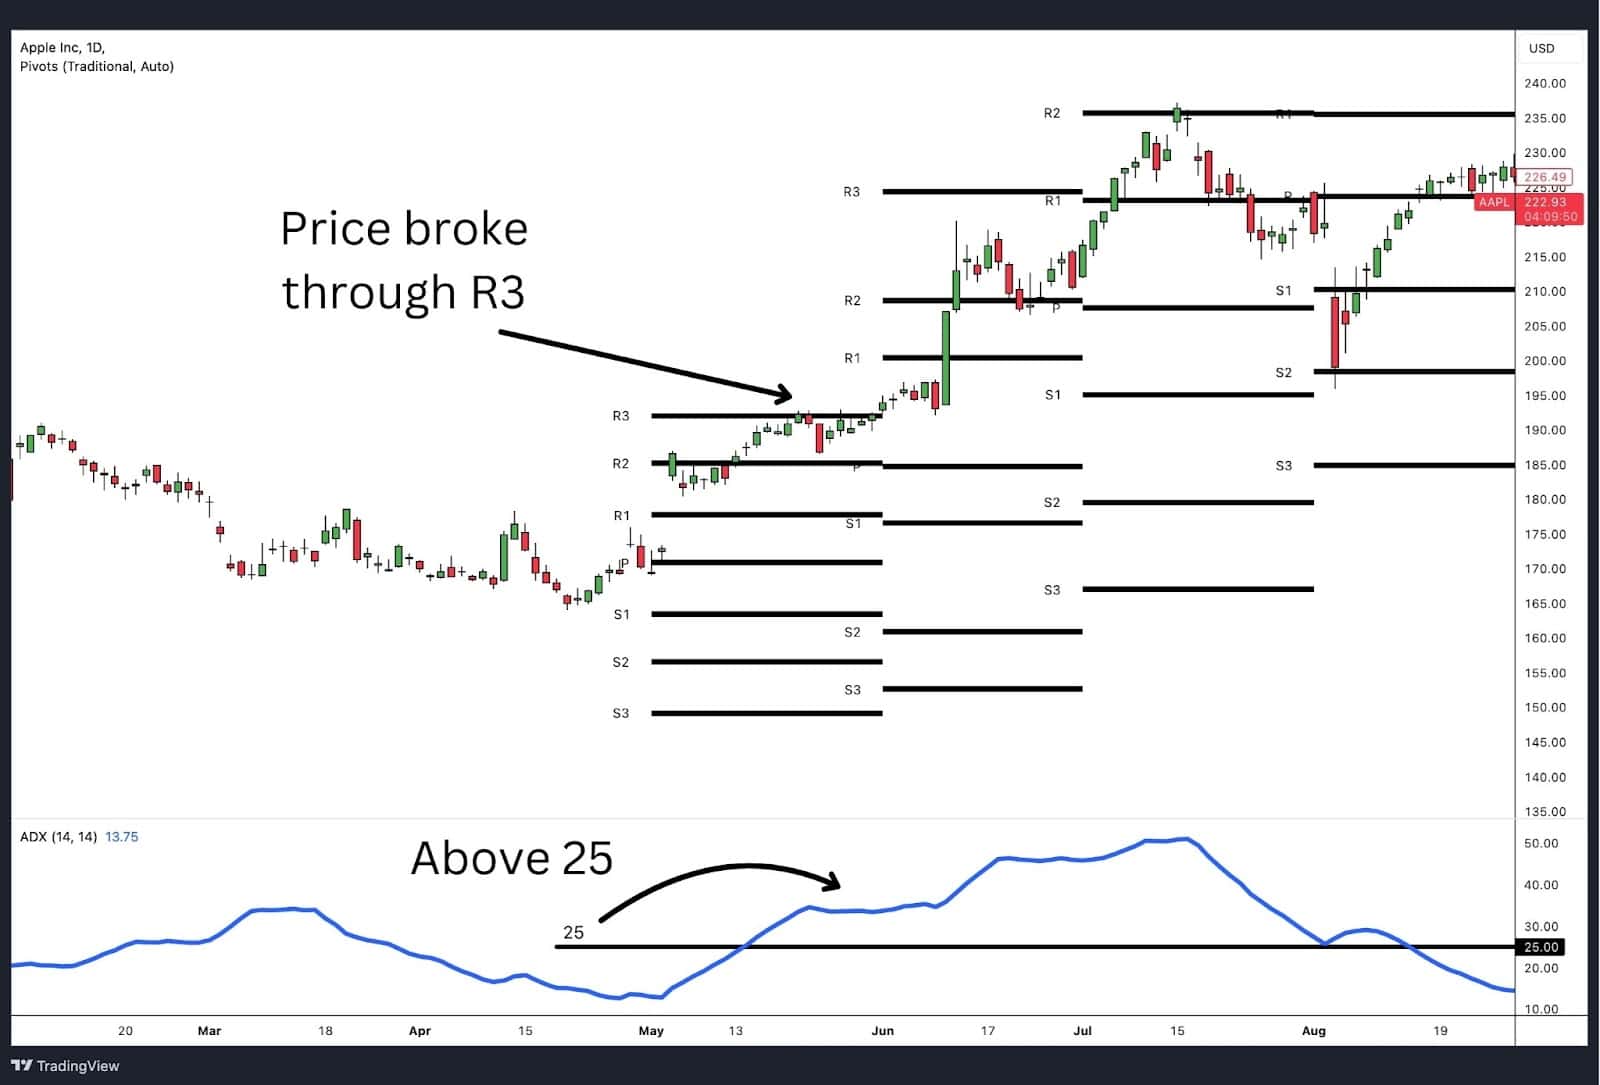
The Pivot Points indicator, when combined with the Average Directional Index (ADX), can create a powerful strategy for identifying strong trends and potential reversal points. Pivot Points are commonly calculated on monthly, weekly, or daily timeframes, providing traders with predefined support and resistance levels that can help determine potential market turning points.
How Pivot Points and ADX Work Together
Pivot Points identify key price levels where a trend might pause, reverse, or accelerate. When used alongside the ADX, these levels can help confirm whether a price movement has the momentum needed to continue past a pivot level or if a reversal might be imminent.
Here’s how to use this combination effectively:
- Identify Pivot Levels: Start by calculating Pivot Points on your chosen timeframe (e.g., daily, weekly, or monthly). The standard Pivot Point calculation generates a central pivot level, along with support (S1, S2, S3) and resistance levels (R1, R2, R3) above and below it.
- Use ADX to Confirm Trend Strength: Once you identify the Pivot Points, monitor the ADX reading:
- If the ADX is above 25 and increasing, it signals that the trend is strong, which means price is more likely to break through support or resistance levels.
- If the ADX is below 25, the market may be consolidating, suggesting that price is likely to respect the support and resistance levels provided by the Pivot Points without strong directional movement.
ADX vs ATR

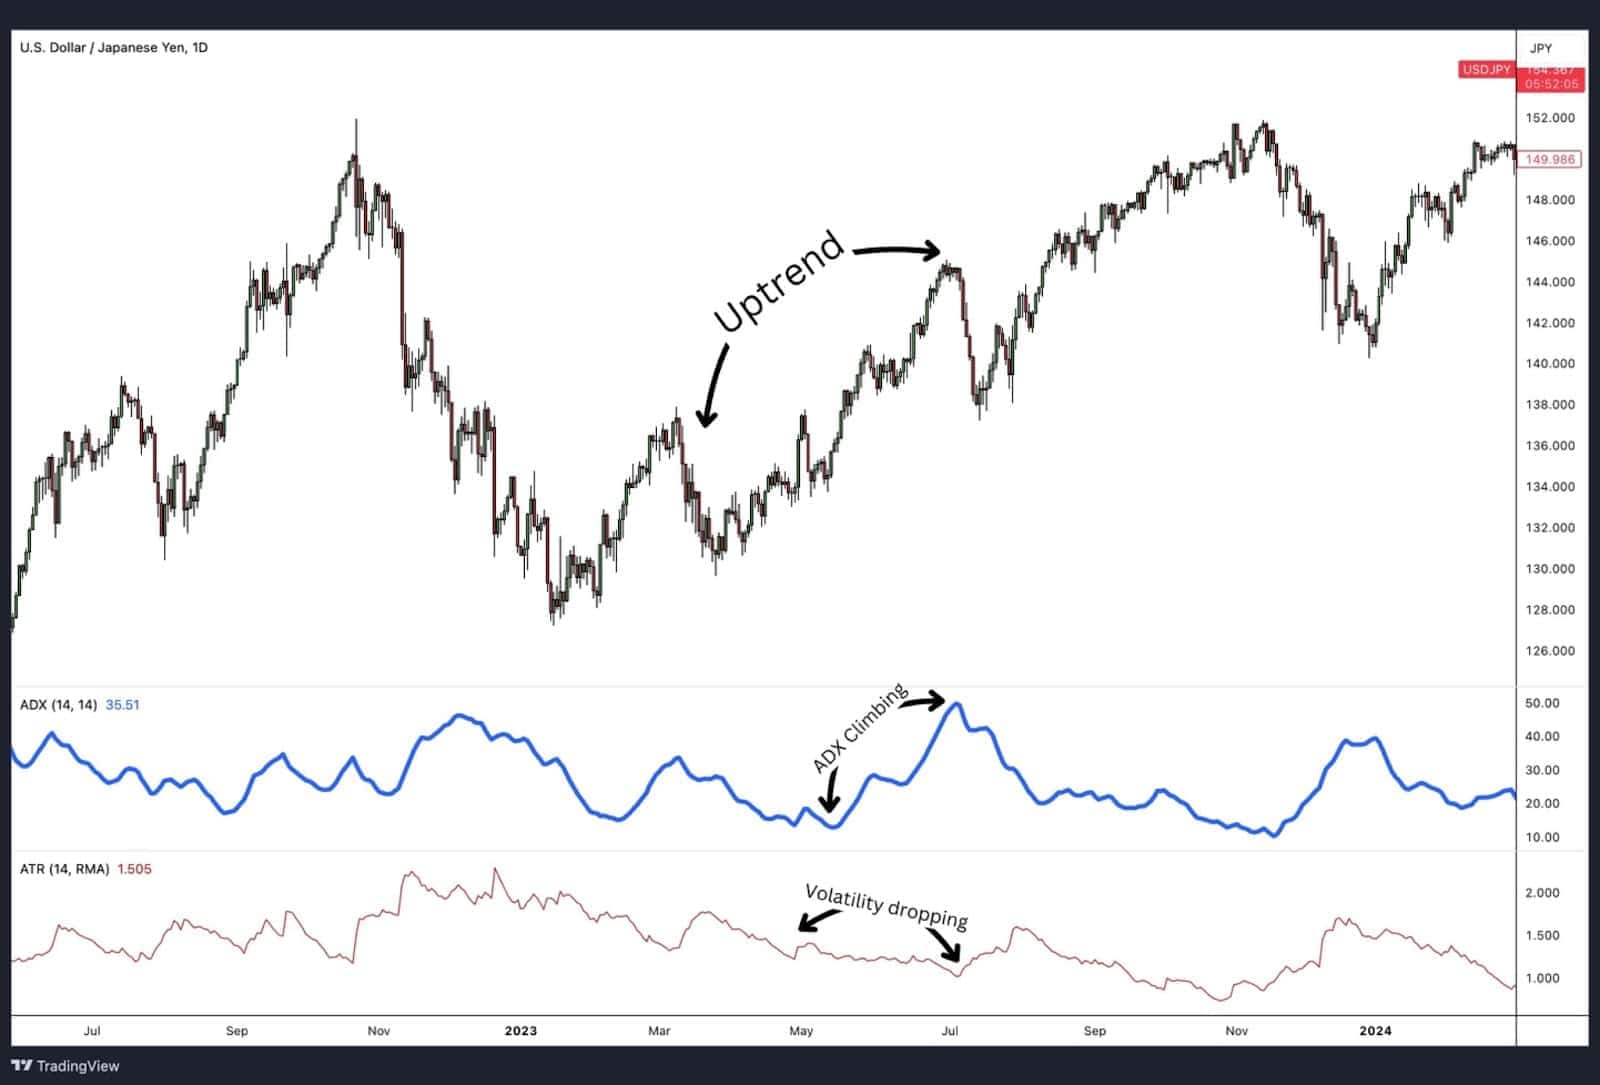
The ADX measures trend strength, while the Average True Range (ATR) measures market volatility. ATR is included in the calculation to determine ADX. Therefore, on the surface, you might think that ADX and ATR move in the same direction but that is not always the case.
Many times, strong trends bring expanding ranges. As a result, ADX would rise as the ATR increases.
However, increased volatility does not always lead to increased ADX. If prices become volatile but make little directional headway, the ranges would expand but the +DI and -DI would essentially ‘cancel’ themselves out suggesting little trend.
Likewise, low volatility does not alway result in a low ADX. The ranges of each candle could be relatively small but if each bar is moving in the same direction, then ADX will show a strengthening trend.
As you can see, ATR is more concerned with the size of the trading range while ADX’s value is heavily influenced by large directional movements with minimal retracements.
Both can be used together to understand trend strength in the context of volatility.
FAQs
What are the best settings for the Average Directional Index indicator?
The default setting for the ADX is 14 periods and tends to work well for most situations. However, this setting may not be optimal for every trading strategy, timeframe, or market. Optimisation testing is essential to determine the best settings for a specific scenario.
Is ADX a leading or lagging indicator?
The ADX is a lagging indicator because it relies on historical price data to calculate trend strength.
How reliable is ADX indicator?
The ADX does not guarantee 100% accuracy. It is intended to increase the likelihood of positive outcomes as you can more effectively filter out strong trends to trade momentum strategies on and weak trends to trade a range strategy on.
What is the origin of the ADX indicator?
The ADX was created by J. Welles Wilder in 1978 to measure the strength of market trends, irrespective of their direction.
Can other market analysis indicators replace the ADX?
Yes, the Aroon Indicator can be a suitable substitute for the ADX, as both are designed to measure trend strength, though they use different methods.
Is the ADX capable of predicting the direction of a trend in financial markets?
No, the ADX does not predict the direction of a trend; it only measures the strength of the prevailing trend. However, the DMI components of the ADX could help a trader determine trend direction.
Can the ADX reveal market trend fundamentals?
No, the ADX cannot reveal market fundamentals. It only measures the strength of trends resulting from changes in market fundamentals.
Can the ADX accurately analyse minute-to-hour trends?
Yes, the ADX can be used on any timeframe, but its reliability varies. Smaller timeframes, that are used in scalping or day trading, tend to result in smaller price movements. Therefore, the impact of the ADX on a 1-minute chart will be less significant compared to a daily chart. The objective of the trading strategy should guide the choice of timeframe.


