


Written by:

Reviewed by:


Bullish
- October 21, 2024
- 29 min read
Tweezer Bottom Candlestick Pattern Trading Guide
What is the Tweezer Bottom Candlestick Pattern?
A tweezer bottom is a bullish reversal pattern that signals a potential end to an asset’s current downward momentum. It consists of two consecutive candles with identical or nearly identical lows, occurring either at the asset’s lowest price level during a downtrend or at the end of a pullback if it occurs within an uptrend. Therefore, this pattern represents a clear rejection of further lower prices and may serve as a “bounce” point for an upcoming bullish move (i.e., price rally).
What Does Tweezer Bottom Pattern Indicate?
The bullish tweezer bottom is a visual representation of market sentiment shifting away from bearish momentum. When this pattern forms, it indicates that selling pressure is weakening, altering the balance of power between buyers and sellers. This shift could ultimately lead to a reversal of an asset’s overall trend during a downtrend or signal the end of an ongoing price pullback or retracement during an uptrend.
How to Identify the Tweezer Bottom Candlestick Pattern?
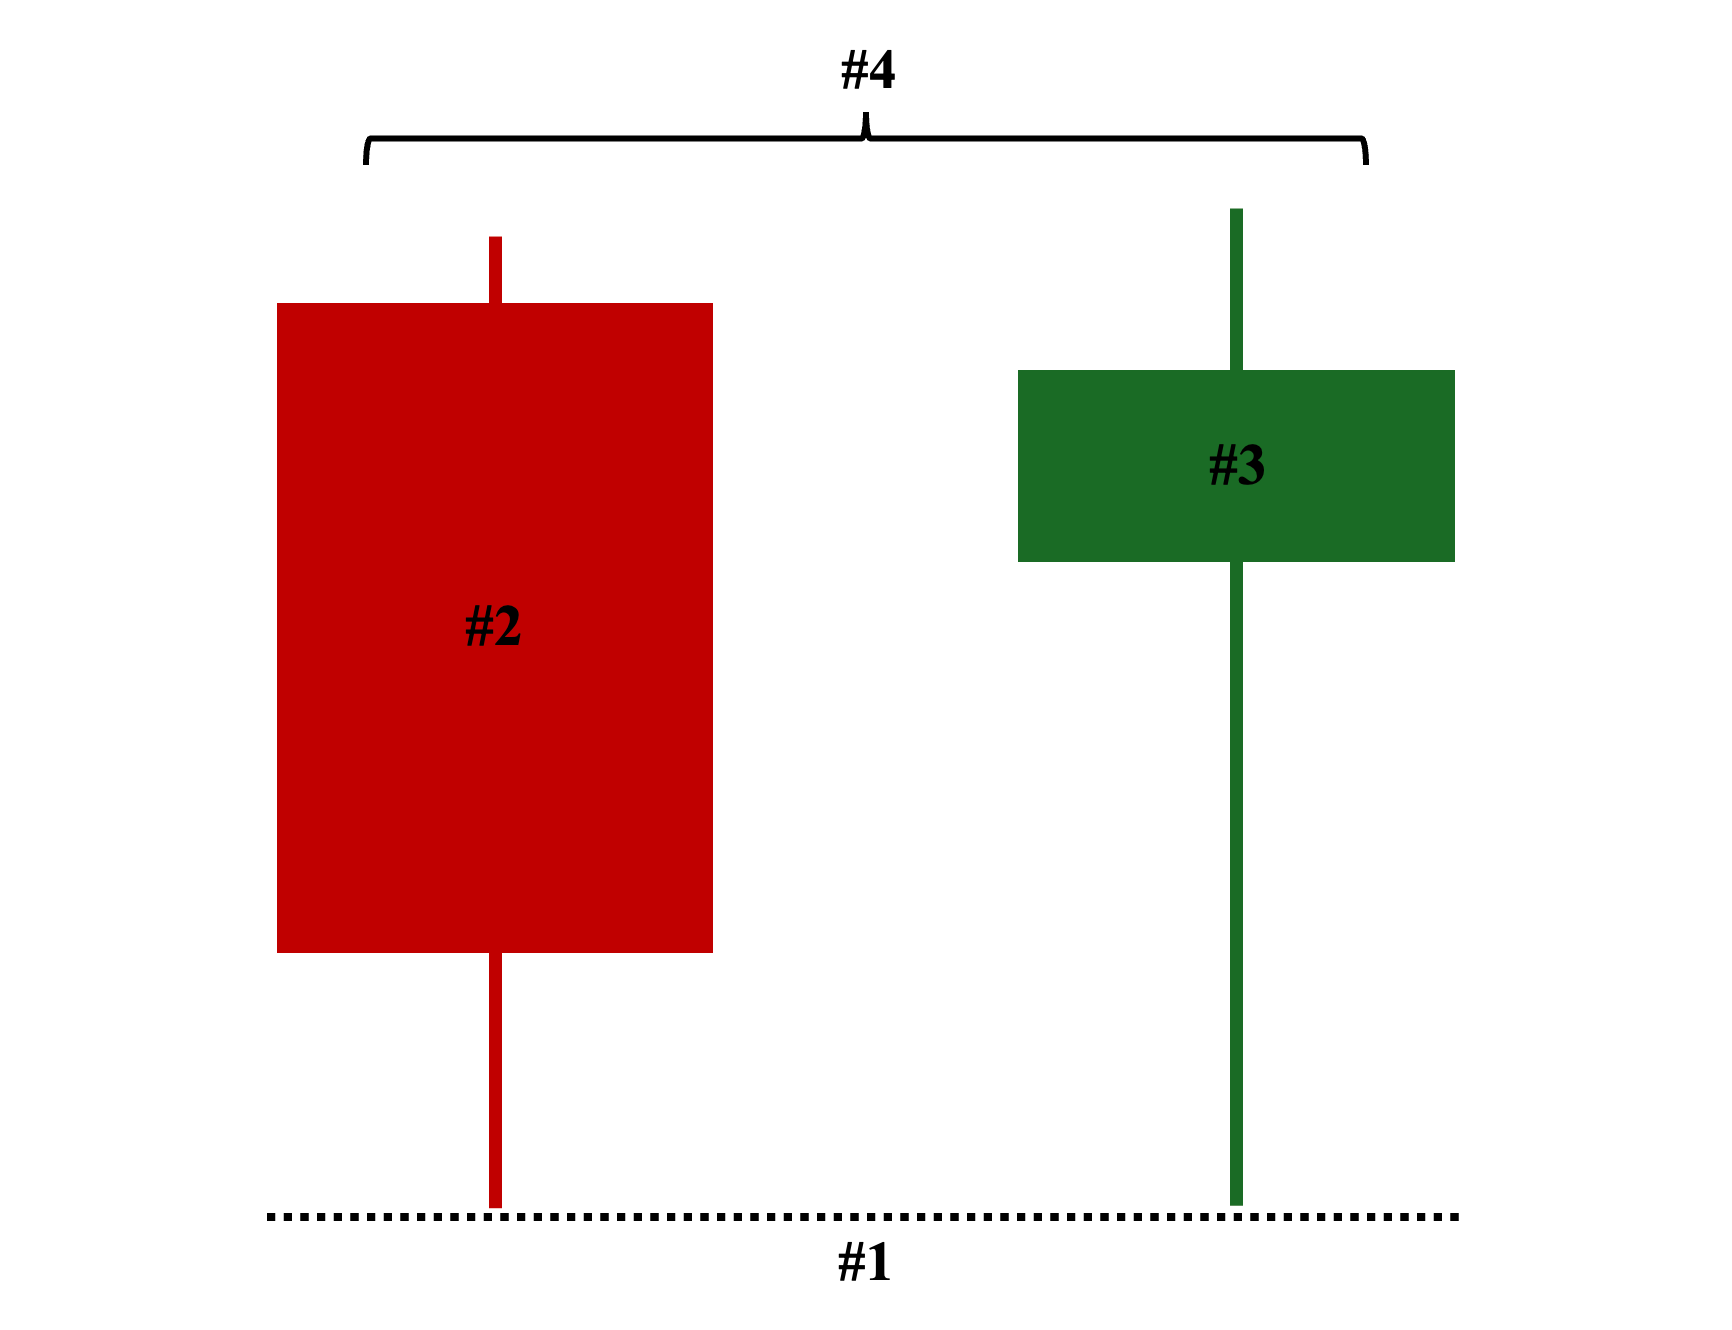
The following are the four primary criteria for identifying a valid bullish tweezer bottom pattern on a price chart:
- Price Level: The two candlesticks must have identical or nearly identical lows.
- First Candle: It must be a bearish candle—to show that it is still part of the downward move.
- Second Candle: Ideally, a bullish candle (a neutral candle is valid but less ideal)—to officially signify the starting point of a shift in market sentiment.
- Chart Position: The two candles must appear at the lowest point of an ongoing downtrend or during a major pullback in an uptrend.
Different Variants of the Tweezer Bottom Candlestick Patterns
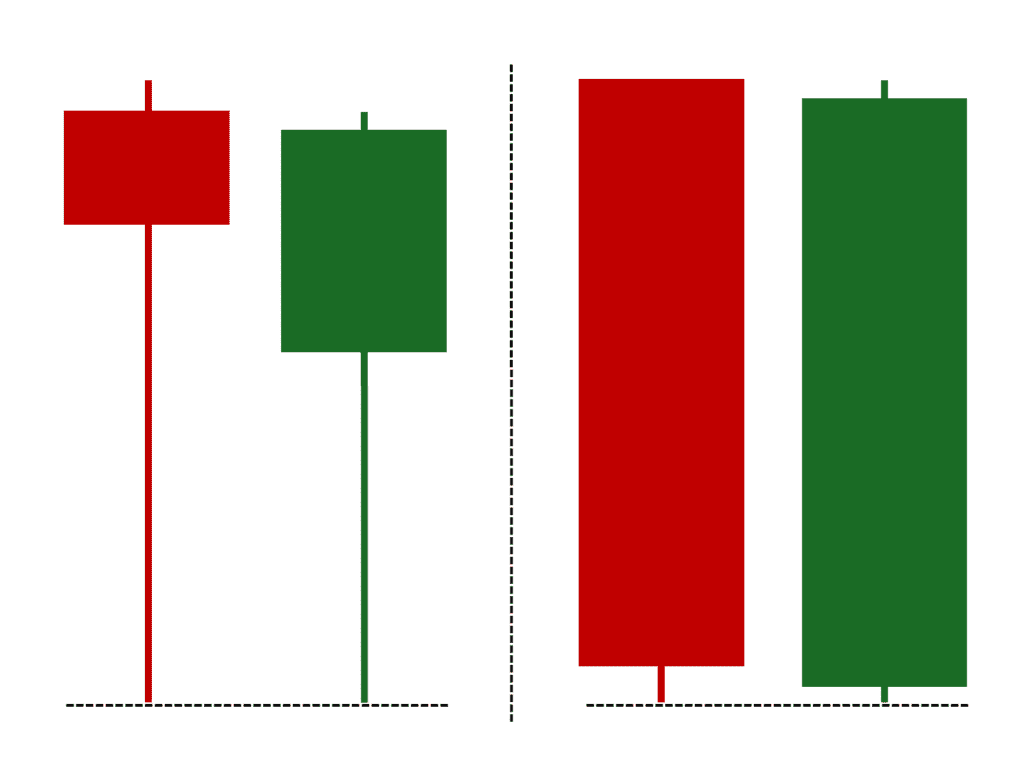
The following are the different tweezer bottom variants you most likely will see in an actual price chart:
These first two variants are the standard forms of tweezer bottoms. However, the first variant with long shadows is arguably more ideal and is considered a stronger candlestick pattern overall. The first candle—despite being bearish—already shows a strong rejection of further lower prices. The second candle reinforces this sentiment by rejecting the same lower price levels, indicating that buyers are fully absorbing the selling pressure. In contrast, the two candlesticks in the second variant tell a slightly different story. While they share identical lows, these two bottom candles illustrate a more drastic shift in market sentiment. The first candle, a bearish “Marubozu,” reflects a decisive bearish move, but the second candle completely reverses the sentiment (or so it seems).
Pro Tip: In the second variant, checking the volume is crucial. We recommend considering this setup only if the second candle has a significantly higher volume than the first. If the first (bearish) candle has a much higher volume or if the second (bullish) candle has a relatively thin volume, it might just be a pause before the downtrend continues.
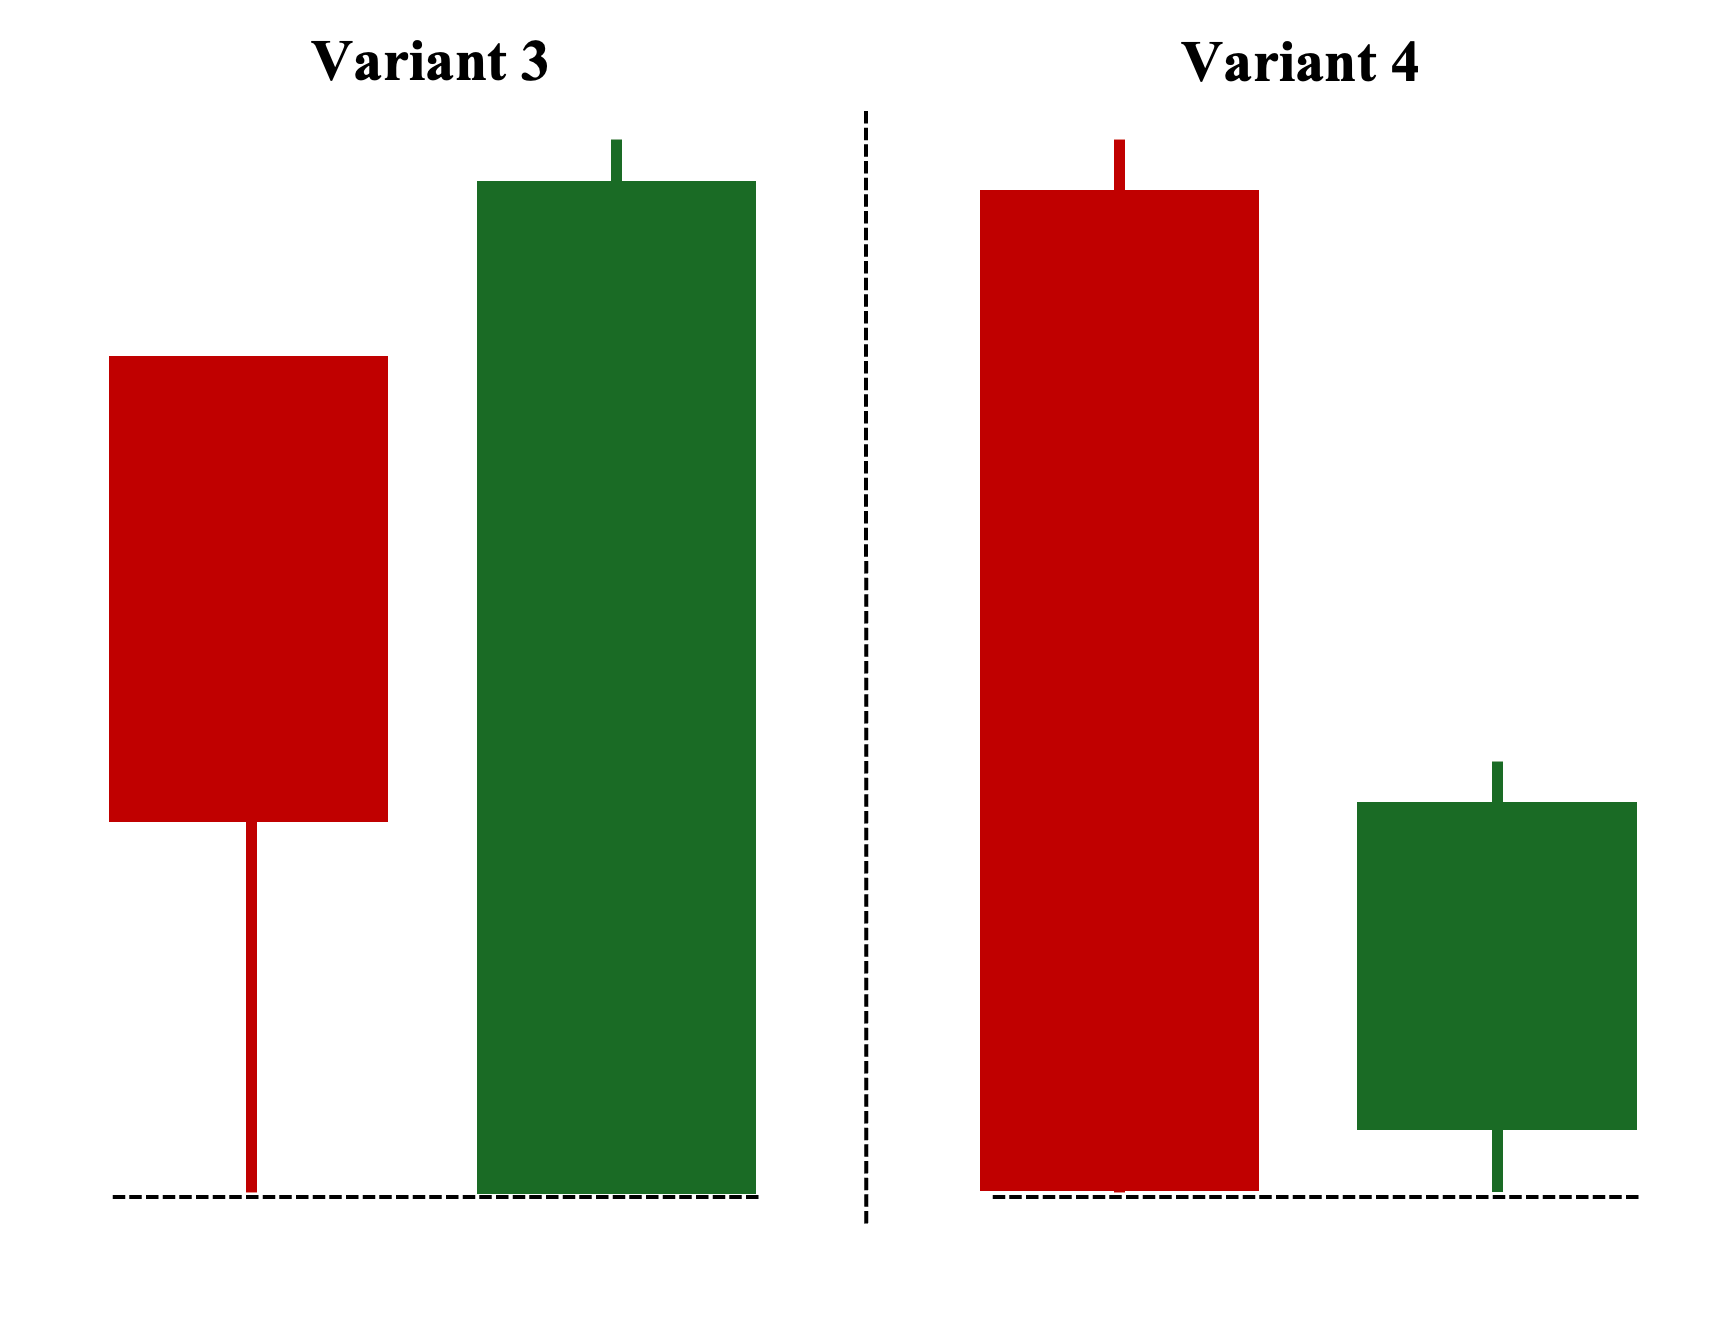
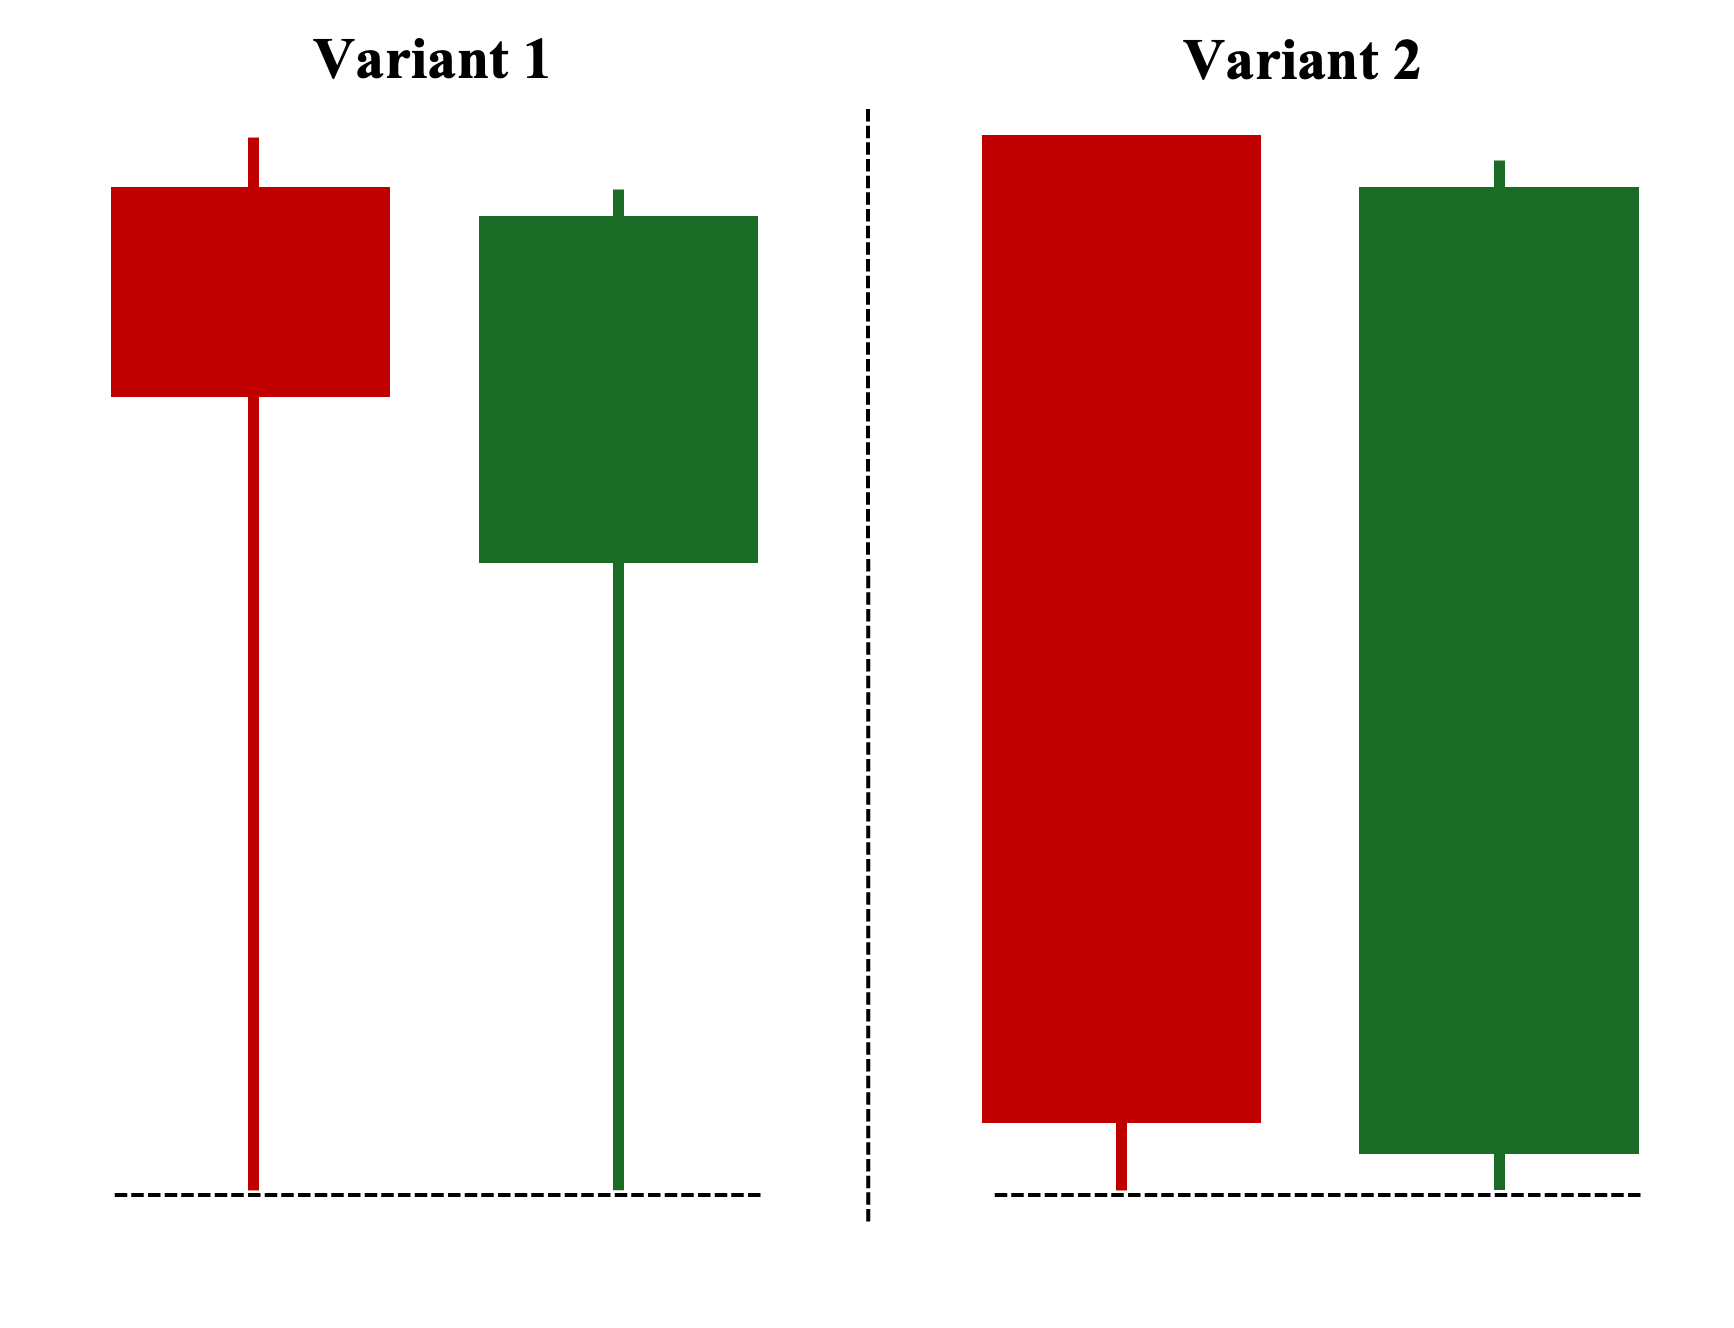
Here, we can see contrasting variants of bullish tweezer bottoms. As shown, the third variant is also a “Bullish Engulfing” pattern, another bullish reversal pattern where the second candle completely engulfs or covers the entire range (body and shadows) of the first candle—highlighting the dominance of the second candle’s buying pressure. This makes it even stronger, especially as a trend reversal pattern during a downtrend. In contrast, the fourth variant of the tweezer bottom pattern is an “Inside Bar” pattern, where the second candle—the shorter, the better—is entirely covered by the range of the first candle. Typically, this pattern indicates indecision about the price’s next move and requires a confirmation candle to clarify whether it’s a reversal or continuation pattern. However, when it also forms a bullish tweezer bottom, it may further support the notion of an impending trend reversal.
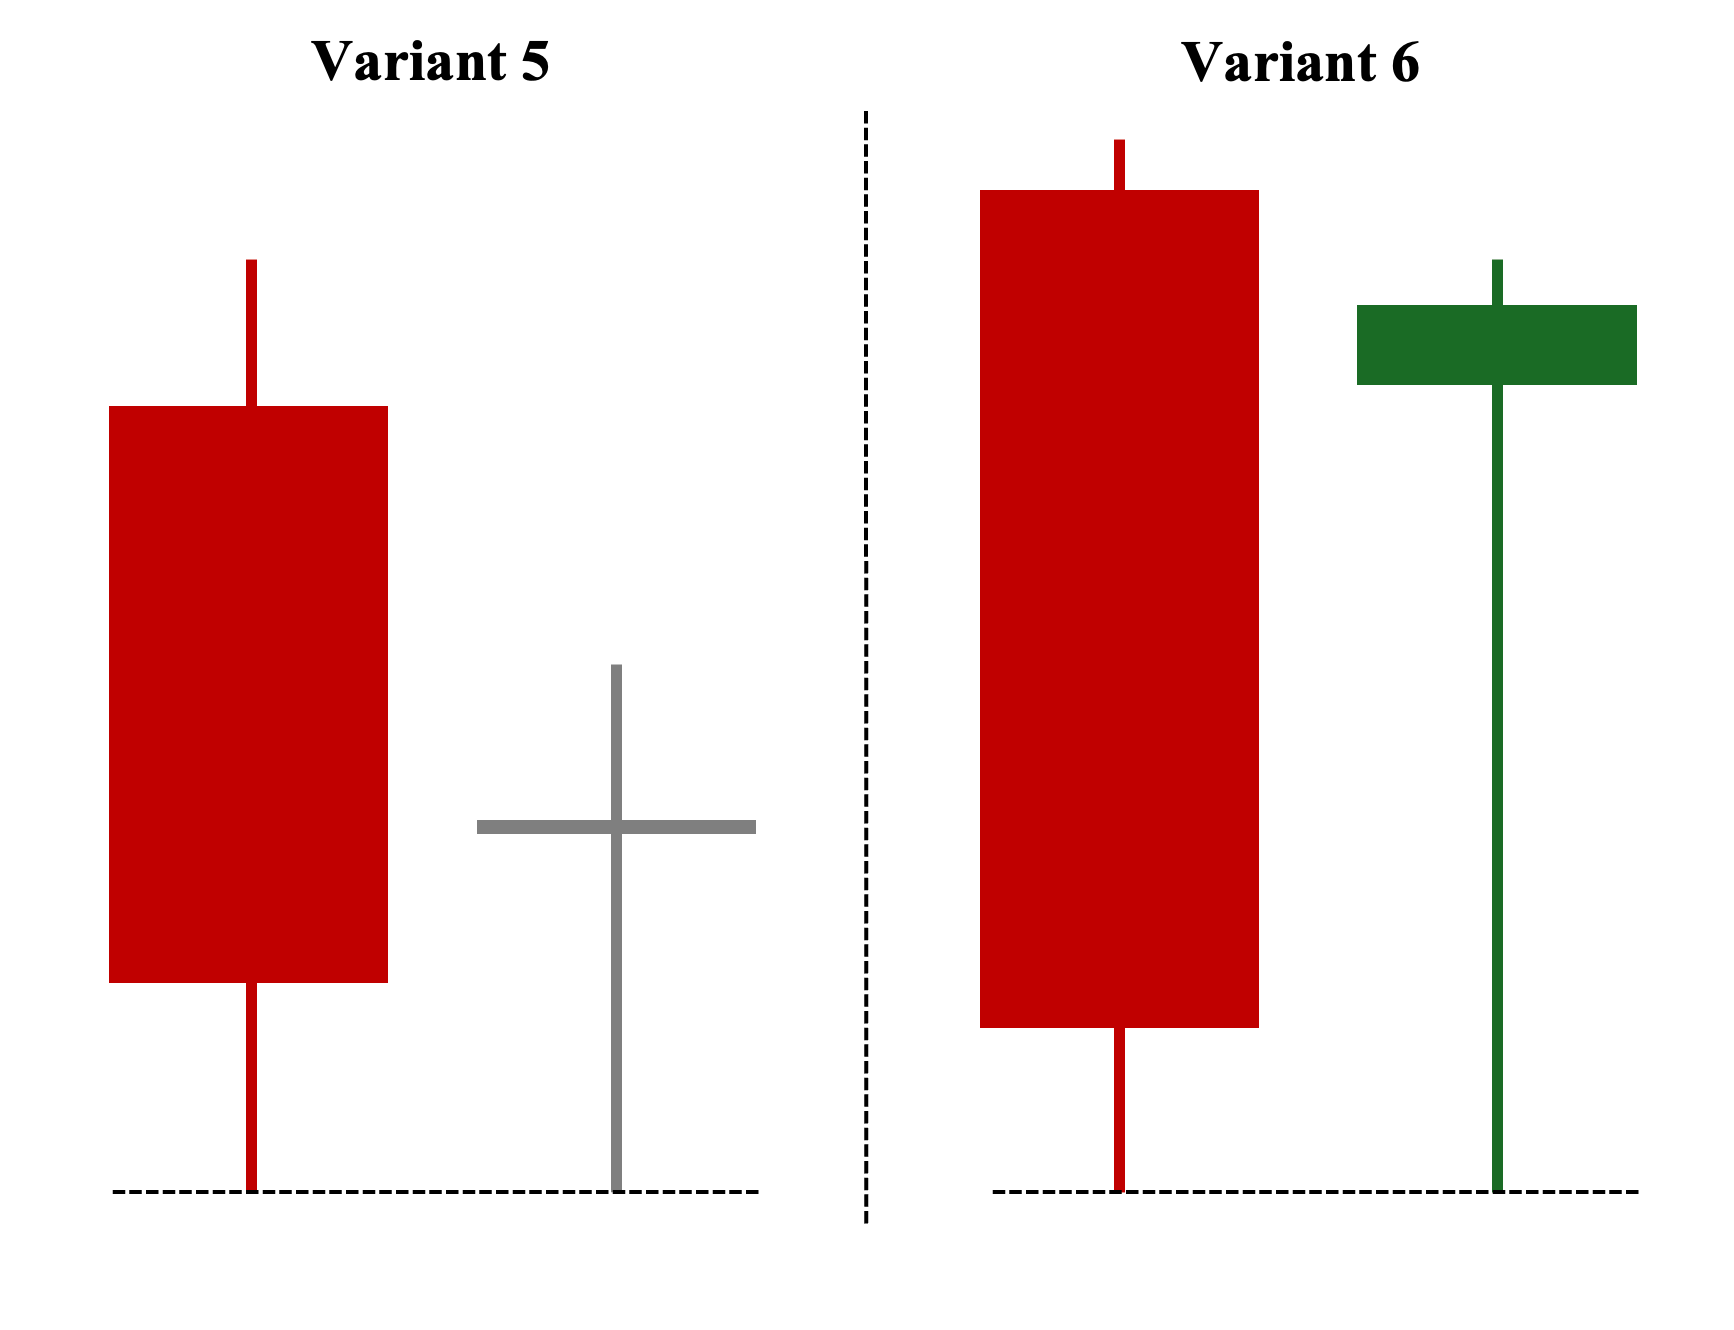
The last two common variants include a version of a tweezer bottom pattern where the second candle is neutral (i.e., a variation of a doji). While this is still a valid tweezer bottom pattern, it is generally considered a less reliable reversal pattern. This is because a doji (unlike a bullish candlestick) may simply indicate a pause rather than a clear reversal. Moreover, the volume—whether relatively thin or above average—does not confirm a directional bias, unlike the first variant we discussed.
Pro Tip: This bullish tweezer bottom pattern could evolve into the sought-after reversal pattern known as the ‘Morning Star‘ if followed by a long-bodied bullish candle that closes above the doji. Therefore, we recommend waiting for this confirmation before taking a position in this variation of the tweezer bottom.
Finally, the last variation is a one-candle bullish reversal pattern composed of a bearish first candle and a “Hammer” or bullish “Pin Bar” second candle. This second candle shows a clear rejection of lower prices, as the price makes a long lower shadow. Nevertheless, this version also needs a strong consideration for total volume turnover. Ideally, the second candle turns an above-average volume, otherwise, if it has a low volume, it may just be a pause before the downward move continues.
Importance of the Tweezer Bottom Pattern
As a trader, here are three key significance of tweezer bottoms as a potential indicator (yes, patterns can be indicators) of price reversal:
- The bullish tweezer bottom pattern shows the establishment of a potential key support level on the chart. The first candle initially sets this support level, and the second candle “tests” and proves it. Hence, these two candles subsequently create a new support level around which you can position your trading strategy.
- The newly established support area shows that there is a substantial demand around that price level. Hence, if your trading strategy allows you to take a longer trade position (e.g., weeks to months), you may consider accumulating around this area as the asset may have just hit the bottom. Therefore, buying around here is considered a “bargain” (the asset is viewed as undervalued by market participants) and may yield a substantial upside potential.
- In an uptrend (during a price pullback, not a trend reversal), the tweezer patterns may give ideal entry points for a long position. This is especially the case if the trend has moved significantly (i.e., a major price rally) prior to the current consolidation. The two candles give you more defined entry and exit points with a likely better risk-reward ratio than prematurely chasing a high-momentum trade, particularly due to the Fear of Mission Out or (FOMO).
Examples of Tweezer Bottom Candlestick Patterns
The following are three distinct examples of how the market responded differently to a tweezer bottom candlestick pattern:
Example #1: Successful Trend Reversal Play Scenario
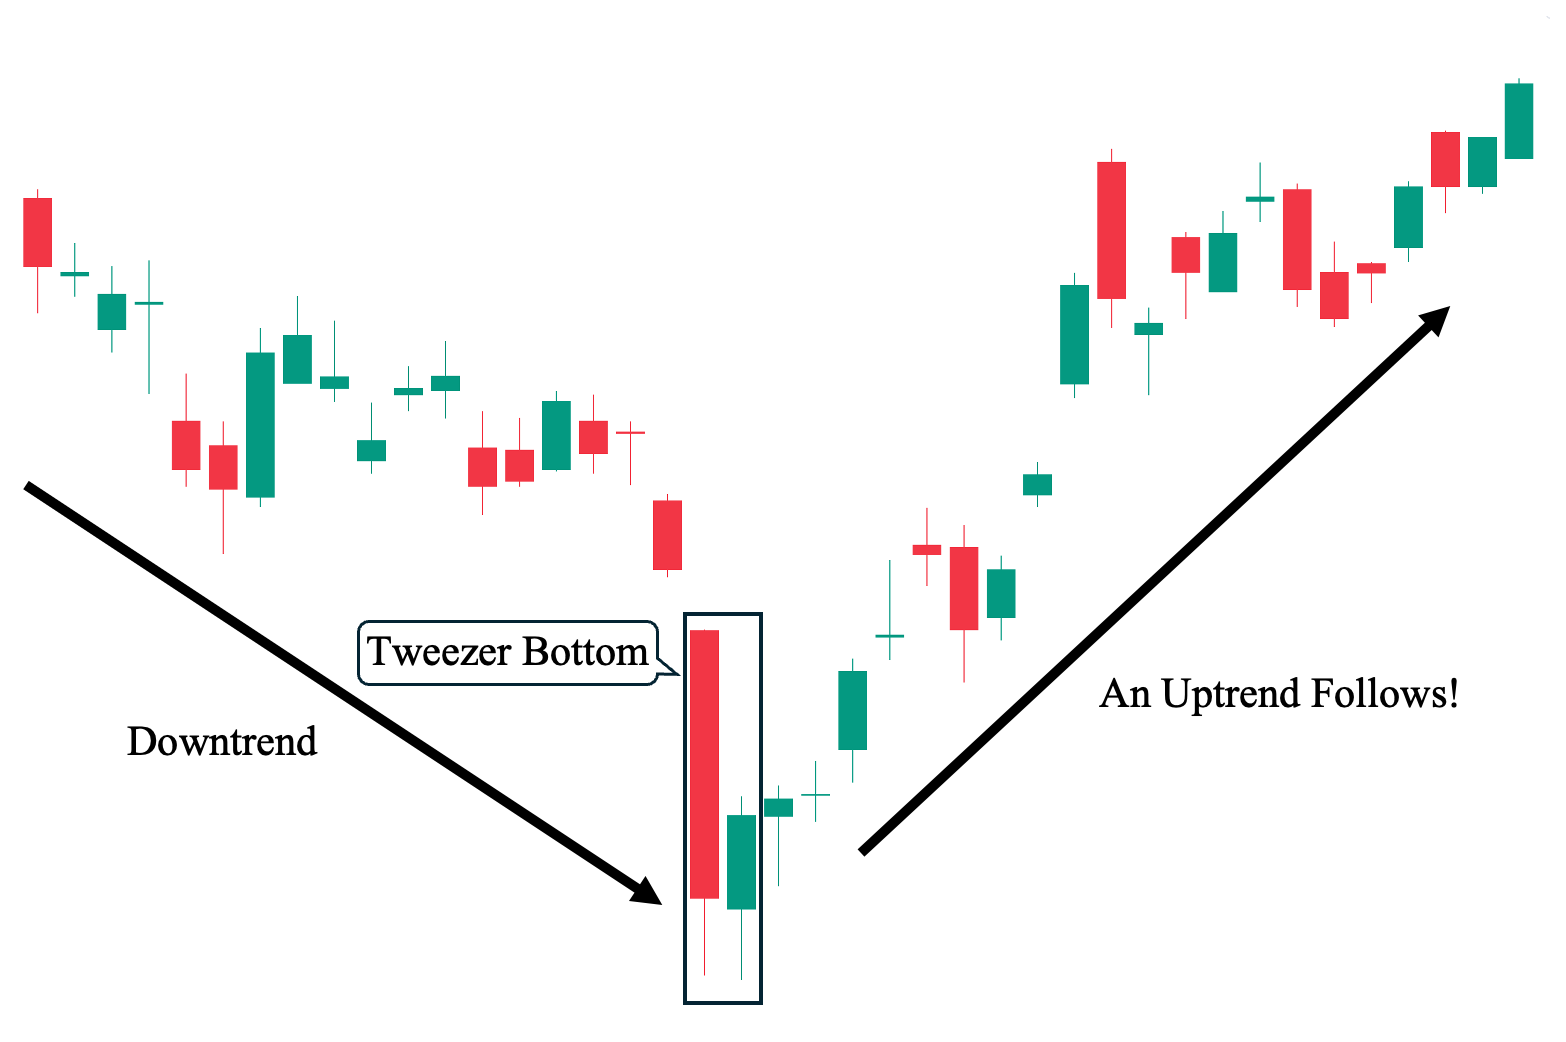
In our first example, we see how a bullish tweezer bottom pattern can successfully lead to a trend or price reversal. As shown, a clear downtrend was in place before the candlestick pattern forms. Then, the tweezer bottom acted as a bullish reversal pattern, leading to a successful uptrend that followed shortly after. This represents the best-case scenario when using it as a bullish reversal pattern.
Example #2: Failed Trend Reversal Scenario
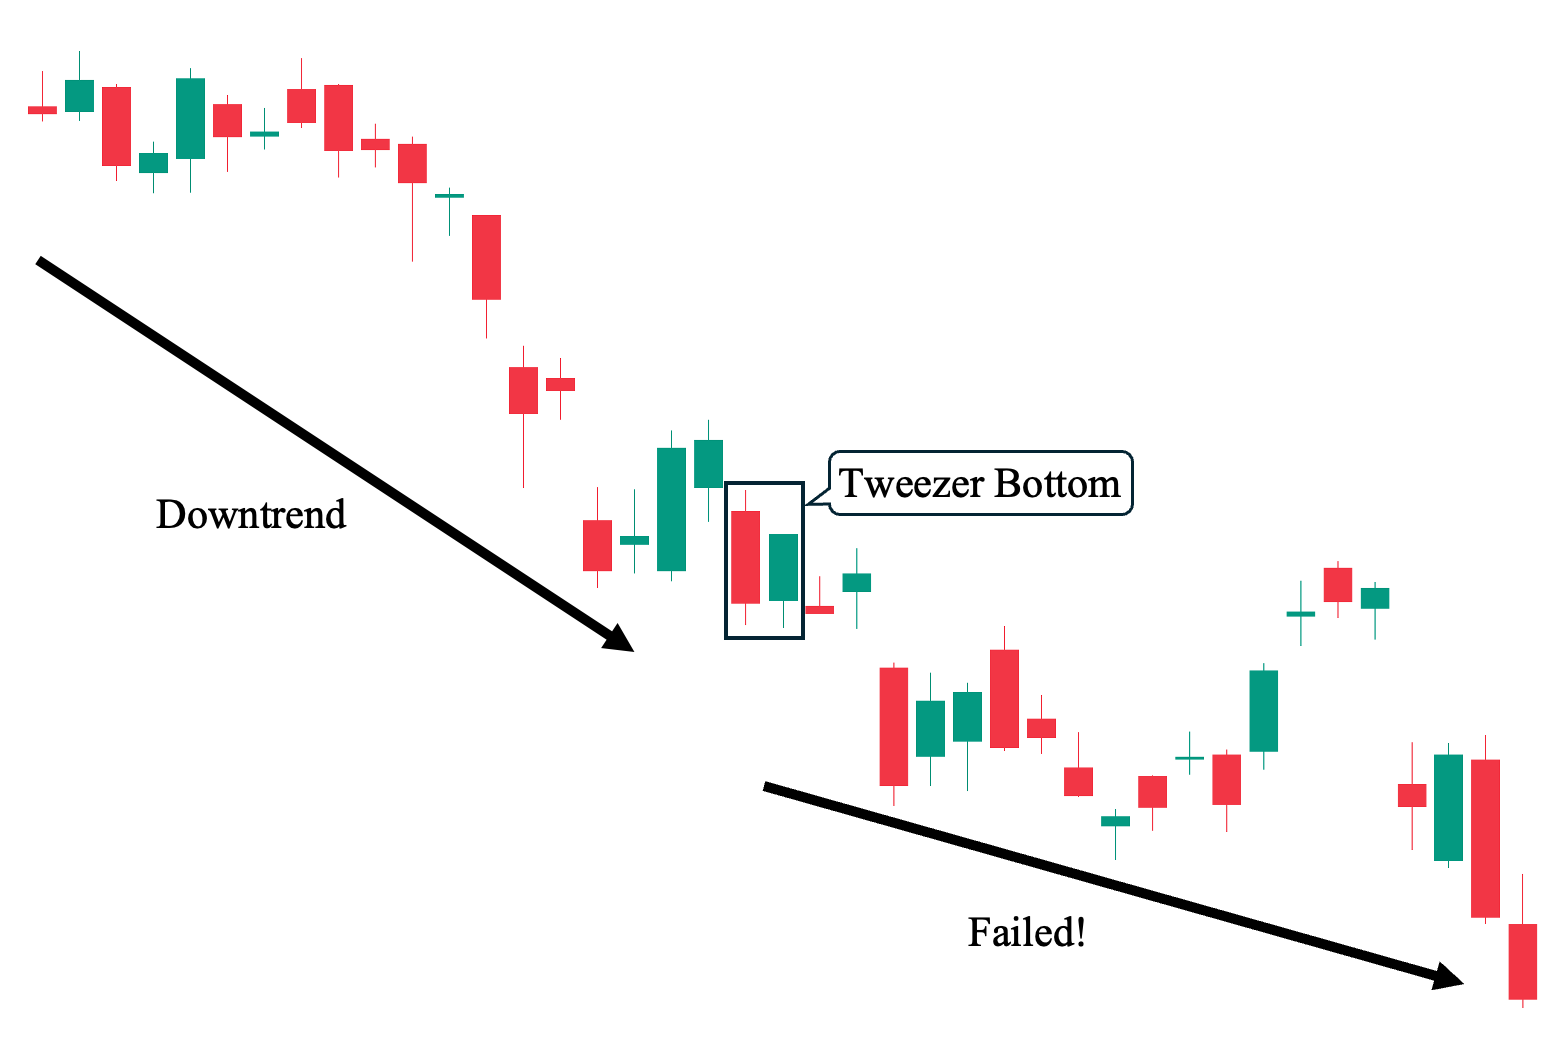
In contrast to our first example, this case illustrates how the tweezer bottom candlestick pattern can fail to serve as a bullish reversal setup. Although the pattern was also preceded by a downtrend, it did not result in a shift in market sentiment, and the asset continued its downward trajectory. This example highlights that potential market reversals are just that—’potential.’ Even with multiple confirmations from different technical indicators and market factors, there is no guarantee that the pattern will be successful.
Reminder: In trading, we are not dealing with certainties but with probabilities, and high-probability trades can still fail. Ultimately, we cannot predict with absolute certainty where the market will go. The only things we can control are the trades that we take and how we manage each of our positions (risk management).
Pro Tip: Always prioritize market structure over any candlestick formation, including the bullish tweezer bottom pattern. When trading any trends, first identify key support and resistance levels. For example, it is unwise to trade a tweezer bottom near a key resistance level in a downtrend. Instead, it’s more prudent to wait until the price breaks the resistance before placing a long position.
Example #3: Indecisive Outcome Scenario
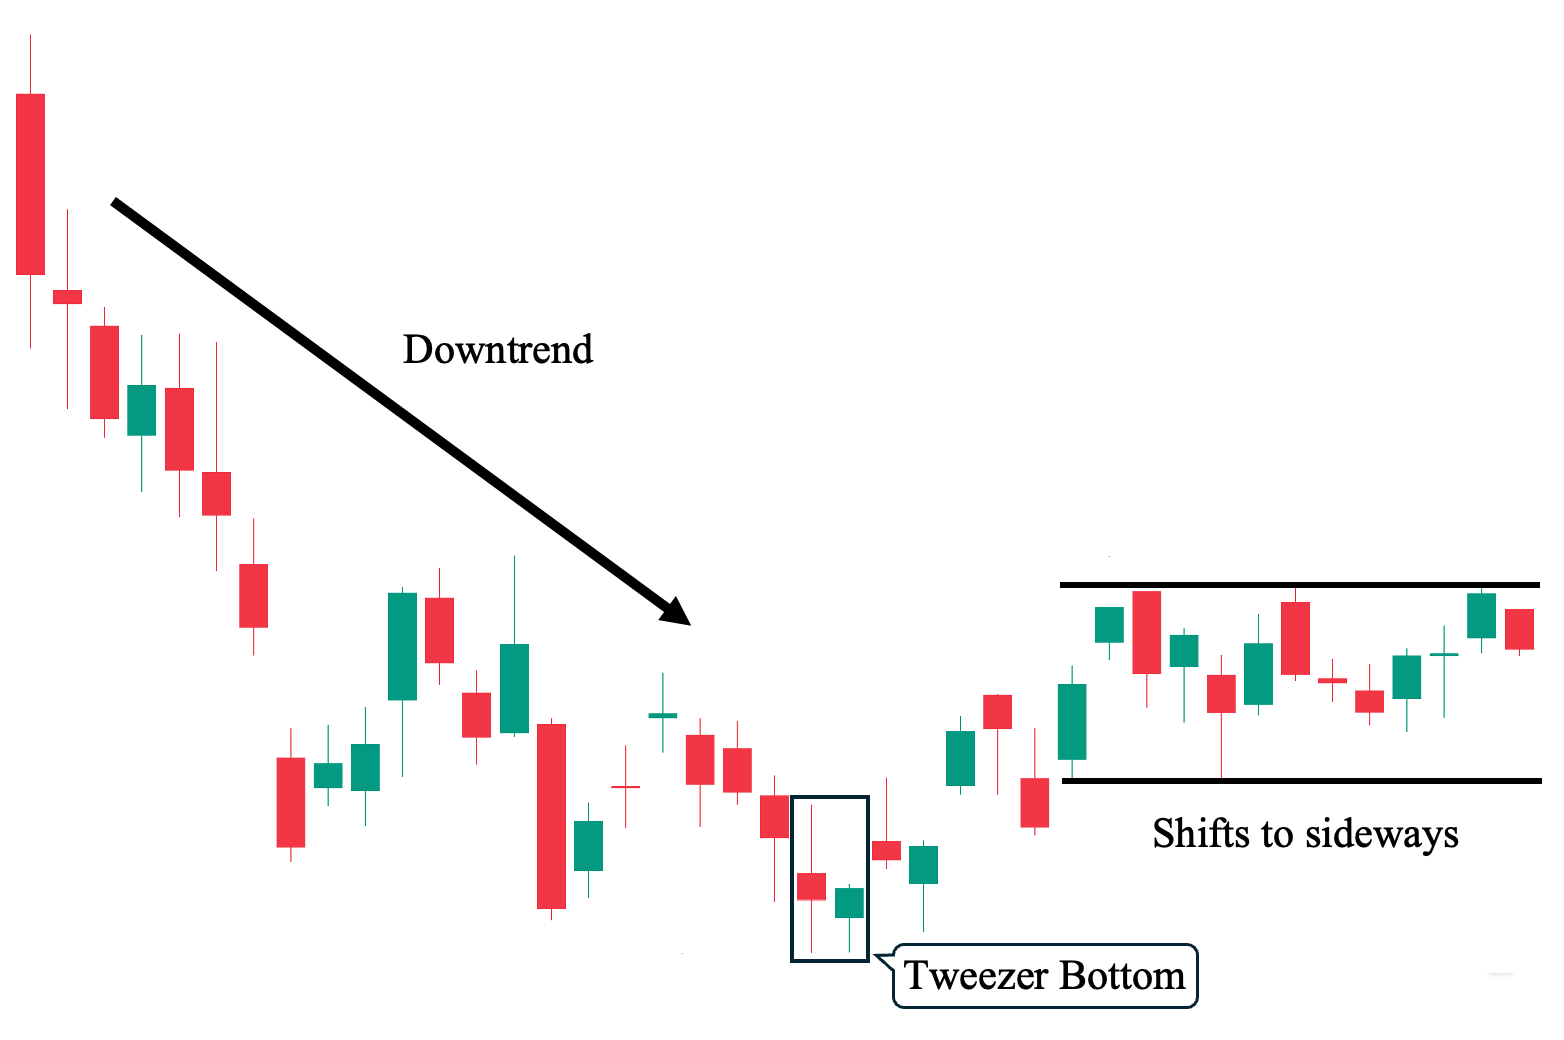
Finally, remember that price moves independently, and we cannot control the outcome of a trade. In this example, we see how the bullish tweezer bottom once again served as a bullish reversal pattern, and initially, the succeeding candles suggested a potential rewarding uptrend. However, the price eventually hit a ceiling and began moving sideways. If you hold a position in this trade, you might find yourself stuck as the price fails to make decisive moves in either direction, leaving you without hitting either your stop loss (or trailing stop) or your target price (TP).
Pro Tip: If you have limited capital, this can represent an opportunity cost. Your allotted capital is essentially trapped in this trade unless it reaches either your target price or your trailing stop. Therefore, we recommend setting a “time stop,” which is the maximum period you will hold an indecisive (or sideways-moving) position before selling. This strategy allows you to free up capital for more productive trades with a faster turnaround.
Tweezer Bottom Pattern Trading Strategies
Here are different ways to incorporate a tweezer bottom candlestick pattern with other market or technical analysis tools (e.g., technical indicators) under the following market conditions:
Pullbacks On Naked Charts
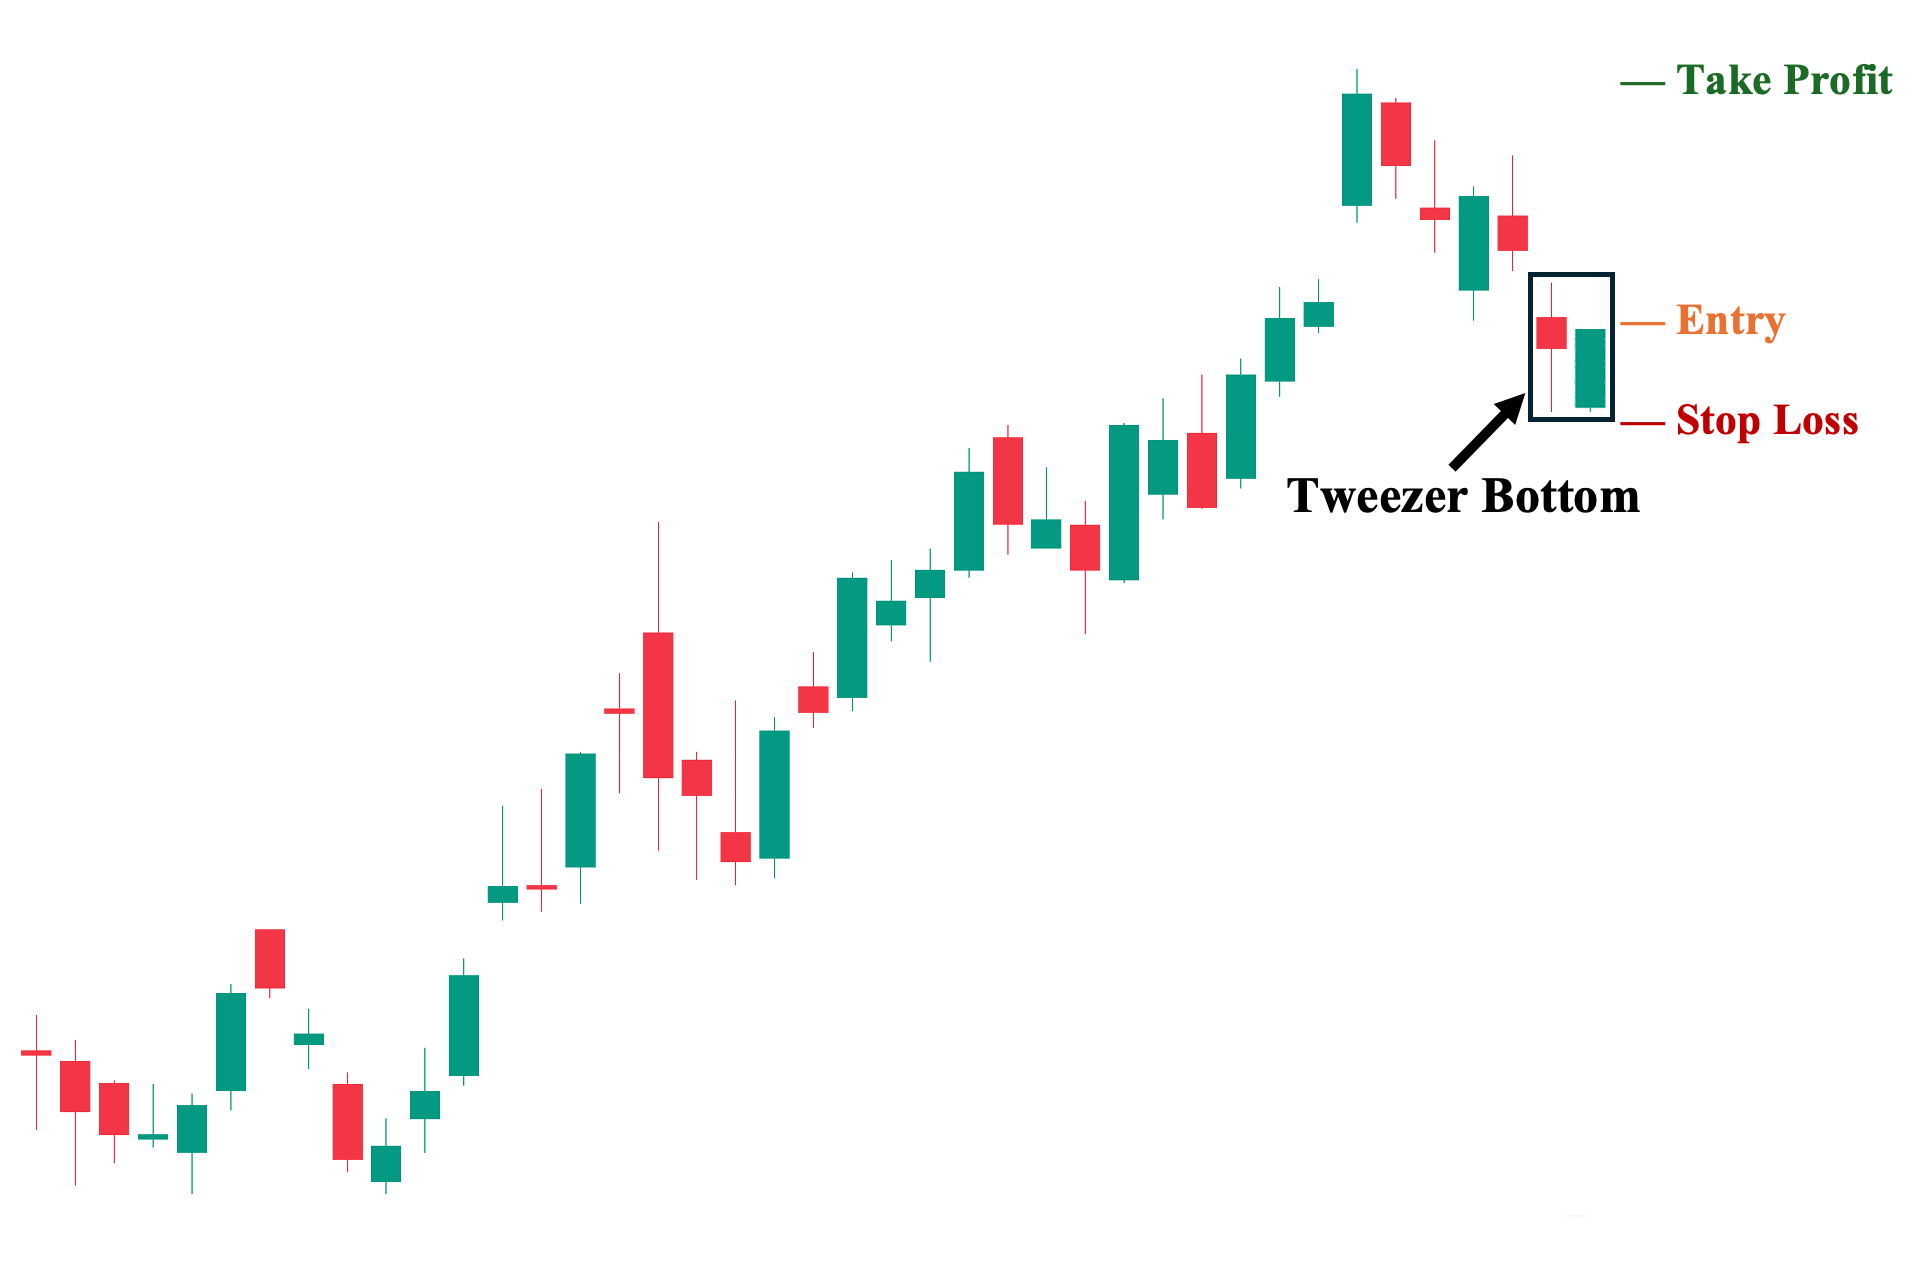
You can use the bullish tweezer bottom candlestick pattern on a pure price chart, free of any indicators or even volume, similar to the illustration above. In this example, you can observe a clear uptrend followed by a pullback before the tweezer bottom develops—the simplest way to utilize the tweezer bottom. However, we strongly advise including volume when determining whether a tweezer bottom is valid as a reversal candlestick pattern.
1. Entry Point: A few ticks above the second candle’s high.
2. Stop Loss Points: Set your stop loss a few ticks below the second candle’s low.
3. Take Profit (TP) Level: Set your TP a few ticks below the nearest key structural resistance level. In this case, the previous uptrend’s high.
4. Risk-Reward Ratio: The risk/reward ratio must be at least 1:1. We do not recommend taking trades with a ratio below this in any trading situation. The higher the potential reward relative to the risk, the better. However, make sure you use an objective approach when setting your TP and SL levels rather than inflating them artificially.
Trading The Tweezer Bottom With Key Structural Levels
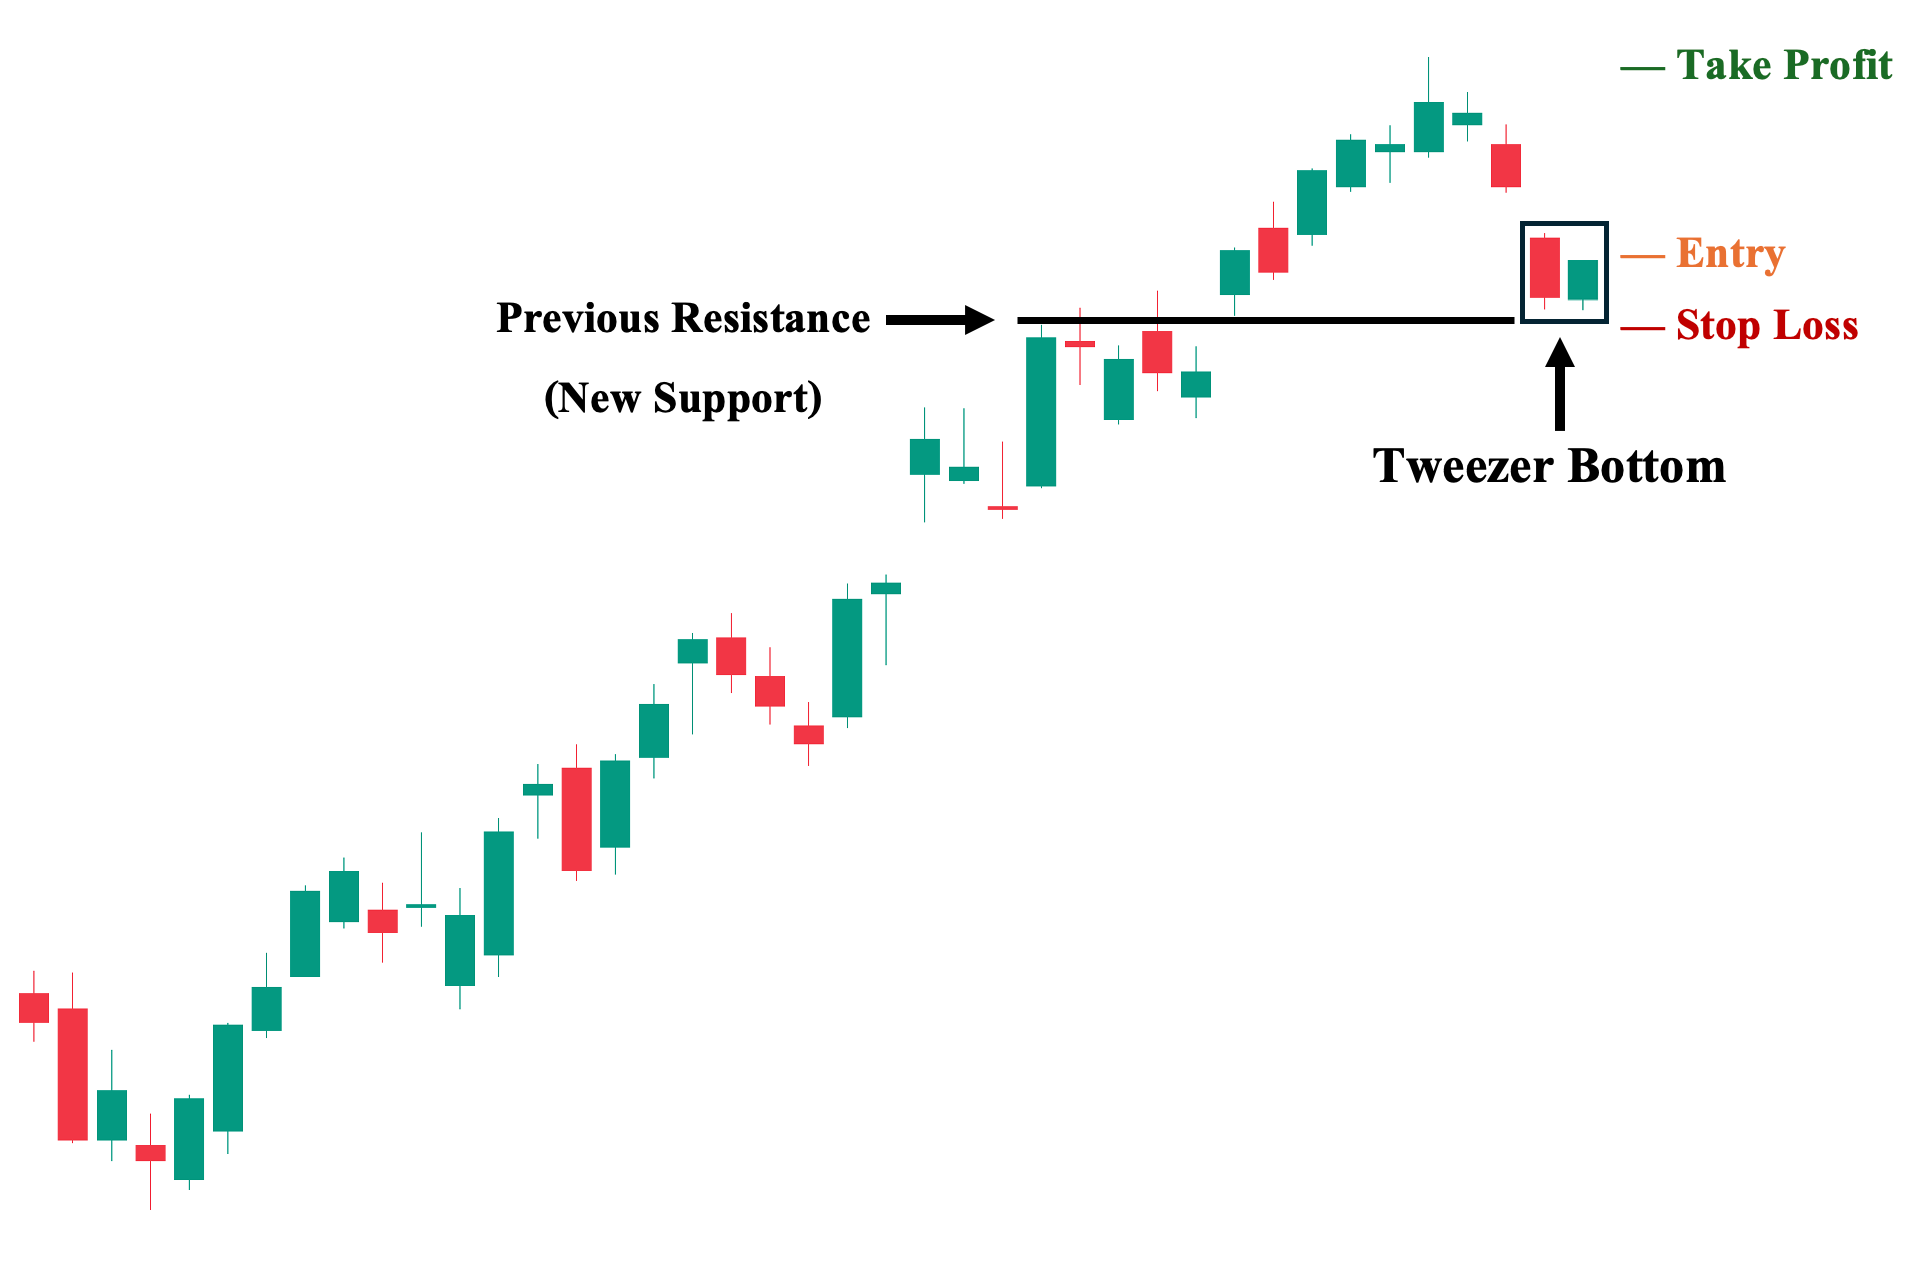
To elevate trading purely on naked charts, we recommend actively using key structural levels (i.e., support and resistance levels). As shown, a strong and decisive uptrend preceded the candlestick pattern. Then, the price makes a new high before pulling back to the previous resistance level, which now acts as the nearest support. At this same level, the bullish tweezer bottom candlestick pattern appears, with both candles bouncing off this key price level. This is an ideal trade setup, as it provides a clear structural level to base entry and stop-loss points, offering an attractive risk-reward ratio.
1. Entry Point: A few ticks above the second candle’s high.
2. Stop Loss Points: Set your stop loss a few ticks below both the second candle’s low and the nearest support level.
3. Take Profit (TP) Level: Set your TP a few ticks below the nearest key structural resistance level. In this case, the previous uptrend’s high.
4. Risk-Reward Ratio: The risk/reward ratio must be at least 1:1. We do not recommend taking trades with a ratio below this in any trading situation. The higher the potential reward relative to the risk, the better. However, make sure you use an objective approach when setting your TP and SL levels rather than inflating them artificially.
Trading The Tweezer Bottom With a Moving Average
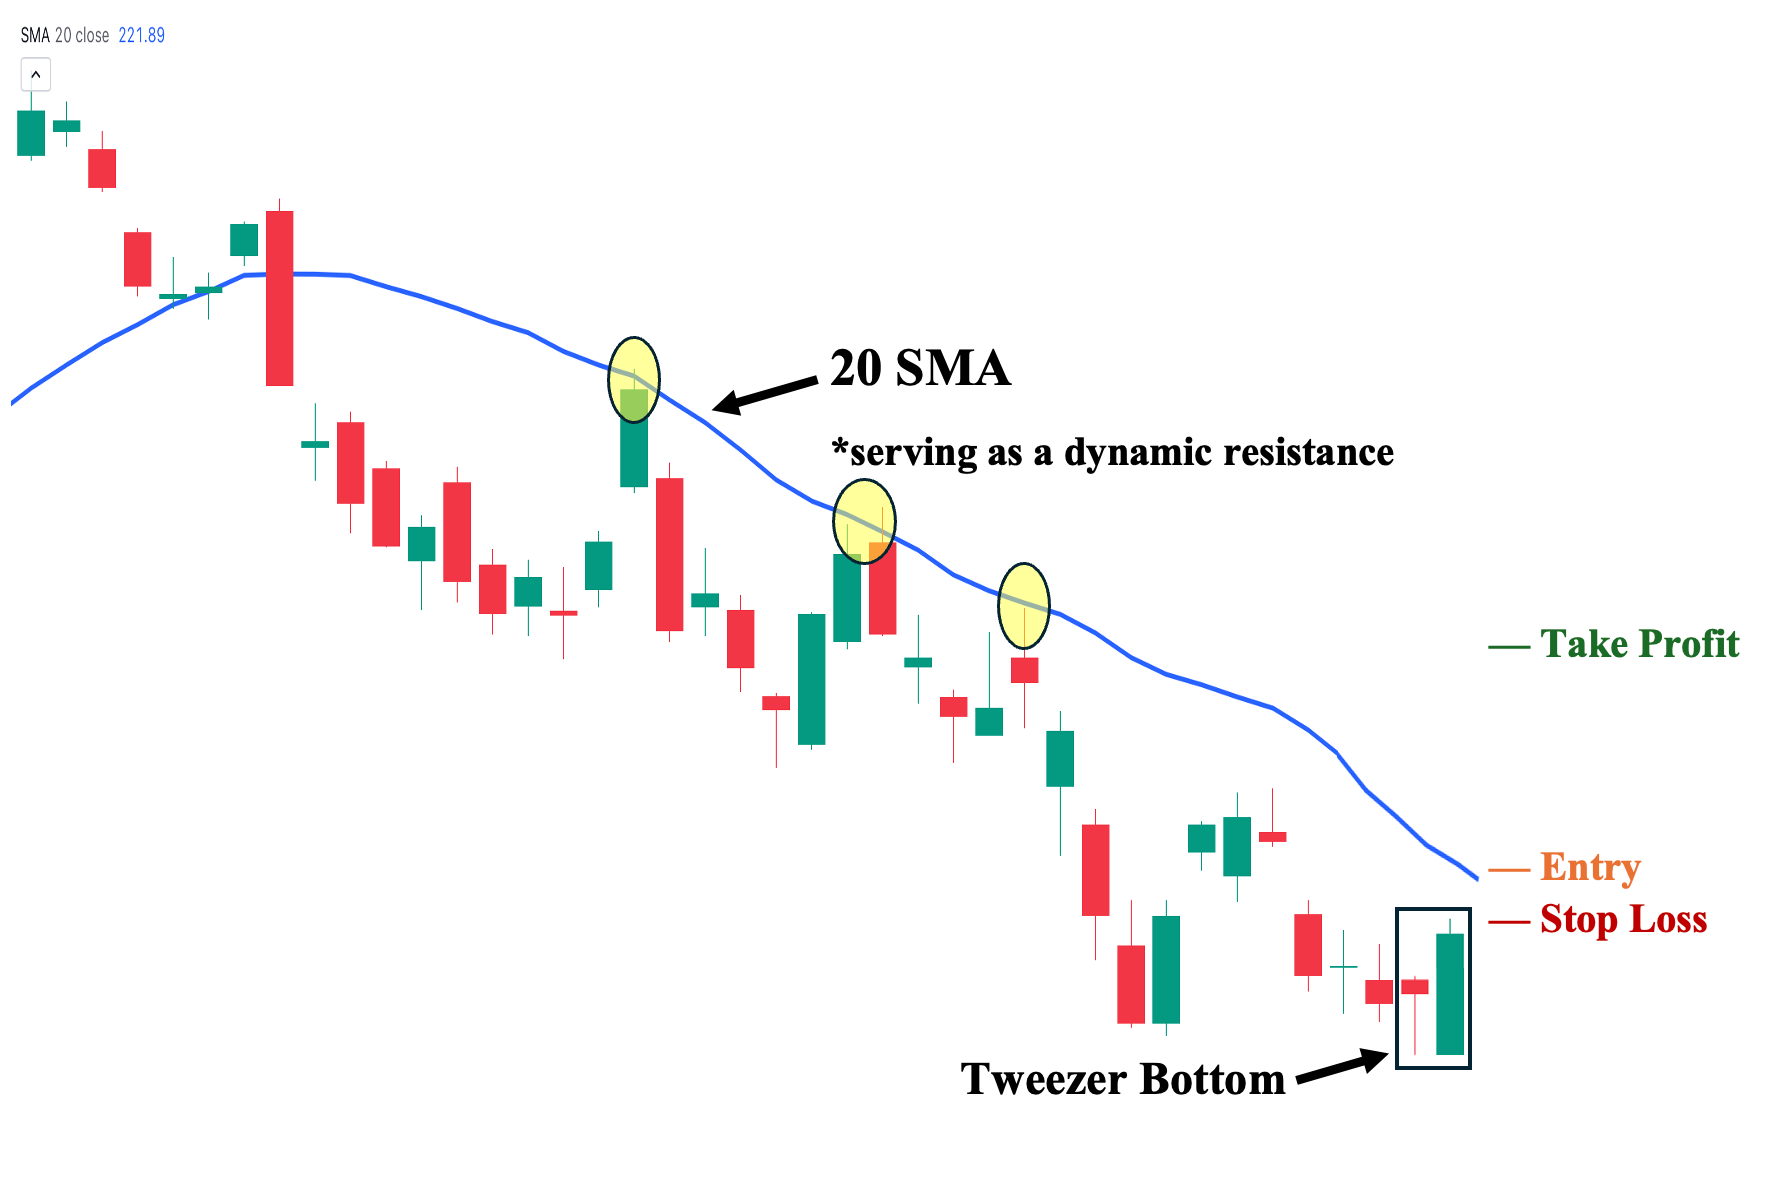
You can incorporate a moving average when analyzing the tweezer bottom candlestick pattern. In this example, we use a 20-period simple moving average (20 SMA)—a commonly used short-term indicator—as a dynamic resistance level. You can then observe how it acts as the ceiling of the ongoing downtrend, with the price struggling to break above it. Hence, for the tweezer bottom pattern to lead to a successful reversal, the price must break this resistance level first and stay above it.
1. Entry Point: A few ticks above the 20 SMA (the price needs to close above this resistance level first).
2. Stop Loss Points: Set your stop loss a few ticks below the 20 SMA.
3. Take Profit (TP) Level: Set your TP a few ticks below the nearest structural resistance level.
4. Trailing Stop: Sell if the price breaks below the 20 SMA before reaching your target price.
5. Risk-Reward Ratio: The risk/reward ratio must be at least 1:1. We do not recommend taking trades with a ratio below this in any trading situation. The higher the potential reward relative to the risk, the better. However, make sure you use an objective approach when setting your TP and SL levels rather than inflating them artificially.
Trading The Tweezer Bottom With RSI Divergences
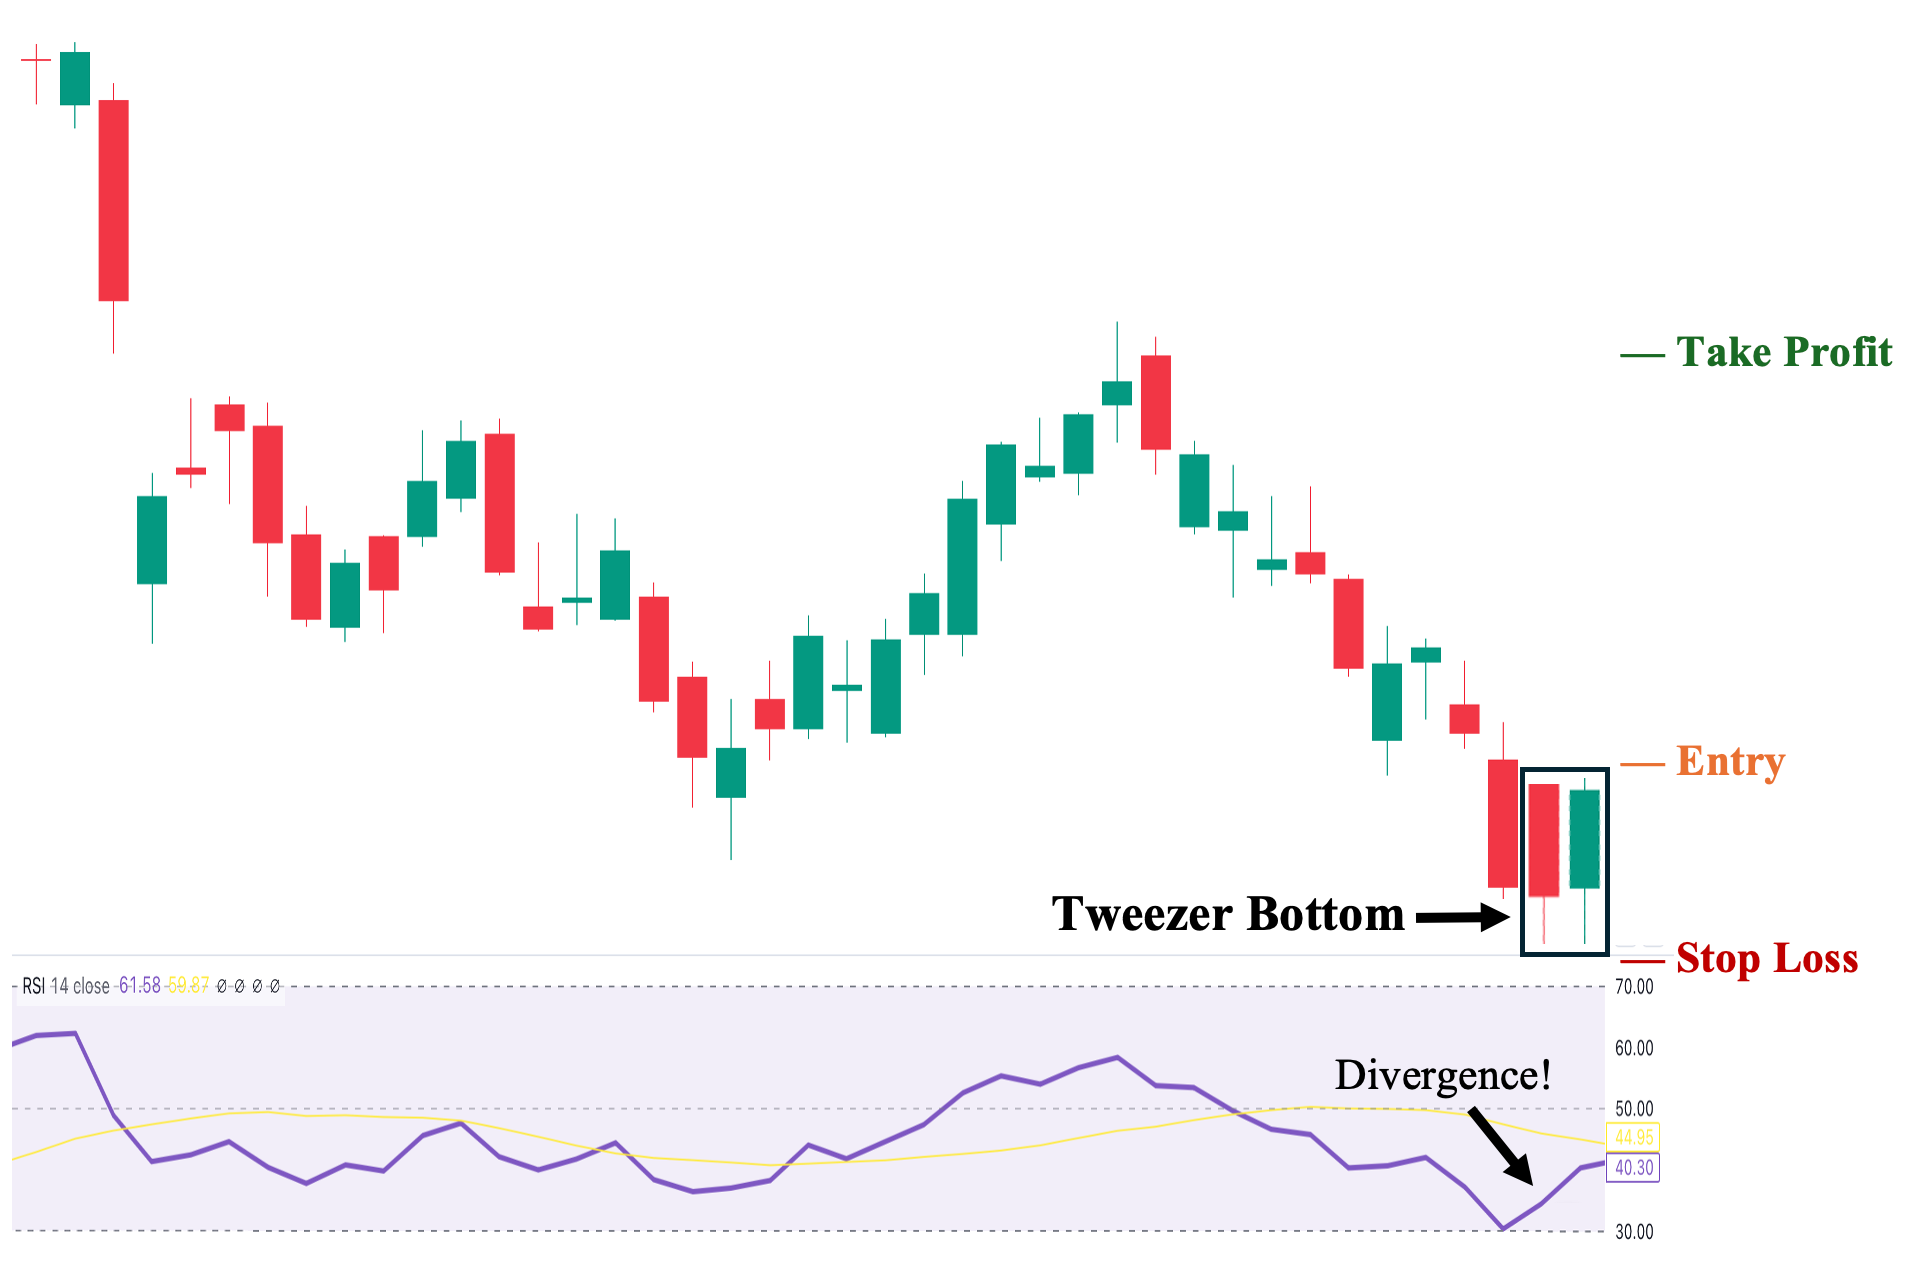
One of our favorites, you can also add Relative Strength Index (RSI) as a divergence tool to help you identify possible openings when analyzing a tweezer bottom candlestick pattern. As shown, a tweezer bottom appeared at the lowest point of the ongoing downtrend. Yet despite the price going down, the RSI started to point up, coinciding with the appearance of a tweezer bottom at the same low price. This adds another layer of confirmation that this reversal pattern may indeed have a higher success rate.
1. Entry Point: A few ticks above the second candle’s high.
2. Stop Loss Points: Set your stop loss a few ticks below the second candle’s close.
3. Take Profit (TP) Level: Set your TP a few ticks below the nearest structural resistance level.
4. Trailing Stop: Sell if the price and RSI diverge once again and RSI starts to point downwards.
5. Risk-Reward Ratio: The risk/reward ratio must be at least 1:1. We do not recommend taking trades with a ratio below this in any trading situation. The higher the potential reward relative to the risk, the better. However, make sure you use an objective approach when setting your TP and SL levels rather than inflating them artificially.
Trading The Tweezer Bottom With Fibonacci (Fib) Retracement
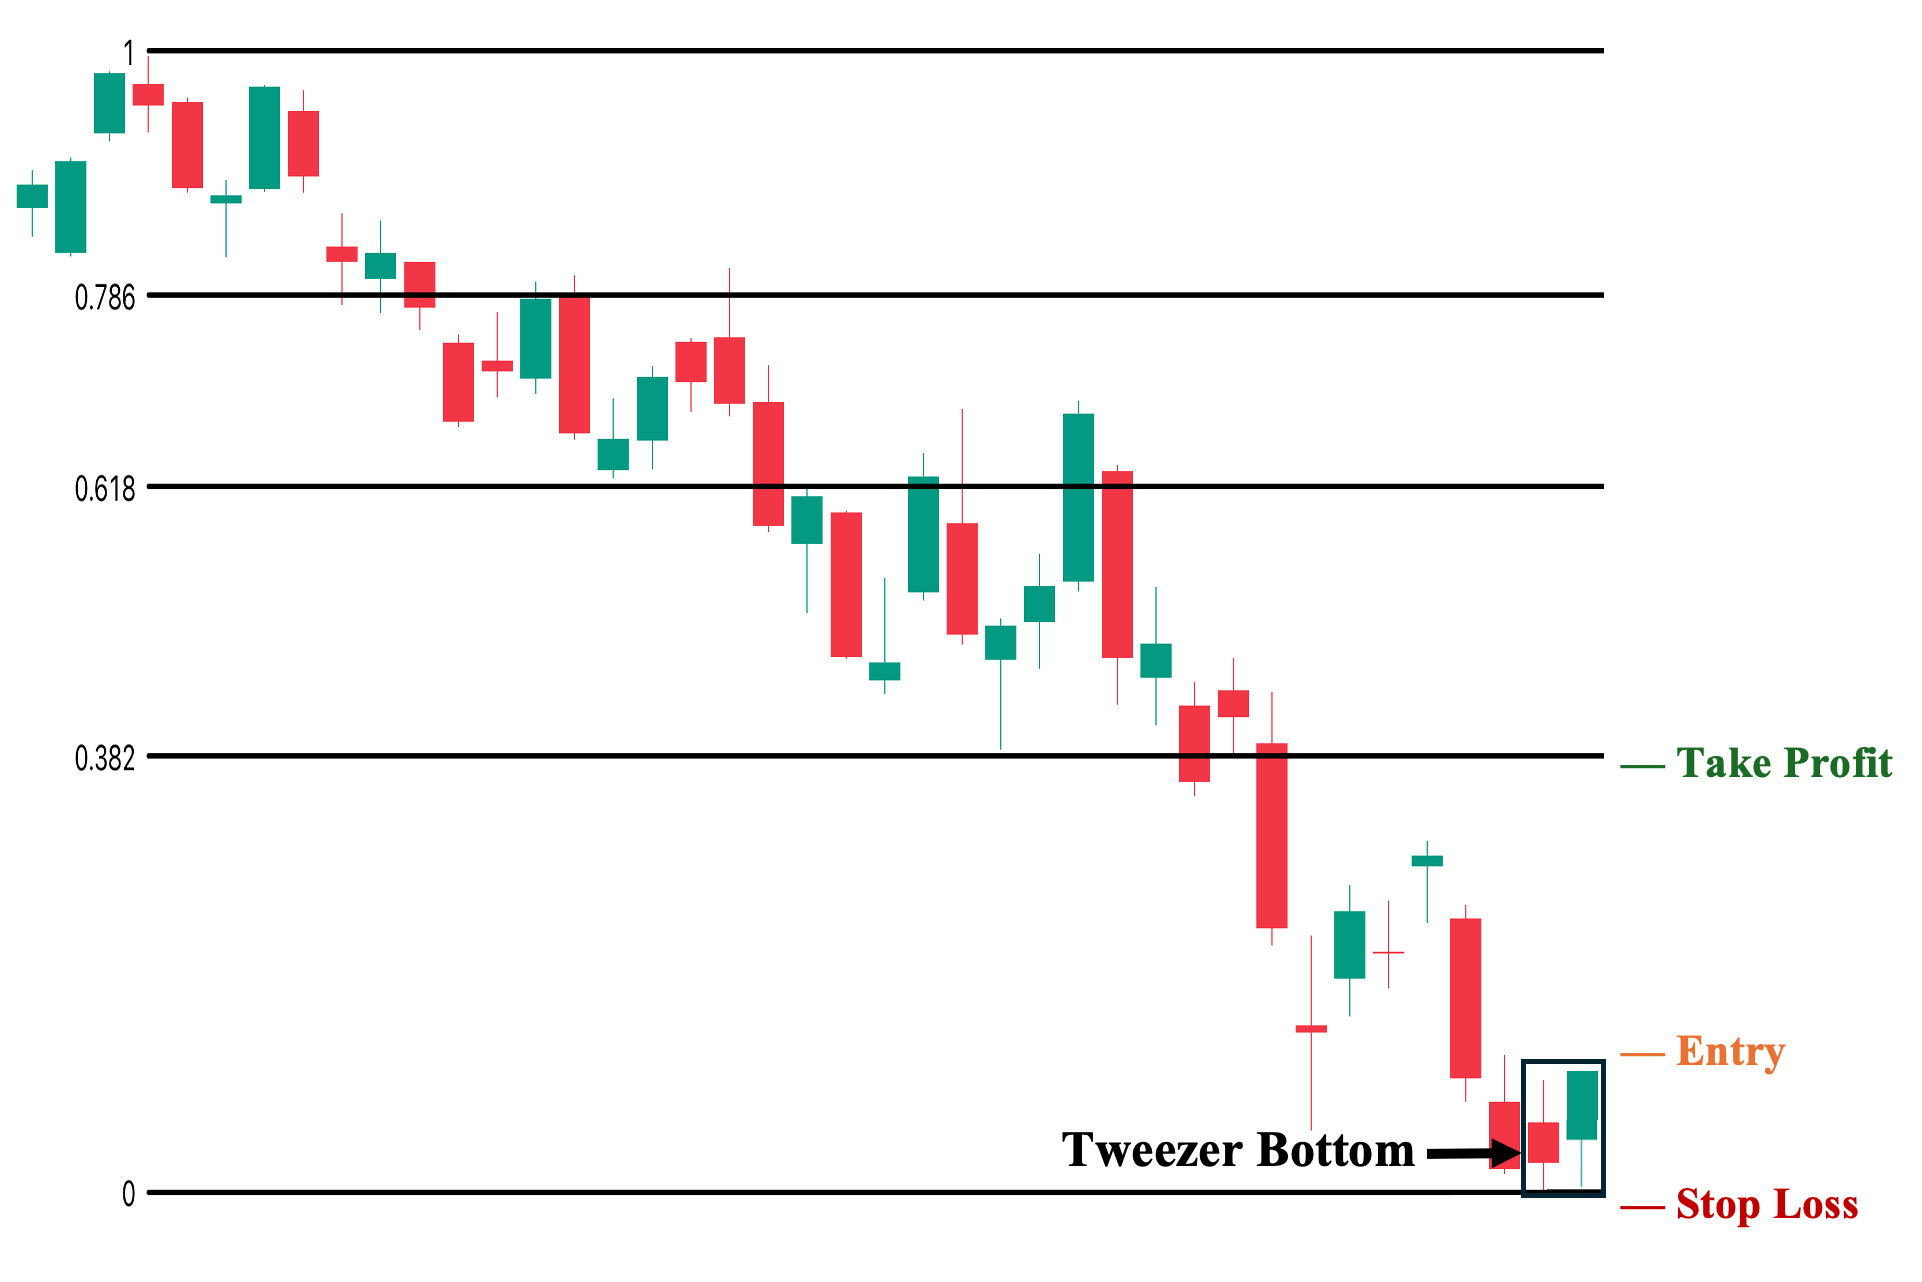
You can also use the Fibonacci tool with the tweezer bottom candlestick pattern to determine possible resistance levels during a reversal. As shown, we set our zero figure at the lowest point of the tweezer bottom and set our one value at the recent downtrend’s high. We can then see the significant fib values that can serve as resistance levels along the way that, hopefully, price breaks as it transitions towards a potential uptrend.
1. Entry Point: A few ticks above the second candle’s high.
2. Stop Loss Points: Set your stop loss a few ticks below the second candle’s low.
3. Take Profit (TP) Level: Set your TP a few ticks below the nearest Fib level. In this case, the 0.382 level.
4. Risk-Reward Ratio: The risk/reward ratio must be at least 1:1. We do not recommend taking trades with a ratio below this in any trading situation. The higher the potential reward relative to the risk, the better. However, make sure you use an objective approach when setting your TP and SL levels rather than inflating them artificially.
Trading The Tweezer Bottom With Pivot Points
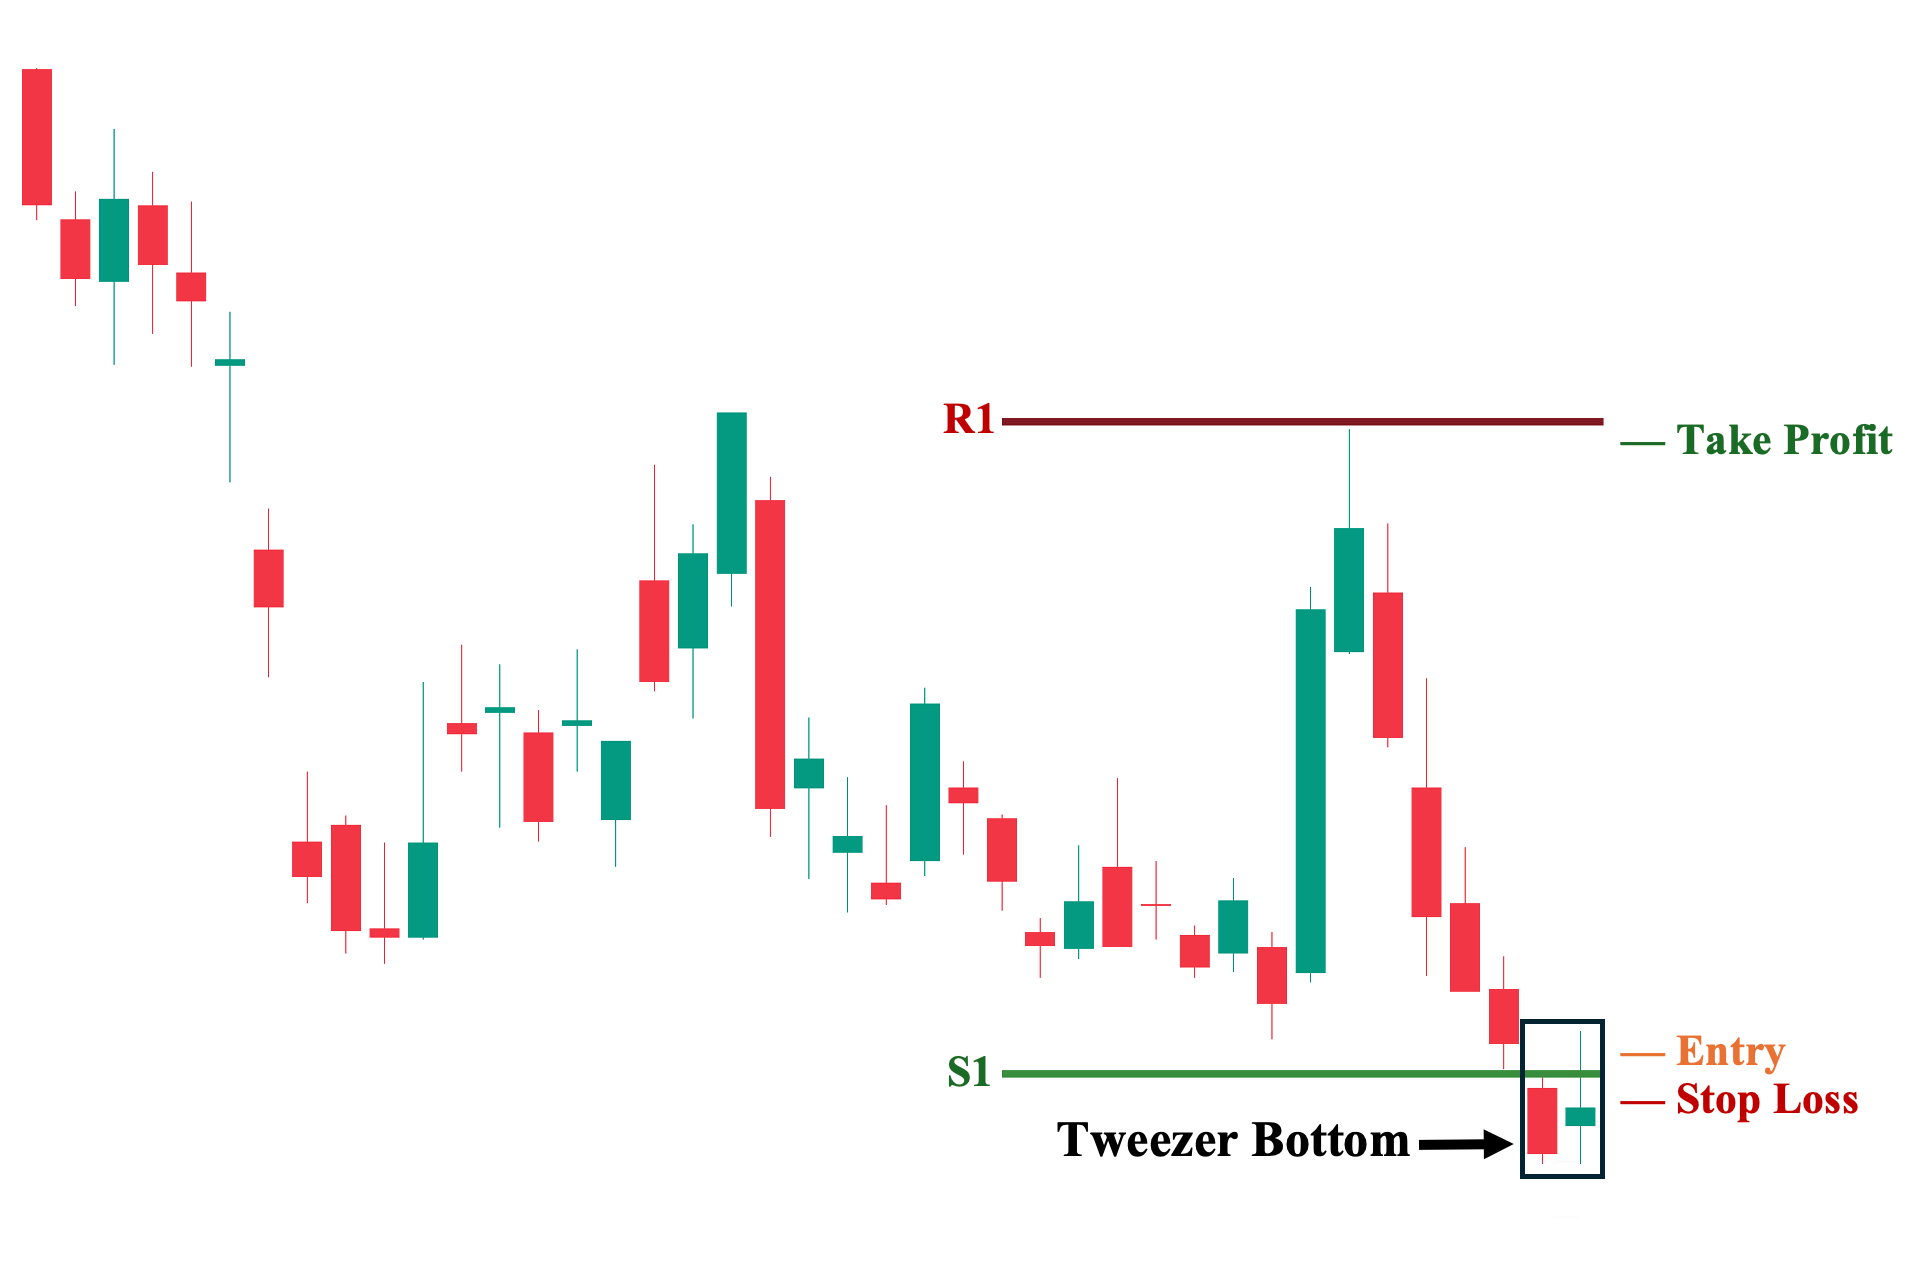
Similar to the Fibonacci tool, pivot points can also serve as a valuable tool in identifying automatically the nearest key levels. As shown, our first support level was established just above the first candle of the tweezer bottom candlestick pattern. Hence, we know this is a significant area that the price needs to break first before the tweezer bottom can be a possible candidate for a successful reversal attempt. Likewise, we are also provided with the likely nearest resistance, where we can set around our TP.
1. Entry Point: A few ticks above the S1 level.
2. Stop Loss Points: Set your stop loss a few ticks below the second candle’s low.
3. Take Profit (TP) Level: Set your TP a few ticks below the next pivot level. In this case, the R1.
4. Risk-Reward Ratio: The risk/reward ratio must be at least 1:1. We do not recommend taking trades with a ratio below this in any trading situation. The higher the potential reward relative to the risk, the better. However, make sure you use an objective approach when setting your TP and SL levels rather than inflating them artificially.
Trading The Tweezer Bottom With MACD
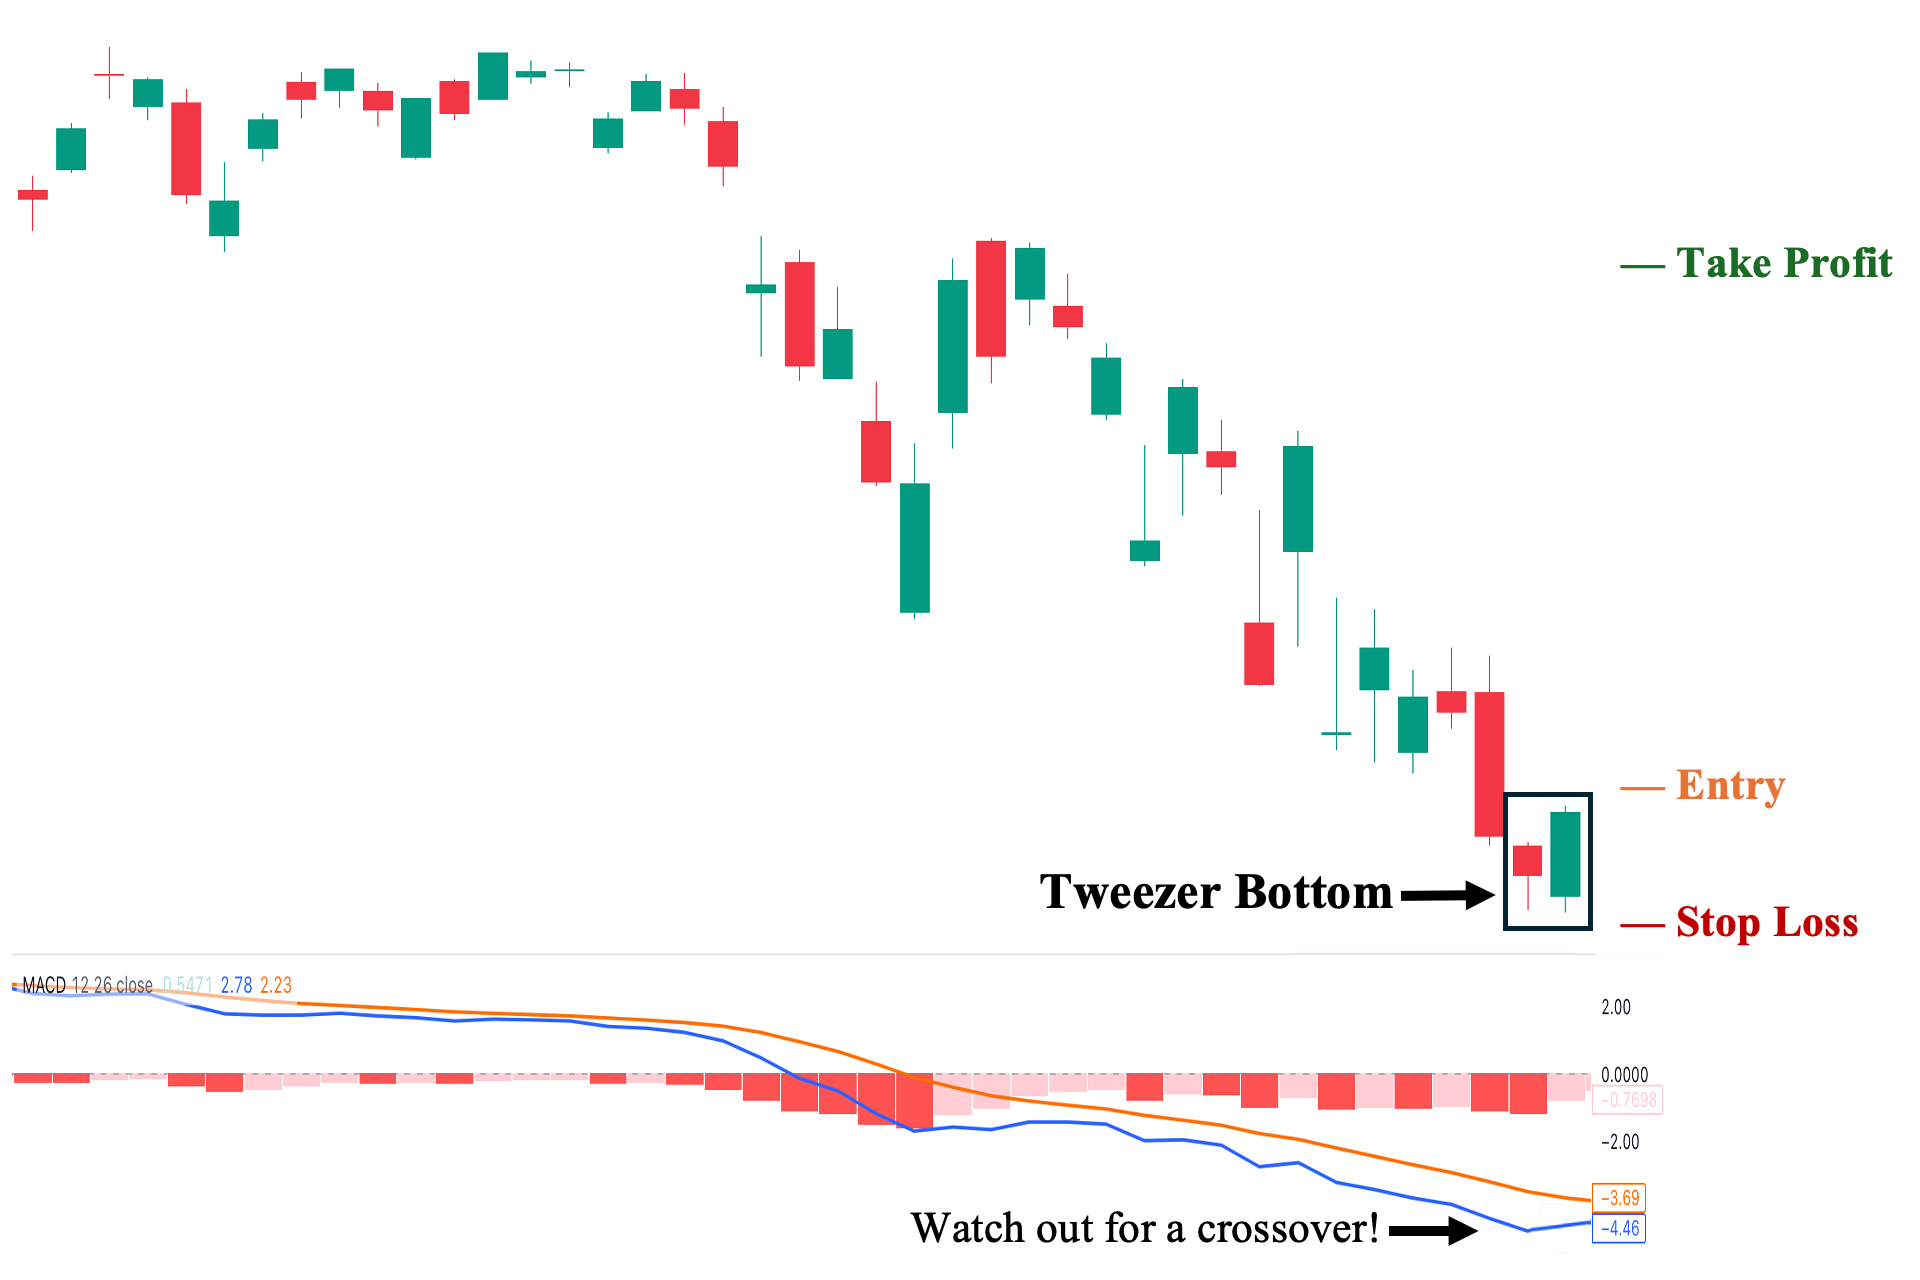
You can also use the Moving Average Convergence Divergence (MACD) tool as an added layer of confirmation for using the tweezer bottom candlestick pattern. In this case, we first wait for a crossover between our MACD (blue) line and Signal (orange) line. As shown, when the blue line finally crosses the orange line, we have a bullish crossover, which signals that the tweezer bottom will have a higher probability of being a successful reversal signal.
1. Entry Point: Enter when the blue line crosses above the orange line.
2. Stop Loss Points: Set your stop loss a few ticks below the second candle’s low.
3. Take Profit (TP) Level: Set your TP a few ticks below the nearest structural resistance level.
4. Trailing Stop: Sell if the orange line crosses above the blue line before hitting your TP.
5. Risk-Reward Ratio: The risk/reward ratio must be at least 1:1. We do not recommend taking trades with a ratio below this in any trading situation. The higher the potential reward relative to the risk, the better. However, make sure you use an objective approach when setting your TP and SL levels rather than inflating them artificially.
Trading The Tweezer Bottom With Bollinger Bands®
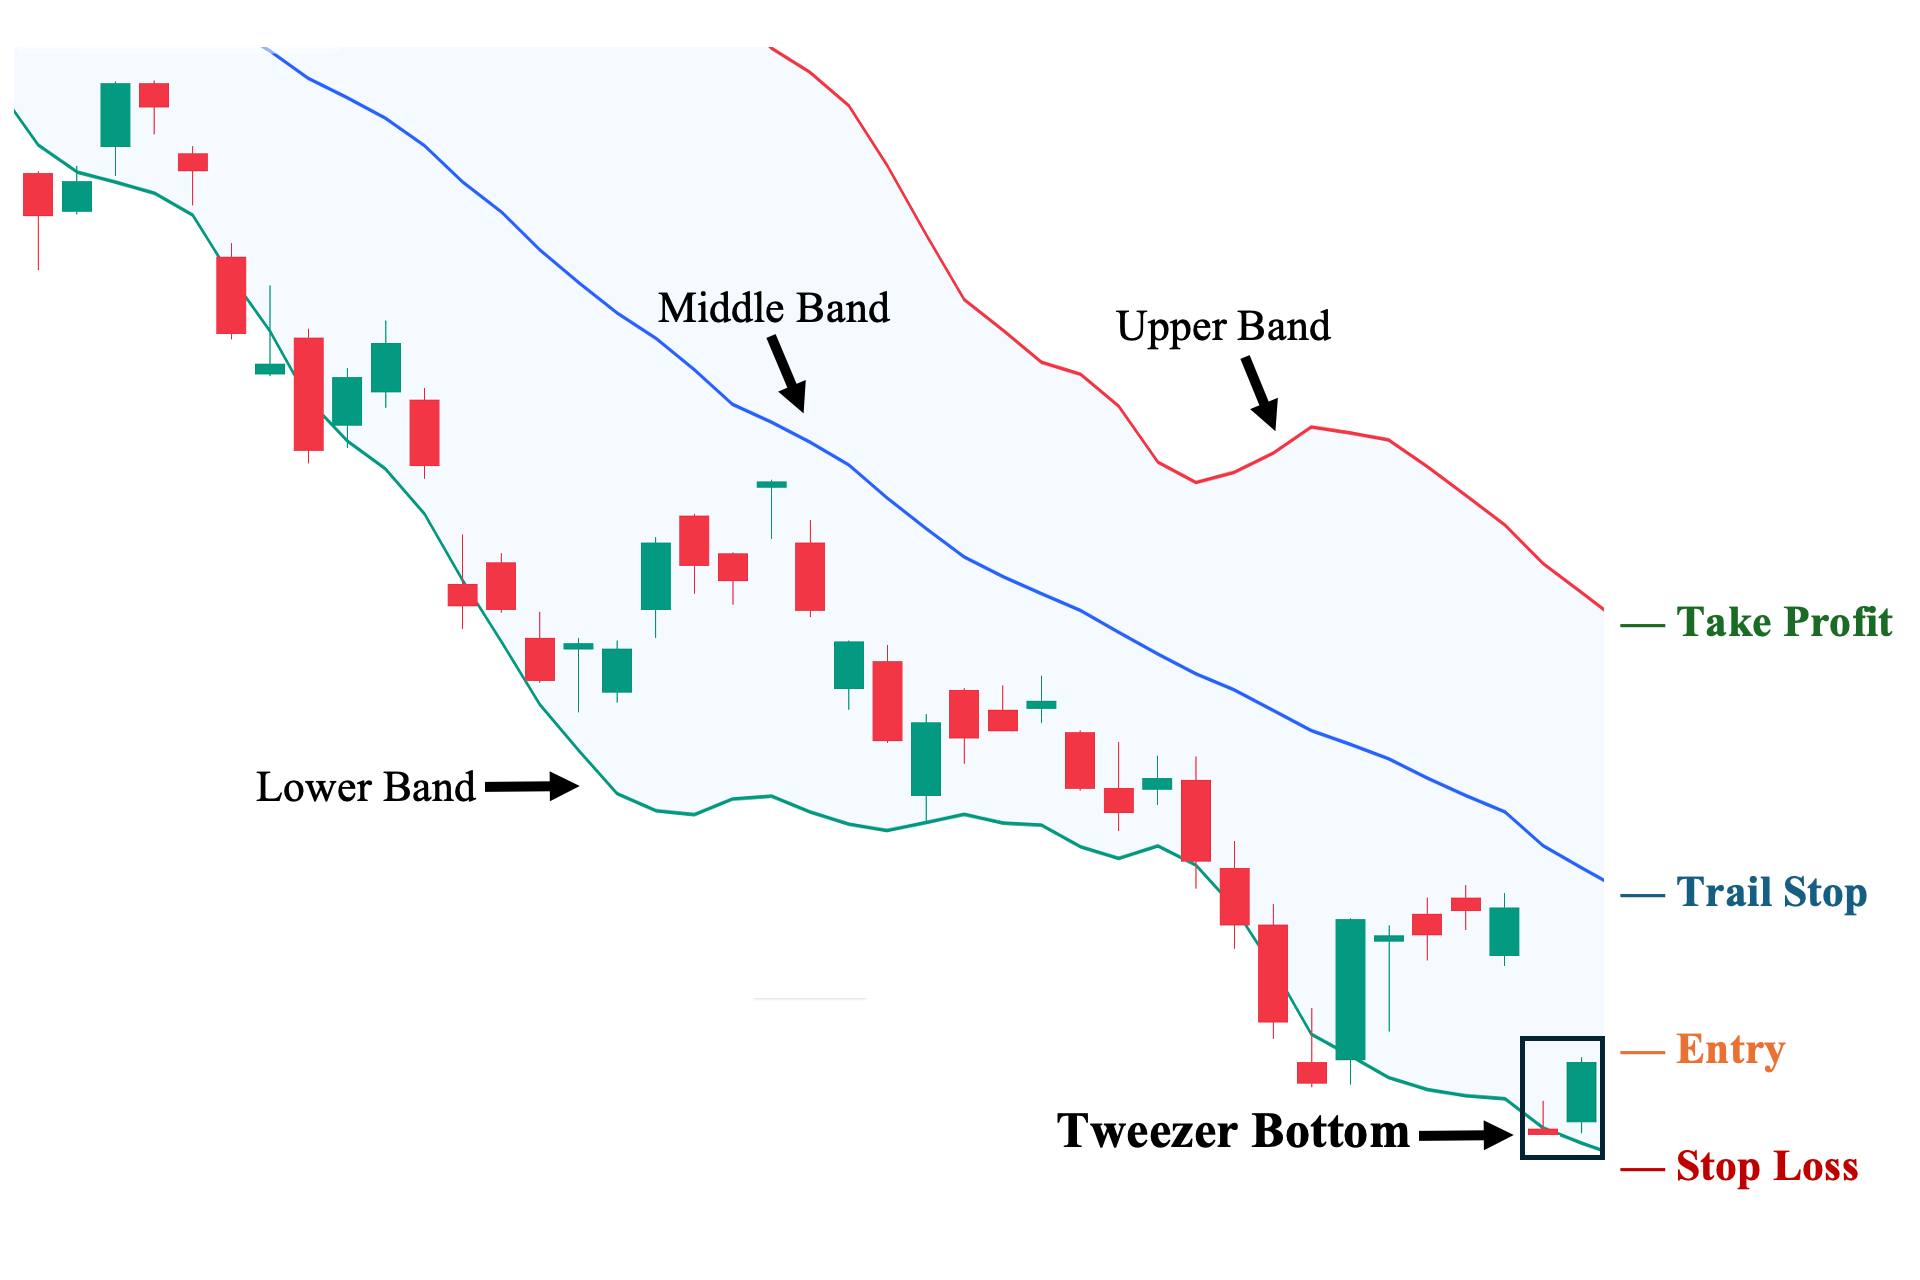
Finally, we can also use another prominent technical analysis indicator, the Bollinger Bands®, to identify key levels around the bullish tweezer bottom. As shown, there are three bands, each serving different purposes. The lower band primarily serves as the dynamic support level, the upper band as a dynamic support level, and the middle band as a divider. When the asset is predominantly trading below the middle band, then we have a downtrend (as you can also observe in our illustration). In contrast, when the price is mostly trading above the middle band, then we have an uptrend. Ultimately, if the tweezer bottom setup is to be successful, the price eventually needs to break and trade above the middle band line.
1. Entry Point: A few ticks above the second candle’s high.
2. Stop Loss Points: Set your stop loss a few ticks below the lower band line.
3. Take Profit (TP) Level: Set your TP a few ticks below the upper band line.
4. Trailing Stop: Sell if the price breaks the middle band line before reaching your TP.
5. Risk-Reward Ratio: The risk/reward ratio must be at least 1:1. We do not recommend taking trades with a ratio below this in any trading situation. The higher the potential reward relative to the risk, the better. However, make sure you use an objective approach when setting your TP and SL levels rather than inflating them artificially.
Trading Tweezer Bottom With Volume
Incorporating volume into your strategy’s analysis can help provide clues about the pattern’s ability to reverse prices.
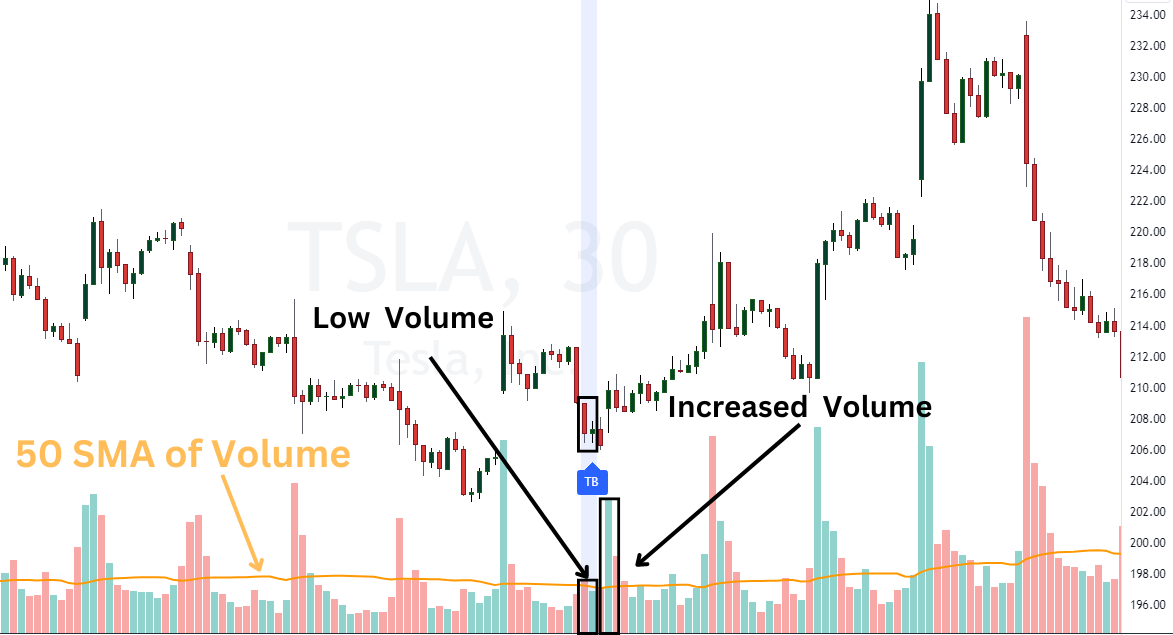
Here’s an example of a bullish tweezer bottom on a 30-minute Tesla chart with volume bars included at the bottom of the chart. We apply a 50 period simple moving average to the the volume to gauge whether there was strong interest in that session’s trend.
Volume tends to follow the trend in that increased volume indicates what the underlying trend may be. When the tweezer bottom pattern formed, volume was right at the 50-period moving average. Look for a bullish breakout to appear on increased volume shortly after.
Two sessions later, TSLA gapped to the upside on more than double the typical volume indicating the trend is likely to resume higher. Over the next several days, TSLA did rally nearly 10%.
Is the Tweezer Bottom Pattern Better for Short-Term Trading or Long-Term Investing?
The bullish tweezer bottom pattern is versatile and can be applied to a multitude of varied chart time frames and trading styles such as scalping, day trading, swing trading, or position trading.
Comparatively, the tweezer bottom pattern is better suited for quick decision making that is often required in short-term trading. At its core, candlestick patterns are short-term technical analysis tools that provide quick insight to the sentiment within the market.
A tweezer bottom reversal pattern, simply signals that prices could not press below a specified price level during two consecutive sessions. That type of a signal can be quickly spotted.
When investing for the longer-term, quick decisions is not as important because the investor has the benefit of time. The investor is more likely to key in defining factors such as an asset’s fundamentals (e.g., earnings, management reputation, and future prospect) that are typically more relevant than its technical price patterns.
Advantages of Trading the Tweezer Bottom Pattern
The following are the three crucial advantages of using tweezer bottom patterns:
1. Pinpoints exhaustion points
One of the key strengths of the bullish tweezer bottom pattern is its ability to show clearly when the price experiences “exhaustion” (when one party, in this case, sellers, loses steam and realizes that they are losing control). Hence, this pattern is a great way to understand the general sentiment regarding the asset, especially when the pattern is supported by above-average volume—showing that there is interest that can translate to momentum from market participants to make a countermove, which, in this case, a trend reversal.
2. Leads to a more optimal risk-reward ratio
Tweezer bottom patterns allow for a more optimal trade position. This is because, if the pattern is also supported by market structure, we can simply put our entry orders just above the second candle’s high of the pattern and our stop loss just below its second candle’s low since this will essentially invalidate the pattern setup altogether. This leads to a more defined and structure-based risk-reward ratio compared to other candlestick patterns—in which entry and stop loss points are either more arbitrary or do not lead to an optimal risk-reward ratio.
3. Confluence With Market Structure and Indicators
The tweezer bottom is incentivized to have confluence (alignment of other market factors and/or technical analysis tools). For example, a tweezer bottom must occur at the lowest point of an ongoing downtrend. This makes it the de facto support level (especially if it is not broken). Now, the pattern’s second candle—by virtue of the pattern’s nature of having roughly identical lows—must test this new support level and not touch a much lower price level before we can even consider this as a valid pattern. Hence, on its own, it already carries more significance compared to many other candlestick patterns.
Then, there is the role that volume analysis and overall market structure play. An above-average volume signifies an elevated market interest, and it also gives credibility to the newly established support level tested by the pattern. And, of course, the role of the overall market structure. Interestingly, many assets that have touched this same lower level have a record of their significance (how they behave around this area). Therefore, we can infer how the price will be more likely to behave this time.
Disadvantages of Tweezer Bottom Pattern
The following are the three notable disadvantages of using tweezer bottom patterns:
1. Sensitive to noise in low-liquidity market periods
The tweezer pattern tends to appear more frequently during periods of relatively low liquidity. As a result, the effectiveness of this pattern varies depending on the financial market or asset class you are trading. If the market you’ve chosen experiences frequent low-liquidity periods, the tweezer pattern is likely to occur more often—not because the asset is primed for a reversal, but simply due to a lack of sufficient interest to drive the asset toward decisive moves.
2. The more extended the trend, the lower its effectiveness
One key point emphasized in this guide is that market structure takes precedence over any candlestick pattern, especially for long-term trending assets. For example, some stocks have been experiencing an established long-term downtrend for over a year (usually reflecting poor fundamentals). A simple tweezer bottom pattern often cannot lead to a trend reversal despite having above-average volume. This is often the case unless it breaks a long-term structural downtrend line, which is often triggered by a shift in the company’s fundamentals for the better.
3. Variability in Effectiveness Based on Candle Characteristics
Finally, when it comes to the pattern itself, tweezer bottoms have a relatively low primary requirement for their two candles—they simply need to have identical lows. As a result, any two candles consisting of a bearish first candle and a bullish or neutral second candle with identical lows are technically considered a tweezer bottom. The issue, as discussed in the variants section of this guide, is that different tweezer bottom variations have widely varying levels of reliability. For example, two Marubozu candles with little to no wicks that share the same low have a much lower probability of signaling a successful reversal than two candles with long wicks that clearly indicate rejection around the lower price area. Yet, both are technically considered tweezer bottoms.
Tweezer Bottom Pattern vs. Tweezer Top Pattern
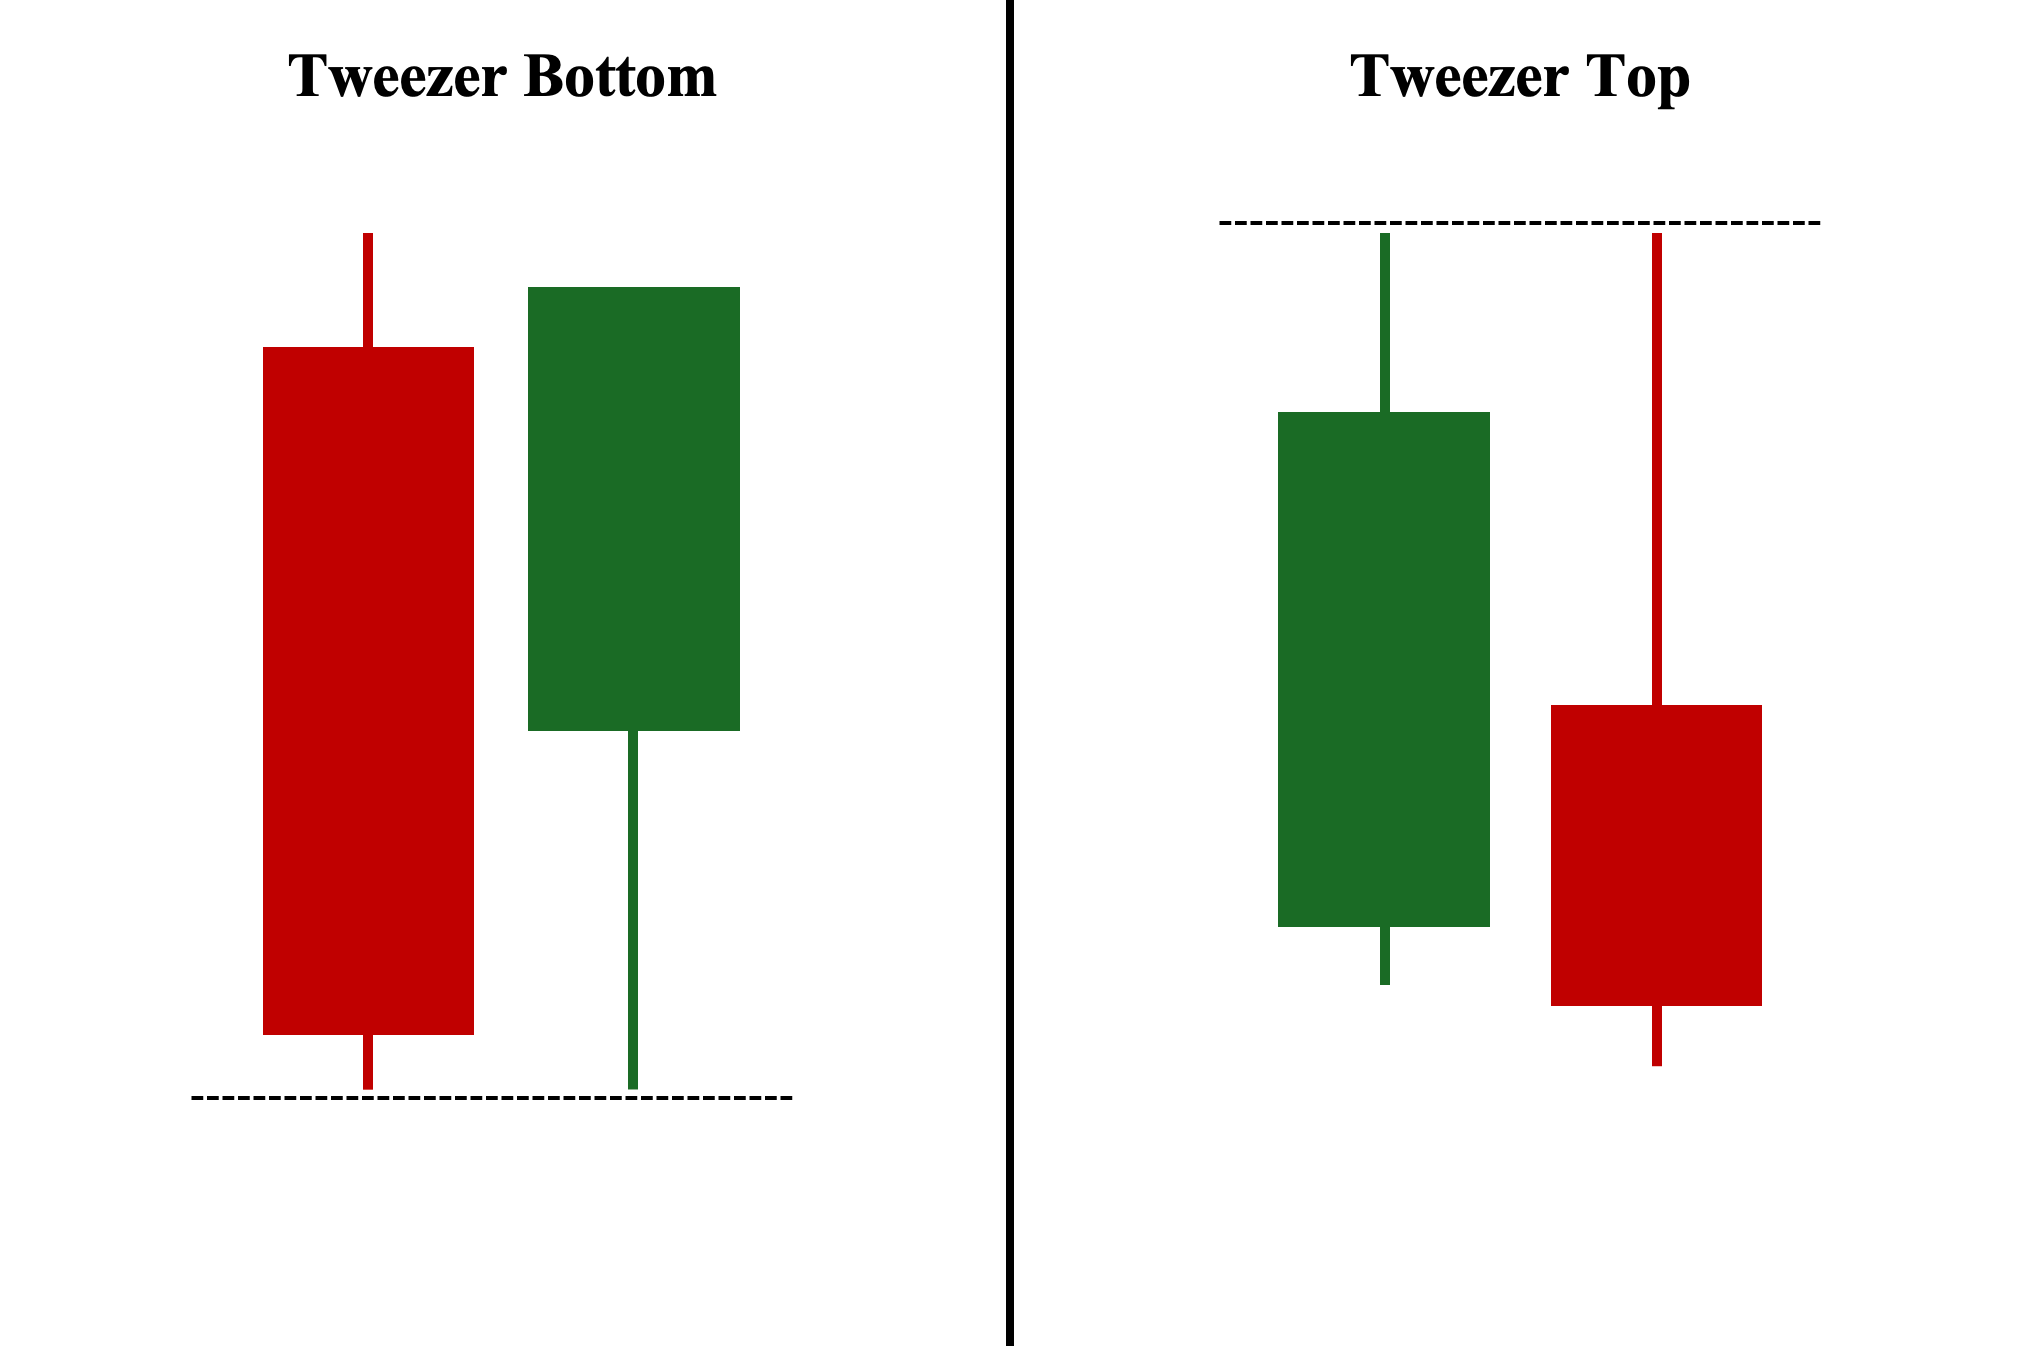
Both tweezer candlestick patterns—tweezer top and tweezer bottom—are composed of two candles. Compared to the bullish tweezer bottom, which has two identical or near-identical lowest prices and appears during an uptrend pullback or at the bottom of a downtrend to serve as a bullish reversal formation. Tweezer tops, on the other hand, are the opposite: two identical or near-identical highs appearing during a downtrend correction or at the high of an uptrend to serve as a bearish reversal formation. Nevertheless, either Tweezer pattern benefits from integrating volume in analyzing their validity.
Tweezer Bottom Pattern vs. Bullish Engulfing Pattern
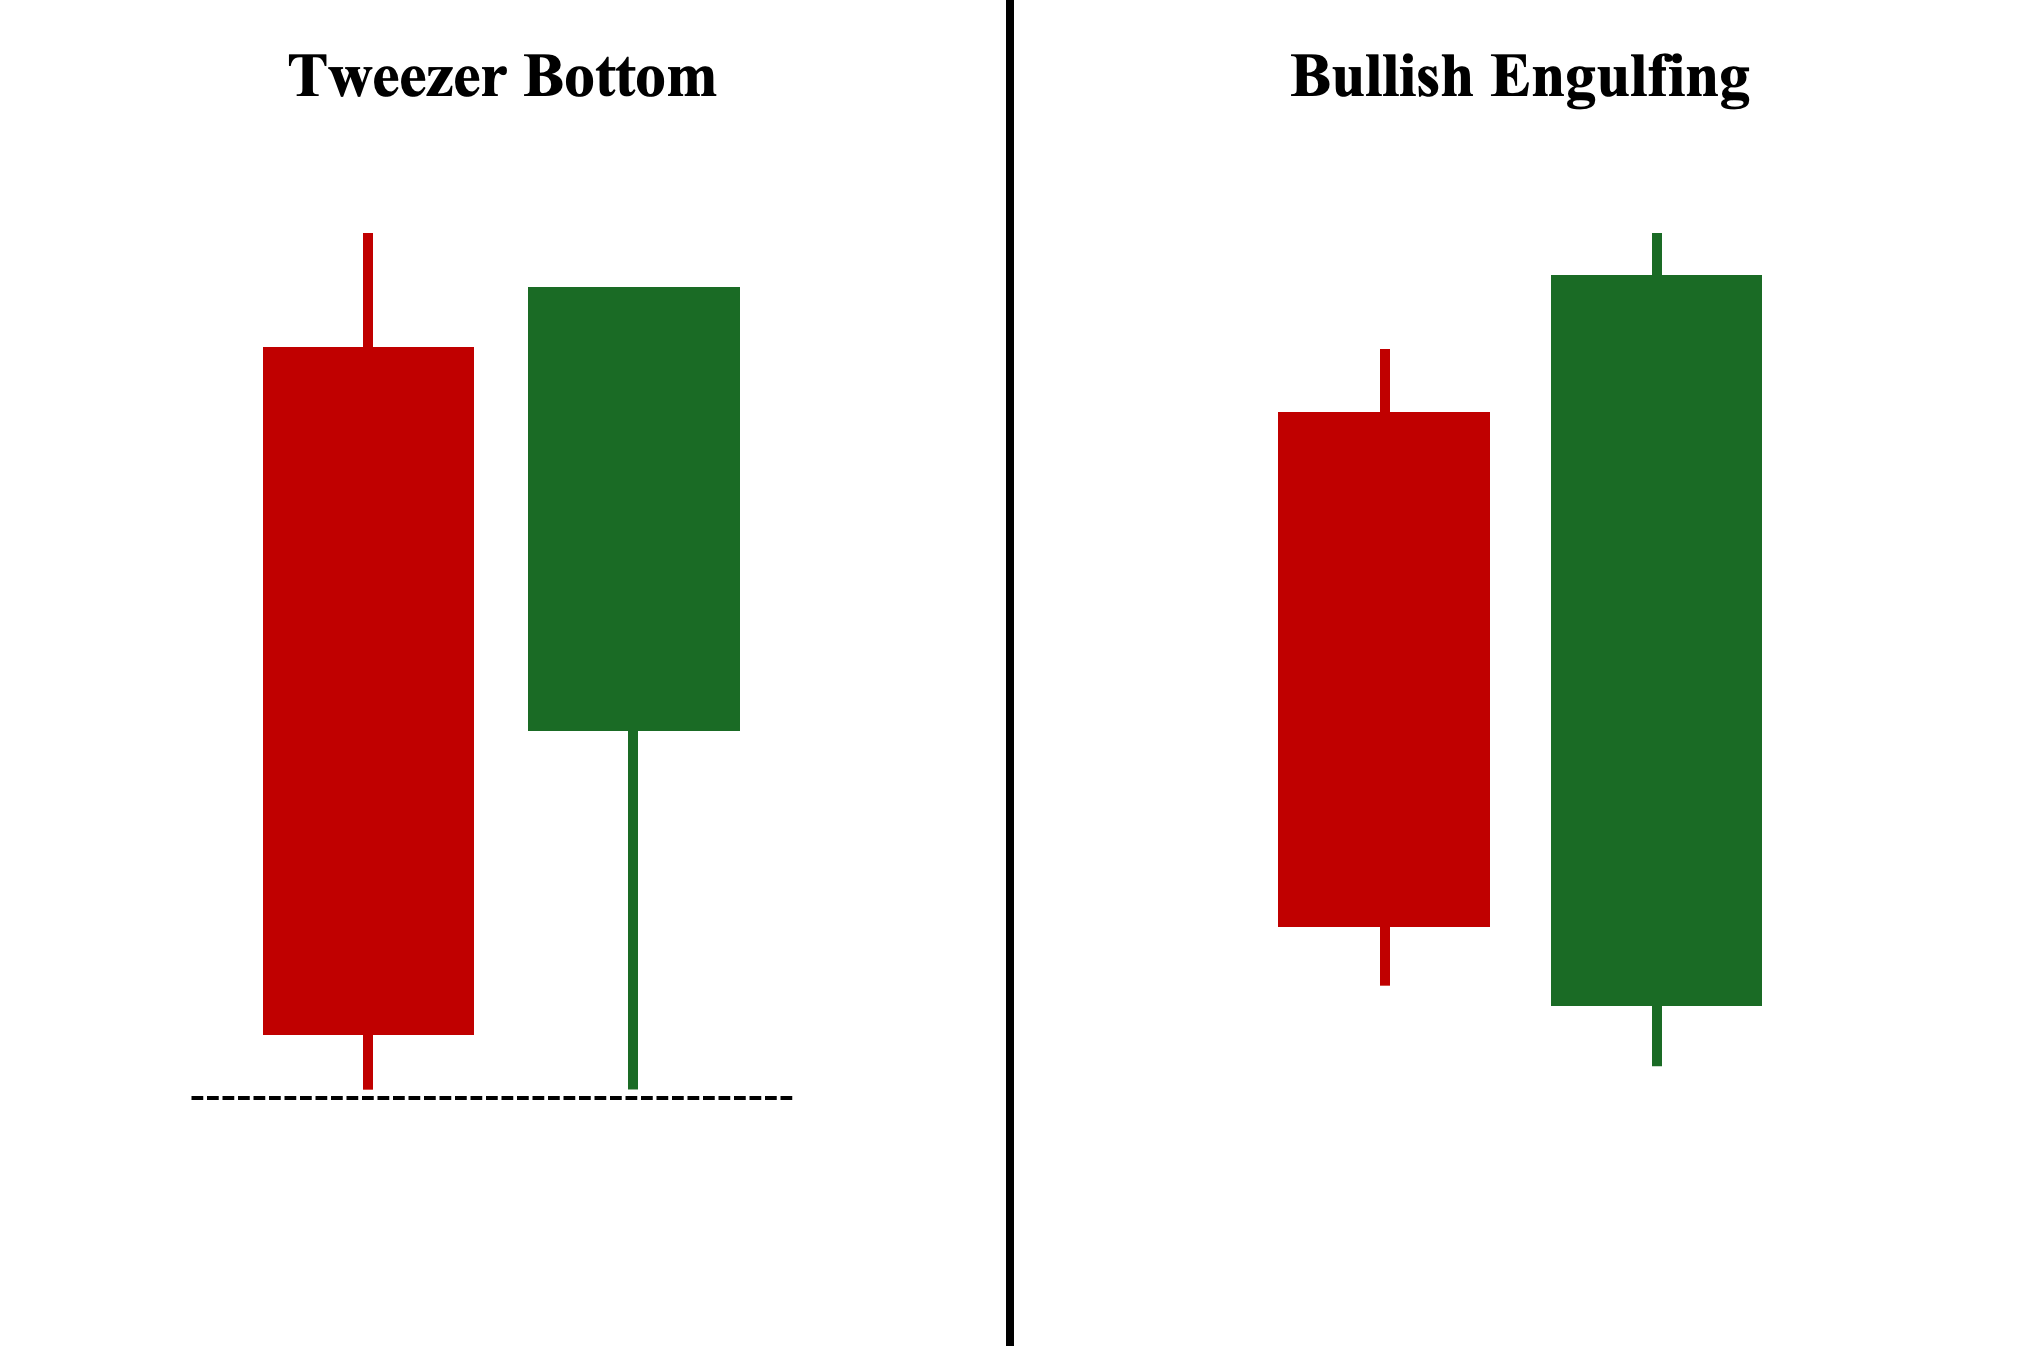
The bullish engulfing and bullish tweezer bottom patterns have a lot in common. First, they are both composed of two candles, with the first candle being bearish and the second candle being bullish. Second, they are both used as a bullish reversal pattern. Third, as we have covered in an earlier section regarding tweezer bottom variants—they can be one and the same as long as they both have the same lows and the first candle’s range (body and wicks) is completely engulfed or covered by the second candle’s range.
Tweezer Bottom Pattern vs. Marubozu Pattern
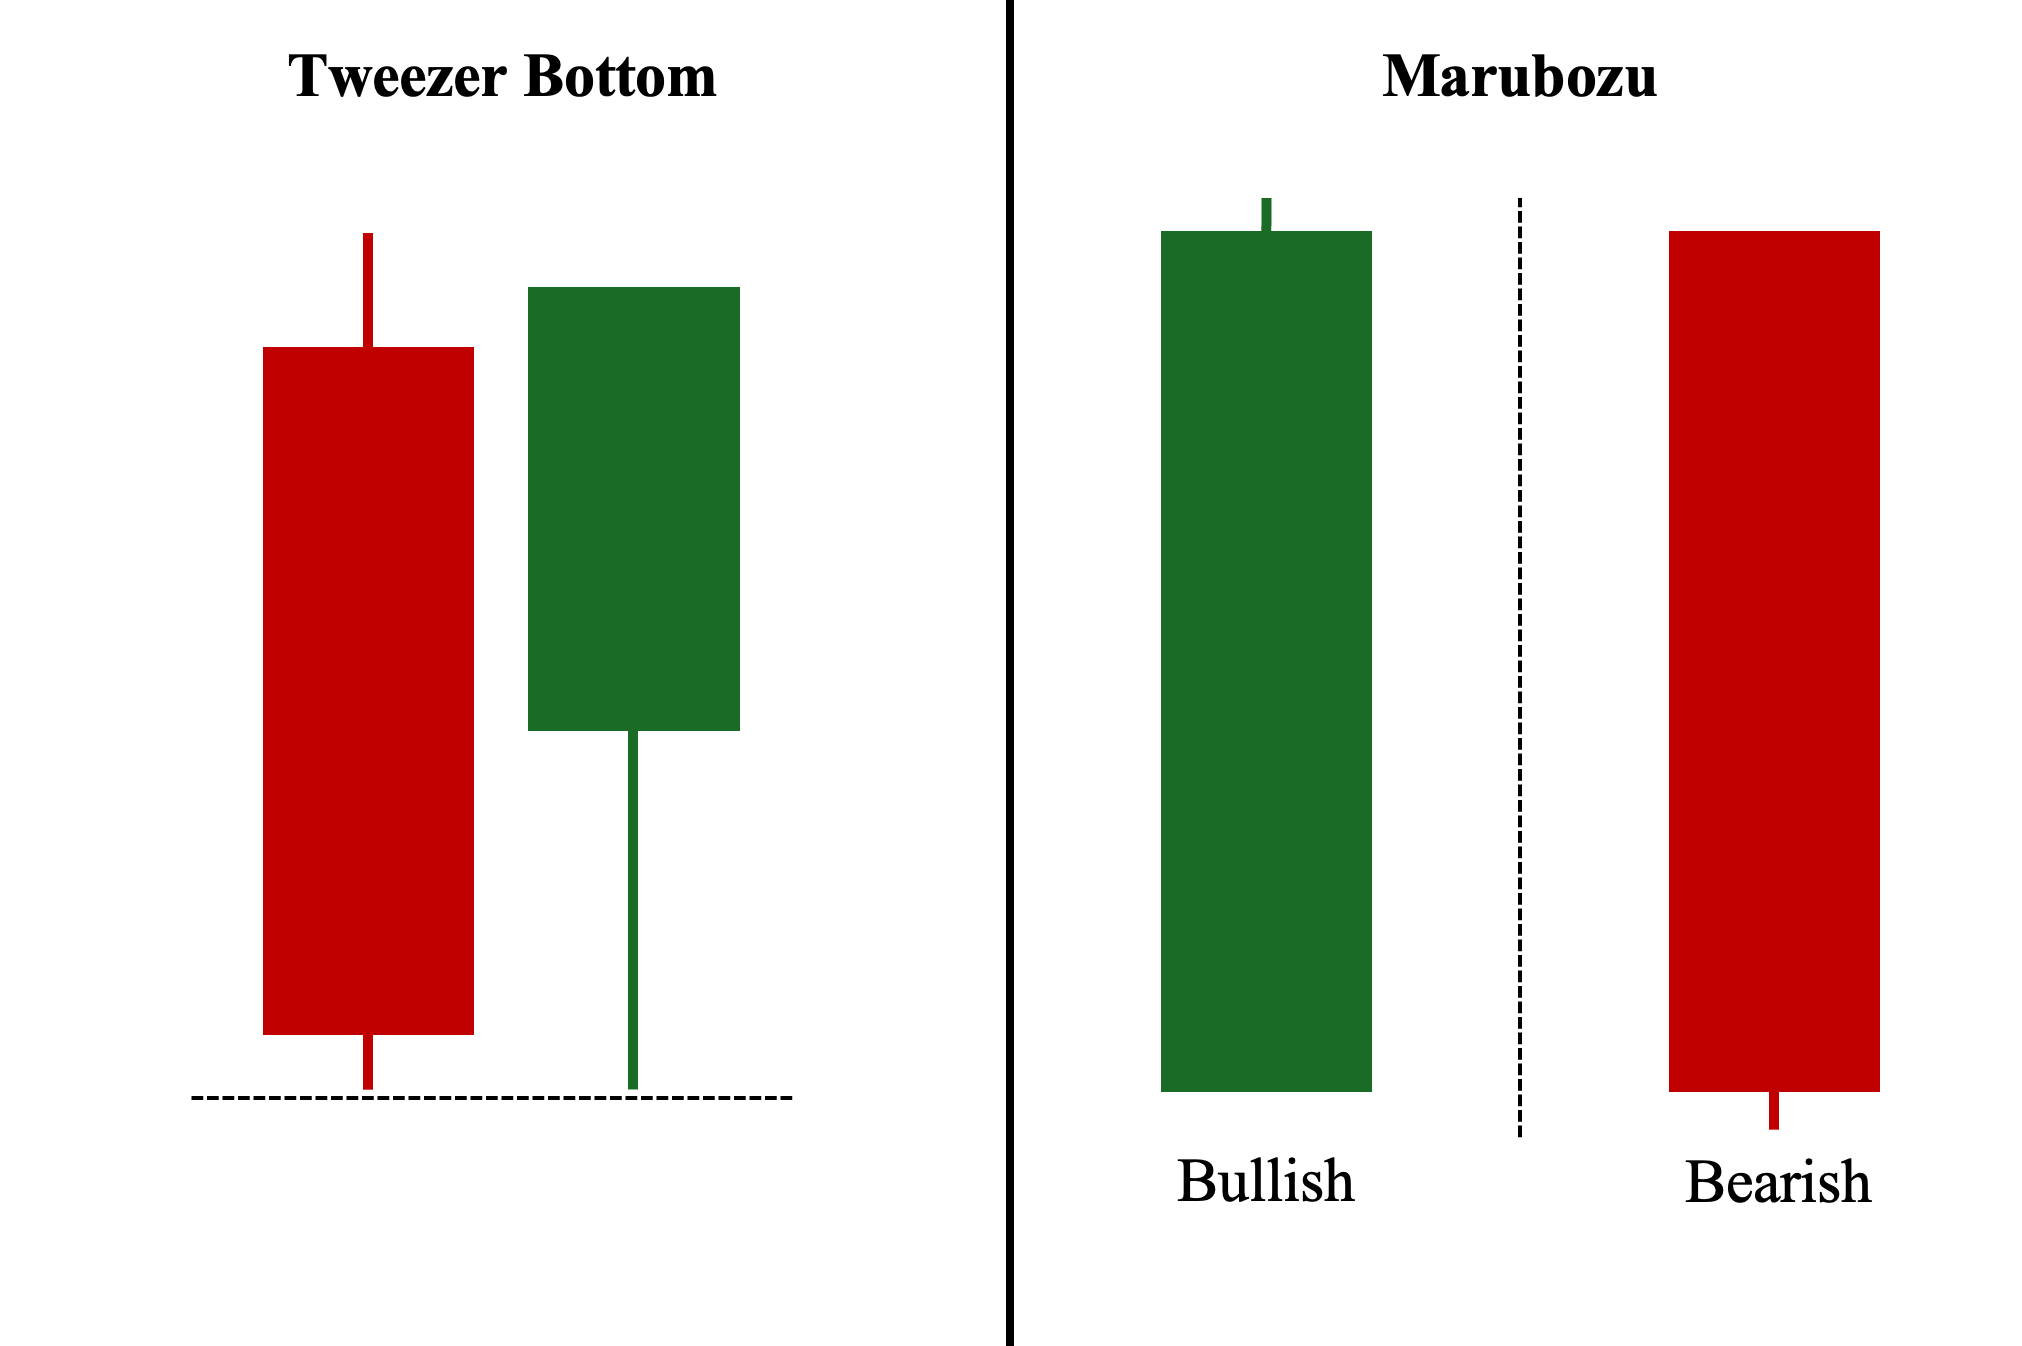
Unlike the tweezer bottom pattern, the Marubozu candle is a single candlestick pattern. A Marubozu is characterized by a long body with little to no shadows, and its color determines whether it is bullish or bearish. Similar to a Bullish Engulfing pattern, a Marubozu, and a Tweezer Bottom can coexist in one candlestick formation (as discussed in the variants section), provided the Marubozu candle shares the same or nearly identical lowest price with another candle.
Tweezer Bottom Pattern vs. Piercing Pattern
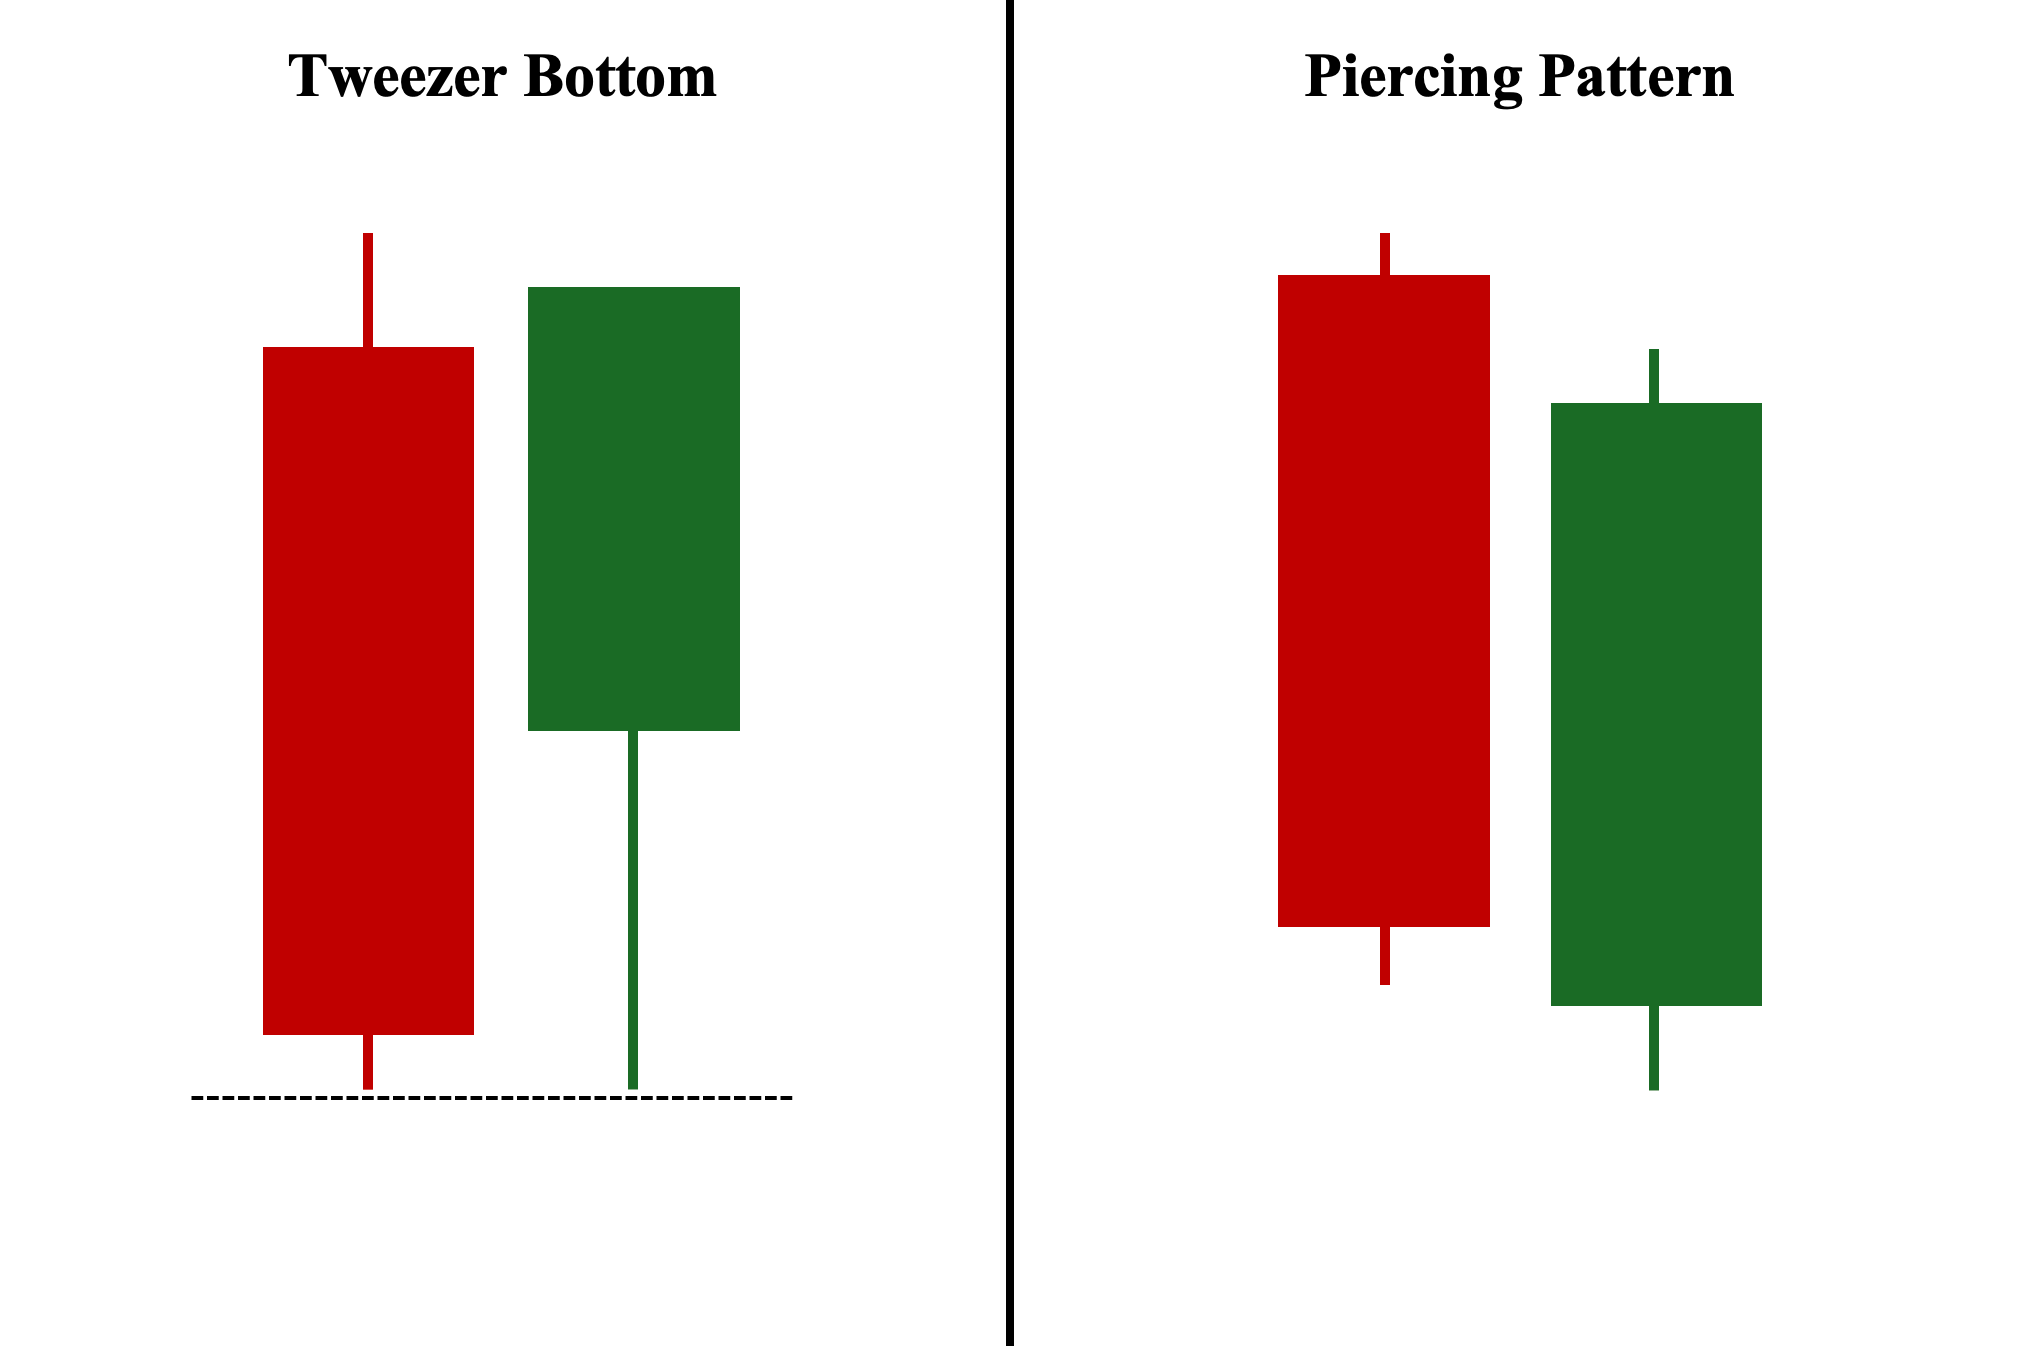
Similar to the tweezer bottom candlestick pattern, the piercing pattern is composed of two candles. The first candle is a long-bodied bearish candle, and the second candle is a long-bodied bullish candle that gaps down at the open but closes above the 50% mark of the first candle’s body. Similar to the tweezer bottom, the piercing candlestick pattern is also a bullish reversal candlestick when it appears at the end of a downtrend.
Tweezer Bottom Pattern vs. Three White Soldiers Pattern
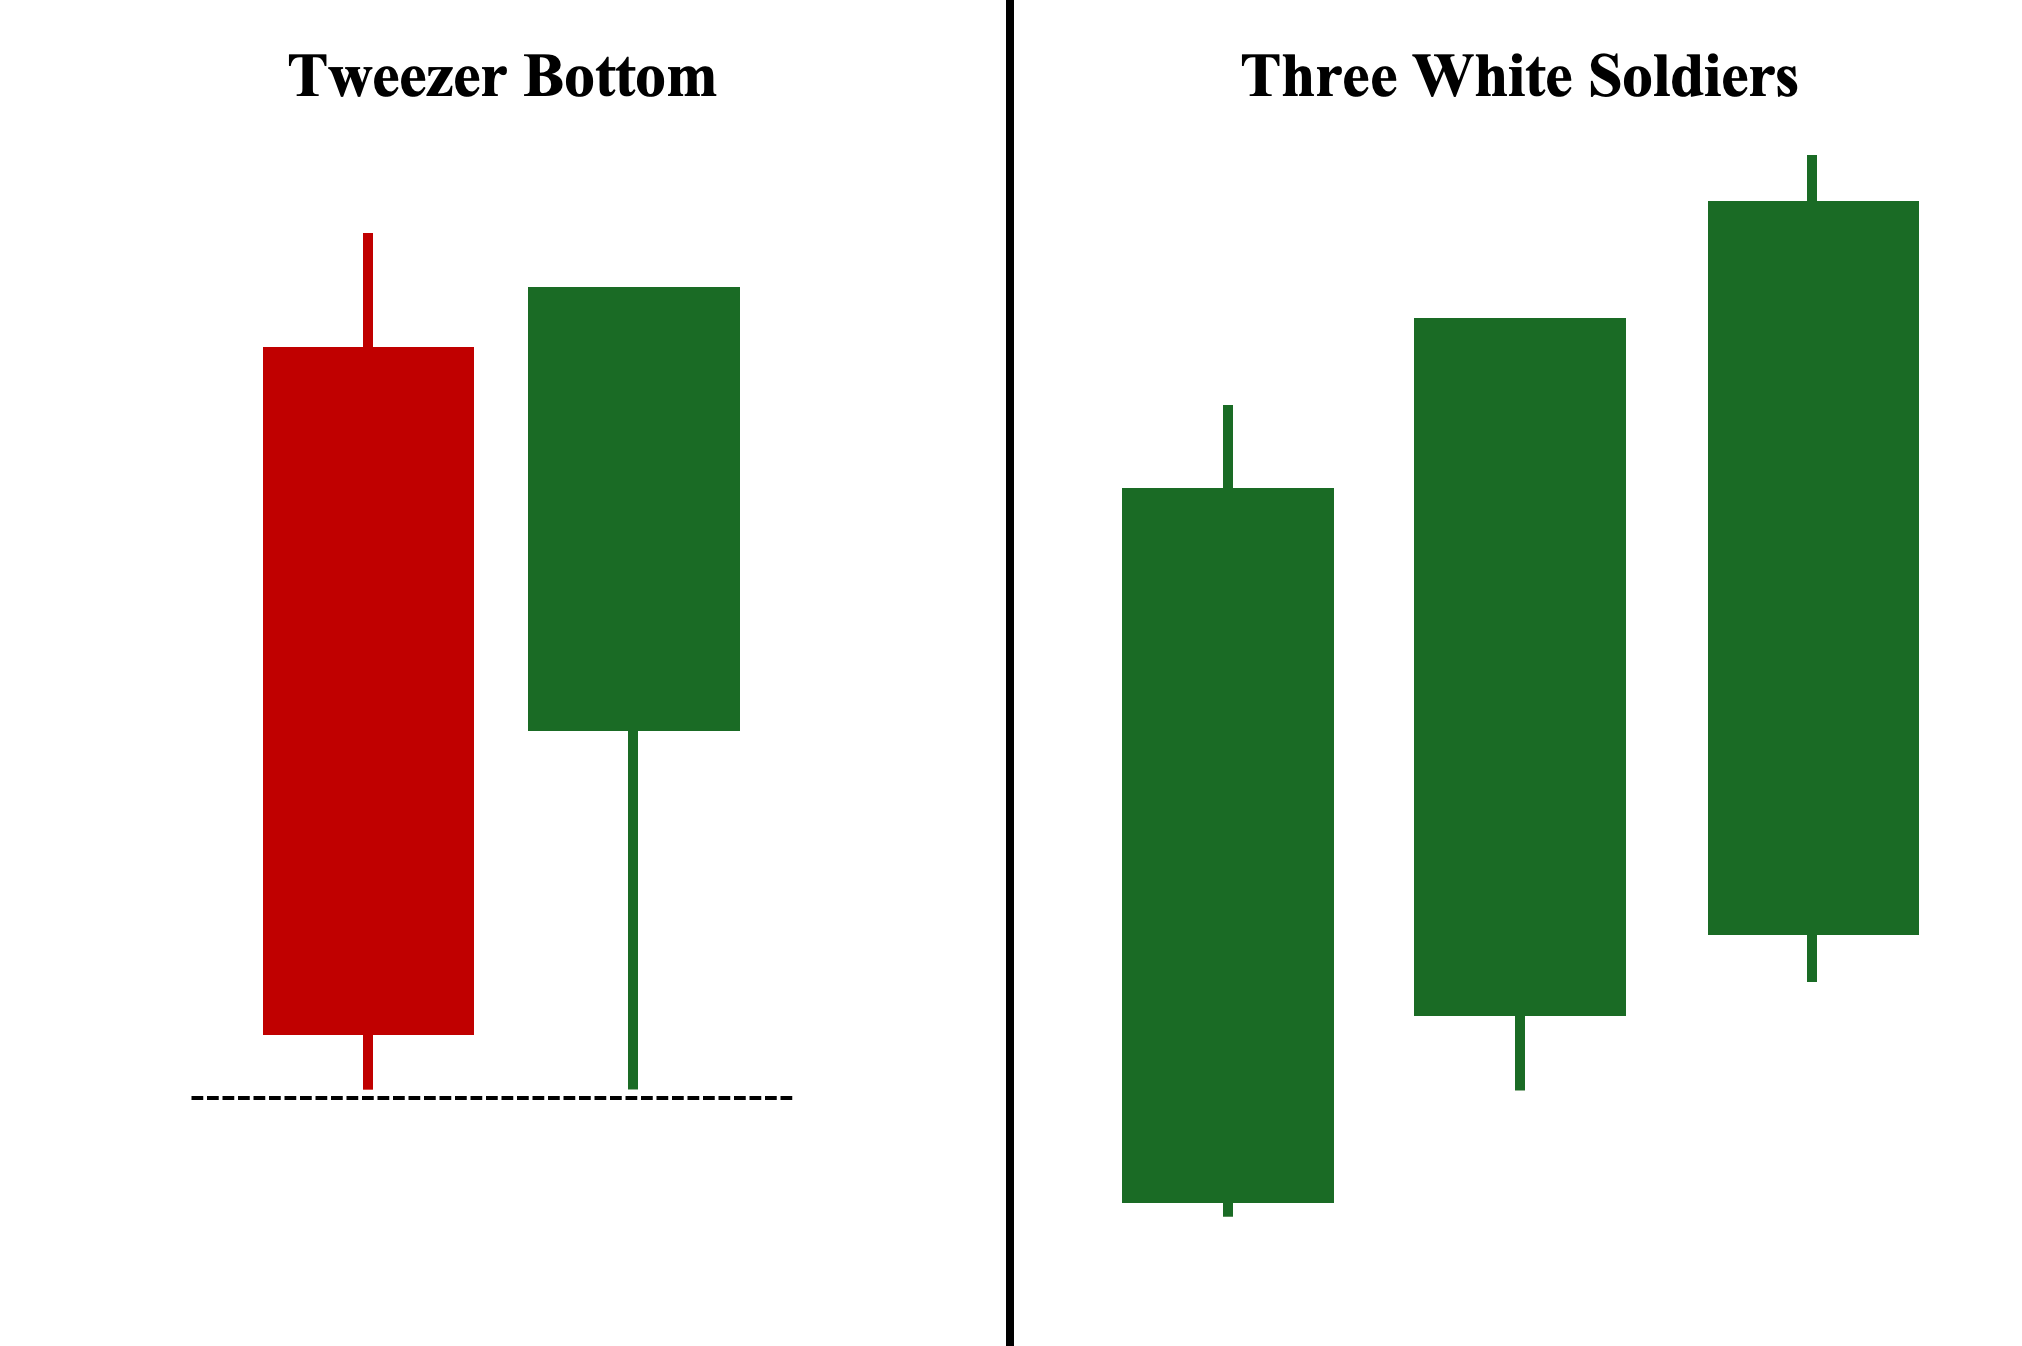
Both the tweezer bottom and the three white soldiers are bullish reversal patterns. However, unlike the tweezer pattern, the three white soldiers is a three-candlestick pattern composed of three consecutive long-bodied bullish candles—the second candlestick must open and close above the first (bottom) candlestick, and the third candlestick must subsequently also open and close above the second candlestick.
Tweezer Bottom Pattern vs. Pin Bar Pattern
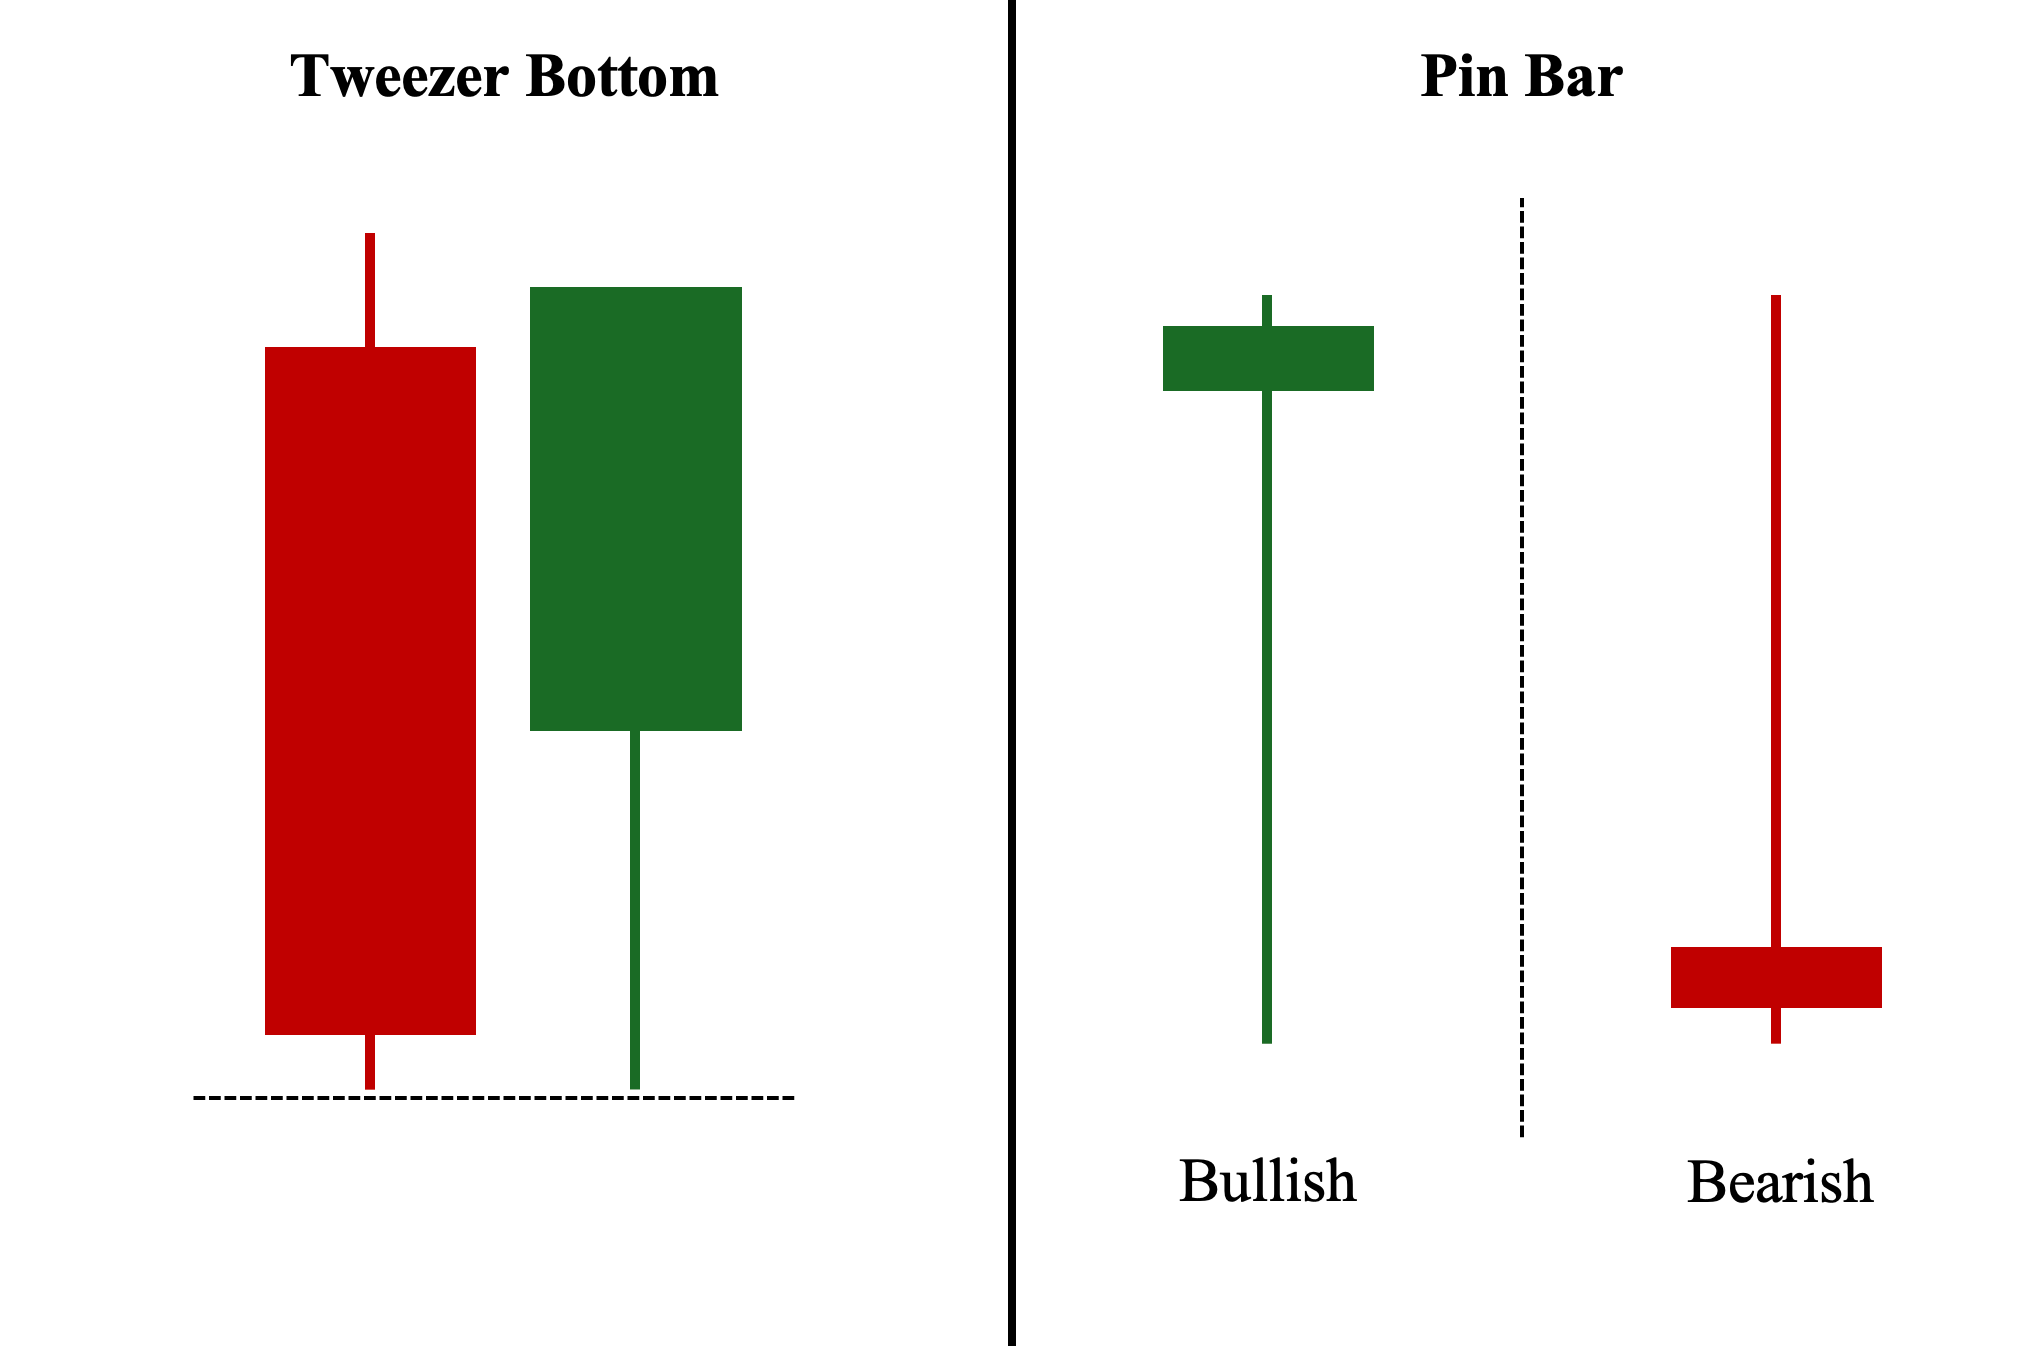
Unlike the tweezer bottom candlestick pattern, the pin bar is a single candlestick formation. It can either be a bullish variant, resembling the letter “T” and appearing at the end of a downtrend to signify a possible bullish reversal, similar to a tweezer bottom, or an inverted “T,” appearing at the end of an uptrend to signify a potential bearish reversal. Additionally, the pin bar (particularly the bullish variant) can serve as one of the candles in a tweezer bottom pattern, provided it has a relatively similar low to the other candle, potentially creating an even stronger candlestick pattern.
Common Tweezer Bottom Pattern Mistakes to Watch Out For
Here are the three key mistakes to avoid to improve your success rate when using the tweezer bottom pattern:
1. Ignoring the General Market Structure
First, when analyzing candlestick charts, it’s crucial not to prioritize a particular pattern, such as a tweezer bottom, over the overall market structure or trend. For instance, if you identify a tweezer bottom at the bottom of an ongoing downtrend, it’s essential to zoom out and assess the broader context. Confirm that the pattern has not formed at a historically significant price level.
If it has and the pattern broke a major support level, but the two candles—especially the second one—failed to close above this level, the tweezer bottom is less likely to result in a bullish reversal. In this scenario, the previous support level has now become a resistance level, which could exert significant selling pressure and hinder any potential reversal attempt. Hence, market structure takes precedence over any candlestick pattern, no matter how promising it may seem.
2. Ignoring the Volume Turnover
Another common mistake is overlooking the importance of volume when analyzing the tweezer bottom pattern. Volume can often be the single most crucial confirmation tool for this pattern. Unlike other technical indicators, which are prone to misuse, volume provides an objective measure of trading activity.
For instance, when using a moving average (MA), traders must decide between simple or exponential variants and determine the appropriate length—decisions that can be challenging and lead to suboptimal conclusions if incorrect. In contrast, standard volume is not subject to interpretation; it is simply an objective record of the total turnover during the trading period.
Mastering volume analysis allows you to incorporate it into all of your trades, offering a more complete view of the trade. Specifically, for tweezer bottom patterns, an above-average volume turnover for the two candles—especially the second candle—indicates strong selling pressure (supply) followed by significant buying interest (demand), which helps prevent and reject further price declines. Conversely, low volume means low market participation and likely insufficient interest for a successful bullish reversal.
3. Overconfidence in the Tweezer Bottom Candlestick Pattern
A bullish candlestick reversal setup does not equate to a guaranteed reversal. As we have discussed in earlier sections, we deal with probabilities and not absolute certainties. Unfortunately, many traders still rely “too much” on candlestick formations as the number 1 key factor in their trade decisions. This is, again, dangerous as not only is market structure much more important, but also, no candlestick pattern is completely reliable on its own. Therefore, it is crucial to use complementary tools and consider the overall market context before making a trade.
What Markets Can Tweezer Bottom Be Traded In?
The tweezer candlestick patterns can be traded in any liquid market where technical analysis is commonly implemented. The tweezer bottom pattern can apply to stocks, indices, forex, cryptocurrencies, and commodities.
A trader may find tweezer bottoms more commonly in 24-hour continuously traded markets like forex or crypto where a bottom forms right at the start of a new candle session. That is part of the reason whey it is important to not take the candle pattern by itself and analysis the market trends in conjunction with other tools.
FAQ
What is the best time frame to use for the Tweezer Bottom pattern?
Like other candlestick patterns, tweezer patterns (including the tweezer bottom) are more effective on longer time frames, particularly daily charts, as these are the most commonly used by both retail and institutional investors and traders. Additionally, the tweezer bottom pattern tends to appear more frequently on lower time frames, such as minutes and hourly charts, which reduces its significance and novelty.
Can a Tweezer Bottom pattern occur in both uptrends and downtrends?
Yes, the tweezer bottom pattern can technically occur in both uptrends and downtrends. During an uptrend, it is considered valid when it appears after the asset’s price experiences a temporary sustained decline, known as a “pullback.” On the other hand, it must occur at the downtrend’s lowest point to be considered a valid bullish reversal pattern.
Is the Tweezer Bottom pattern a sign of an upcoming reversal?
Generally speaking, yes. The tweezer bottom pattern is widely considered a bullish reversal pattern, particularly if it occurs at the lowest point of an ongoing downtrend. However, if it occurs during the pullback portion of an uptrend, it signals a continuation of the trend’s primary move—moving upward. Therefore, in an uptrend, it would indicate a reversal of the pullback, but not the trend itself.
How reliable is the Tweezer Bottom pattern?
It depends. The tweezer bottom formation is considered more reliable, with a higher success rate, when coupled with other confirmation signals, such as high trading volume—particularly for the second candle—a moving average aligning with the pattern, or when the price breaks and closes above a key structural level. Note that the high trading volume is contingent on the two candles’ bodies and wicks (as we explained in this guide).
Is the Tweezer Bottom pattern bullish or bearish?
The tweezer bottom candlestick pattern is considered a bullish reversal setup, signaling a potential end to the asset’s downward trend direction. Conversely, its counterpart—the tweezer top—is viewed as a bearish reversal pattern, signaling that the price may have hit a ‘”ceiling.”
Who developed Tweezers in trading?
The tweezer patterns were developed from traditional Japanese candlesticks charting techniques, which have been used for centuries in Japan, specifically by rice traders. However, it was Steve Nison who brought this pattern to the mainstream in the early 1990s through his book “Japanese Candlestick Charting Techniques,” which explicitly covers two Japanese candlesticks, including the tweezer bottom pattern.


