


Written by:

Reviewed by:

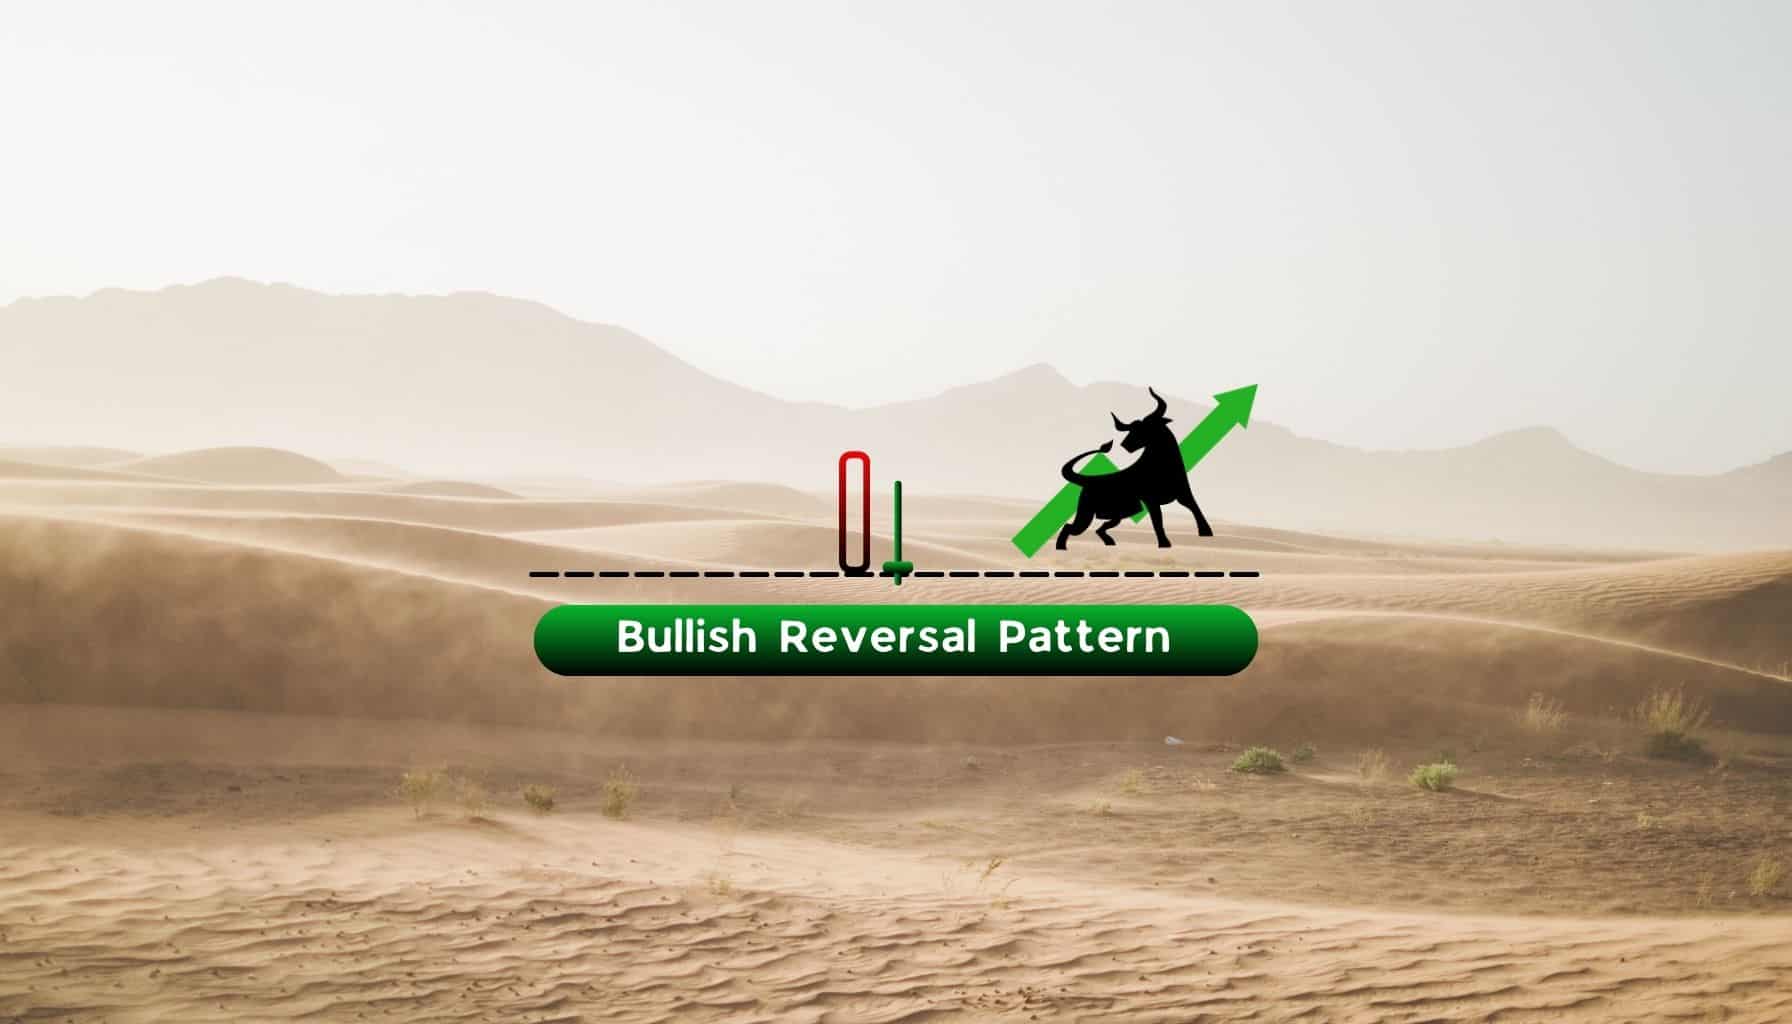
Bullish
- July 27, 2024
- 17 min read
Inverted Hammer Candlestick Pattern Explained
When an upside down hammer rests on its head, and has its handle looking to the skies, there’s only one thing that awaits it: being picked up. The same logic is applied to the inverted hammer candlestick, a bullish reversal pattern still relevant today, despite being founded in the 17th century.
Learn about the inverted hammer candlestick patterns – what it is, how it works, and how to trade it effectively in this short guide.
What is an Inverted Hammer Candlestick Pattern
An inverted hammer candle is a Japanese candlestick charting pattern used by technical traders to signal a market reversal from a downtrend to an uptrend. It is a bullish reversal pattern that signals a weakening downtrend, and leads to a possible change in the price’s trending direction from down to up.
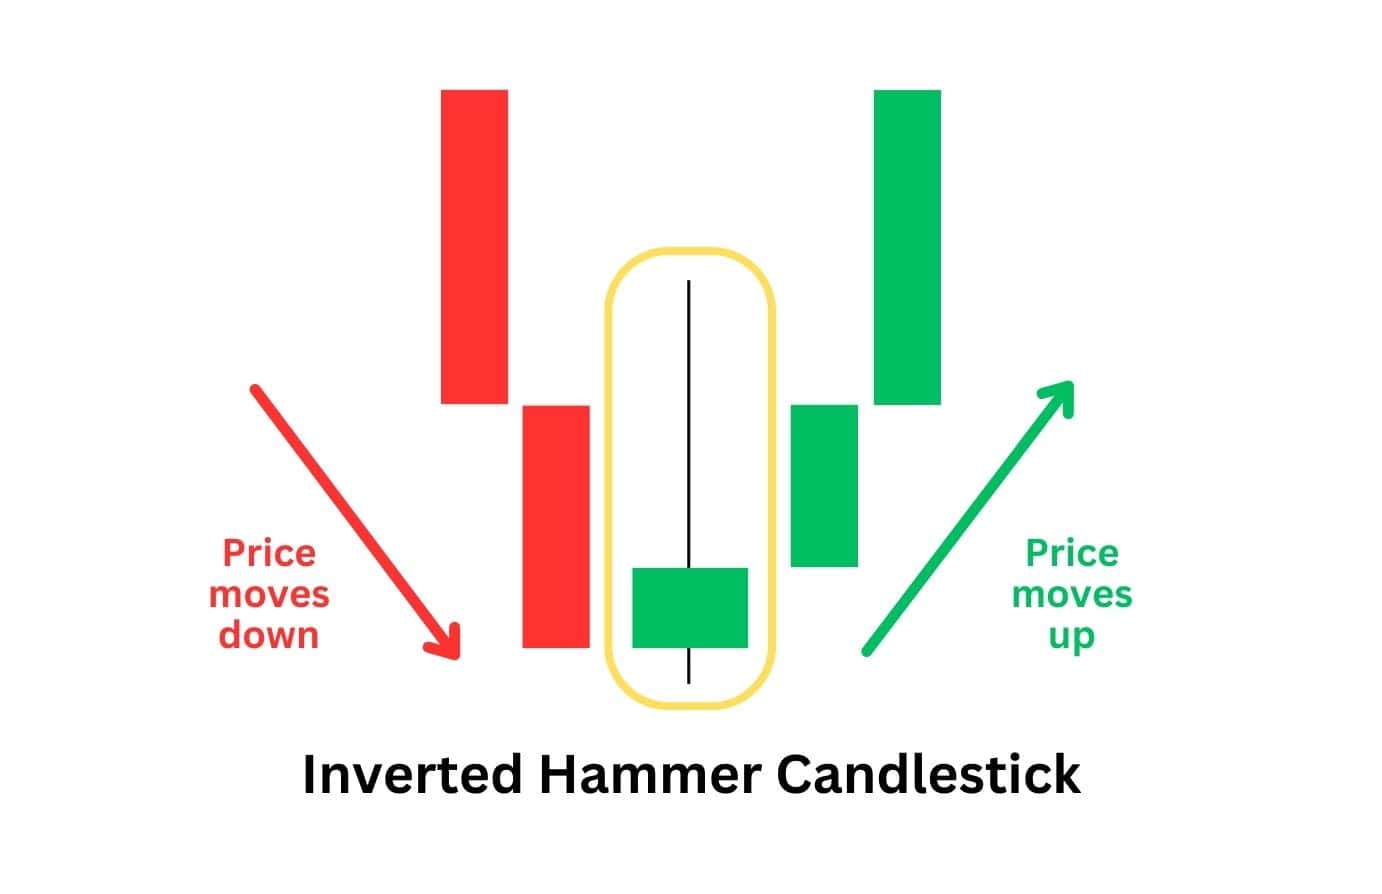
The inverted hammer pattern forms at the lows after a price move down, and is best found with the use of support levels, where the pattern typically forms.
Visually, inverted hammer candlesticks are the opposite of a regular hammer candlestick pattern. The inverted hammer candlestick has a long upper shadow and a small candle body. However, both the hammer and inverted hammers are bullish patterns that sometimes can appear next to each other!
How is the Inverted Hammer Candlestick Formed?
The inverted hammer candlestick formation is created when sellers try to push an asset’s price lower but are ultimately unsuccessful as buyers step in to hold up the price.
This behaviour is the cause of three major identifiers for the inverted hammer: a long upper shadow, a small candle body at the lows, and little to no lower shadow.
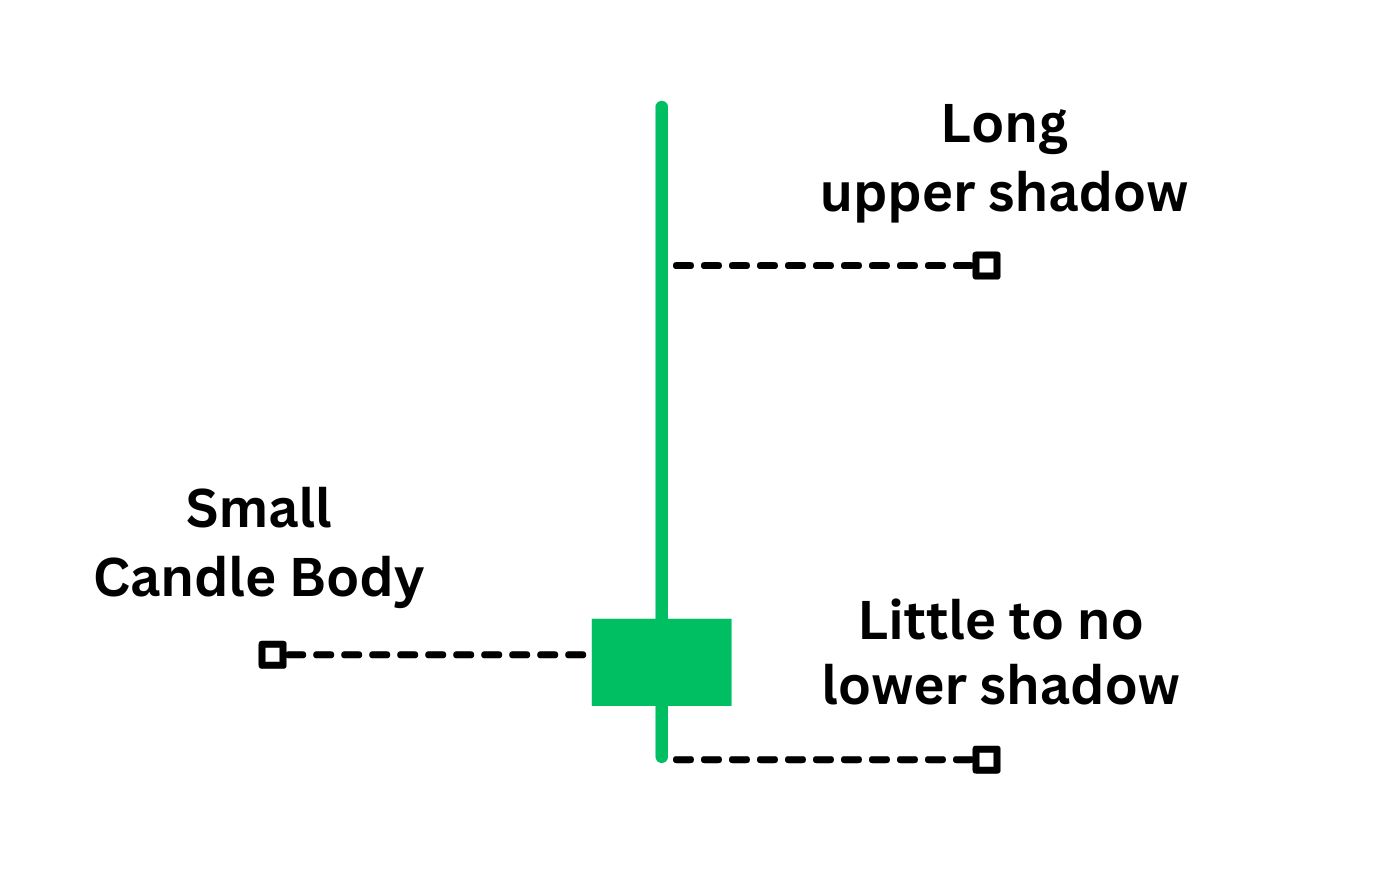
The long upper shadow, otherwise known as a long upper wick, happens when sellers step in to suppress the price from rising even further (when it’s near a support level). However, the small candle body at the bottom began to form when sellers were not strong enough to completely shift the price lower, and buyers were able to step in and defend the price.
What Does the Inverted Hammer Candlestick Tell Traders?
The long upper shadow tells us there was a serious attempt to push the price down, but the small candle body indicates that buyers are stepping in when the inverted candlestick forms. Overall, the price has not shifted much from its opening price, showing bullish strength in the current area.
This hints at a possible influx of interested buyers where the inverted hammer has formed and is therefore seen as a bullish reversal signal.
Another way to perceive the logic of the inverted hammer is that it’s a sign of weakness from sellers. If the sellers were fully in control, why wasn’t the candle body much larger and in the red? The inverted hammer is a hidden sign that buyers have absorbed and exhausted the seller’s bearish pressure, and that price may be ready to reverse.
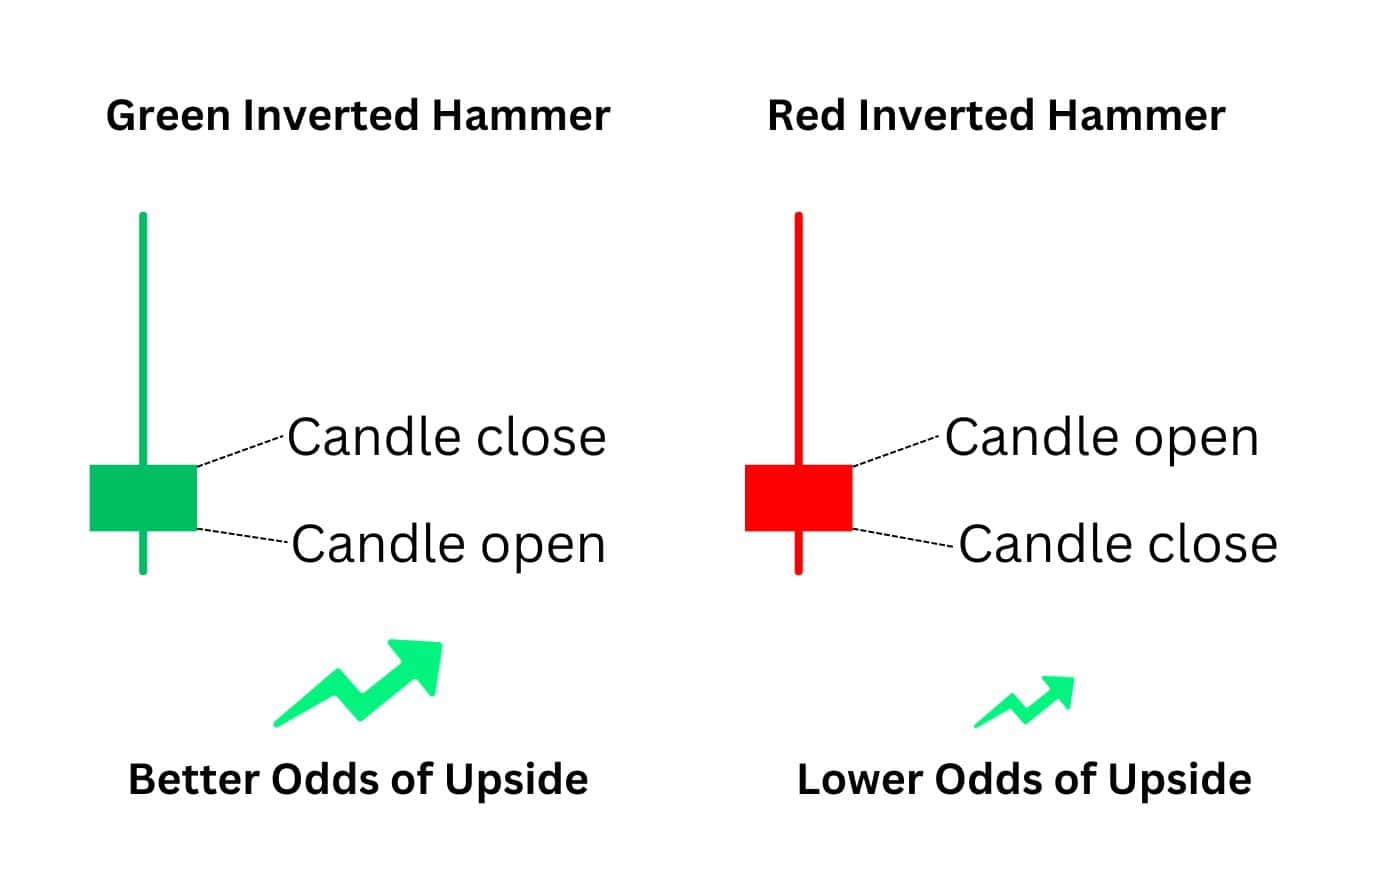
An additional factor to note is that the inverted hammer can appear as a red or green candlestick. This is based on where the candle opens and closes. If the candle is red, the price has closed lower than its opening price. If the candle is green, then the price has shifted since its opening price.
The key takeaway from the colour of the candlestick is simply just how bullish the reversal pattern is. Aggressive traders may look at the green inverted hammer and take a long simply based on the colour. Conversely, if the inverted hammer is red, traders may be more cautious, and wait for more confirmation candles before entering a long position.
What Does the Red Inverted Hammer Indicate?
When the inverted hammer is red, it means that bulls failed to push the price above the opening price. This suggests that even though bulls are present, their buying power isn’t as powerful or ideal for a market reversal. By contrast, when the single candlestick pattern is green, it suggests stronger market reversal conditions.
What Does the Green Inverted Hammer Indicate?
The green inverted hammer implies bears failed to push the price below the opening price. This suggests that bulls are strong enough to push the price above its opening price, and hints at enough buying pressure being present to create a market reversal.
What Are Some Examples of Inverted Hammer Chart Patterns?
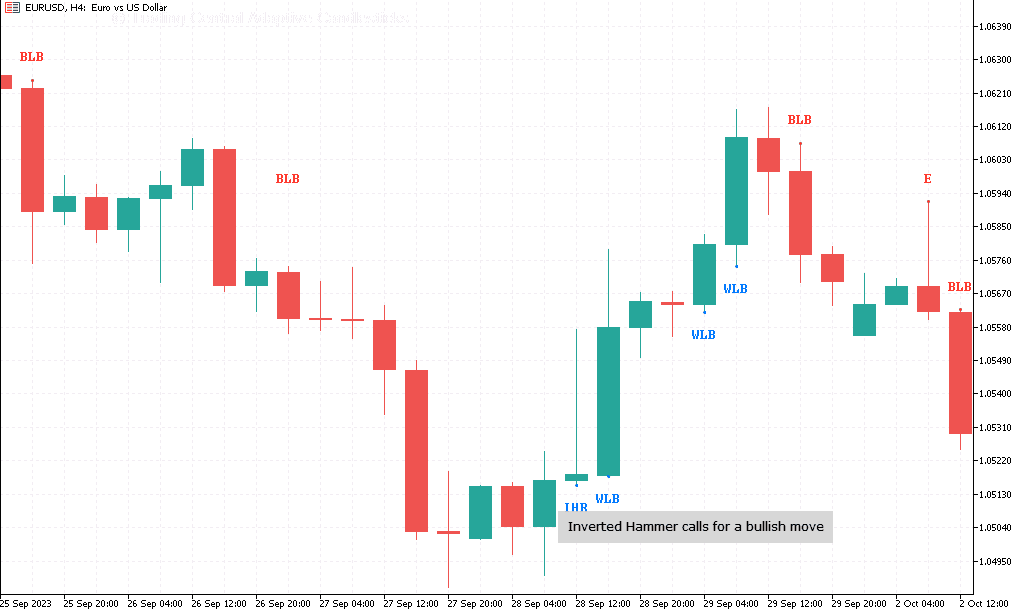
A fantastic example of the inverted hammer chart pattern can be seen on the NASDAQ futures chart on October 23rd, 2023 using the daily chart timeframe.
Here, we can see that the price taps a support zone at roughly $14200, and begins to form an inverted hammer pattern. The next candle then closed above the inverted hammer and support zone, acting as a confirmation candle for a long entry.
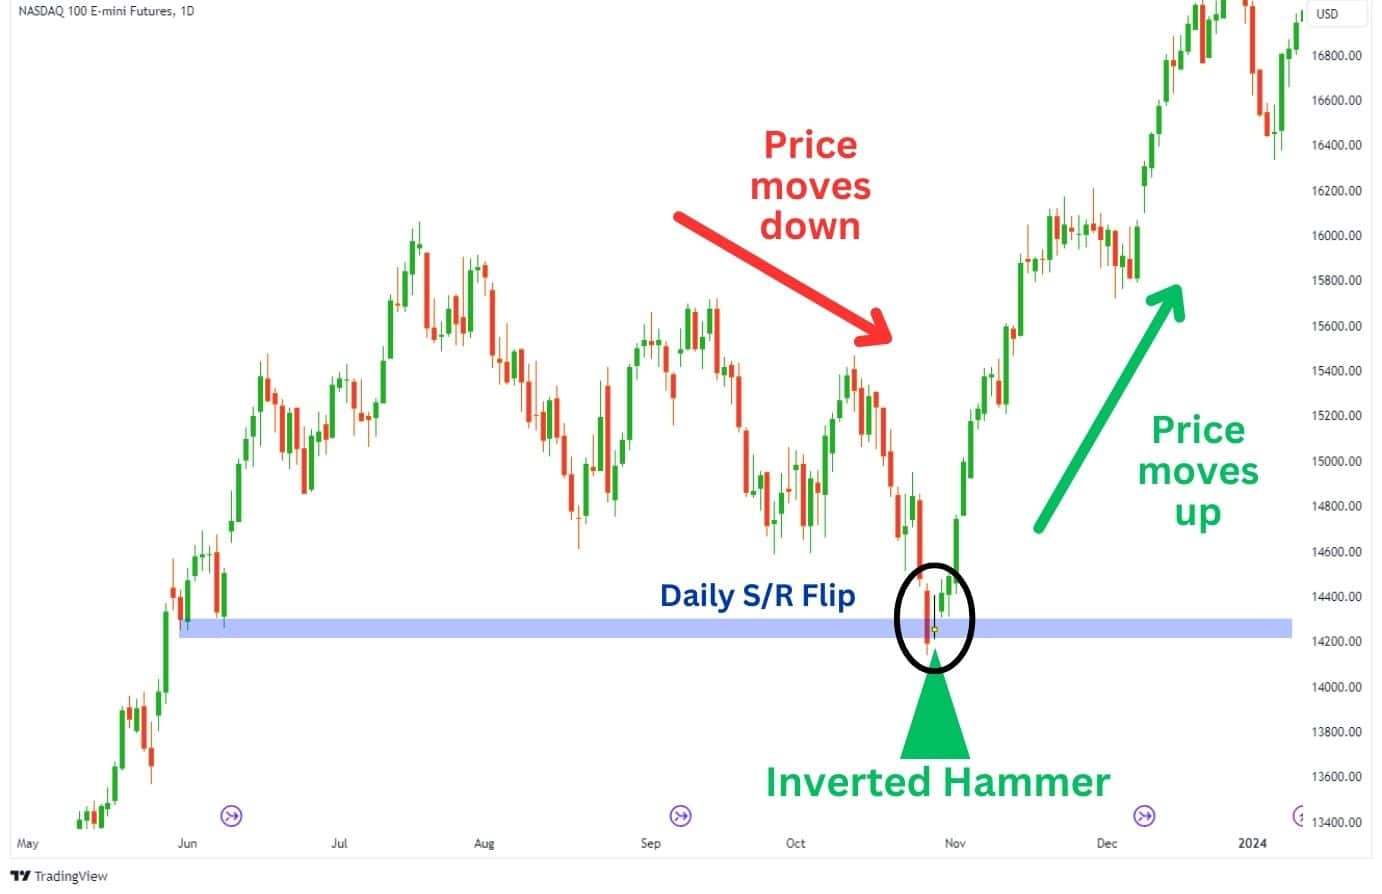
In this example, NASDAQ rallied nearly 20% after the inverted hammer.
The inverted hammer chart pattern can serve as a buying opportunity for traders looking to enter a long position. Conversely, for traders who are already in a short trade, the inverted hammer and the confirmation candle could act as a signal to close their trades.
How To Trade Using The Inverted Hammer Pattern
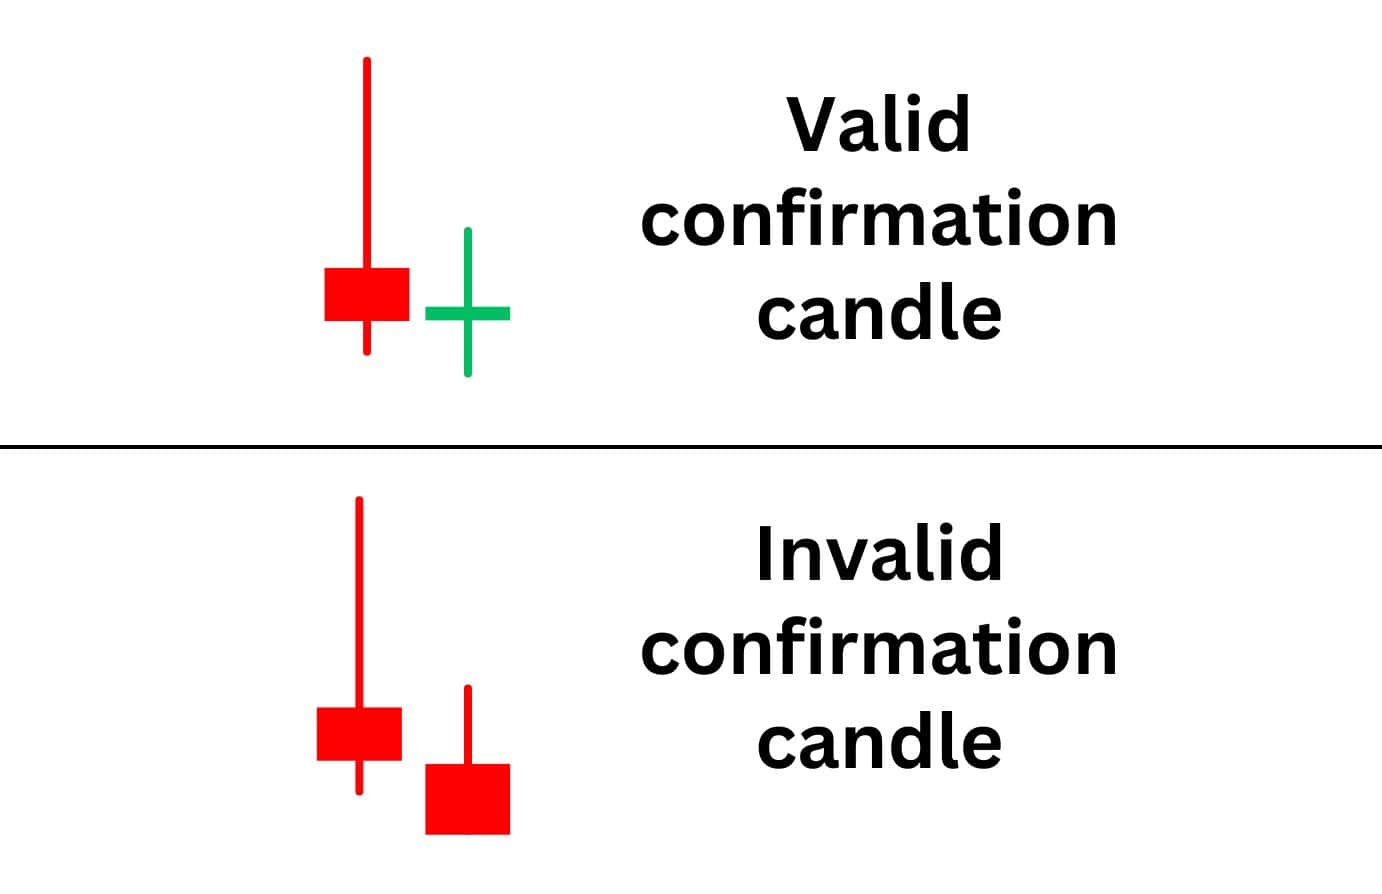
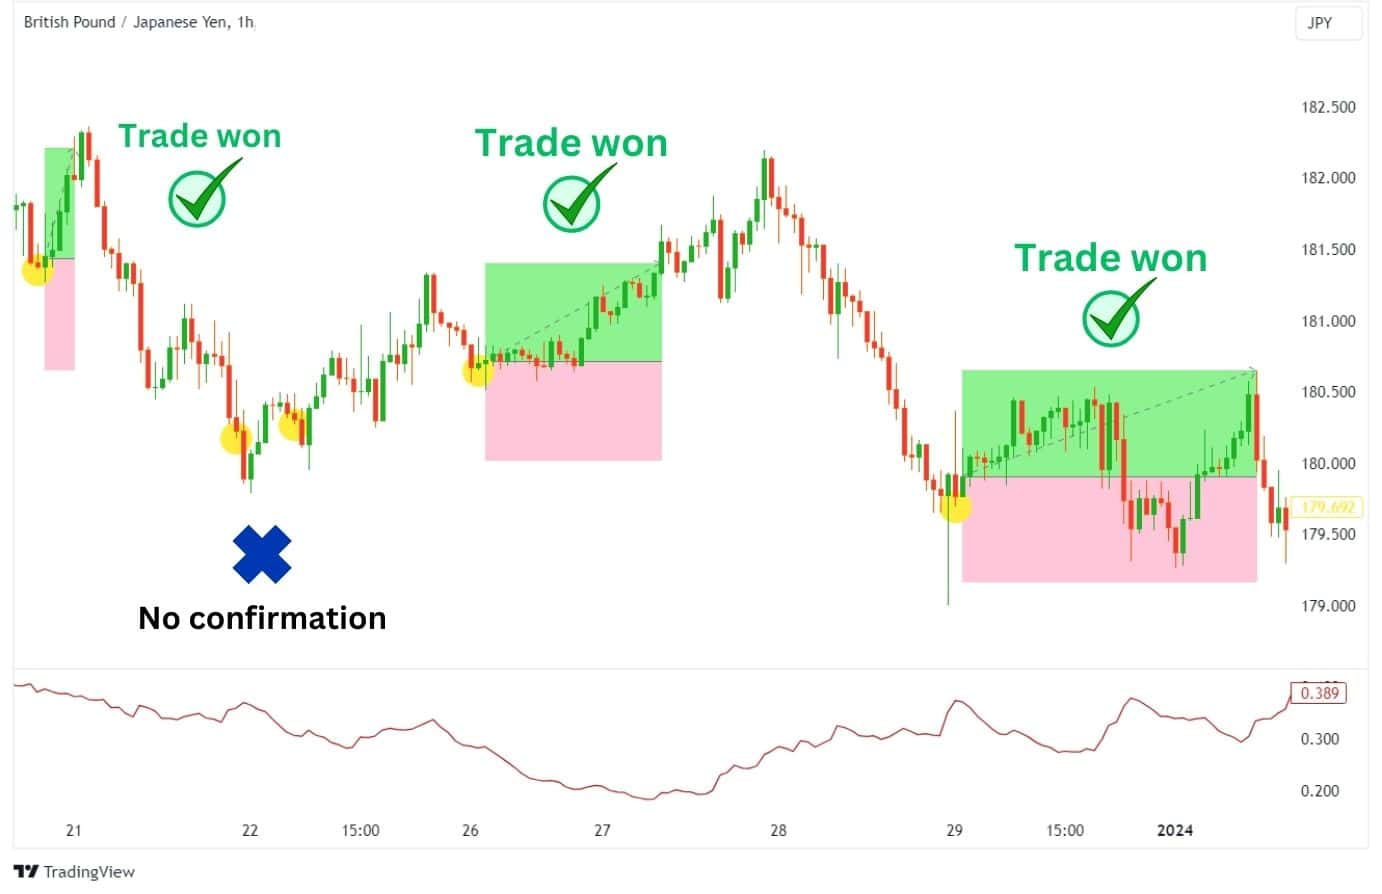
The conventional method of trading the inverted hammer occurs when a bullish candle forms after the inverted hammer, then use that as confirmation to enter a long trade.
A valid confirmation candle would be when the following candle does not close below the candle body of the inverted hammer candlestick. As long as the candle body is not lower than the inverted hammer’s candle body, it should be considered a confirmation candle.
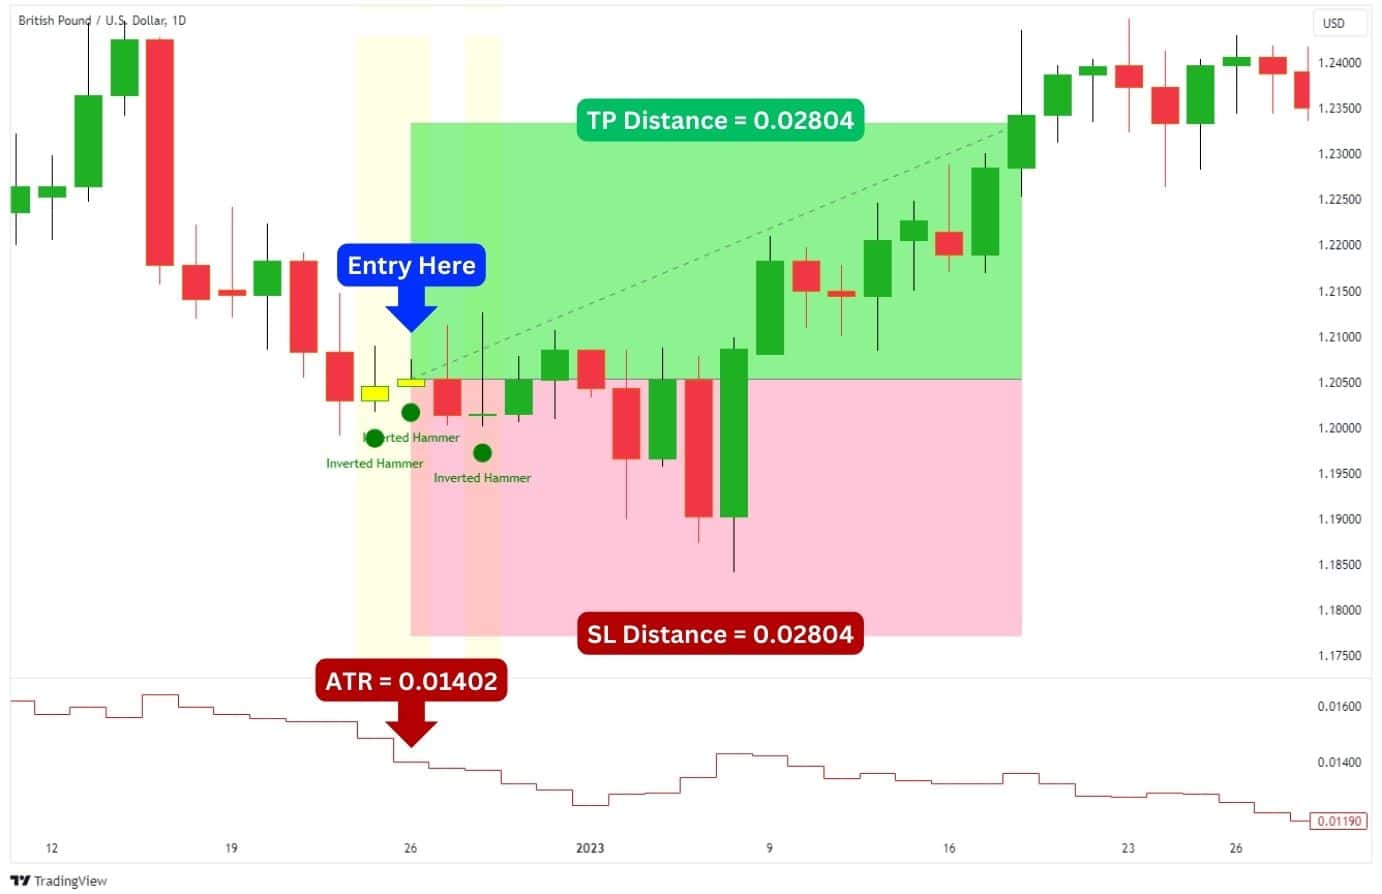
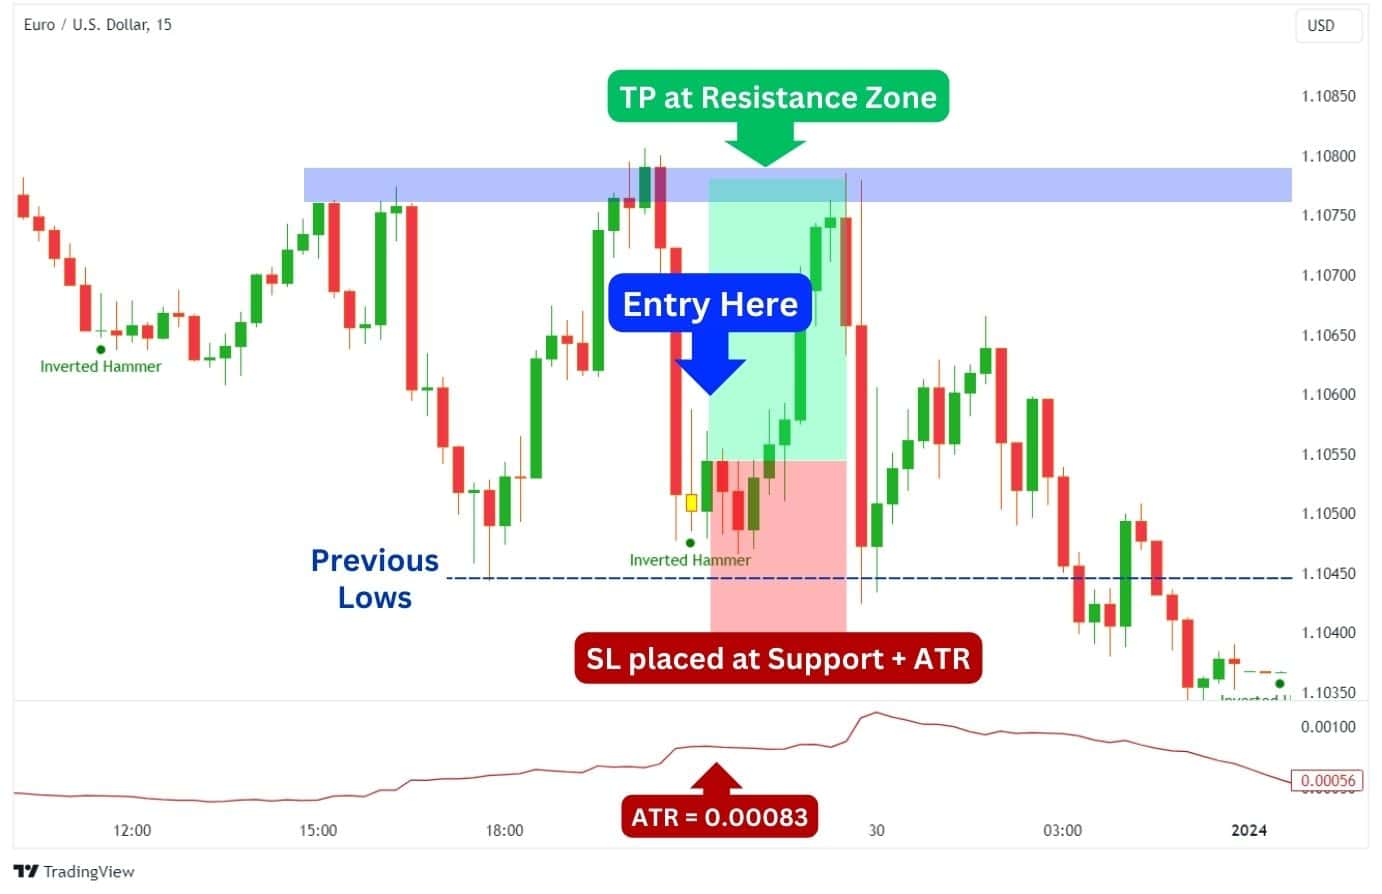
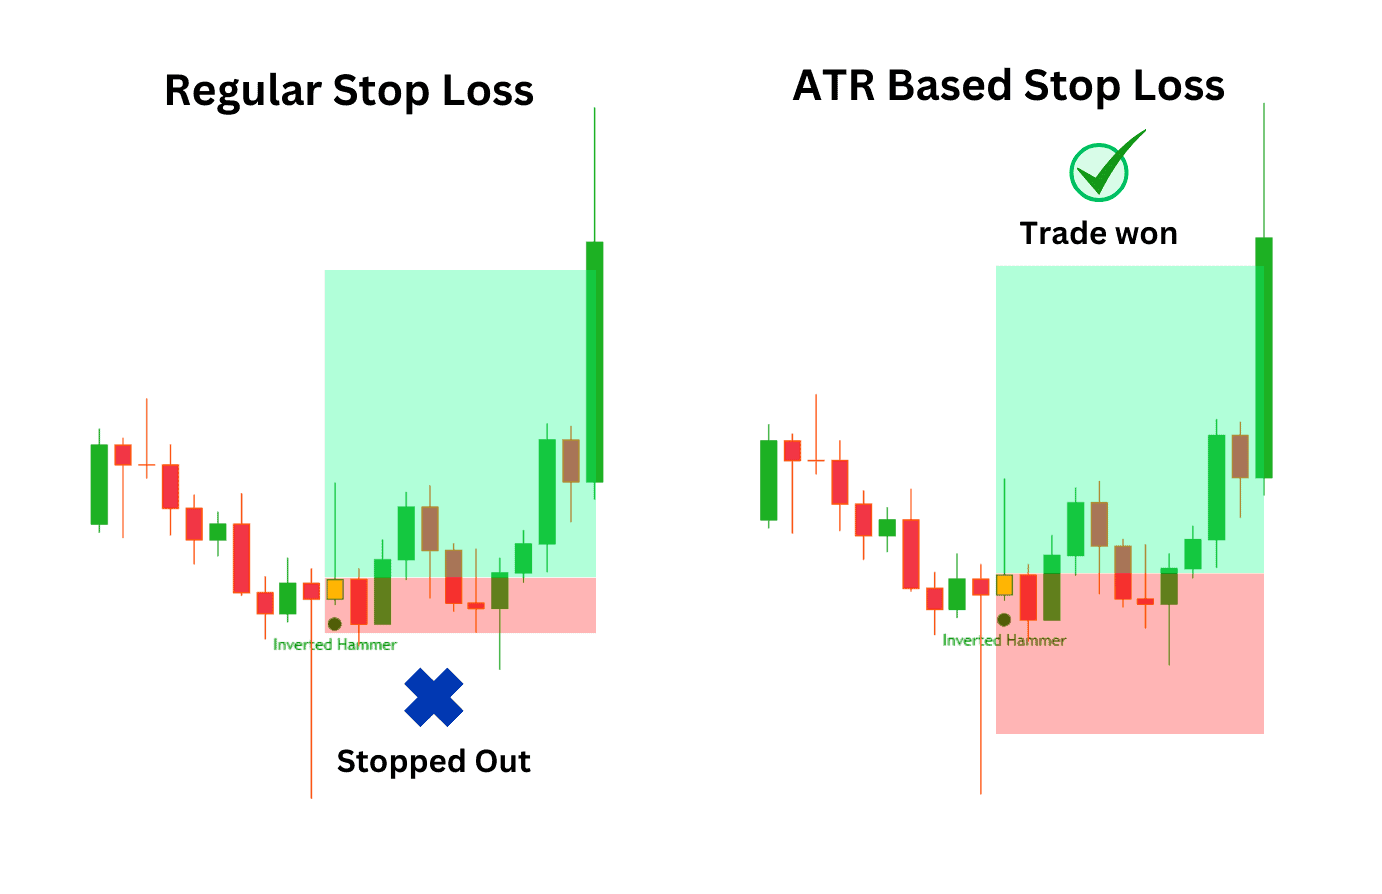
As for the stop loss, the conventional method says: “Set your stop loss below the inverted hammer”. However, we found this method to be faulty upon manual backtesting.
As you can see from the example below, the conventional stop-loss method would have resulted in multiple failed trades. Meanwhile, setting the stop loss at twice the value of the Average True Range (ATR) times two protects several trades from being prematurely stopped out.
In short, here are the conditions to aim for when trading the inverted hammer:
| Entry Conditions | Bullish candle forms after the inverted hammer |
| Stop Loss | Placed to your entry price, subtracted by 2 times the ATR value |
| Take Profit | -Placed at the equal distance of your stop loss or higher (≥ 1:1 RRR) -If you took the trade at a significant support level, you can place the take profit at the next resistance |
Strategies to Trade the Inverted Hammer
Now we’ve tackled the basic approach to trading the inverted hammer, what are some general strategies that can be applied? When trading the inverted hammer, it is important to consider the trading range within which the asset is fluctuating, as this can impact the effectiveness of the pattern. Here are some three strategies.
1. Buy the Dip Strategy with ATR SL/TP
This is a beginner-friendly strategy which focuses strictly on stop loss and take profit placement.
Once the inverted hammer pattern forms and is confirmed, the trader will use the Average True Range (ATR) indicator to determine the stop loss and take profit distances. This will help protect the account capital with a conservative stop loss and take profit level.
Here’s how it works:
- Take the ATR value of the confirmation candle.
- Multiply it by 2.
- Subtract the value from your entry price to get the stop loss price.
- Add the 2x ATR value to your entry price to obtain the take-profit price.
| Recommended Indicators: -Average True Range IndicatorAn indicator for highlighting the inverted handle candlestick pattern -The ‘Adaptive Candlestick’ indicator highlights 15 candle patterns and is available with a live account from Alchemy Markets Entry Signal: -On the formation of an inverted hammer after a price move down -Waiting for a bullish confirmation candle Exit Signals: -Stop loss placed at 2x the ATR reading -Take profit placed at a 1:1 risk-to-reward ratio, equal to the distance as the stop loss |
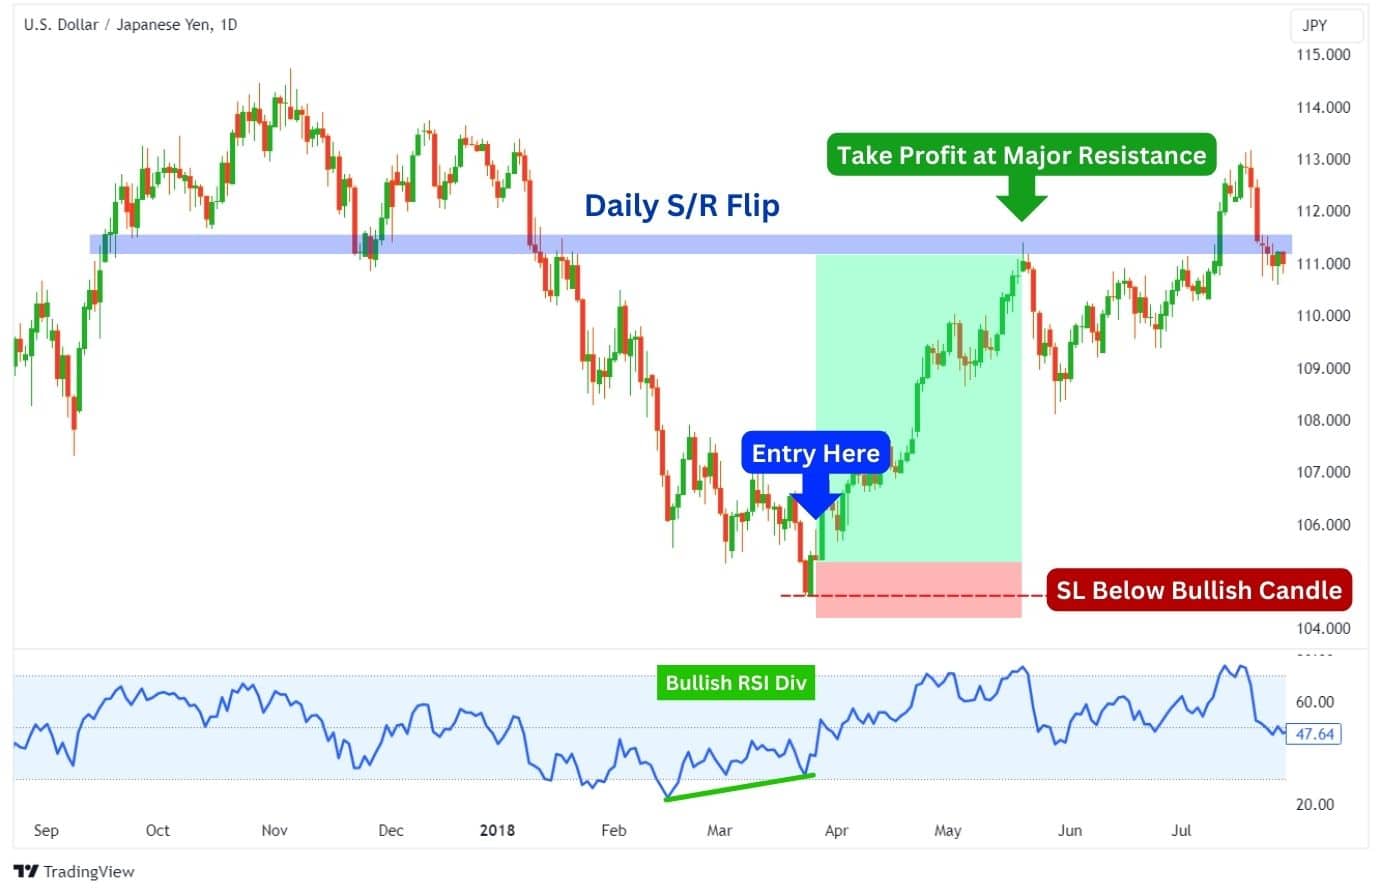
2. Trading the Inverted Hammer at a Support Level
This is a “level to level” approach to trade the inverted hammer candlestick pattern, which requires a basic understanding of support and resistance trading.
In this strategy, the inverted hammer can be used as an initial signal or as a confirmation signal. The support level must be tapped and a bullish candlestick created before an entry can be made.
| Entry Signal: -Inverted hammer formed near a support level -Support level can be Fibonacci level, pivot zone, or other strong support like daily/ weekly/ monthly level -Confirmation candle after the inverted hammer OR bullish candle formed at the support level Exit Signals: -Stop loss placed lower than the support zone and ATR reading -Take profit at the next resistance |
3. Bullish RSI Divergence at the Support Level
This strategy requires a basic understanding of support and resistance charting, and aims to capitalise on large swings that may occur from support zones. This allows us to take trades with solid R/R ratios.
Traditional chart patterns like a double bottom tend to experience bullish divergence with an oscillator like the RSI. Therefore, if you spot an inverted hammer with bullish RSI divergence, it might also suggest a double bottom pattern is developing.
The parameters listed below will help you fine tune your entry towards a better risk-to-reward ratio.
| Entry Signal: -The bullish inverted hammer candlestick pattern forms near a support level -The confirmation candle is present either as a follow-up candle or the inverted hammer itself -Bullish divergence is also present where the Relative Strength Index (RSI) is going higher, while the price is going lower -RSI has recently been oversold (under a reading of 30) Exit Signals: -Stop loss placed below the inverted hammer, or the previous bullish candlestick (whichever has the lower low) -Take profit at the next resistance |
Advantages of Inverted Hammer Candlestick Pattern
Like everything in trading, the inverted hammer pattern has its merits and flaws. Let’s start with three main advantages you get from actively trading this pattern:
Easy to spot: The pattern is only one candle’s length and easily recognisable on the chart.
Great short exit indicator: The pattern can inform traders in shorts to exit their trade, or at least take partial profits before the price reverses.
Potential to catch a big swing: On occasion, the pattern can lead traders into a swing-long trade. This is more likely to happen when you trade the inverted hammer on higher timeframes, such as the daily or weekly chart level.
Disadvantages of Inverted Hammer Candlestick Pattern
Whilst the inverted hammer has its suite of benefits, there are also downsides to using this candlestick pattern.
False signals: The pattern does not always indicate a reversal immediately. Even if it does, sometimes the price can move lower before actually reversing in trend.
Prone to wicking out: If you place the stop loss right below the inverted hammer, your trade is at a higher risk of being stopped.
Low R/R Ratio with ATR Strategy: While using our ATR stop loss strategy will mitigate your losses, it will lead to lower R/R ratios. This is where you’ll need to mind the trading fees on your platform. Alchemy Markets offers the best trading conditions so you can employ a wide range of strategies.
| Advantages | Disadvantages |
| Simple to recognise on the chart | Does not always signal a reversal |
| Great short trade exit signal | Relatively high risk of being stopped out |
| Potential for a big rally to the upside | Lower R/R ratio when using ATR Strategy |
Common Inverted Hammer Candlestick Pattern Mistakes to Watch Out For
There are several common mistakes traders make when trading the inverted hammer candlestick pattern. Fortunately, they are all avoidable mistakes.
Not Using a Wide Enough Stop Loss
One of the biggest weaknesses of the inverted hammer pattern is it does not signal an immediate move up. The price may still chop around and possibly fall below the inverted hammer’s lows before actually making a trend reversal.
In light of this, you must use a wide enough stop loss to give your trade room to breathe. We recommend using the ATR method to set your stop loss to optimise your win rate.
Not Trading The Pattern Near Support
Another mistake traders make with the inverted hammer is not trading the pattern at a support level. Typically, the best way to find an inverted hammer pattern is by watching for reactions at the support level, and checking if the pattern has formed.
Adding support levels as a confluence lends credibility to how strong the bullish reversal signal is from an inverted hammer, and can better prepare you for a swing long position.
Trading the inverted hammer near support also helps to avoid long trades for shooting stars by accident. You see, a shooting star is visually identical to an inverted hammer and could be confused. An inverted hammer would appear near support while a shooting star is more likely to appear near resistance.
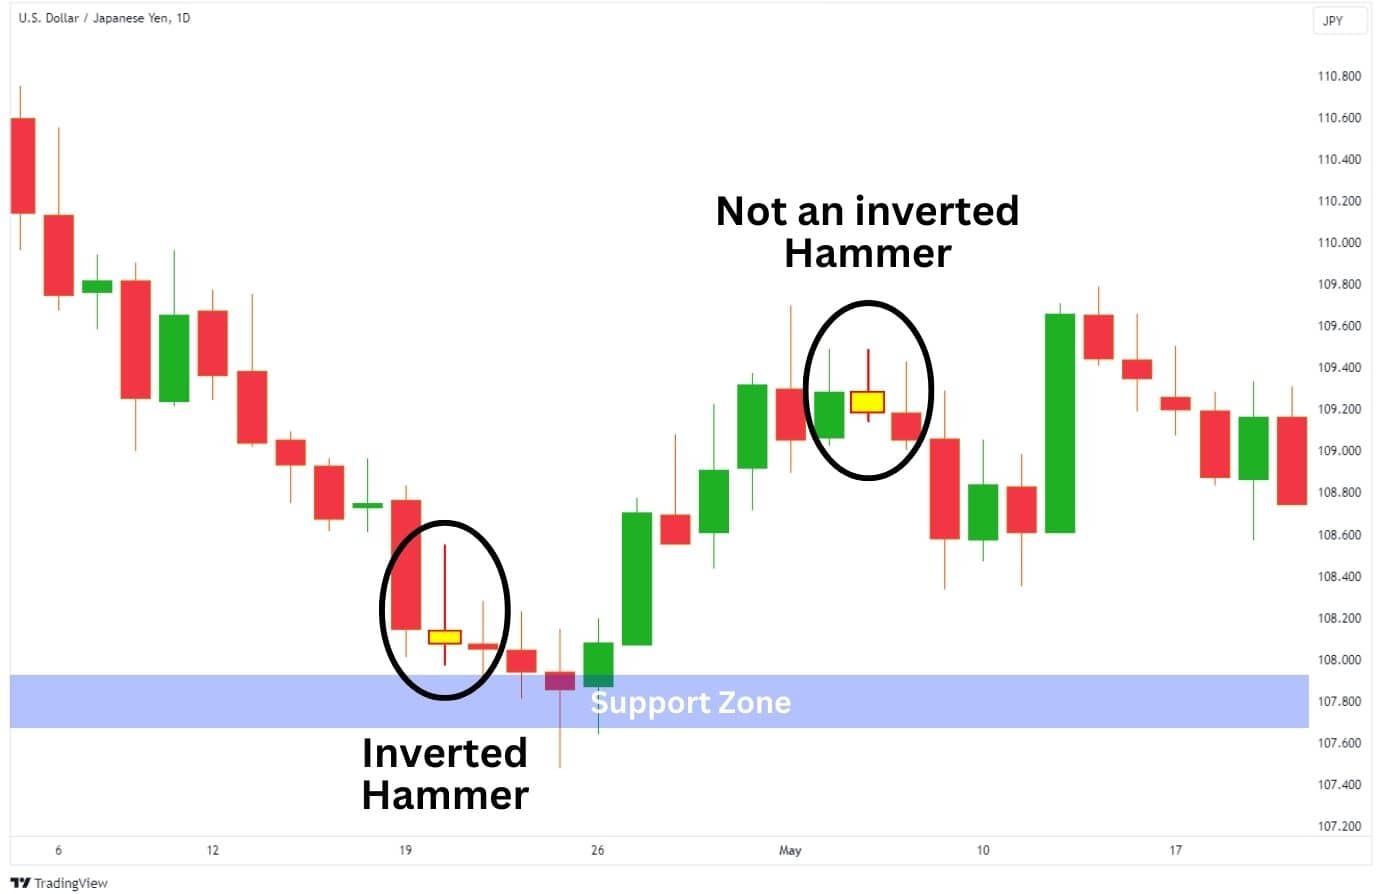
How to Avoid Mistaking the Shooting Star for an Inverted Hammer?
As previously stated, the shooting star and inverted hammer look alike. However, the context of where they appear within the trend is what makes them different. It can be frustrating to constantly confuse the two patterns.
There there are more than 15 Japanese candlestick patterns that are commonly followed by traders. Remembering them all can be a struggle for many traders, beginners and experts alike. Therefore, using an indicator which highlights the various patterns directly on the chart can help you avoid making false identifications and help you trade the right direction.
Traders signed up with Alchemy Markets will receive FREE access to Trading Central’s “Adaptive Candlesticks” indicator on MT5.
Here’s how you can acquire the Adaptive Candlestick Indicator plus other free tools:
- Open an account with Alchemy Markets.
- Login to your dashboard.
- Click on the ‘Trading Tools’ tab to download Trading Central indicators.
Shooting Star vs Inverted Hammer
The shooting star and inverted hammer are Japanese candlestick patterns used in technical analysis to forecast the market’s next price trend. They are both characterised by a long upper shadow (selling tail) and a small candle body at the bottom.
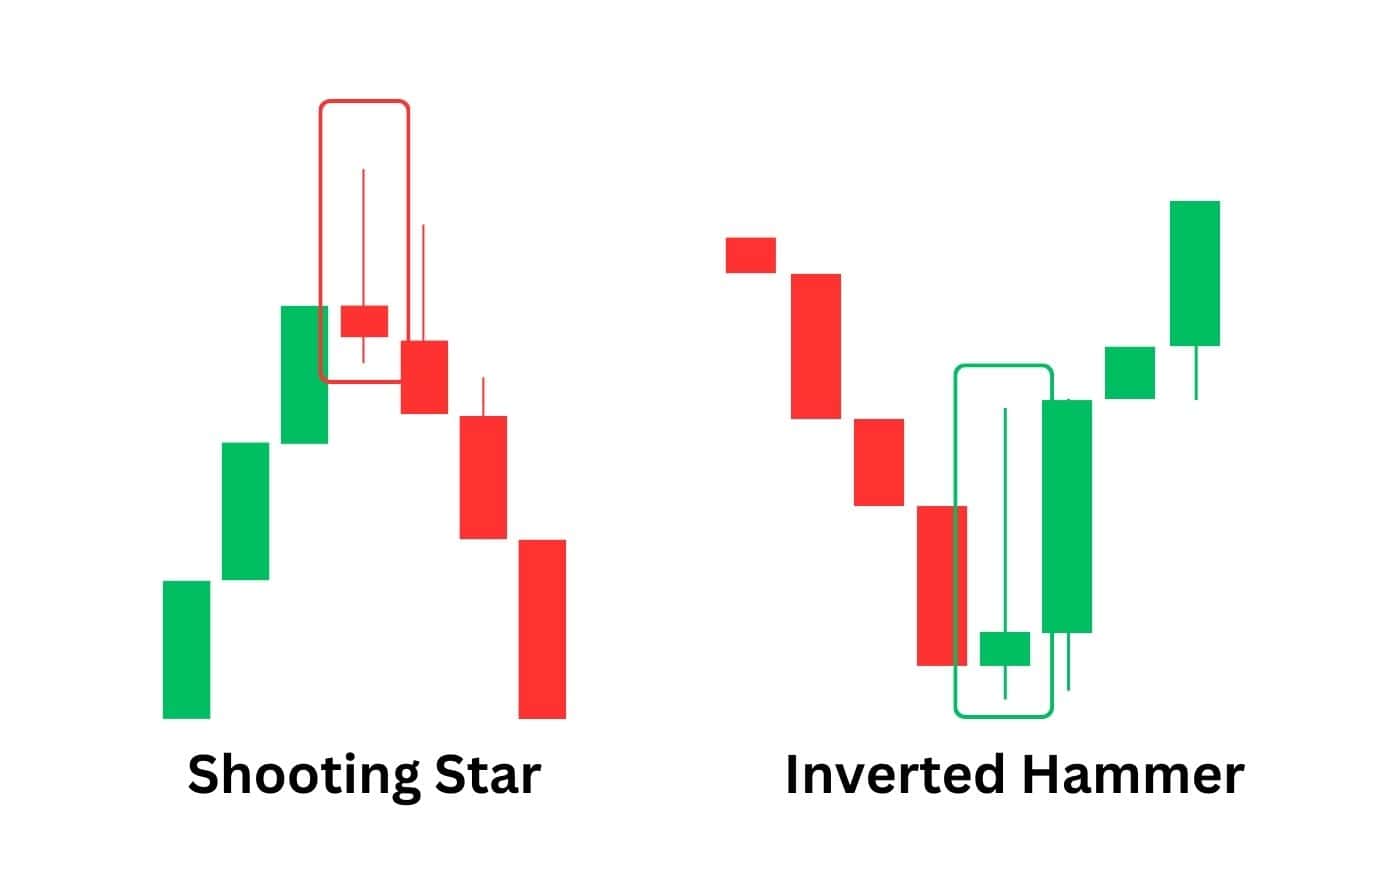
While both candlesticks look identical, they forecast completely different scenarios. The shooting star implies a bearish move down is coming soon, while the inverted hammer implies a bullish market move is on the horizon. To differentiate them, simply understand that an inverted hammer forms when the price moves down, while the shooting star forms when the price moves up.
Inverted Hammer vs Doji
The inverted hammer and doji are Japanese candlestick patterns used by technical traders to forecast where the market is potentially going next – up or down. Both patterns are visually distinct from each other. The inverted hammer has a long upper shadow and a small lower candle body, while the doji candlestick has a tiny candle body, appearing like a cross.
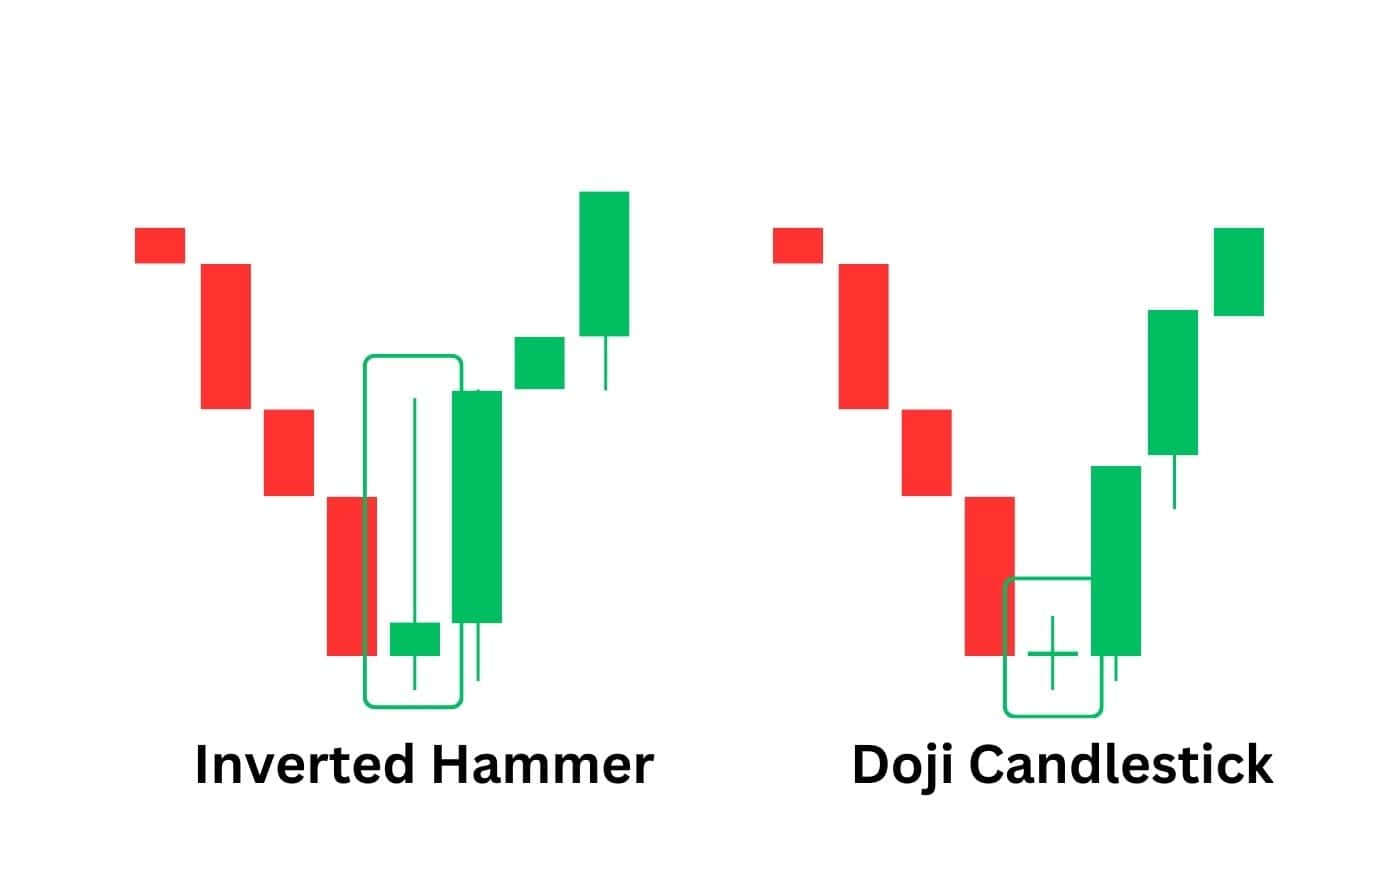
The inverted hammer pattern provides a clearer, actionable signal, as it implies that prices could reverse and rally. Meanwhile, the doji candlestick signifies indecision in the market, which does not lend itself to forecasting a clear trend direction – the price could continue its trend or reverse. Typically, more confirmation candles are required to make a trade based on the doji candlestick pattern.
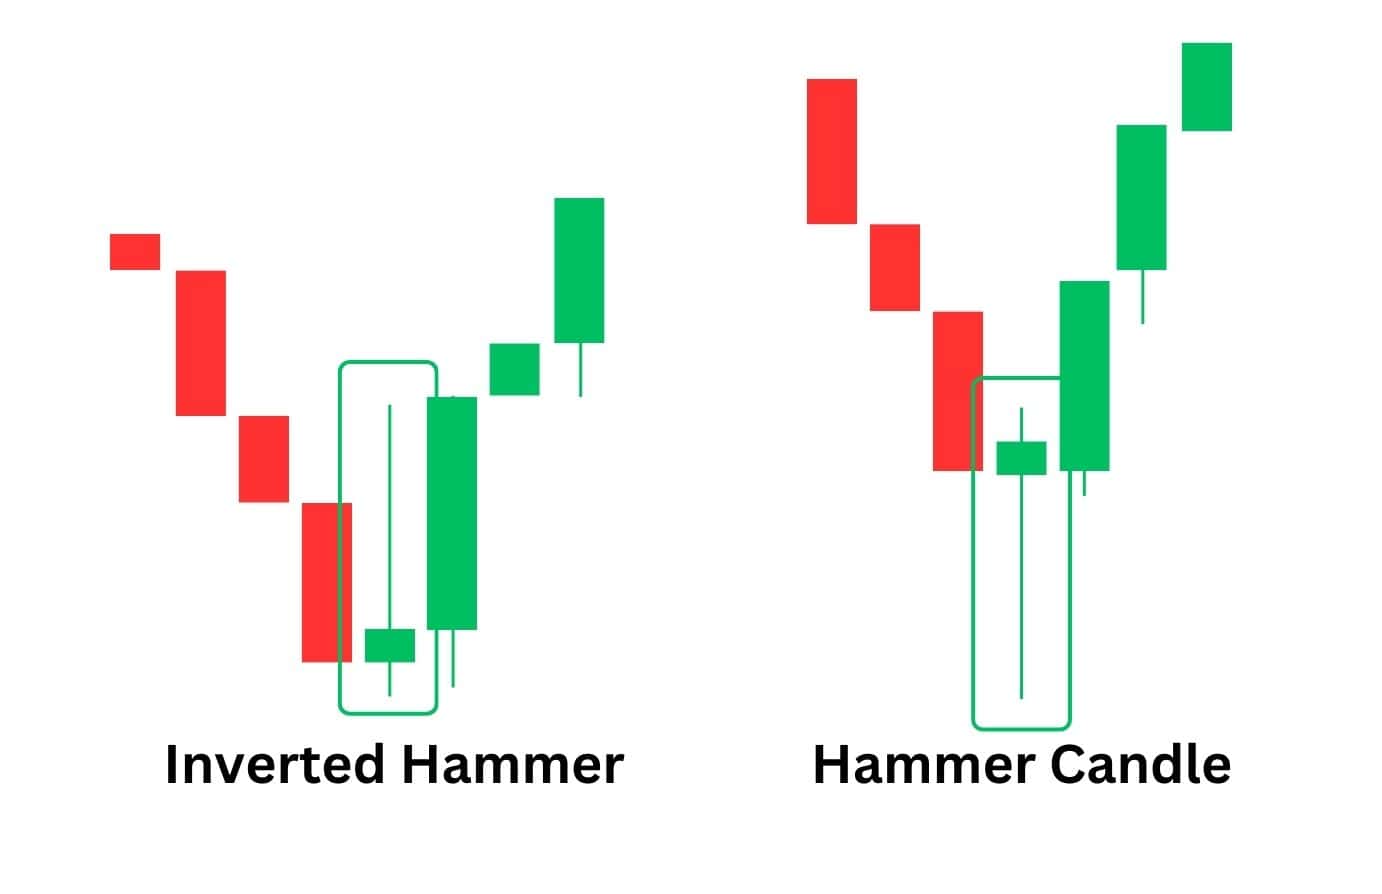
Inverted Hammer vs Hammer
The inverted hammer and hammer candlestick patterns are both bullish reversal Japanese candlesticks, found at the lows of a downtrend. They hint at weakening selling pressure and an imminent rally.
Notice how each pattern has a small candle body positioned at the extremes of the candlestick, and a long wick or shadow. The inverted hammer has its candle body at the bottom, and a long shadow to the upside. Conversely, the hammer has its candle body at the top, and a long shadow to the downside.
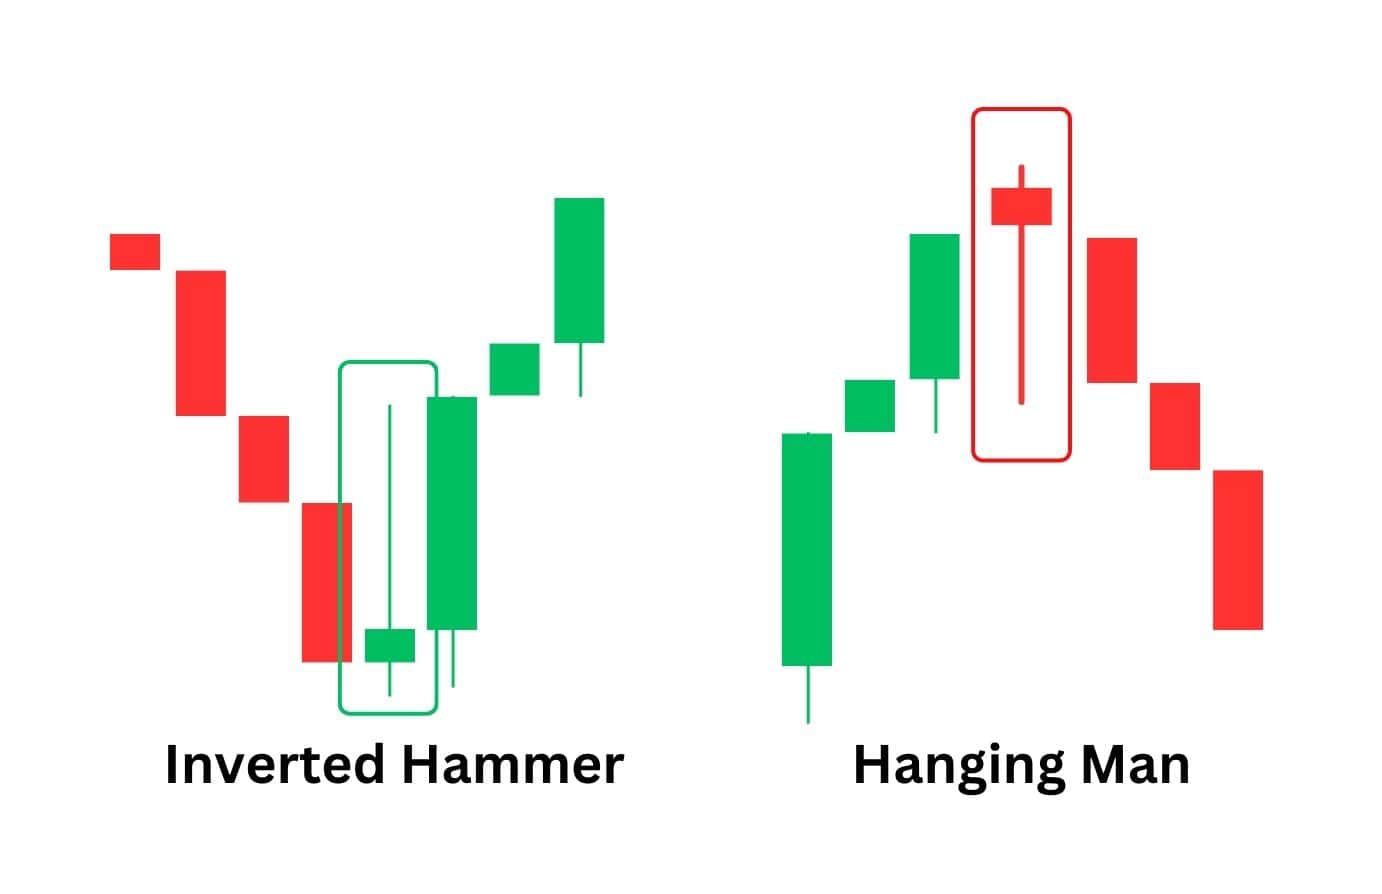
Inverted Hammer vs Hanging Man
The inverted hammer and hanging man patterns are direct opposites in appearance and what they signal. Whilst the inverted hammer is a bullish reversal pattern, the hanging man is a bearish reversal pattern that forms after a price moves up.
Unlike the inverted hammer, the hanging man has a small candle body near the top extremes of the candlestick, and comes with a large lower wick. Though this lower wick can be interpreted as buying pressure, it’s also a sign that the market is interested in actively shorting the asset.
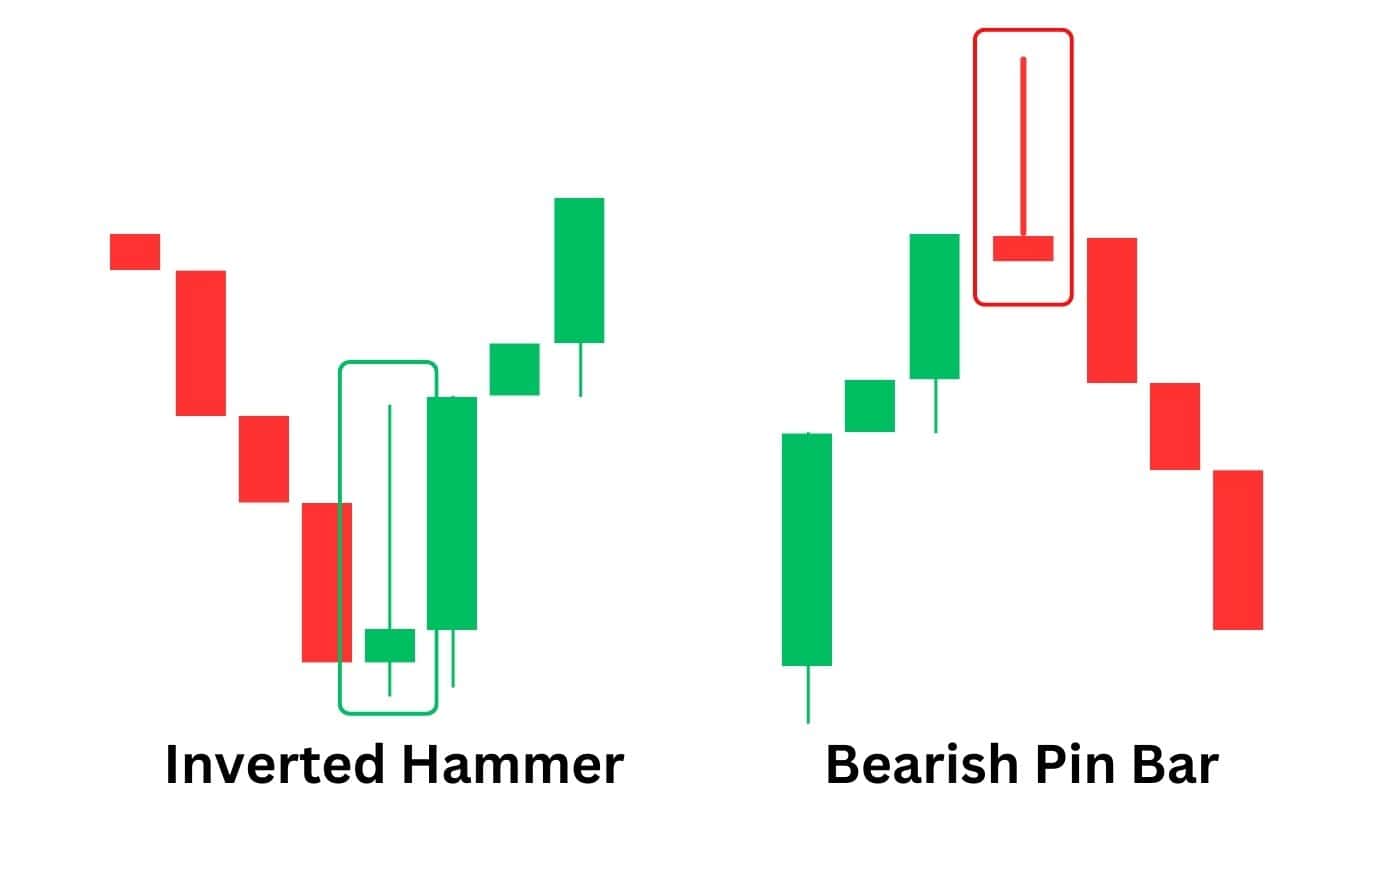
Inverted Hammer vs Bearish Pin Bar
The bearish pin bar is similar to the shooting star pattern, in that it has a long upper shadow, and appears at the highs of a move-up. While the inverted hammer tells a story of a potential bullish reversal, the bearish pin bar tells us there is strong selling pressure, and that price may start to collapse from here.
Generally speaking, the pattern should look like an upside down pin, and can sometimes be used interchangeably with the shooting star.
FAQ
How reliable is an inverted hammer candlestick pattern?
The inverted hammer candlestick pattern is generally considered to be a reliable bullish reversal signal, particularly when combined with the use of support levels, and bullish divergences.
However, its main limitation lies in the timing of the reversal as the pattern by itself does not guarantee an immediate shift up in price. There are many instances where the price continues to decline, even after the formation of an inverted hammer pattern. Sometimes, another bullish candlestick pattern forms below the inverted hammer, and it is only then does the market typically start to reverse into an uptrend.
So ultimately, the inverted hammer is a good signal which tells traders that bearish momentum is slowing down, and that it’s time to look for further confirmations for a long trade. We just have to keep in mind that the price could potentially drop lower, and have responsible risk management if the reversal signal is false.
Is an inverted hammer candlestick pattern a bullish reversal?
The inverted hammer candlestick pattern is a bullish reversal pattern that appears at the lows of a price move. Often, this candlestick will form near support levels (not necessarily always at the support level), and require additional factors to increase the probability of a bullish reversal.
How often does the inverted hammer candlestick pattern happen?
While there is no official documentation on the frequency at which an inverted hammer appears, many traders have noted that the inverted hammer candlestick tends to occur more at lower timeframes.
Origins of the Inverted Hammer
The inverted hammer candlestick was founded by Japanese rice traders in the 17th century, as part of their Japanese candlestick charting techniques to track and forecast the price of rice. Despite being founded centuries ago, Japanese candlestick patterns have become the standard de facto preferred charting method in technical analysis, used by today’s traders.
Who first identified the Inverted Hammer Candlestick pattern?
There is no clear record of who exactly identified the inverted hammer candlestick pattern. However, it is widely considered that the founder of the Japanese candlestick charting system is Munehisa Homma, a Japanese rice trader.
Steve Nison, an American trader and author, was pivotal in popularising Japanese candlesticks in the West. His book: “Japanese Candlestick Charting Techniques” was published in 1991 and talked about the key concepts of what makes up a Japanese candlestick, as well as the patterns that can be observed. This would include the inverted hammer candlestick pattern, which is now widely used today.


