


Written by:

Reviewed by:

Bearish
- February 11, 2025
- 25 min read
Bearish Harami Pattern: A Comprehensive Trading Guide
What is a Bearish Harami Pattern?

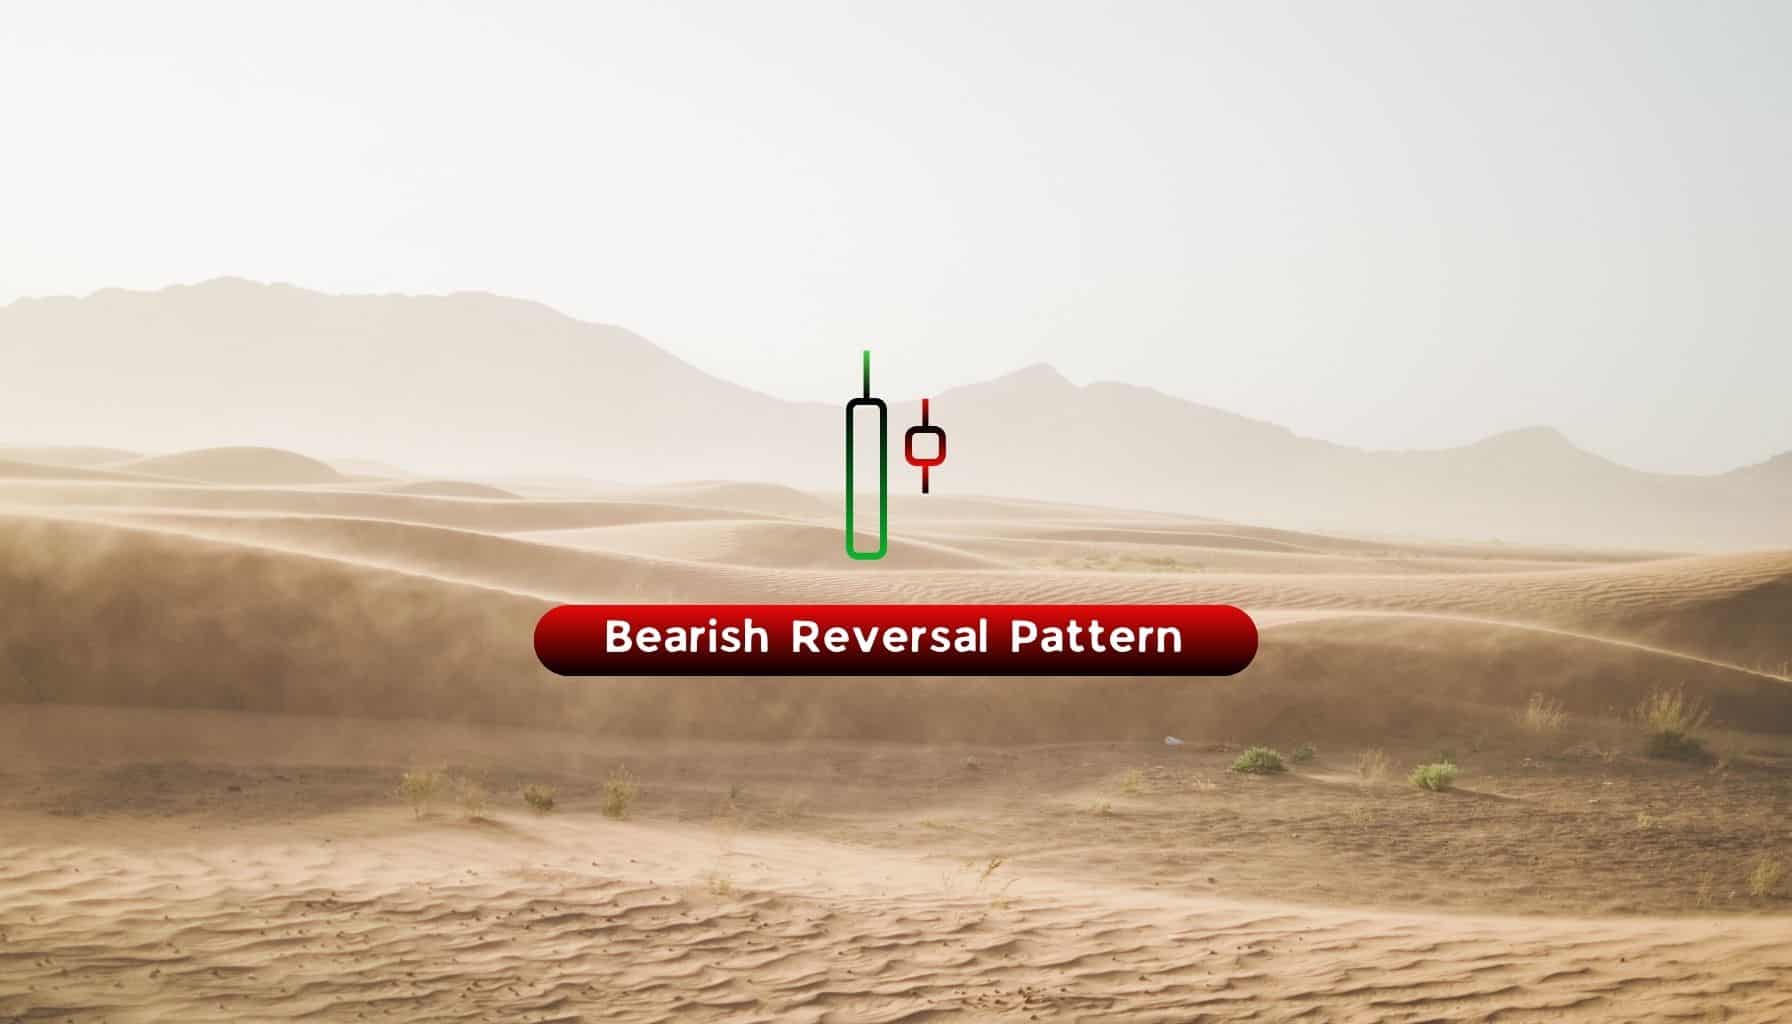
A bearish harami is a two-candlestick pattern used in technical analysis to signal when an uptrend may reverse lower. The pattern consists of a long-range bullish candle (first candle) followed by a smaller bearish candle (second candle).
As a candlestick pattern, the bearish harami indicates that recent buying pressure is losing momentum, and sellers may soon begin to gain control and dictate the price action moving forward. This is illustrated by the contrast between the two candles — where the first candle strongly marks a continuation of buying pressure, followed by a bearish second candle that suddenly interrupts this advance and introduces some selling pressure.
What is a Bearish Harami Cross?
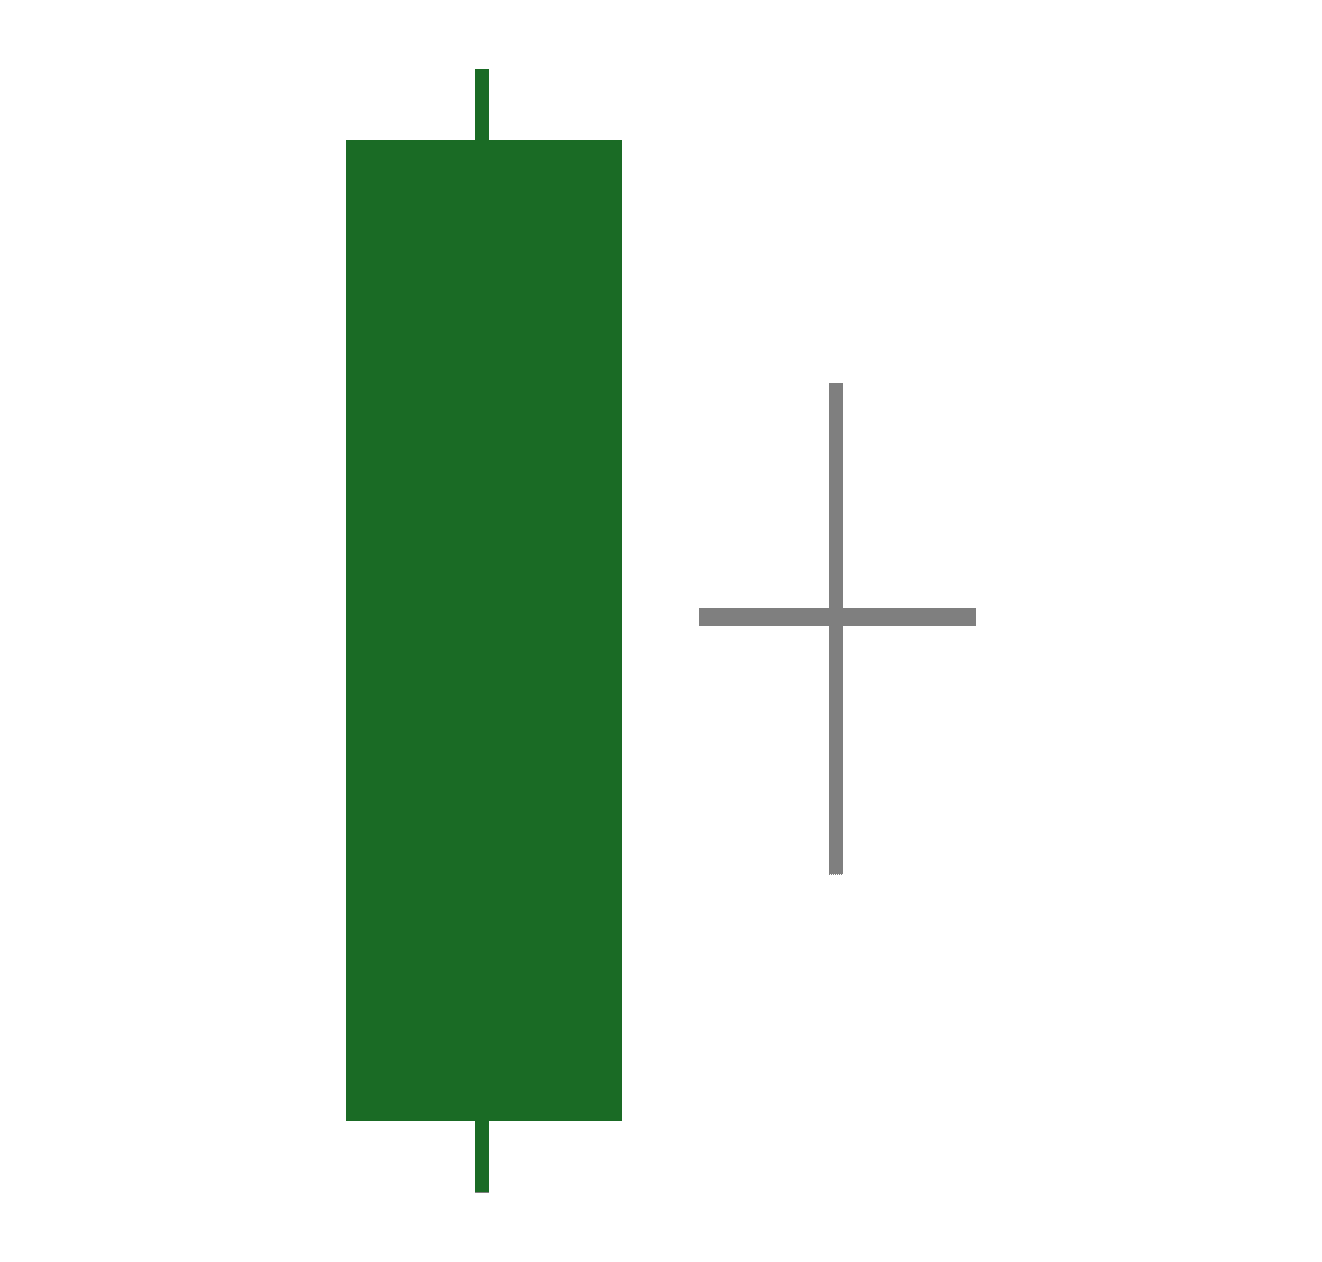
A bearish harami cross is a variant of the classic bearish harami pattern. The main difference between the bearish harami cross and the classic bearish harami is in the pattern’s second candle. In the bearish harami cross, the second candle is replaced by a doji (a candlestick with identical or nearly identical opening and closing prices that resembles a cross, hence the name).
This cross illustrates a state of price equilibrium or uncertainty regarding the future price direction. Thus, it still signals a possible reversal, as it introduces a sense of hesitation about whether the price will continue moving upward. The color of this cross can be:
a) grey if both the opening and closing prices are identical (at the same level),
b) green if the closing price is slightly higher than the opening price,
c) red if the closing price is slightly lower than the opening price.
Note: The color of the cross is not important, as its appearance is what truly matters in this variant.
What Does a Bearish Harami Pattern Tell You
Generally, when a bearish harami pattern forms, it suggests a potential market sentiment shift from bullish to bearish. In an uptrend, this could signal a decisive trend reversal toward a downtrend. On the other hand, if this pattern appears during a retracement phase in a downtrend, it may indicate the end of the short-term price advance, alluding to a renewed bearish selling pressure and the likely resumption of the longer-term downward price trajectory.
How to Identify the Bearish Harami Pattern?
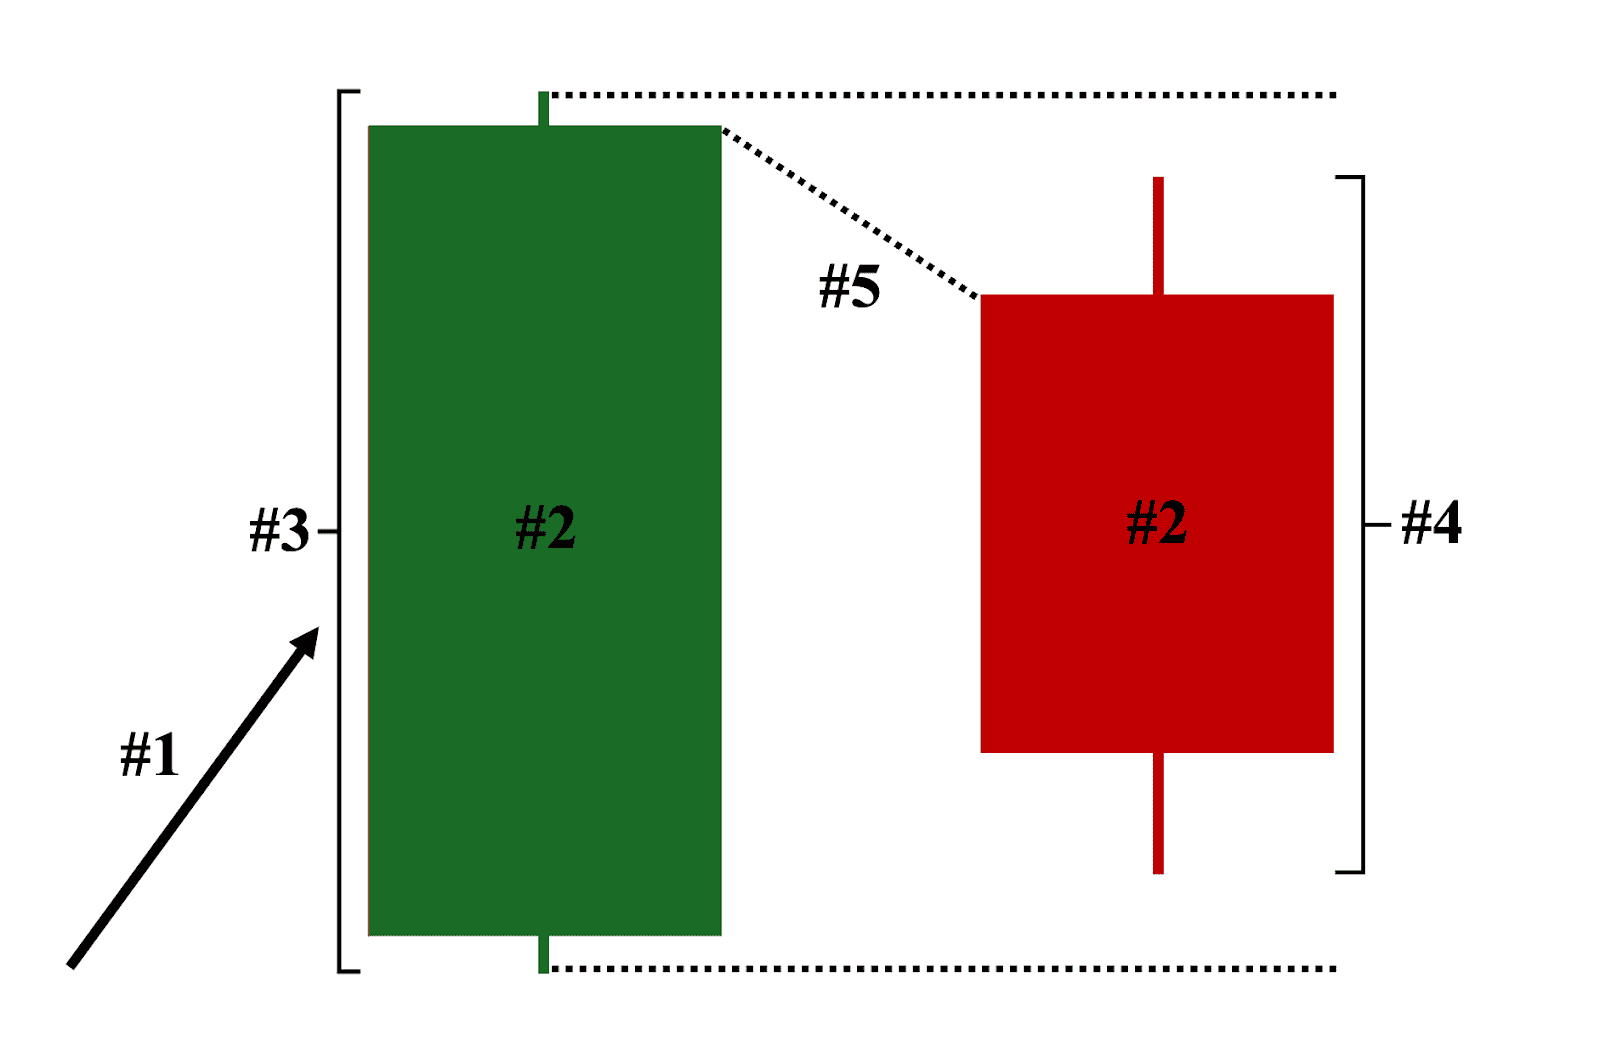
Here are the five key characteristics of a valid bearish harami candlestick pattern on a price chart:
- Position on the Chart – The two candles must appear either:
a) at the top of an established uptrend, or
b) at the end of the retracement phase (temporary price advance) of a downtrend. - Color: Depending on your chart settings, the first candle must be green or white, and the second candle must be red or black.
- 1st Candle: A long-bodied bullish candle that completely engulfed the range—body and shadows—of the 2nd candle.
- 2nd Candle: A smaller-bodied bearish candle that is completely covered and contained within the 1st candle.
- Gap Down: While not a strict requirement, the second candle typically opens lower than the first candle’s closing price, creating a noticeable gap in price and reinforcing the bearish reversal strength of the pattern.
Examples of Bearish Harami Candlestick Patterns
Here are four distinct examples of bearish harami patterns on a price chart:
Example 1: Successful Trend Reversal Scenario (Uptrend to Downtrend)
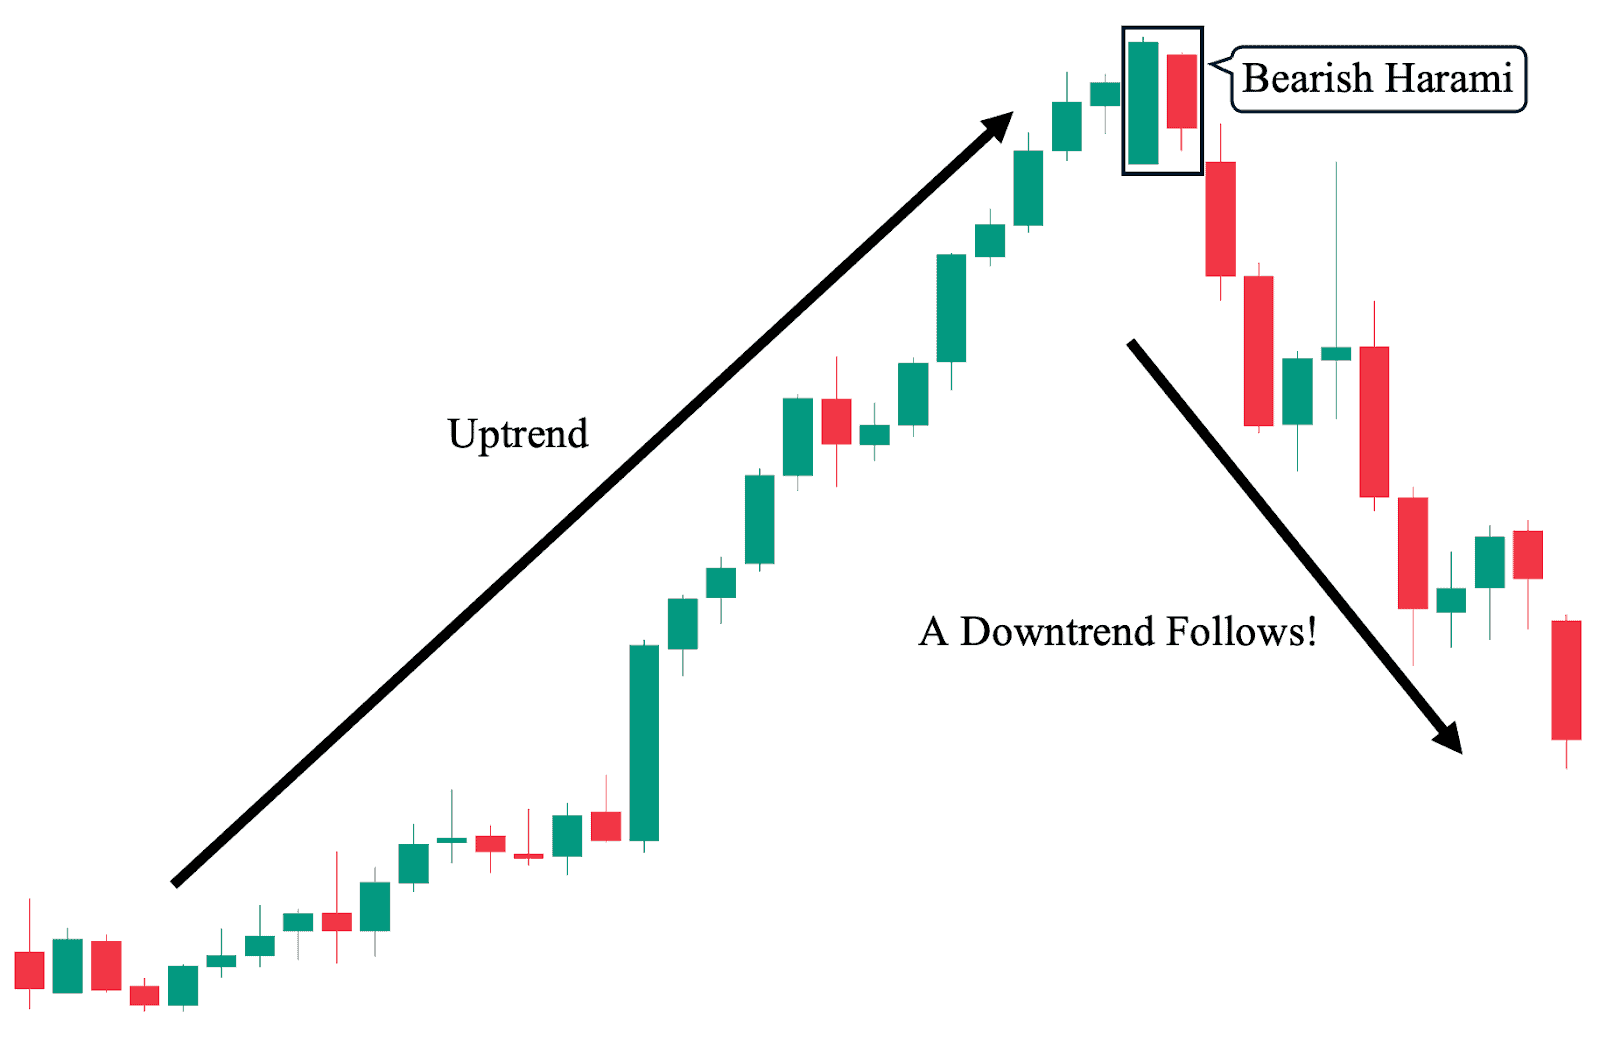
This first example shows the ideal scenario when trading the bearish harami candlestick pattern. As we can observe on the chart, there was an established uptrend clearly supported by an overwhelming bullish momentum (as evidenced by the largely uninterrupted price rally). Then, at the peak, the bearish harami pattern forms—eventually acting as the catalyst for the trend reversal (downtrend) that followed.
Example 2: Failed Trend Reversal Scenario (Uptrend Continues)
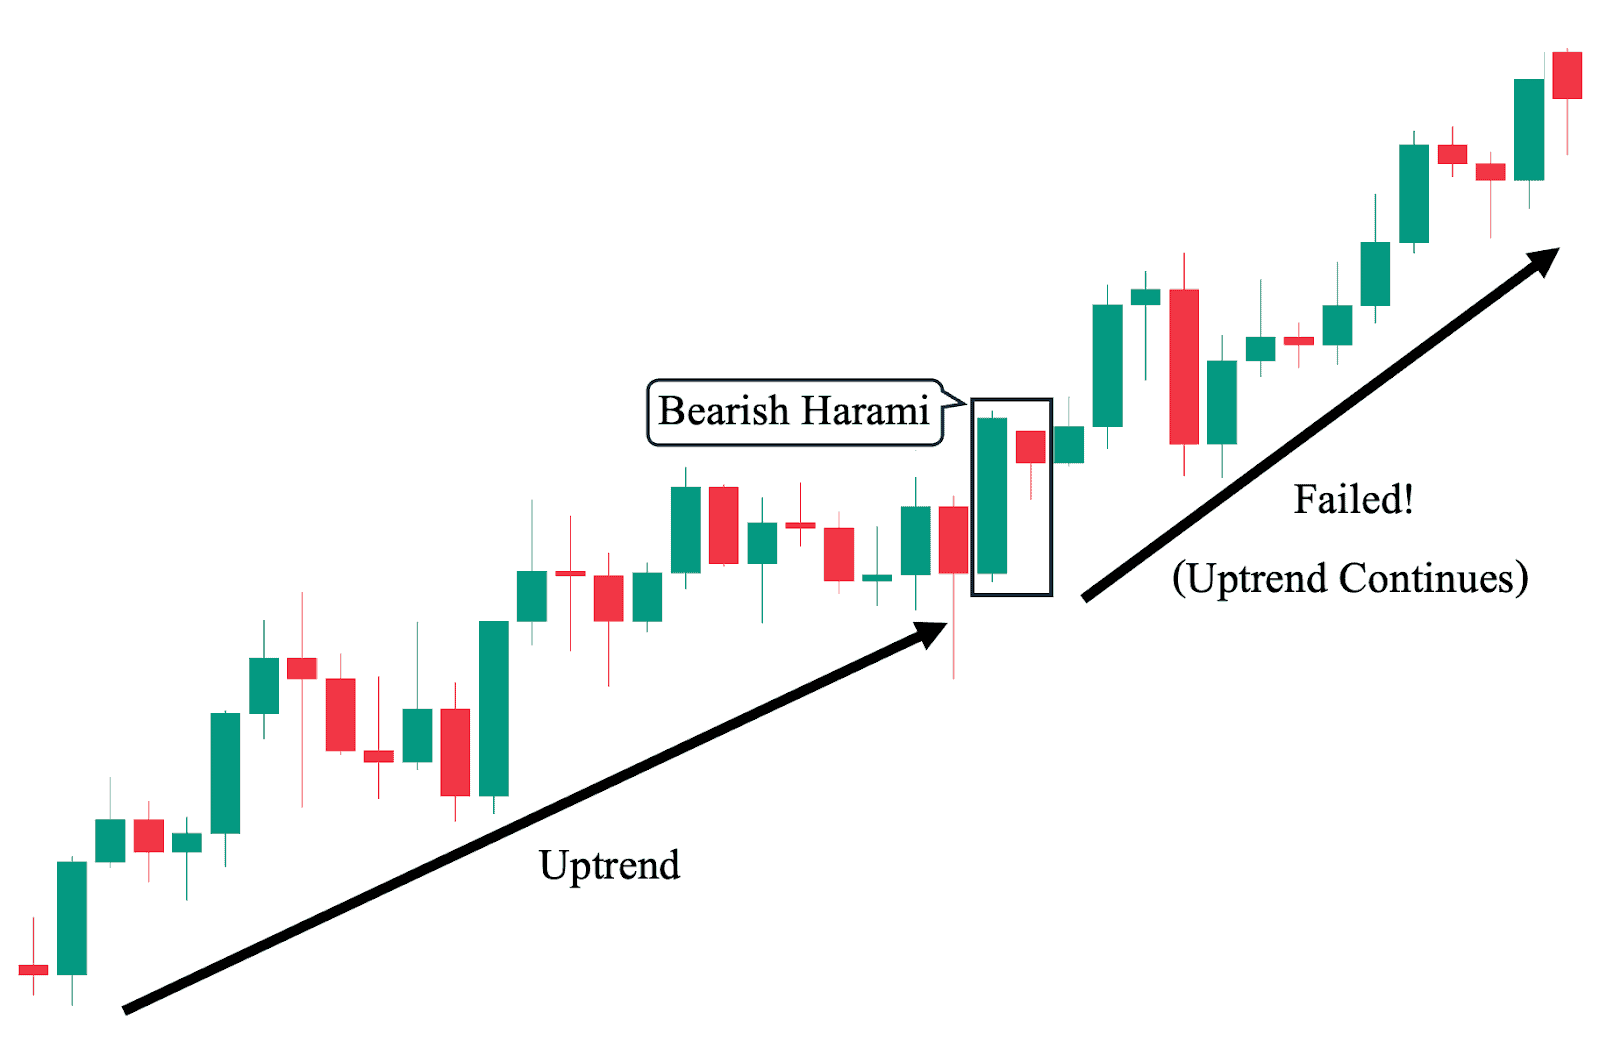
In sharp contrast to the first example, this price chart illustrates how the bearish harami candlestick pattern can also fail to trigger a successful bearish reversal. As we can observe, there was an established uptrend moving in a more controlled manner, with consolidation and correction periods between significant price increases. Then, after a renewed bullish move (the pattern’s first candle breaking the consolidation), a much smaller bearish candle appears—forming the bearish harami pattern. However, the pattern did not lead to a successful trend reversal (downtrend); instead, the upward move continued.
With Market Context Consideration:
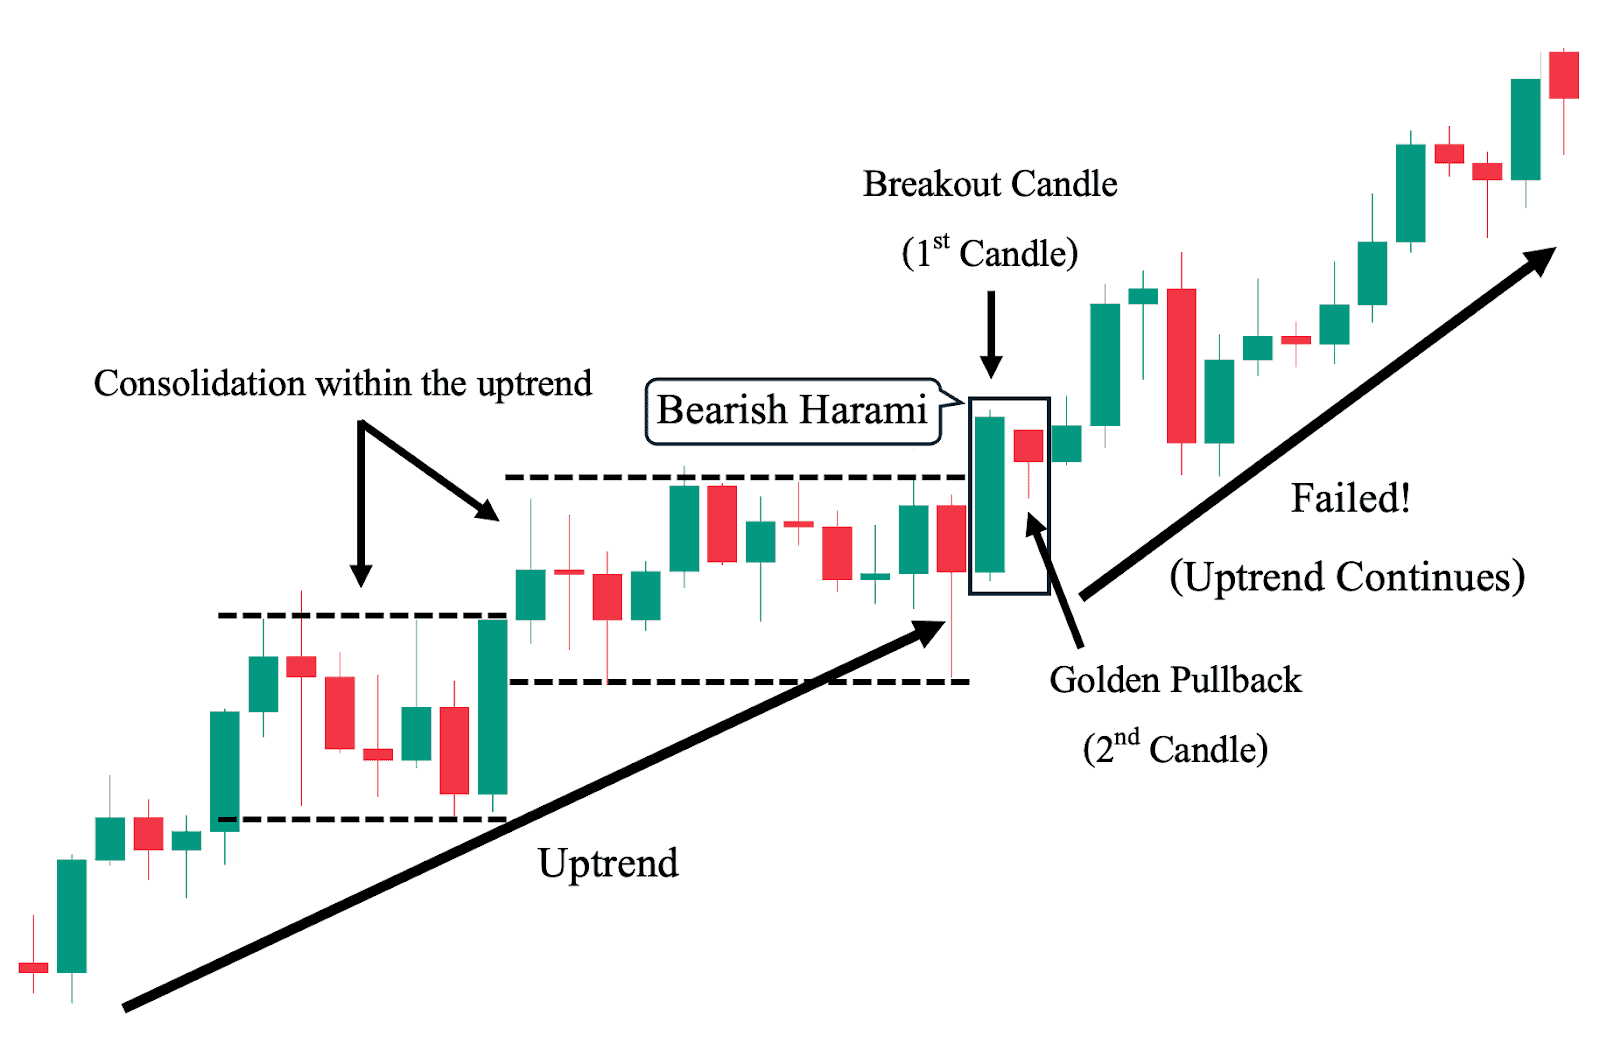
To understand why the second example may have failed, let’s look at the same chart but with consideration of the broader market context. As we have mentioned, there were consolidation and correction periods between significant price increases. This can be seen clearly in the image above.
Now, we can observe that the first candle of the bearish harami pattern also happens to be the breakout candle of the recent consolidation period, and while the second candle is bearish (and technically formed the bearish harami pattern), we can see that it did not close below the upper channel (resistance level) of the previous consolidation. In fact, this candle served as a “golden pullback”—testing the resistance level, holding, and providing a better (lower) entry for a long position.
Note: Market context takes precedence over any candlestick pattern, including the bearish harami.
Example 3: Marking the End of a Downtrend’s Retracement Phase
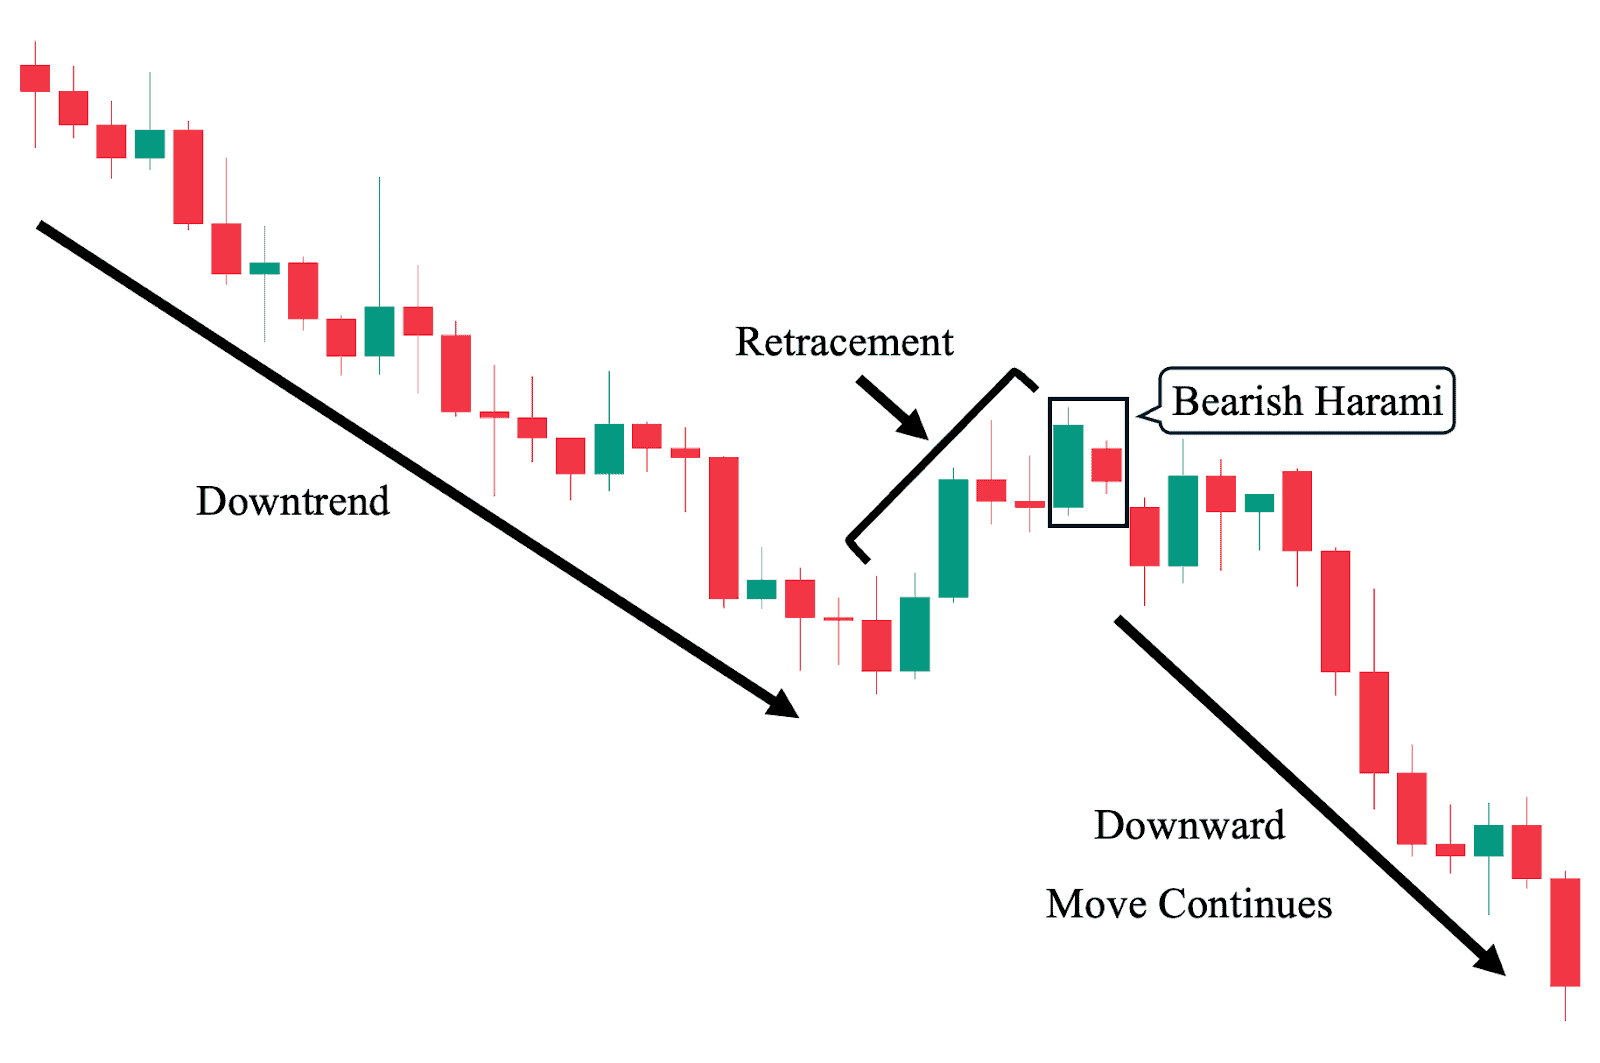
In this third example, we illustrate how the bearish harami pattern can be used during a downtrend. As shown above, there was a decisive downward price trend with strong bearish momentum, consistently creating lower highs and lower lows. Then, a temporary pause occurred in the downward move, during which a retracement phase (a short-term price advance) can be observed. The bearish harami pattern forms at the top of this retracement phase, signaling the resumption of bearish momentum, and indeed, the downward move continues.
Example 4: Indecisive Outcome Scenario (Shifts to Non-Trending)
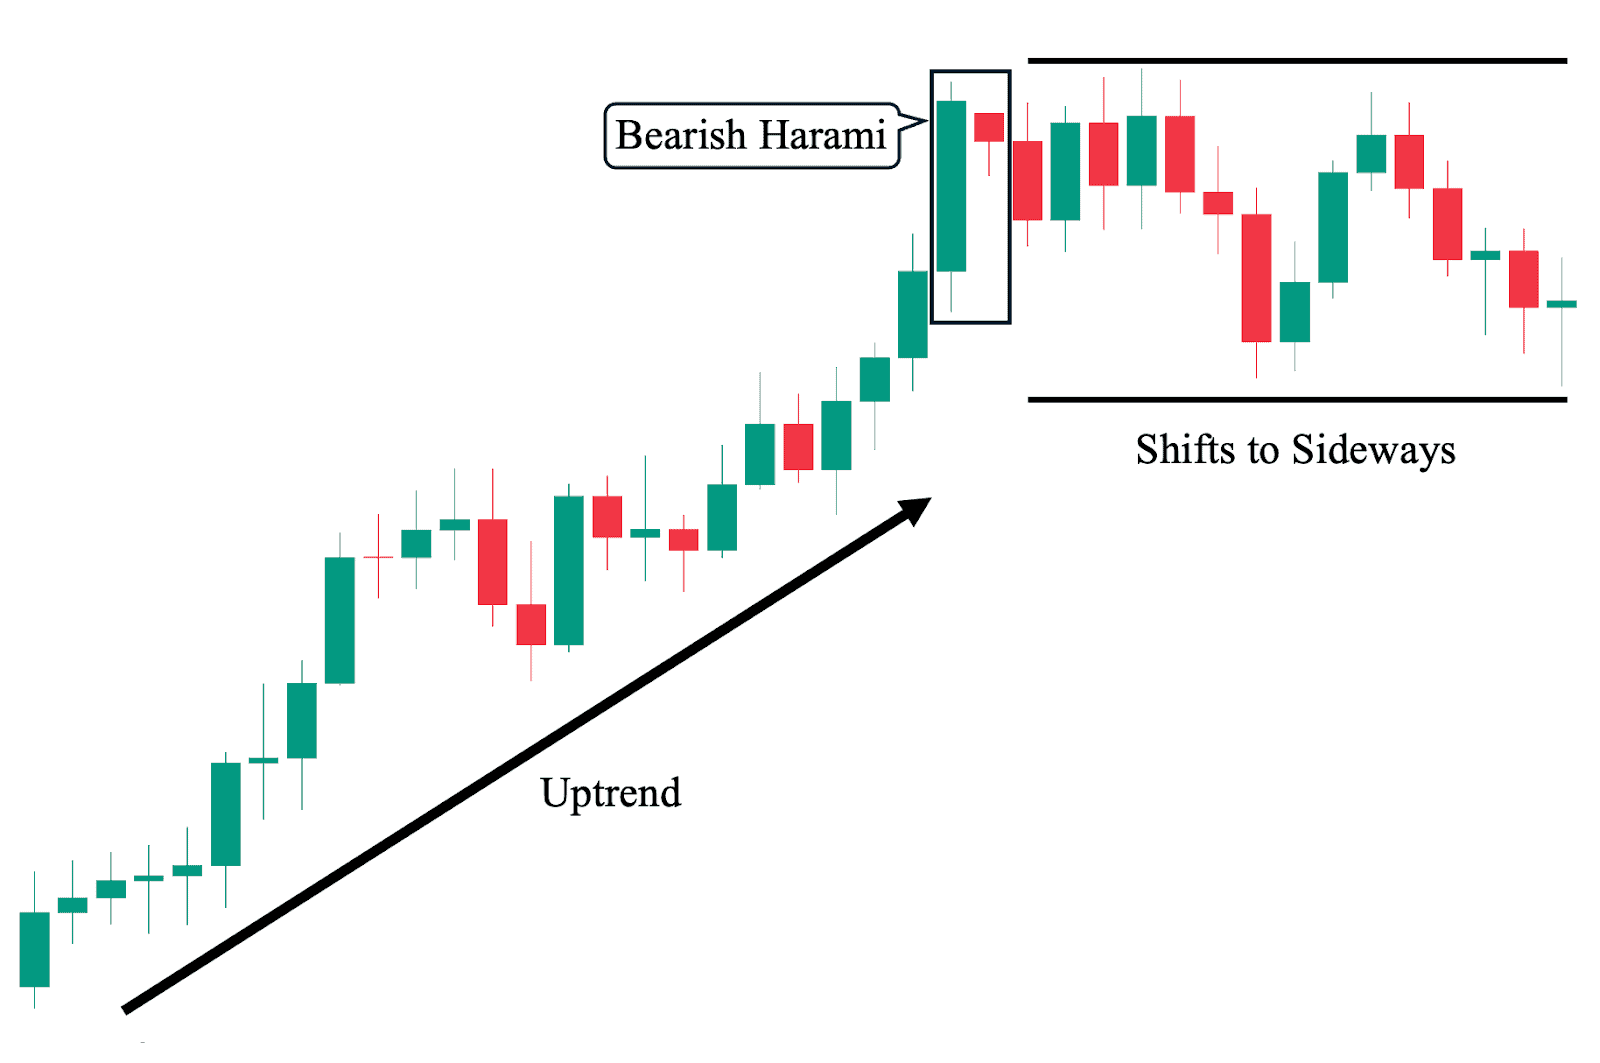
Finally, and the least straightforward, another potential outcome when a bearish harami pattern forms is a shift from a bullish trend to an indecisive, sideways movement—as opposed to either a successful trend reversal toward a downtrend or a failed reversal attempt leading to the continuation of the previous uptrend. To illustrate, we can observe in the chart above an established uptrend before the bearish harami appears. However, after the pattern forms, the price loses momentum and shifts to a non-trending state, bouncing back and forth within a defined consolidation channel.
Bearish Harami Pattern Trading Strategies
Here are different ways you can incorporate a bearish harami candlestick pattern with various technical analysis tools in your trading approach:
Retracement On Naked Charts
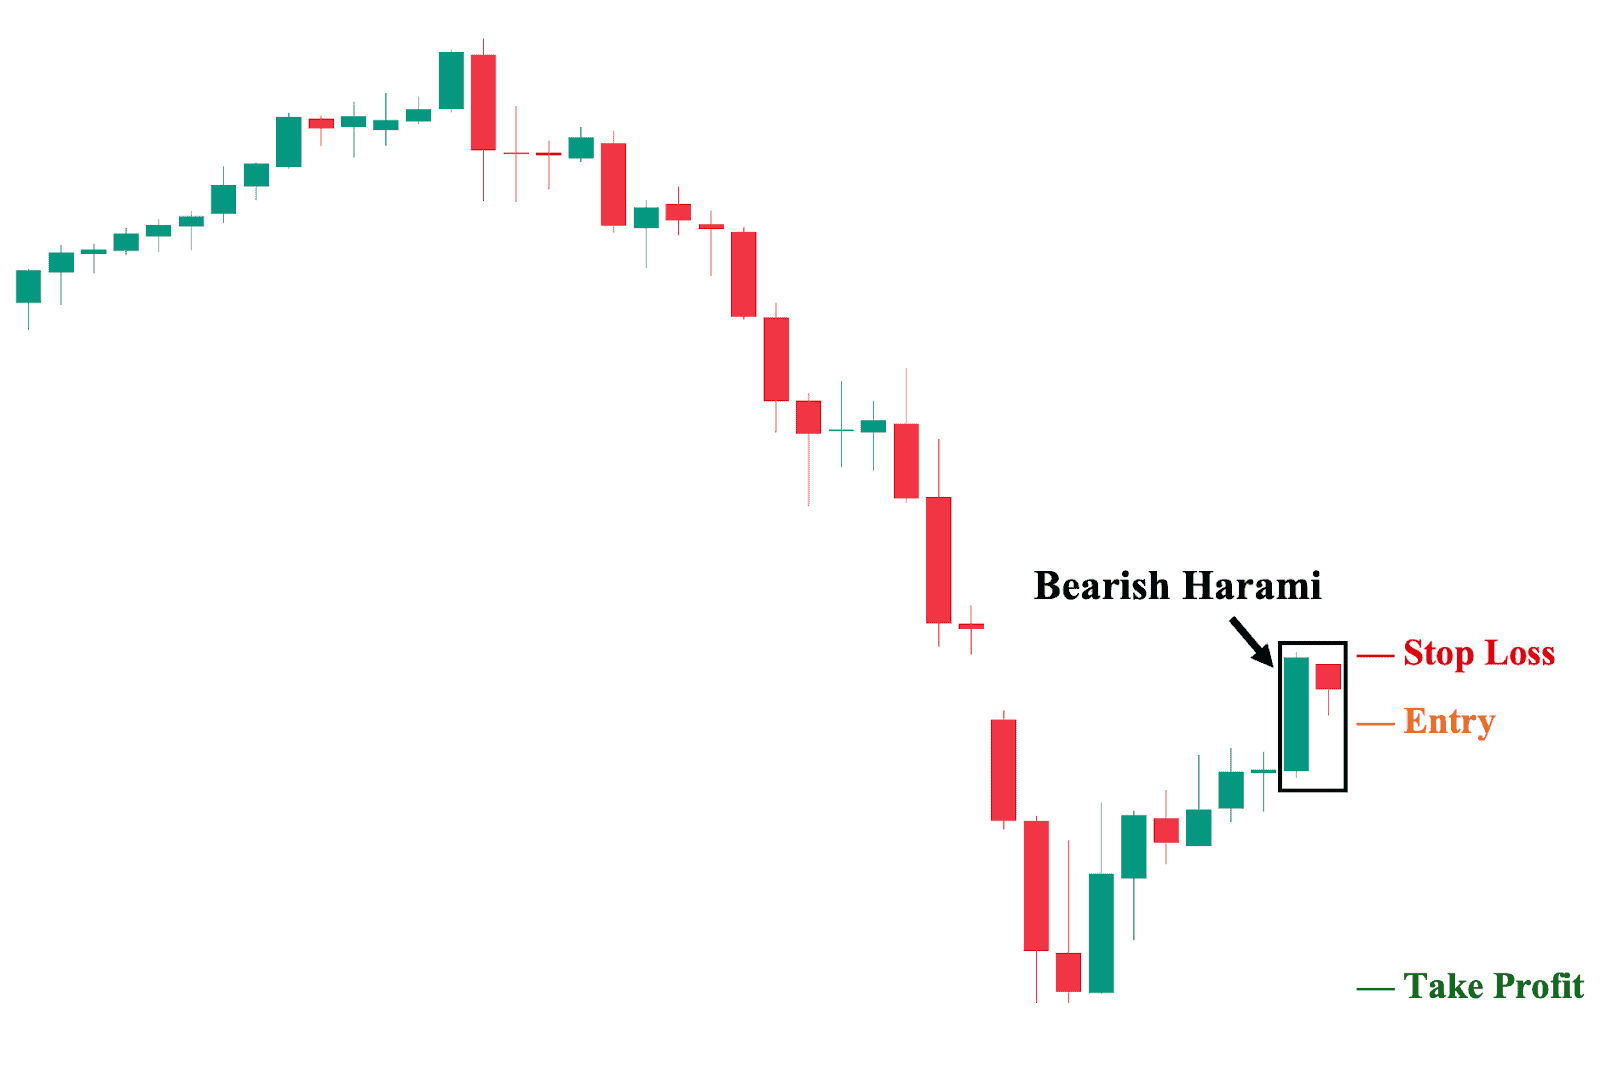
First and simplest, we can trade the bearish harami candlestick pattern on a bare candlestick chart, relying purely on price action without any supplemental technical analysis tools or other technical indicators. To illustrate, we can observe a bearish harami pattern appearing during a retracement phase of an ongoing downtrend. Based on this information, we can decide to take a short position if we believe that the price will likely resume its downward momentum. As you can imagine, it is difficult to judge whether this is a valid trade without some form of confirmation and consideration of the broader market context.
1. Entry Point: A few ticks below the low of the second harami candle.
2. Stop Loss Point: Set your stop loss a few ticks above the high of the second harami candle.
3. Take Profit (TP) Level: Set your TP a few ticks above the nearest key structural support level. In this case, the previous low of the downtrend.
4. Risk-Reward Ratio: The risk/reward ratio must be at least 1:1. We do not recommend taking trades with a ratio below this in any trading situation. The higher the potential reward relative to the risk, the better. However, ensure you use an objective approach when setting your TP and SL levels rather than inflating them artificially.
Trading The Bearish Harami at Key Resistance Levels
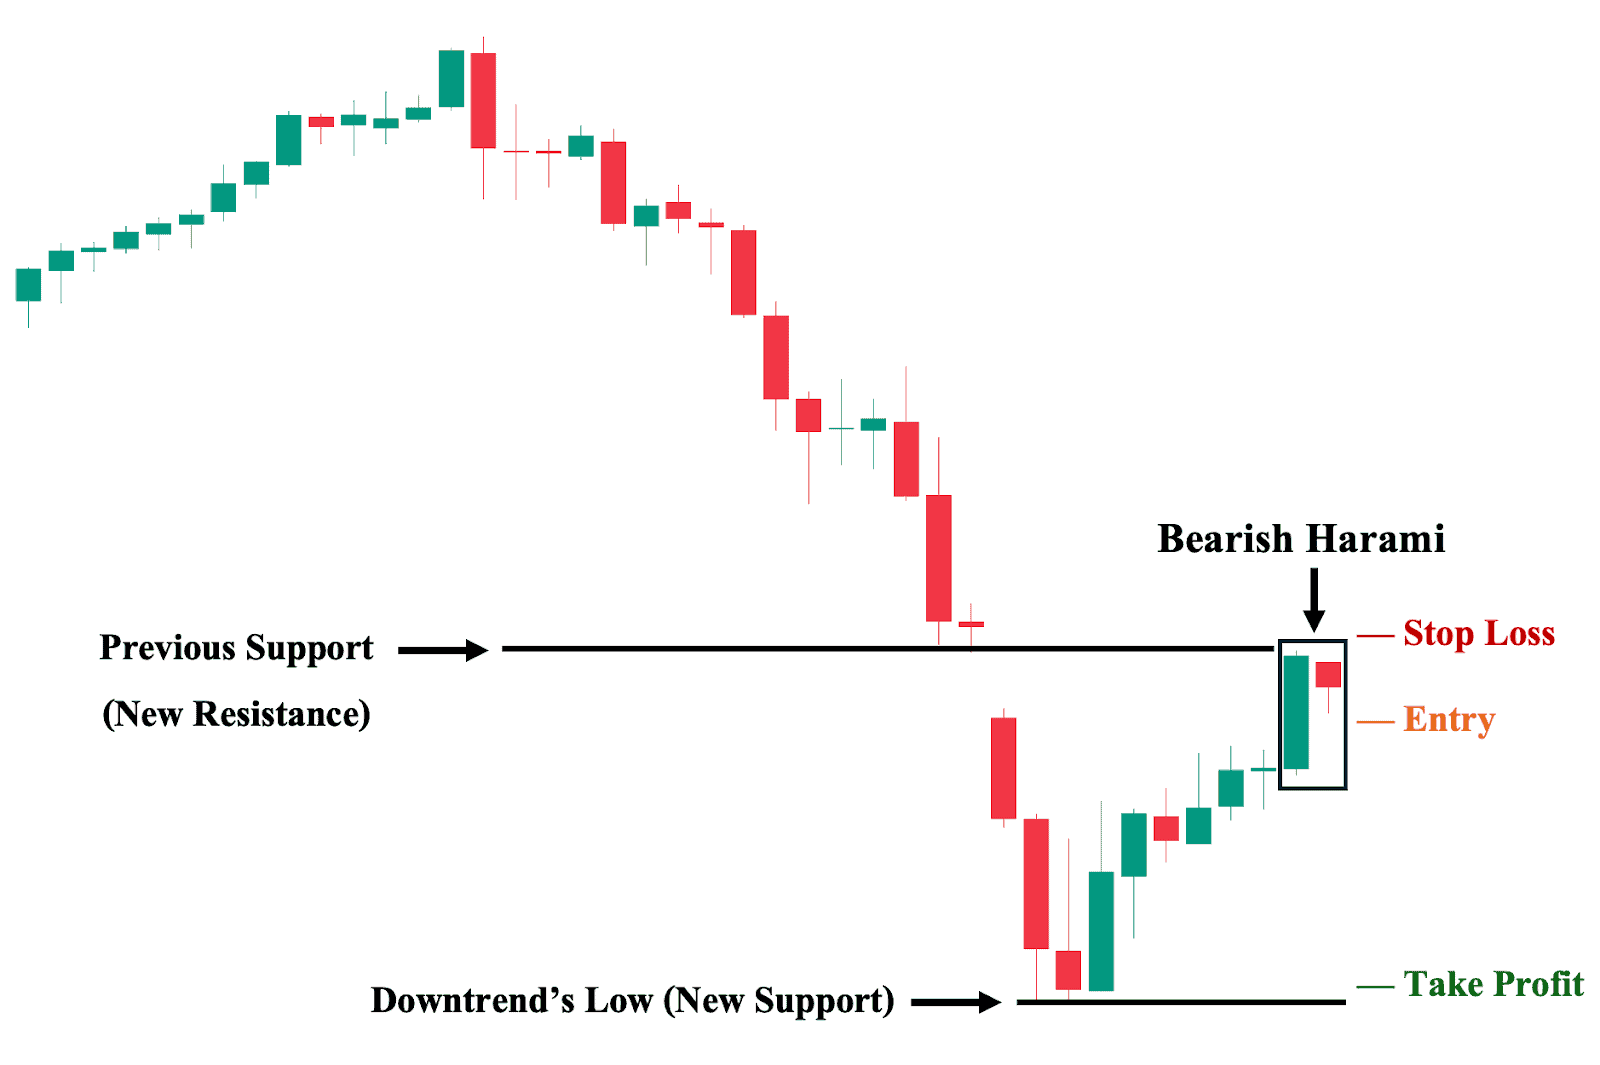
In this second trading approach, we take a look at the same trade setup and incorporate a fundamental price action technique of identifying key levels (i.e., structural support and resistance levels). As shown, traders can consider the previously broken support level as the nearest potential resistance level, where we can set our stop loss (since breaking this will likely lead to a price rally). Additionally, we can set the downtrend’s previous low as the nearest support level, where we can set our ‘take profit’ area, as there is a significant likelihood that the price will, at the very least, react from this level.
1. Entry Point: A few ticks below the low of the second harami candle.
2. Stop Loss Point: Set your stop loss a few ticks above the nearest resistance level.
3. Take Profit (TP) Level: Set your TP a few ticks above the nearest key structural support level. In this case, the previous low of the downtrend.
4. Risk-Reward Ratio: The risk/reward ratio must be at least 1:1.
Trading The Bearish Harami Pattern with Relative Strength Index (RSI) Indicator
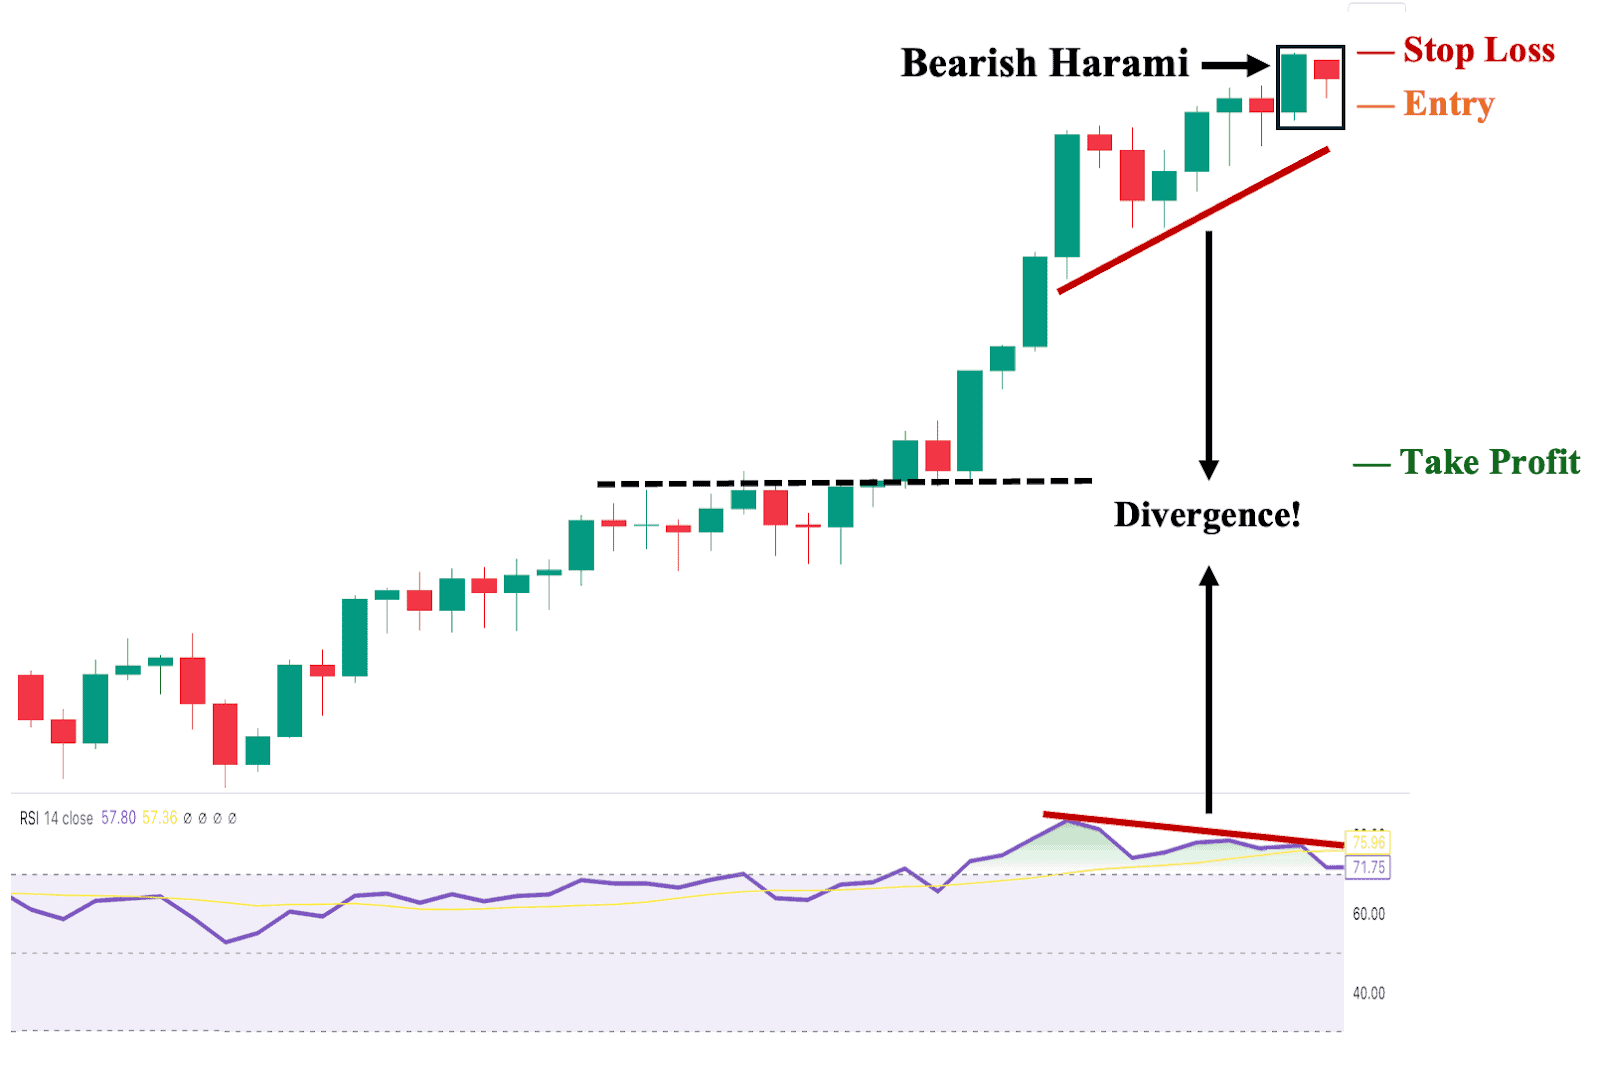
Third, you can use the Relative Strength Index as supporting evidence of a potential reversal. This can be done by looking for a divergence between price action and RSI. As shown, despite the sustained uptrend, with higher highs and higher lows, we can observe a sloping down RSI. This constitutes a divergence, as in this scenario, RSI is indicating that the ongoing uptrend is likely losing steam. Hence, we can have a higher level of confidence that the bearish harami pattern may very well serve as the catalyst for a trend shift toward a downtrend.
1. Entry Point: A few ticks below the low of the second harami candle.
2. Stop Loss Point: Set your stop loss a few ticks above the high of the second harami candle.
3. Take Profit (TP) Level: Set your TP a few ticks above the nearest potential key structural support level.
4. Trailing Stop: Sell if price and RSI diverge once again (the price is still going down when RSI starts to point upwards).
5. Risk-Reward Ratio: The risk/reward ratio must be at least 1:1.
Trading The Bearish Harami Pattern with Stochastic Oscillator (STS)
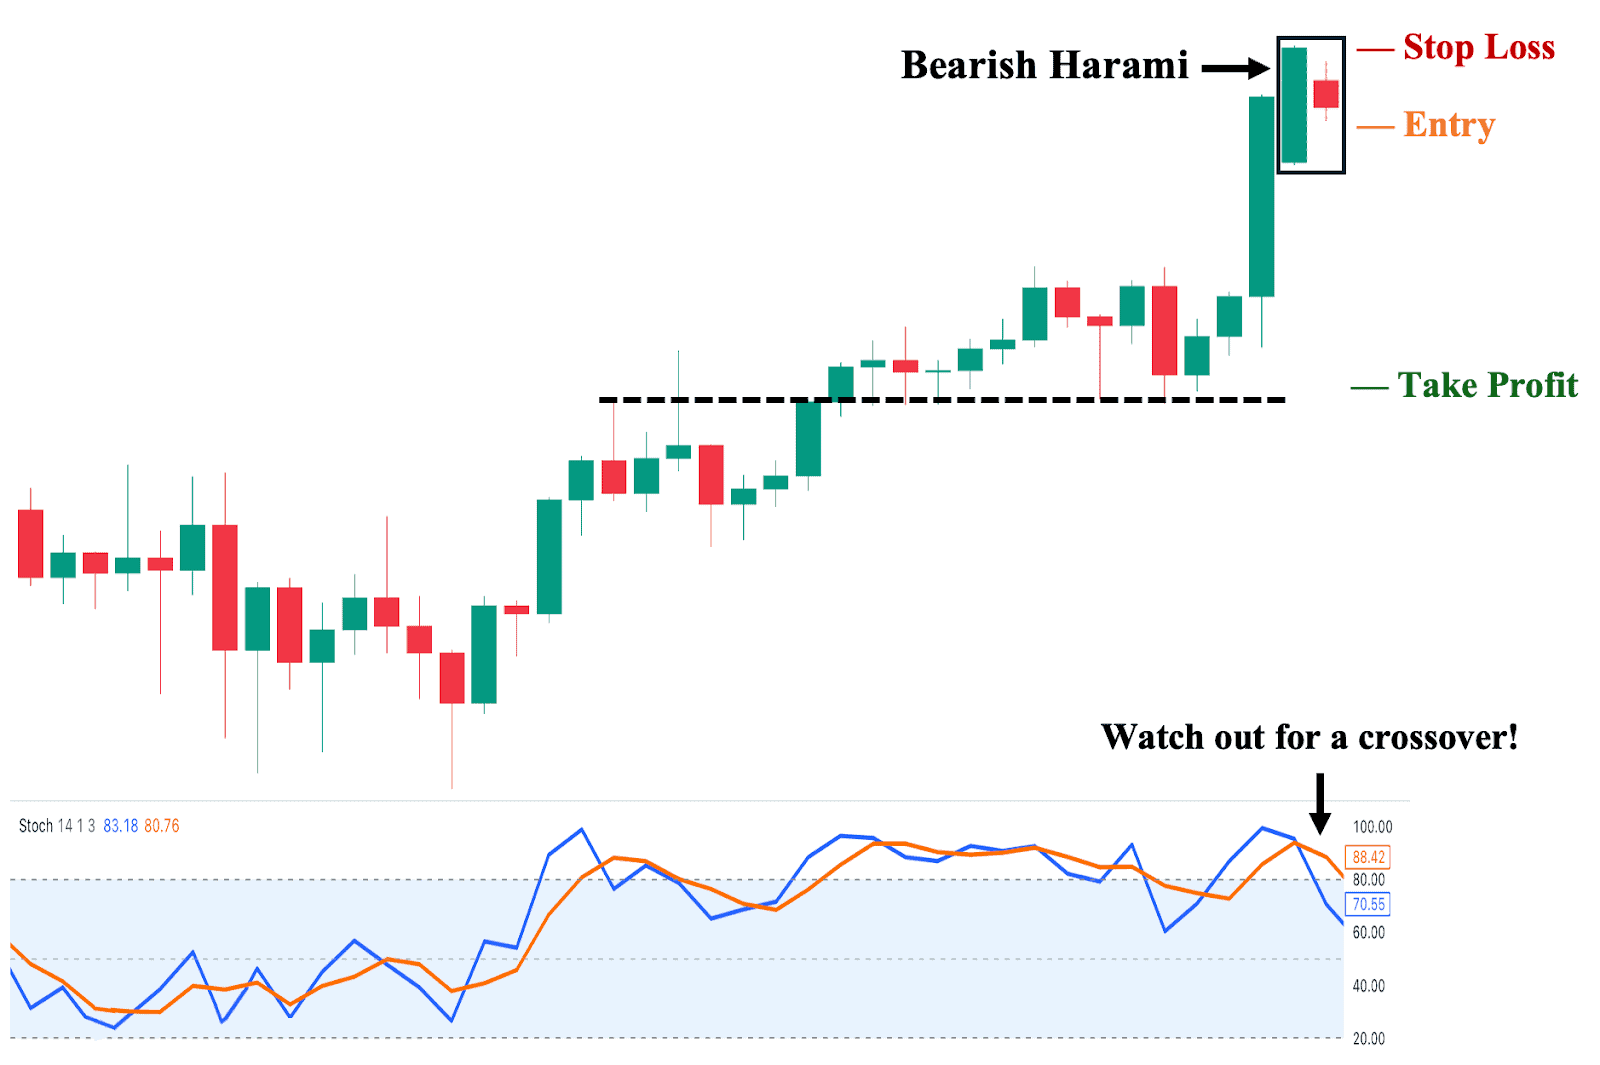
Fourth, you can use Stochastic (and, by extension, Moving Average Convergence Divergence or MACD) as a confirmation tool when a bearish harami pattern appears. In this trade example, we can see an established uptrend preceding the formation of the bearish harami. From here, we can use the Stochastic to add another layer of confirmation for a potential trend reversal. This is done by looking at the positions of the STS’s two moving averages. Ideally, you want the Signal (orange) line to be above the Fast (blue) line—like in the chart above—to help confirm the bearish signal before taking a short position.
1. Entry Point: A few ticks below the low of the second harami candle.
2. Stop Loss Point: Set your stop loss a few ticks above the high of the second harami candle.
3. Take Profit (TP) Level: Set your TP a few ticks above the nearest potential key structural support level.
4. Trailing Stop: Sell if the blue line crosses above the orange line before hitting your TP.
5. Risk-Reward Ratio: The risk/reward ratio must be at least 1:1.
Trading The Bearish Harami Pattern with Bollinger Bands®
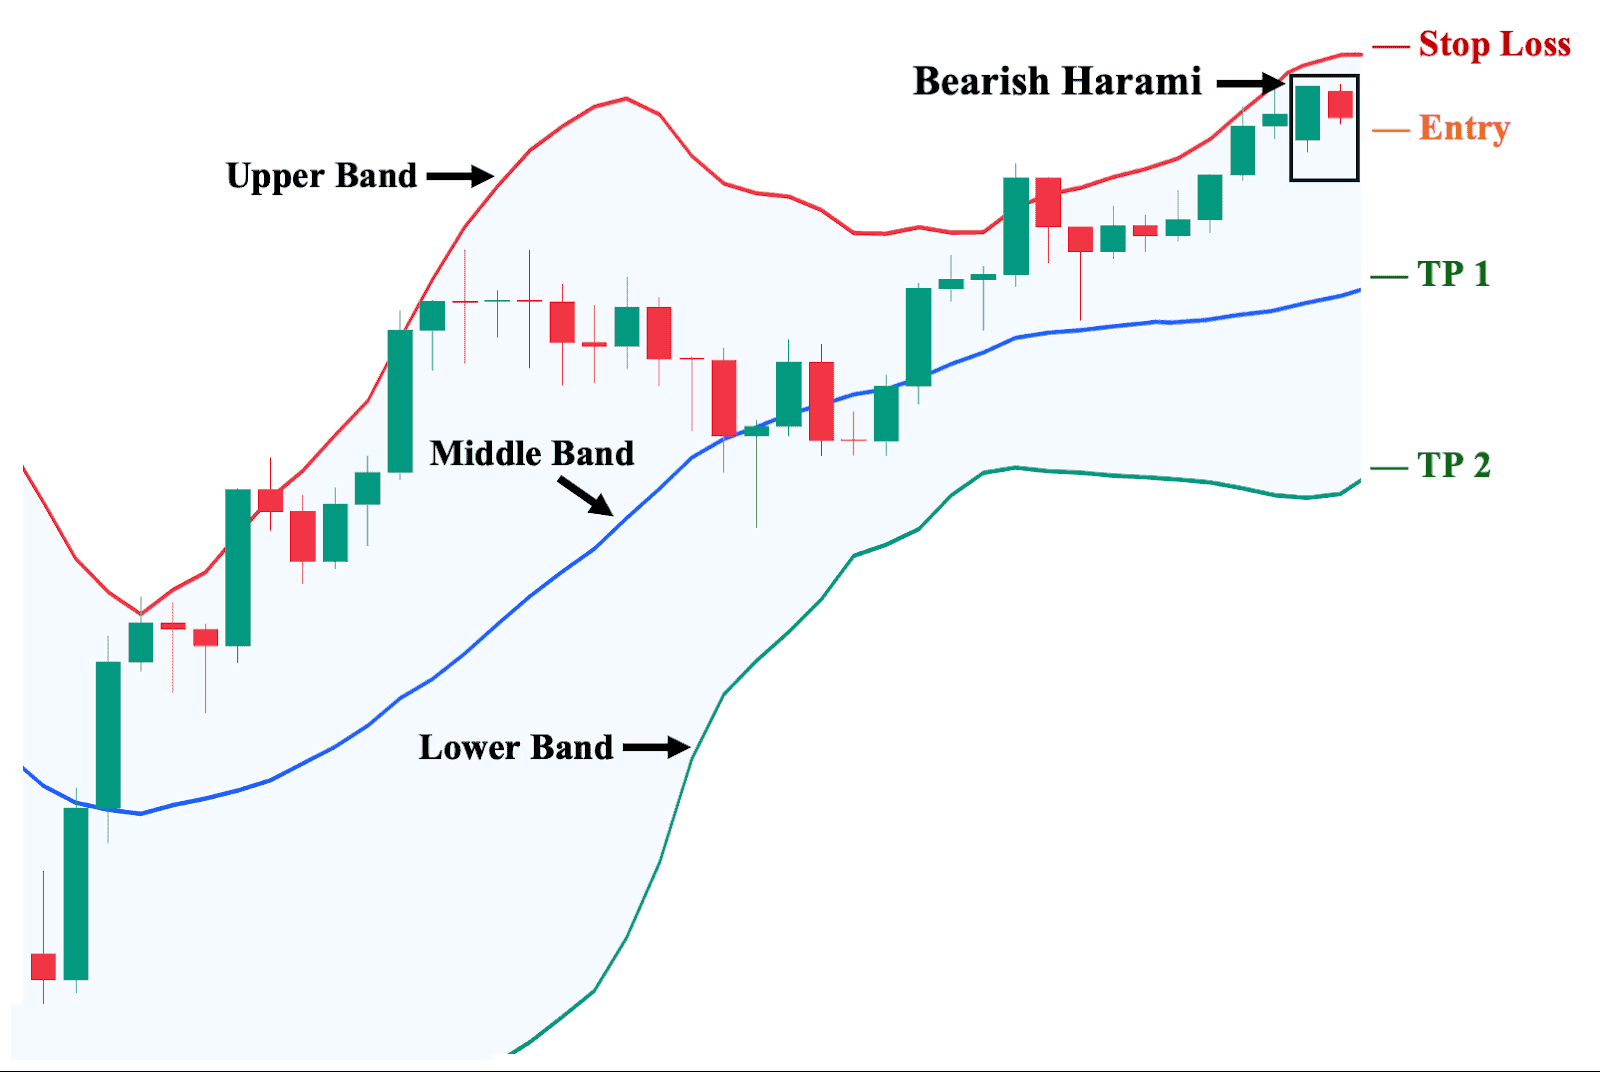
Fifth, compared to other technical indicators, Bollinger Bands is perhaps one of the most holistic and versatile technical tools traders can use. In this trade example, we can see how they can be used to track the trend—the price is in an uptrend if it is trading primarily between the upper and middle bands, and in a downtrend if it is trading mostly between the middle and lower bands. Additionally, when the price is trading near any one of these bands, it suggests that the price will likely bounce back, providing moving support and resistance levels. Finally, you can use these bands to set your key trading levels, such as your TP areas.
As shown, the bearish harami appears close to the upper band, suggesting that the price will likely move downwards, confirming the possibility of a reversal to the downside. We can then take a short position and decide to sell in tranches around the middle and lower band levels.
1. Entry Point: A few ticks below the low of the second harami candle.
2. Stop Loss Point: Set your stop loss a few ticks above the Upper Band line.
3. Take Profit (TP) Level: Set your first TP a few ticks above the middle band (blue) line and your second TP a few ticks above the lower band (green) line.
4. Trailing Stop: Sell if the price closes above the upper band (red) line before hitting your TP.
5. Risk-Reward Ratio: The risk/reward ratio must be at least 1:1.
Trading The Bearish Harami With Moving Averages (MAs)
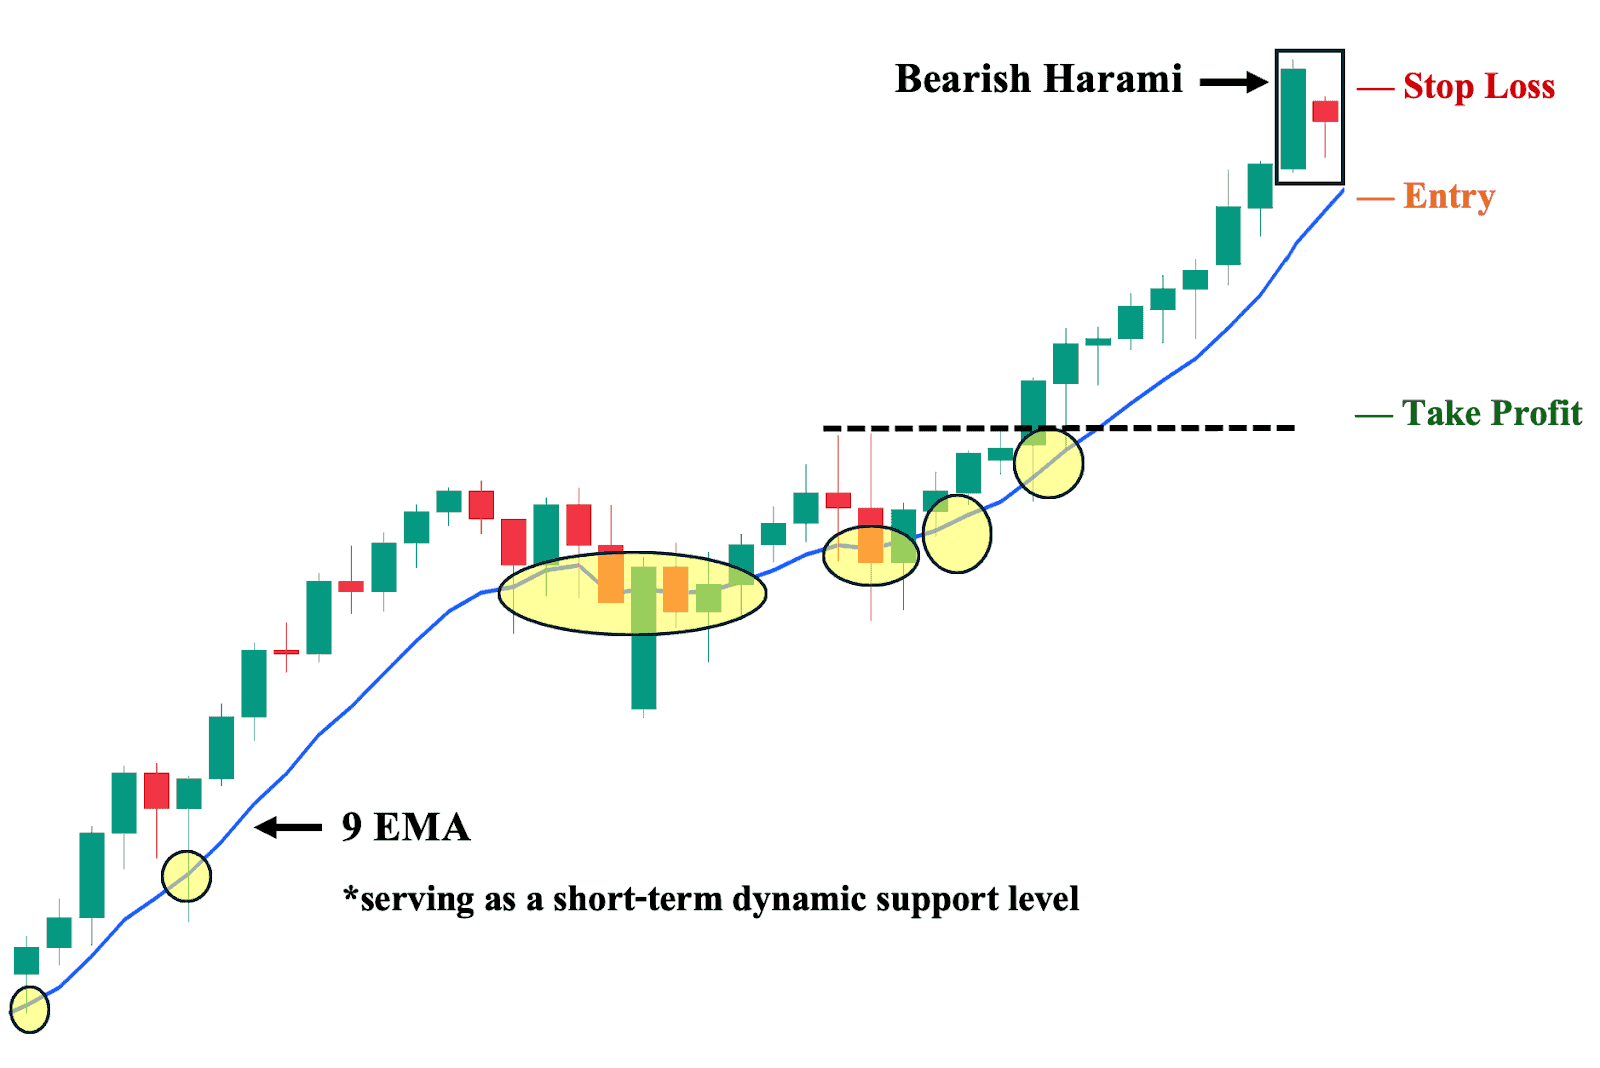
Sixth, one of the most well-known technical analysis tools, Moving Averages, can be used when a bearish harami pattern appears on the price chart. In this trade example, we use a short-term momentum-based MA, the 9-day Exponential Moving Average (9 EMA), to act as our dynamic support level.
We can then observe how the 9 EMA supports the strong upward price trend (as highlighted in yellow), proving its reliability for this trade. Furthermore, we can see that the asset’s closing prices never closed twice in a row below this line. Hence, before taking a short position, the price must first close below the 9 EMA (twice in a row if your trading approach is conservative) to confirm a potential reversal brought by the pattern.
1. Entry Point: A few ticks below the 9 EMA (the price must close below this dynamic support level first).
2. Stop Loss Point: Set your stop loss a few ticks above the high of the second harami candle.
3. Take Profit (TP) Level: Set your TP a few ticks above the nearest potential key structural support level.
4. Trailing Stop: Once in the trade, sell if the price closes above the 9 EMA before reaching your TP, as this signifies a likely renewed bullish momentum.
5. Risk-Reward Ratio: The risk/reward ratio must be at least 1:1.
Trading The Bearish Harami Pattern with Fibonacci Retracements
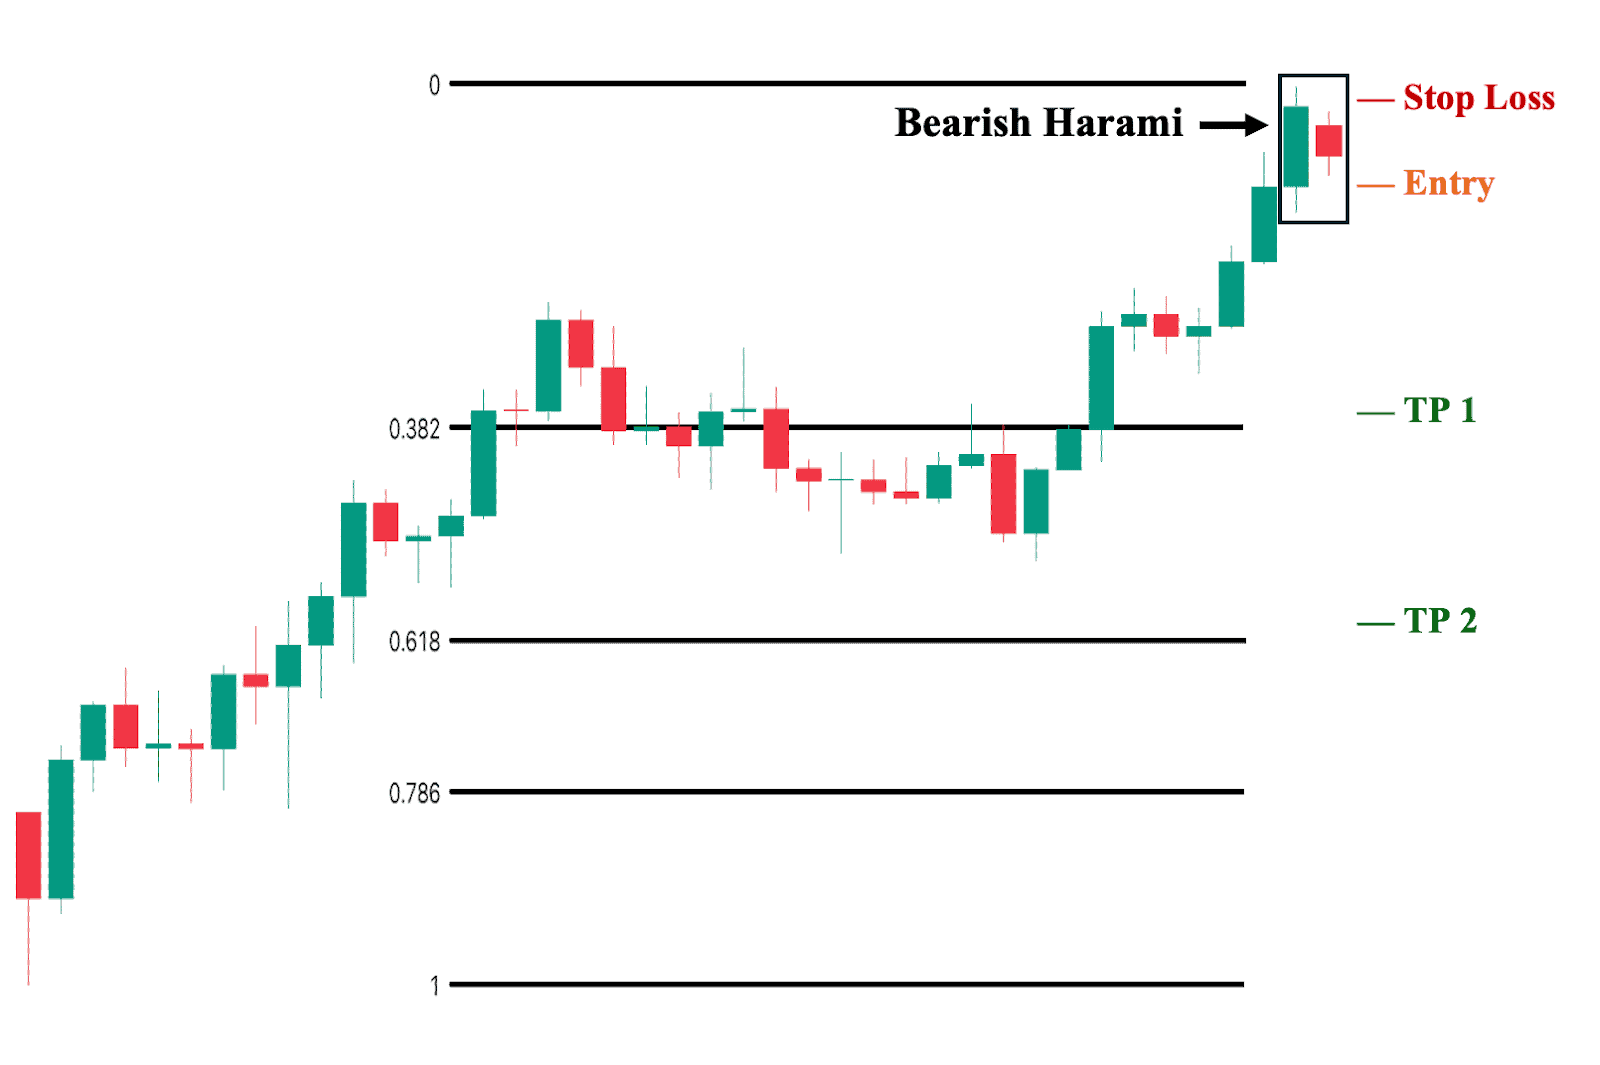
Seventh, compared to other technical indicators, Fibonacci (Fib) is primarily used to identify key levels where price may likely have difficulty breaking after the bearish harami materializes as a reversal pattern. Hence, it is extremely useful in setting your TP areas once you decide to enter a trade. In this example, we can observe an uptrend before the bearish harami appears. If you then decide to take a short position, you can simultaneously place your TP areas around key Fib levels and sell in tranches.
1. Entry Point: A few ticks below the low of the second harami candle.
2. Stop Loss Point: Set your stop loss a few ticks above the high of the second harami candle.
3. Take Profit (TP) Level: If your strategy involves selling in tranches, you can set your first TP a few ticks above the nearest Fib level (0.382) and your second TP a few ticks above the next Fib level (0.618).
4. Risk-Reward Ratio: The risk/reward ratio must be at least 1:1.
Trading The Bearish Harami With Pivot Points
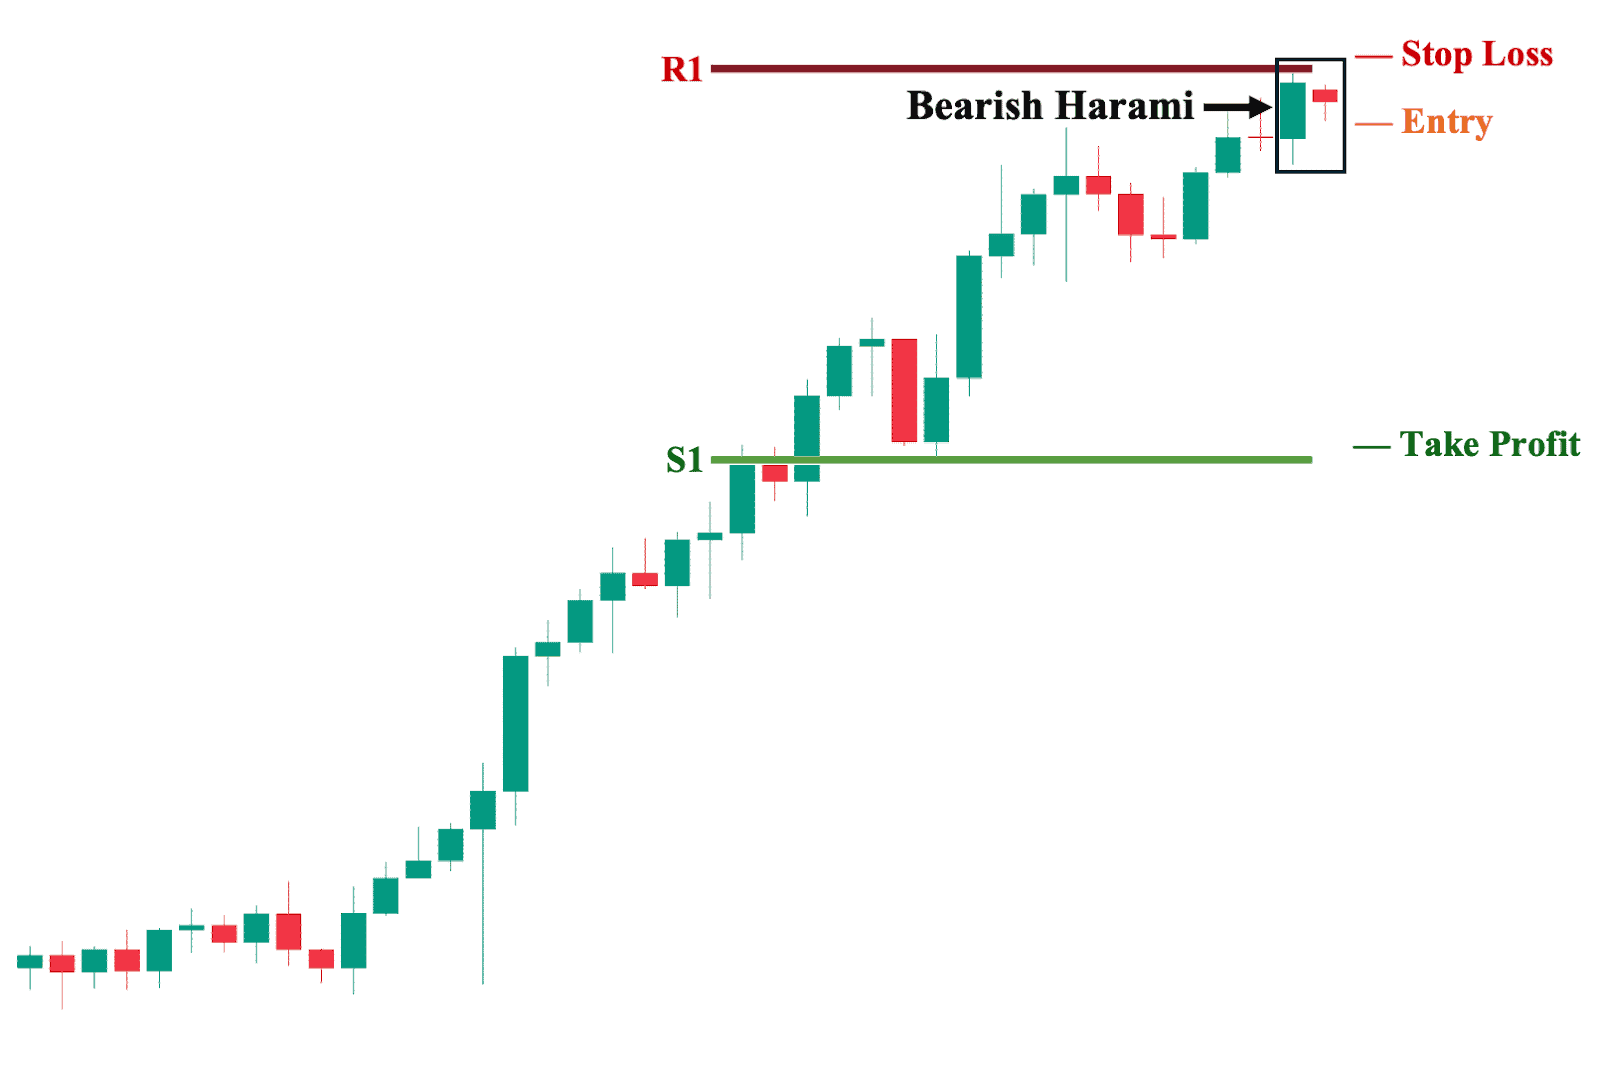
Eighth, as a technical analysis tool, we can use Pivot Points to automatically identify potential key levels to watch out for. In this trade example, we observe an uptrend preceding the appearance of a bearish harami pattern. By generating pivot points, we can identify the nearest suggested support levels (S1, S2, etc.) and resistance levels (R1, R2, etc.). We can then use these key levels to plan a potential short position—setting our stop loss around the first resistance level (R1) and our TP around the first support level (S1).
1. Entry Point: A few ticks below the low of the second harami candle.
2. Stop Loss Point: Set your stop loss a few ticks above the R1 level.
3. Take Profit (TP) Level: Set your TP a few ticks above the S1 level.
4. Risk-Reward Ratio: The risk/reward ratio must be at least 1:1.
Trading The Bearish Harami With Volume Analysis
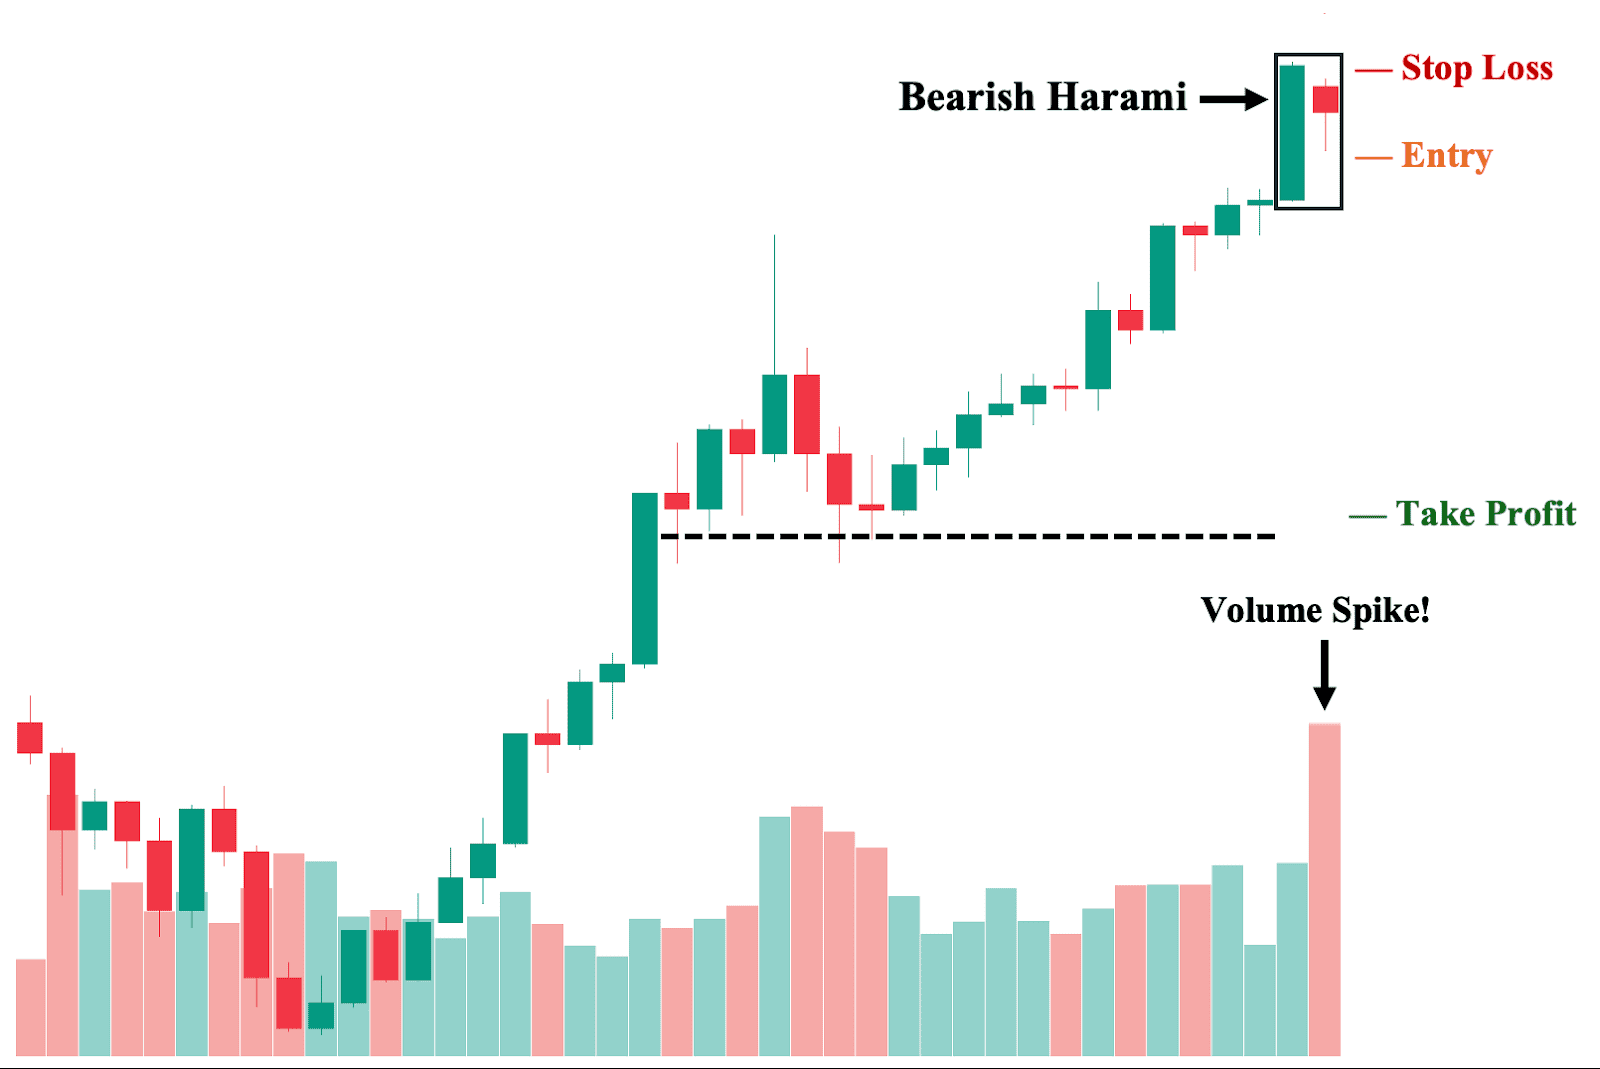
Ninth, like other technical indicators (such as RSI), we can use volume as supporting evidence of a potential reversal. Yet, unlike other technical indicators in this list, volume is the only one completely independent of price action movement. In fact, its value is not derived or based on price at all—it is simply an aggregate value of all trades in a trading session. Hence, this makes it a valuable tool to evaluate a potential reversal.
As a general rule, we want to see above-average volume on the bearish harami’s second candle (the smaller bearish candle contained within the first candle), which is the case in this trade example. This is because the volume spike shows an elevated interest from market participants (i.e., both buyers and sellers) and signals a potential sharp move that may follow due to this significant volume.
1. Entry Point: A few ticks below the low of the second harami candle.
2. Stop Loss Points: Set your stop loss a few ticks above the high of the second harami candle.
3. Take Profit (TP) Level: Set your TP a few ticks above the nearest potential key structural support level.
4. Risk-Reward Ratio: The risk/reward ratio must be at least 1:1.
Trading The Bearish Harami With Average Directional Index (ADX)
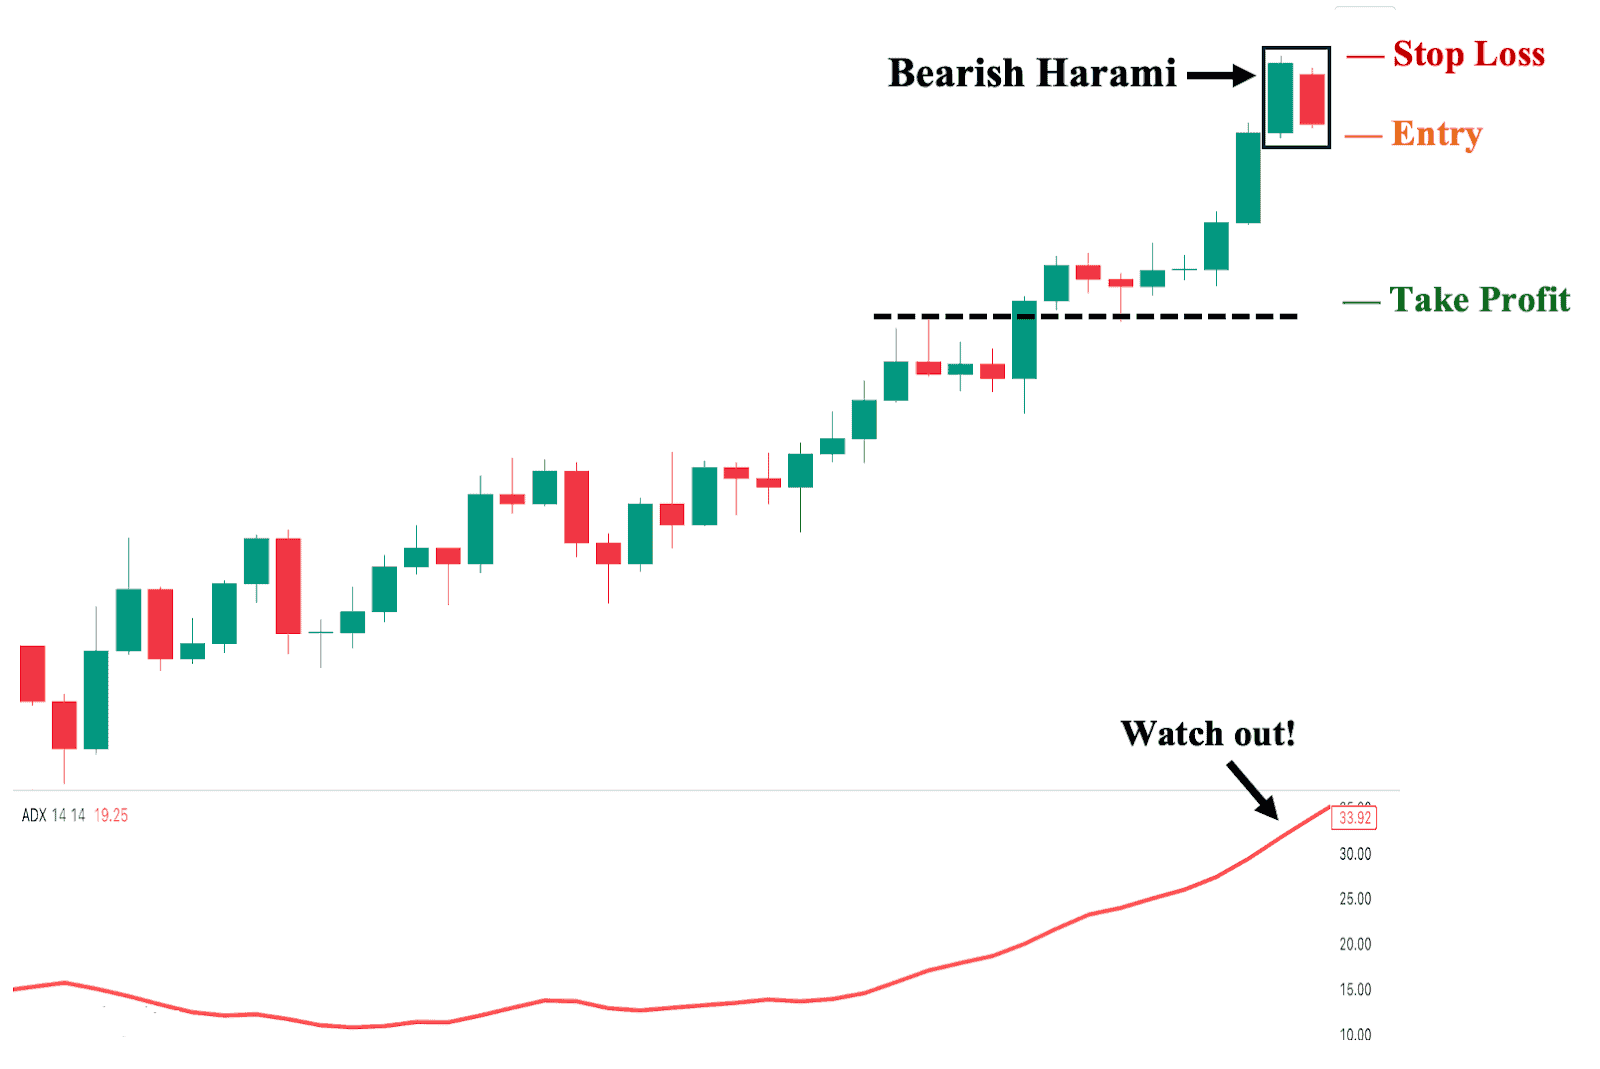
Finally, the Average Directional Index (ADX) is a technical indicator that primarily measures the strength of a trend, regardless of its direction (up or down). While it focuses on assessing the strength of the current trend, it does not specifically identify shifts in market sentiment, such as changes from bullish to bearish momentum or vice versa. However, it can help measure the strength of a potential reversal. For instance, when an asset has an ADX value greater than 30 (like the example above), it indicates a massive market participation. In this context, if the bearish harami successfully leads to a reversal, it will likely be decisive with much bigger moves.
1. Entry Point: A few ticks below the low of the second harami candle.
2. Stop Loss Points: Set your stop loss a few ticks above the high of the second harami candle.
3. Take Profit (TP) Level: Set your TP a few ticks above the nearest potential key structural support level.
4. Risk-Reward Ratio: The risk/reward ratio must be at least 1:1.
Advantages of Trading the Bearish Harami Candlestick Pattern
The following are the key advantages of using bearish harami patterns in your trading approach:
1. Potent on Divergence Plays
First, due to its nature, the bearish harami pattern can be incredibly potent when it coincides with a divergence from momentum-based indicators such as RSI. This happens when the price action makes higher highs while the technical indicator starts to make lower highs and slope downward. This contrast between the price action and the technical indicator displays a weakening bullish momentum and a likely shift in market sentiment. Hence, the pattern’s second (bearish) candle may likely serve as the catalyst for a complete trend shift.
2. Remarkably Effective at Key Psychological Level
Second, the bearish harami pattern can become remarkably effective when it forms near a psychological price level, especially round numbers (e.g., 10, 100, etc.). This is because many market participants place significant weight on these levels and monitor them closely. Hence, when a bearish harami pattern coincides with these levels, it can lead to a higher likelihood of a reversal, as the second (bearish) candle may signal a potential resistance level—particularly if it creates a noticeable gap down in price compared to the first candle and is followed by a volume spike.
3. Useful in Anticipating Gap Fills
Third, the bearish harami can be useful when anticipating gap fills in a trade. This is because when a bearish harami forms right after a price gap, it can suggest that the gap is likely to be filled as bearish momentum suddenly takes over. This often occurs during parabolic moves where buying pressure overwhelms sellers, creating an almost uninterrupted upward price rally. Therefore, the sudden appearance of the bearish harami’s second candle—especially if it creates a significant gap down and being contained within the first candle—indicates that sellers are finally catching up to the demand.
Disadvantages of Trading the Bearish Harami Candlestick Pattern
The following are the notable disadvantages of using the bearish harami candlestick patterns:
1. Frequent False Signals on Lower Timeframes
First, the bearish harami candlestick pattern is prone to giving false signals on timeframes lower than the daily chart. This is especially true for trending assets, where the second bearish candle could simply indicate a momentary pause rather than a full-blown reversal signal. Because of this, the bearish harami is largely considered unreliable on lower timeframes unless supported by other confirmation tools.
2. Confirmation Dependency
Second, as a chart pattern, bearish harami is dependent on confirmation tools to boost its reliability. This is a noticeable contrast to other bearish reversal candlestick patterns, such as the tweezer top, where the candlestick pattern itself can be used decently on its own, provided the market context aligns. For the bearish harami, a confirmation signal—such as an indicator divergence or a volume spike—is essential.
3. Considered a “Subpar” Reversal Pattern
Third, both bullish and bearish harami candlestick patterns are considered subpar or inferior compared to other reversal patterns. This is because the harami patterns lack the “immediate” sign of strength observed in other candlestick patterns, notably the engulfing patterns—where the engulfing pattern’s second candle completely engulfs or covers the first candle, demonstrating a strong shift in market sentiment. Thus, the bearish harami is not the most ideal candlestick pattern for taking short positions, and similarly, its counterpart, the bullish harami pattern, is not the most ideal pattern for taking long positions.
Bearish Harami Pattern vs. Bullish Harami Pattern
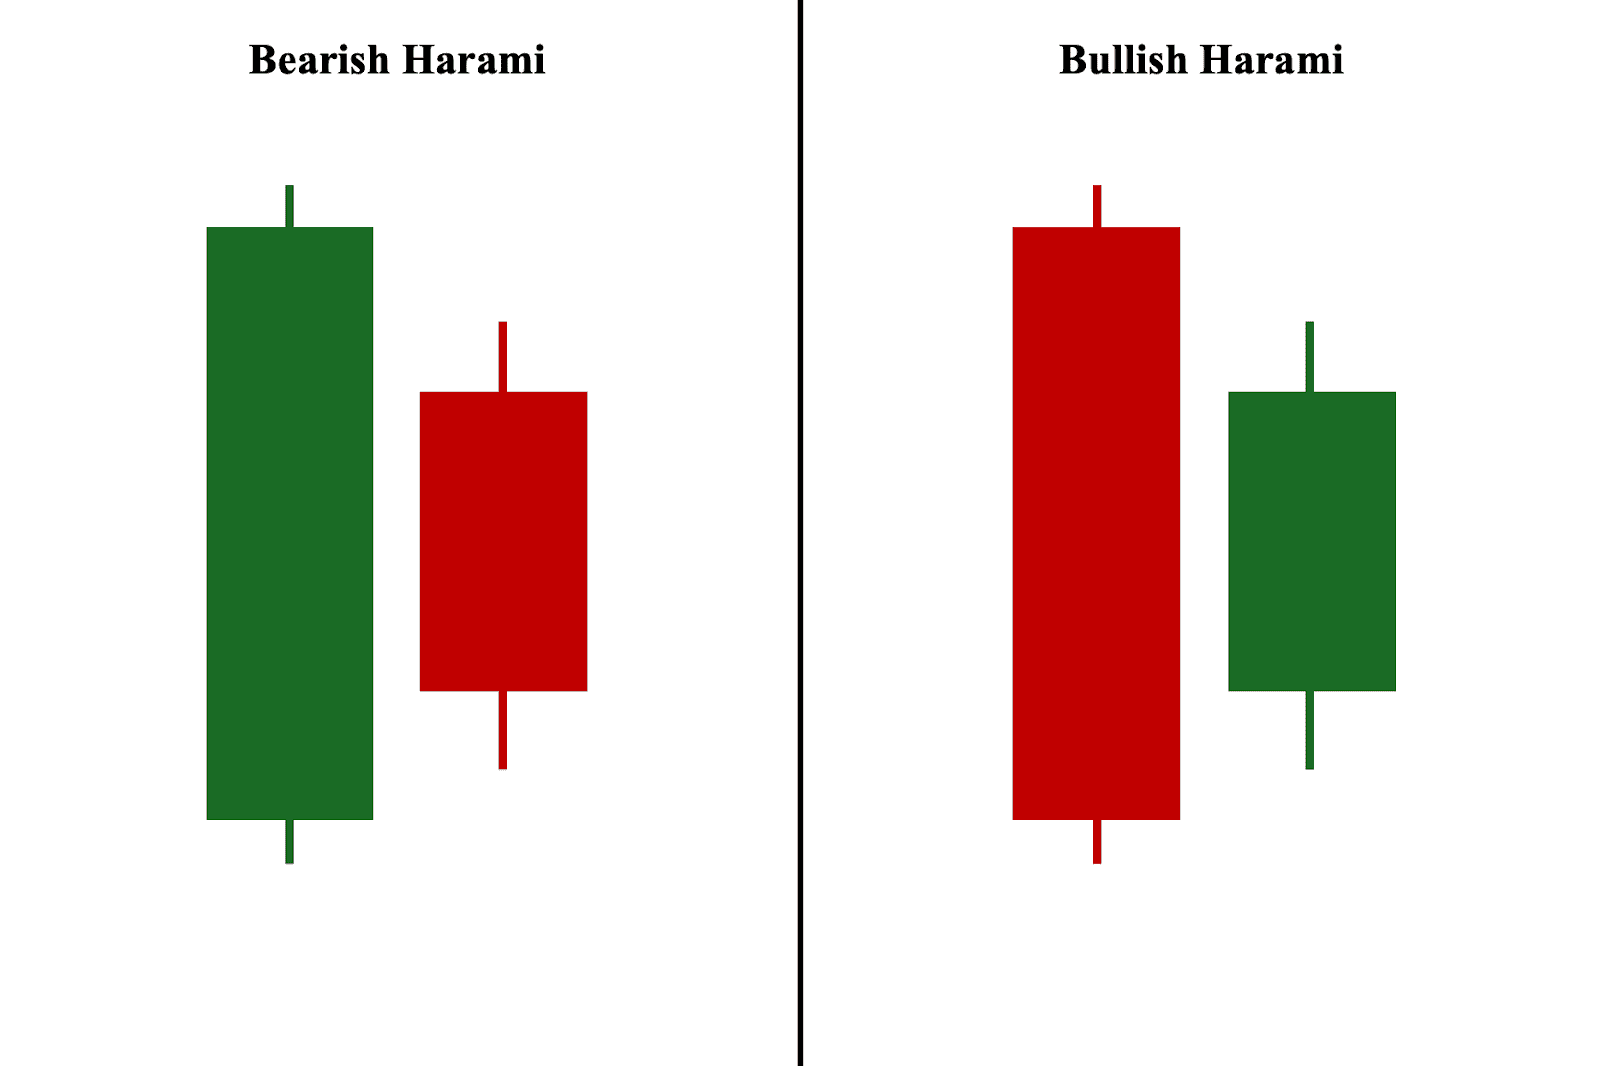
The bullish and bearish harami patterns are both two-candlestick reversal formations that signal a potential shift against the ongoing trend. Compared to the bearish harami, the bullish harami pattern consists of a long-ranged bearish candle followed by a smaller bullish candle and, as its name suggests, is considered a bullish reversal pattern that occurs at the end of a downtrend or during the pullback phase of an uptrend.
Bearish Harami Pattern vs. Bearish Engulfing Pattern
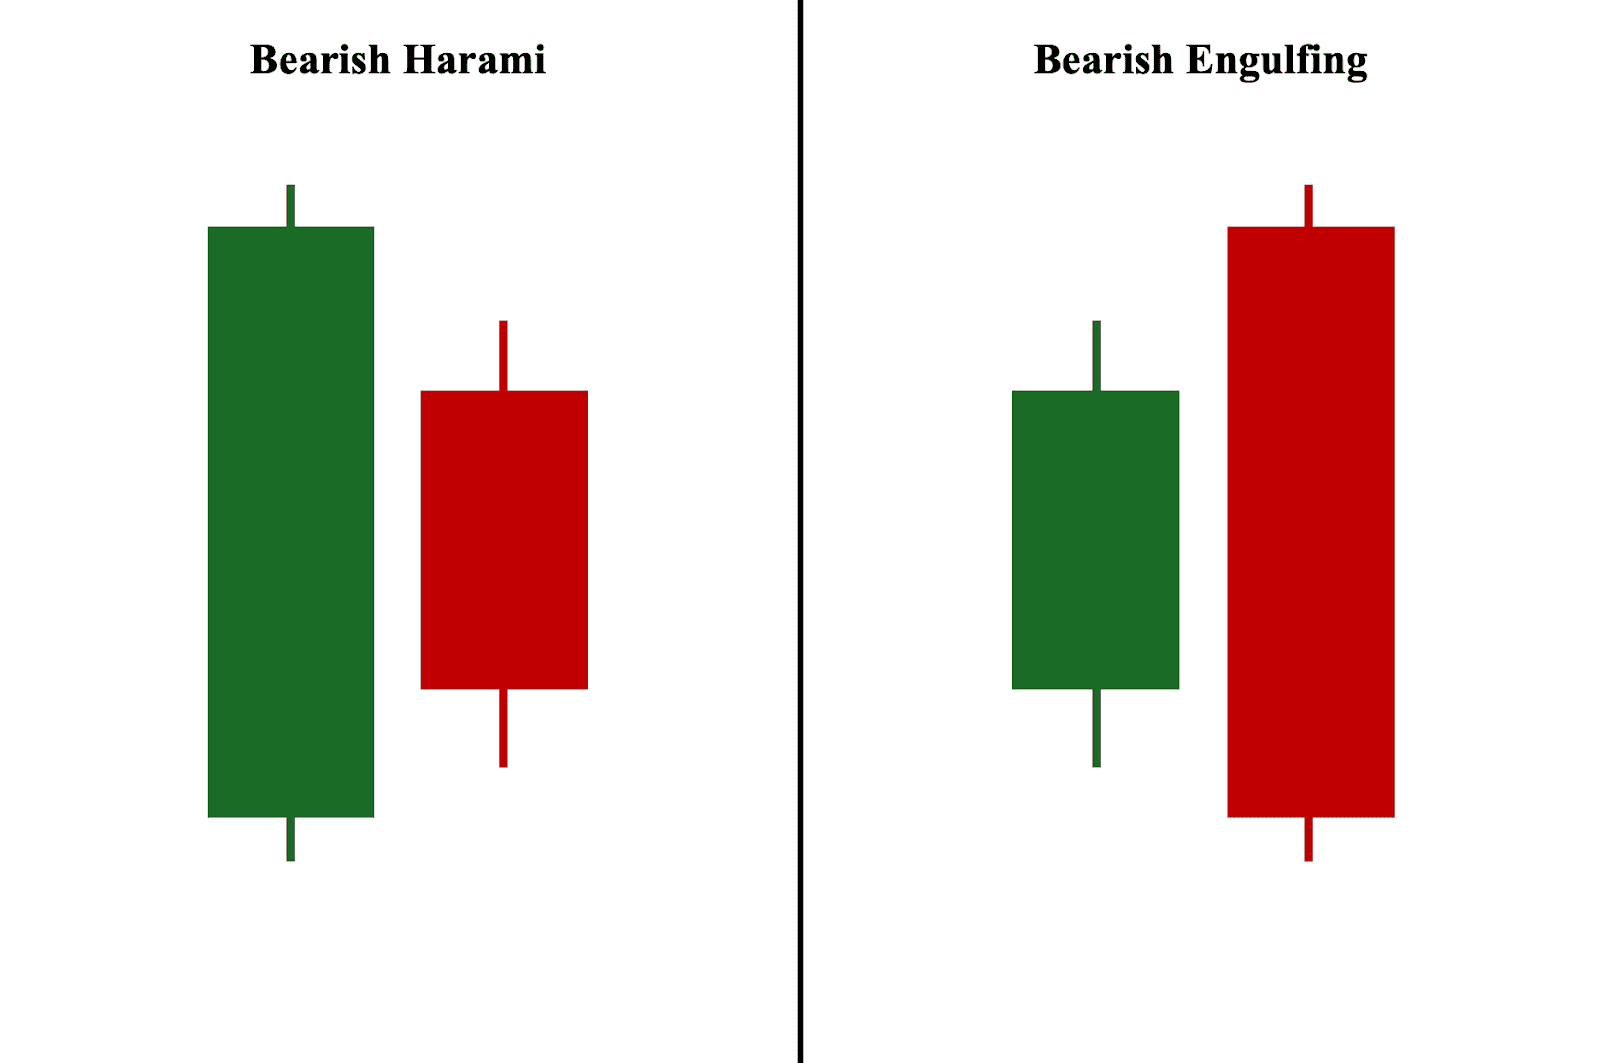
These two patterns are a complete mirror of each other—while the bearish harami involves two candles, with a long-ranged bullish candle as its first candle and a short-ranged bearish candle as its second, the bearish engulfing pattern is formed with a short-ranged bullish candle (first candle) and a long-ranged bearish candle contained within the first candle (second candle). Both the bearish harami and bearish engulfing patterns—as their names suggest—are bearish reversal patterns used to signify a shift in market sentiment from bullish to bearish.
Between the two, the bearish engulfing pattern is widely considered a stronger bearish reversal pattern since the second bearish candle completely engulfs or covers the pattern’s smaller bullish candle.
Bearish Harami vs. Tweezer Top Pattern
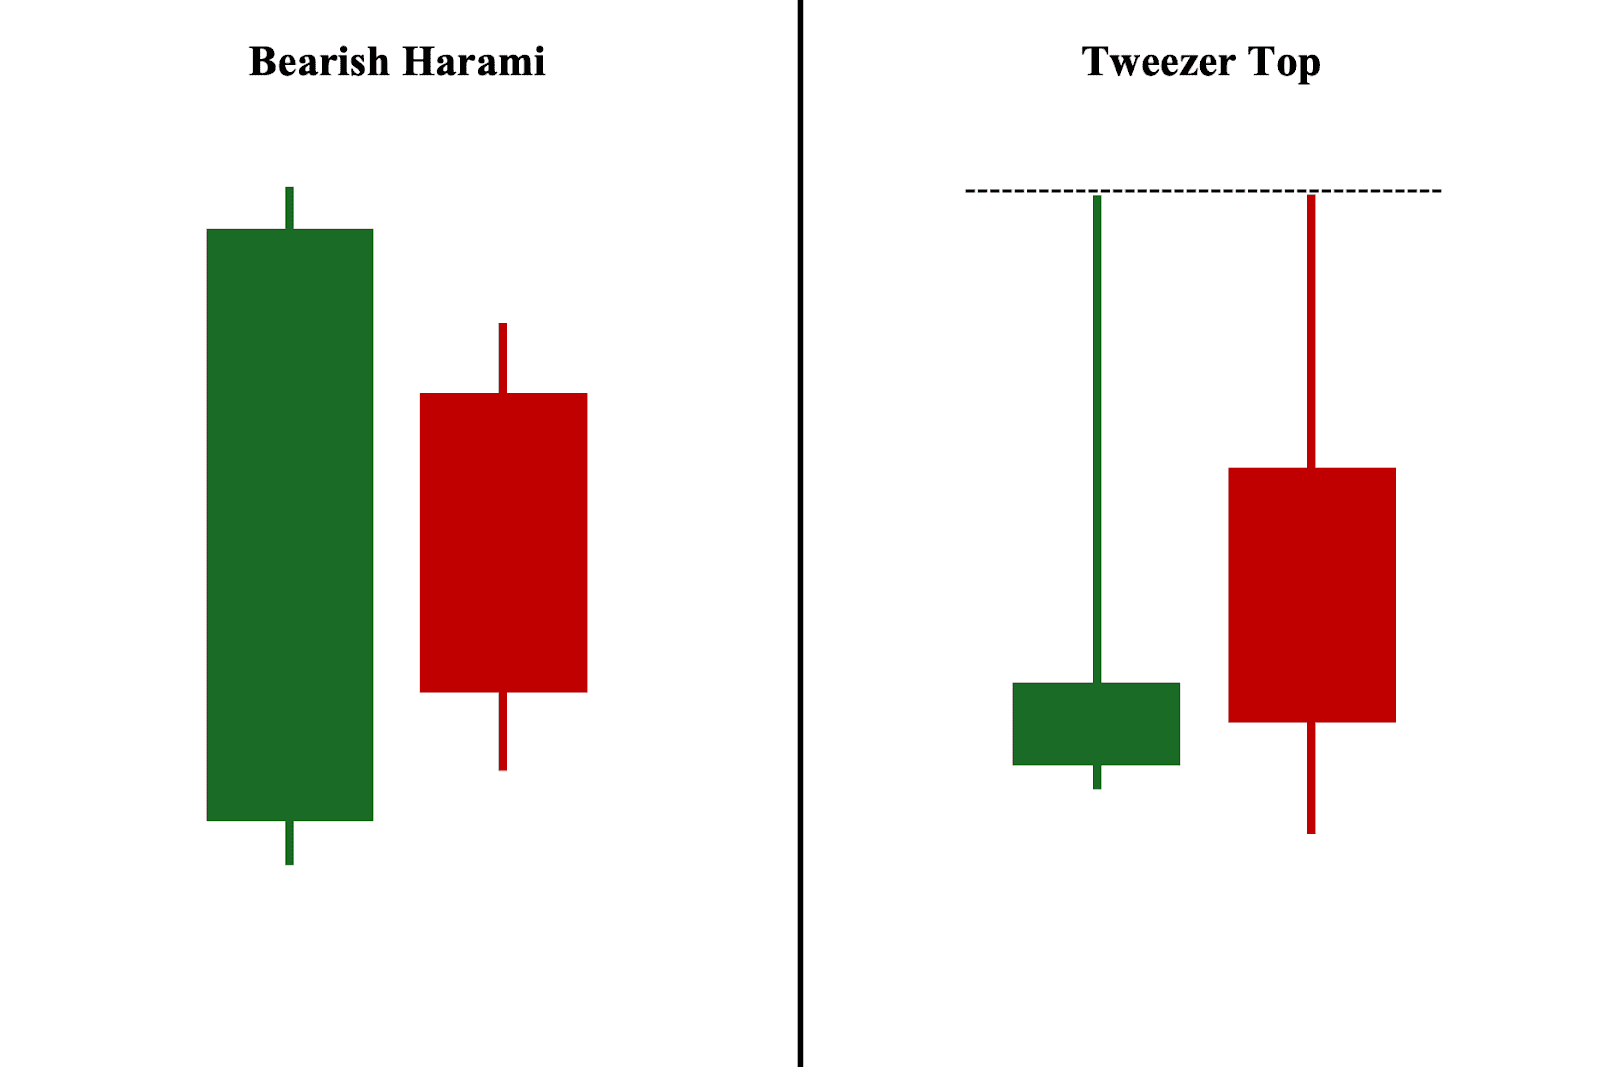
Both the bearish harami and tweezer top formations are used to signal bearish trend reversals. That said, compared to the bearish harami, where the second candle is contained within the first candle, the tweezer top pattern consists of two candles with identical highs, hence the name. Between the two, the tweezer top pattern is considered a stronger bearish reversal pattern, as its two identical or nearly identical highs demonstrate an active rejection of higher prices.
Bearish Harami vs. Inside Bar Pattern
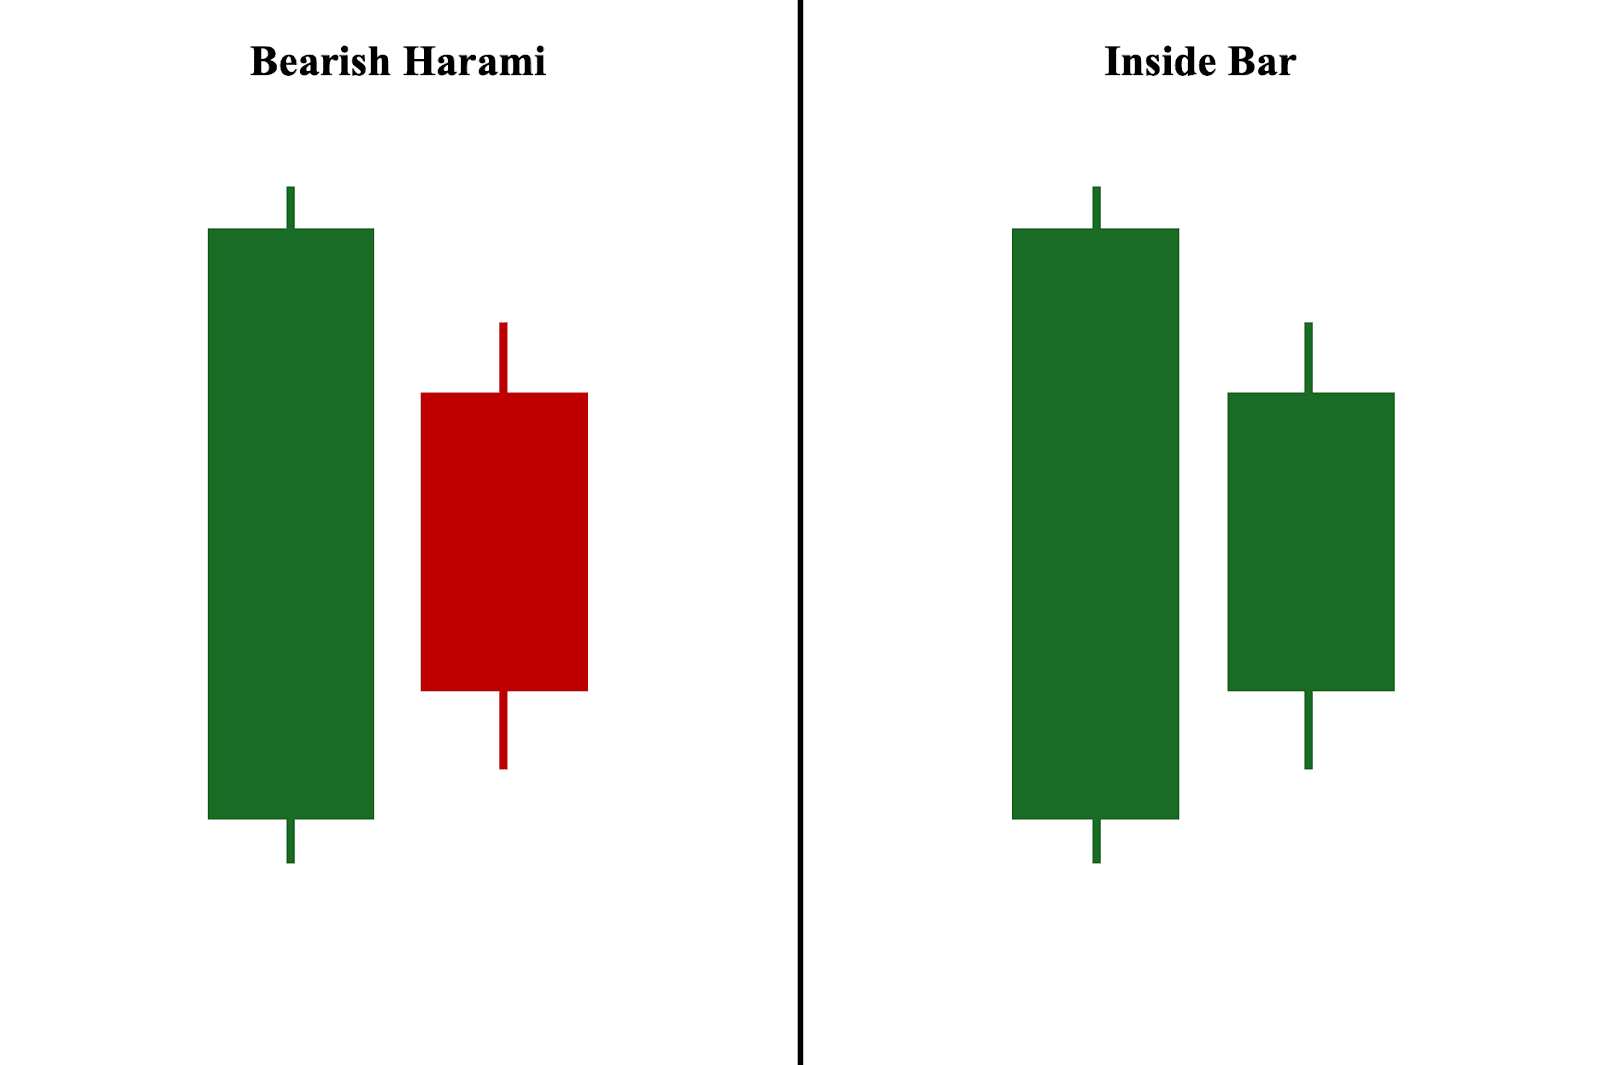
The bearish harami and inside bar formations can look eerily similar or even identical in some scenarios. Yet, there are two differences to take note of. First, while both patterns consist of a long-ranged first candle and a short-ranged second candle, the color of these candles is of secondary importance for the inside bar. This is because what determines its “bullish” or “bearish” nature depends entirely on its position on the chart, not the color of its candlesticks. Second, while harami patterns are considered reversal patterns, inside bars are only considered indecision patterns, where a third (confirmation) candle is needed to verify whether it will serve as a reversal or simply a continuation pattern.
Bearish Harami vs. Dark Cloud Cover Pattern
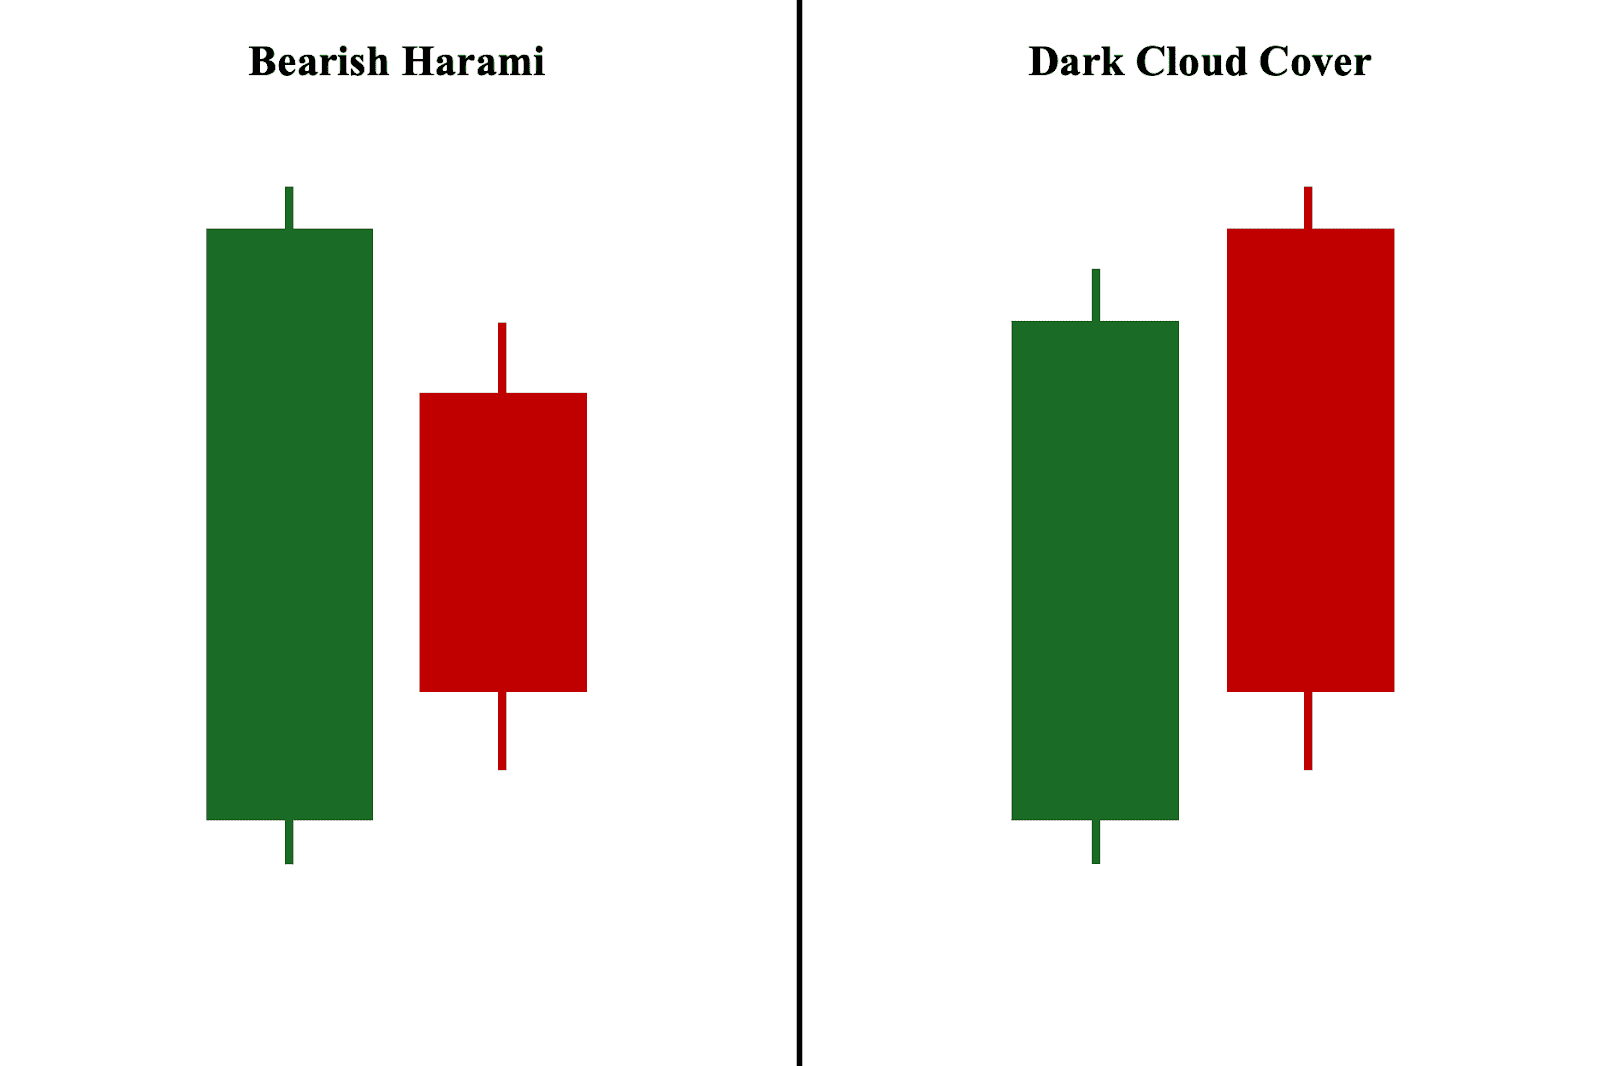
Compared to bearish harami, the dark cloud cover candlestick pattern occurs when a long-bodied bullish first candle is followed by a long-bodied bearish second candle that opens higher (creating an initial price gap) but ultimately closes below the 50% range of the first candle. While both candlestick formations are considered bearish reversal patterns, the dark cloud cover is widely considered to be a stronger bearish reversal pattern.
Bearish Harami vs. Doji Pattern
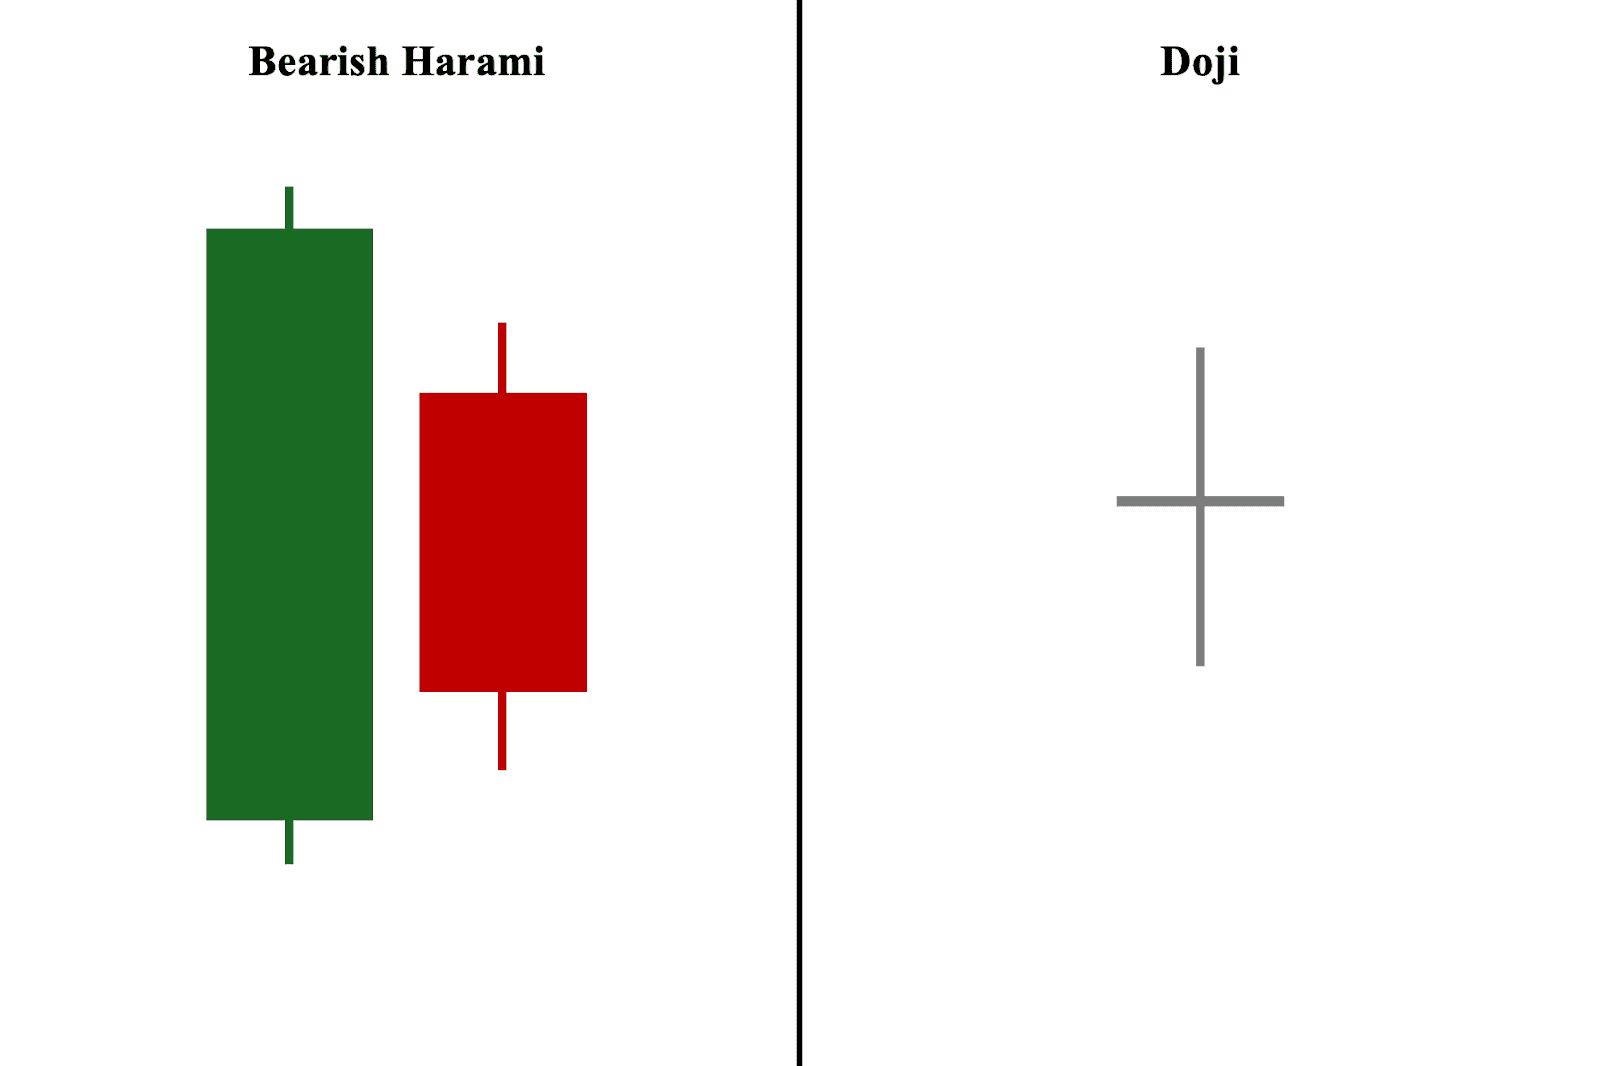
Compared to the bearish harami, which is considered a bearish reversal signal, a doji represents a state of ‘equilibrium,’ where its opening and closing prices are identical or nearly identical. As a result, the doji is widely considered a neutral candle that signals indecision or uncertainty in the future direction of the price action. When a doji appears, it does not conclusively indicate a likely direction for the price but rather serves as a ‘question mark’ for where the price may head in the next trading session.
Bearish Harami Cross vs Bullish Harami Cross
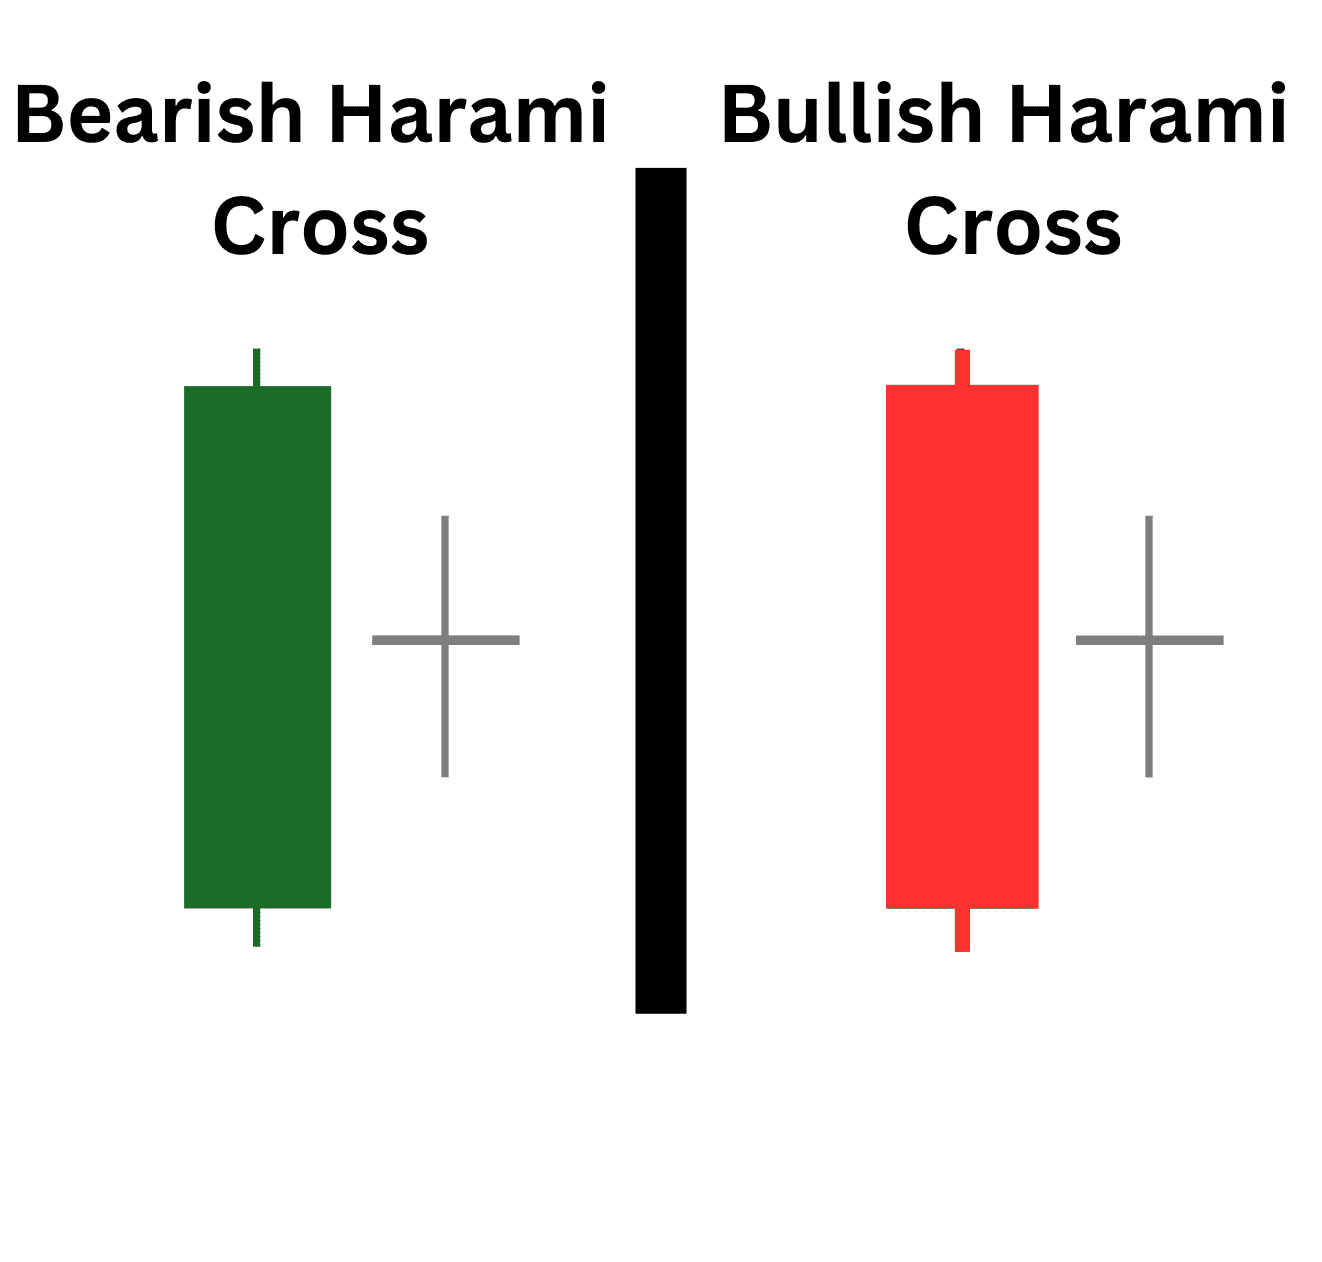
A bearish harami cross is the opposite of the bullish harami cross. The harami cross is a variant of its parent pattern, the harami. The main difference between the harami crosses are the colors of the first candle, green for bearish and red for bullish.
In the harami cross patterns, the second candle is replaced by a doji as it contains a very small body. After the first candle closes, the pattern gaps on the open, in the opposite direction of the first candle’s trend. However, the gap doesn’t take hold as a small ranged candle with a small body takes over. It could be argued that their is market trend indecision due to the small candle. Therefore, the next candle will shed some light on if the trend becomes bullish or bearish.
Common Bearish Harami Pattern Mistakes to Watch out
The following are three key mistakes to avoid in order to improve your success rate when trading bearish harami patterns:
1. Ignoring the Asset’s “DNA”
First, it is important to consider how the specific asset you want to trade has reacted to bearish harami patterns in the past. This is the asset’s ‘DNA,’ which it will likely mirror in the future. Hence, if you zoom out and observe that previous bearish haramis have failed to lead to a successful reversal, then chances are, the latest bearish harami pattern is more likely to fail than to become an outlier.
2. Using the Wrong Timeframe
Second, it is also important to pay attention to the timeframe you are using to identify the bearish harami pattern. While the standard timeframe is set to daily, the price action on the daily chart, depending on your trading approach, may not be applicable to you. For instance, if you are a day trader or a scalper, a bearish harami pattern on a longer timeframe may only be noise to you. Similarly, if you are a position (long-term) trader, the daily price action may not lead to a consequential change in the general move of the asset (e.g., if an asset is in a two-year uptrend, a single bearish harami is unlikely to trigger a complete reversal of this long-term trend).
3. Using the Same Approach Across Different Markets or Asset Classes
Third, a trading approach that works on a specific financial market and/or asset class does not guarantee the same level of success in other asset classes and/or financial markets. For example, if you determine that the best way to incorporate a bearish harami is by using it with Stochastic when trading penny stocks, this does not guarantee universal success when applied to other listed companies in the stock market, particularly blue chips, which often behave distinctly than penny stocks.
Frequently Asked Questions (FAQs)
What is the best time frame to use for bearish harami candlestick patterns?
Generally, the bearish harami pattern is best used on weekly and daily chart timeframes. This is because these are the standard timeframes used by most institutional and retail traders and investors.
How reliable and accurate is the bearish harami pattern?
Generally, the bearish harami pattern is less accurate and reliable when used on its own (without any technical analysis tools). It becomes more accurate and reliable when paired with complementary technical analysis tools (e.g., Moving Averages, RSI, volume, etc.). That being said, the bearish harami, like any other candlestick pattern, is imperfect and not 100% reliable or accurate.
Does the bearish harami pattern work?
Yes, but the bearish harami pattern is not an ‘end-all, be-all.’ Therefore, it is crucial to consider the broader market context and/or use other complementary technical analysis tools to confirm the pattern’s reversal signal better.
What is more bearish, a bearish harami or a doji?
The bearish harami is considered more bearish since it is a reversal pattern. In contrast, a doji is not a reversal pattern; instead, it merely indicates a state of indecision or uncertainty about where the price will go and is not an outright bearish signal.
Can a bearish harami pattern occur in both uptrends and downtrends?
Yes, a bearish harami can occur in both uptrends and downtrends. Nevertheless, for it to be valid, it needs to either appear at the top of an established uptrend or at the end of the retracement phase (temporary price advance) in a downtrend.


