Bullish
- August 14, 2024
- 15 min read
Bull Pennant Patterns Complete Trading Guide
What is the Bull Pennant Pattern?

A bull pennant is another chart pattern technical traders use to signal when the market is likely to rally further. This pattern usually appears when prices undergo a short-term corrective phase within a broader uptrend, indicating that the asset will likely experience a further price rise. The pattern unfolds in specific phases, starting with a significant upward surge caused by a substantial influx of buying pressure.
After a surge in price, the asset usually enters a consolidation phase characterized by a symmetrical triangle-like pattern. This means the price may experience a slight dip, a pullback, or a correction, and the trading range becomes narrower as the price forms higher lows and lower highs. However, like the bull flag, this consolidation does not necessarily mean the asset’s upward momentum has stopped. Instead, a temporary pause allows traders and investors to reassess the asset’s value. During this period, the market is simply digesting the recent gains, which does not indicate a reversal.
The pattern completes with a decisive breakout above this consolidation phase. The breakout is driven by renewed buying interest, pushing the price to rally further. This point is crucial and is often accompanied by increased trading volume, reinforcing the pattern’s validity and indicating that the asset’s upward trend will probably continue.
How to Identify Bullish Pennants

The Bullish Pennant pattern shares similarities with the bullish flag and develops through three phases. Traders can detect the bull pennant in its middle phase and trade the pattern through its final phase. Here’s a detailed way to recognize each phase:
Phase One – The Flagpole: The bull pennant’s start is signalled by a significant price increase, forming what’s known as the flagpole. This surge is backed by a noticeable rise in trading volume and activity, indicating strong buyer interest.
Phase Two – The Pennant: After the initial price jump, there’s a period of smaller price movements within a tight range, taking on a pennant shape. This series of peaks and troughs converges into a symmetrical triangle that points sideways, with trading volume tapering off.
Phase Three – The Breakout: The pattern is confirmed when the price pushes past the top edge of the pennant, suggesting the early uptrend will keep going. This breakout validates the bullish pennant pattern and points to ongoing upward momentum, primarily supported by increased trading volume, continuing in the same direction as the initial trend.
In markets where trading volume data is accessible, this increase in volume during the breakout serves as a solid confirmation of the pattern’s reliability and the market’s support for the continued uptrend.
Trading the Bull Pennant Pattern
Identify the Market Trend: The first step is to verify that the market trend is bullish, as the bull pennant pattern is a continuation pattern that must appear within an existing uptrend. Look for a strong price rally in the market over an extended period.
Spotting the Pennant: Watch for a slight downward, horizontal consolidation phase after the sharp rally. This consolidation should form a symmetrical triangle, with the upper trendline acting as resistance. In contrast, the lower trendline acts as support. Unlike the bull flag, which is characterized by its rectangular shape with parallel trend lines, the bull pennant forms a symmetrical triangle.
Entry Point: The ideal entry point is upon a clear breakout above the upper boundary of the pennant. To avoid false breakouts, wait for a candle to close above the pennant, confirming the breakout’s validity. This method ensures you enter the trade based on established momentum rather than preliminary excitement.
Stop Loss: To manage risk effectively, place a stop loss just below the lowest point of the pennant. That way, if prices continue to break lower, the pattern has failed, and you’ll want to be taken out of the position.
Take Profit: Calculate the take profit level by projecting the distance of the flagpole upwards from the breakout point.
Bull Pennant Pattern Example

The above is an example of the formation of the bull pennant in a daily EURUSD chart. Observe how after the initial rally the prices made a retracement of about 50% of the flagpole before breaking the upper trendline and moving further above.

The CADJPY chart above indicates that there was a strong price rise followed by a consolidation. The bull pennant pattern concluded with another continuation of the prevailing bullish momentum.

Based on the 30-minute Gold price chart above, the formation of the bull pennant began with a strong bullish move followed by price moving sideways and then a break above the upper trendline.
Bull Pennant Strategies
Explore two simple bull pennant trading strategies below.
Breakout of the Upper Trendline

To trade the breakout above a bull pennant, wait for the price to surpass the upper trendline of the pennant. Additionally, ensure the breakout is supported by increased volume for pattern confirmation. Aim for a risk-reward ratio of at least 1:2, where potential gains are at least double the risk.
Set your profit target by measuring the pole’s height and extending this distance from the breakout level. Minimise risks by placing a stop loss below the lowest point of the pennant. The bullish pennant examples show the price rallying after breaking above the upper boundary of the pennant.
Retest after Break

Initiate a trade when the price retests and breaks above the upper boundary of the pennant pattern after an initial rally. This may signal a continuation of the bullish trend. Determine your take profit by measuring the distance from the bottom of the pennant to the top and adding it to the breakout point. Place your stop loss below the pennant’s recent low to exit with a minimal loss should the breakout fail.
The Dow Jones chart above shows an example of the bull pennant strategy, where the price breaks above the upper boundary of the pennant pattern, leading to a potential rally. This strategy involves executing a trade during the retest after the breakout period with precise entry and exit levels.
Advantages of the Bull Pennant Pattern
The bull pennant candlestick pattern offers several advantages for traders, such as:
1. Easy Identification: Traders can spot bull pennants conveniently due to the pattern’s distinctive feature, a long and visible flagpole, followed by a symmetrical triangle pattern for the pennant.
2. Entry and Exit Points: The bull pennant pattern provides a relatively straightforward and objective setup for entry and exit points. The breakout point above the pennant is a precise entry signal for traders. At the same time, the length of the flagpole provides a straightforward method for determining take-profit levels.
3. Versatility: Effective in multiple time frames, the bull pennant pattern serves both day and swing traders, offering flexibility and the opportunity to tailor strategies to individual trading styles and goals.
Disadvantages of the Bull Pennant Pattern
Like any trading strategy, trading the bull pennant pattern has challenges and disadvantages. Recognizing these limitations is important for traders to navigate the markets effectively and manage risks appropriately.
1. Confirmation Bias: Already in a bullish mindset, traders may begin to see patterns like the bullish pennant thinking that it is carving to confirm they’re bullish bias. In reality, there is another pattern forming. The confirmation bias may mislead traders to believe a bullish pennant is shaping when in fact, it’s not following the guidelines laid out above.
2. Low Volatility: The pennant portion of the pennant chart pattern may form during a period of low volatility. Low volatility can lead to false breakouts making it challenging to find the winning trades. Therefore, make sure you let the market dictate to you when it’s ready to break higher on increased volume to confirm a potential strong upward price move.
3. Volume Confirmation Reliance: Validating the breakout from a bullish pennant chart pattern often depends on an accompanying volume increase, which can be hard to confirm in less utilized trading exchanges. Though the volume is important to helping confirm the pattern, some exchange’s volume data may not be reliable creating false signals.
What is the Psychology of Bull Pennant Formations
The bull pennant is a continuation pattern and the uptrend is not over. The bull pennant chart pattern signals a continuation of an uptrend as it begins with a sharp price increase that causes an asset’s value to rise further. This initial upward move results from a positive news release or other news positively impacting the asset.
The subsequent consolidation phase, or the pennant, represents a brief pause in this upward momentum. At this point, the buyers have become exhausted and need to catch their breath. However, they feel the uptrend is still early and want to keep their long positions open. Some sellers may try to sell at the top; some long buyers take a profit, and the price consolidates sideways.
The price cannot decline as both buyers and sellers hold their breath. Volume dries up during the consolidation. Then, buyers begin to bring in more volume, and the price adjusts higher. As the price increases, stop losses get hit, creating even more buyers and quickly pushing prices further up.
Once the buyers are exhausted, they are ready to sell, and sellers are prepared to rush in to close the pattern.
Bull Pennant vs Symmetrical Triangle

The bull pennant pattern is a continuation signal in an uptrend, characterized by a sharp price increase followed by a consolidation phase that forms a small, narrow triangle, concluding with a breakout that resumes the uptrend.
On the other hand, the symmetrical triangle does not inherently signal a continuation or reversal. However, it indicates a period of consolidation where the future direction is uncertain. This pattern represents a balance between buyers and sellers, formed by converging trendlines connecting lower and higher highs. The breakout direction from a symmetrical triangle can be either upward or downward, depending on which side of the triangle is breached.
Unlike the bull pennant, which suggests continuing the prior trend, the symmetrical triangle requires traders to wait for the breakout to determine the market’s next move, making it a pattern of indecision until the breakout occurs.
Bull Pennant Pattern vs Bull Flag Pattern

While the bull pennant pattern indicates a continuation of an uptrend through a brief consolidation phase forming a symmetrical triangle, it suggests a tighter and quicker consolidation than its counterpart.
The bull flag pattern is recognized for its distinct downward-sloping consolidation phase that follows a notable price surge. It indicates a continuation of the upward momentum. With its flagpole and flag formation, this pattern allows for a more extended consolidation period. It provides traders with a clear indication of the potential upward movement.
Bullish Pennant Patterns vs Bearish Pennant Patterns

The bear and bull pennant patterns are continuation patterns, with the key difference being their directional cues. Both patterns share a common structure and indicate a pause in market momentum before a likely continuation in the direction of the prevailing trend.
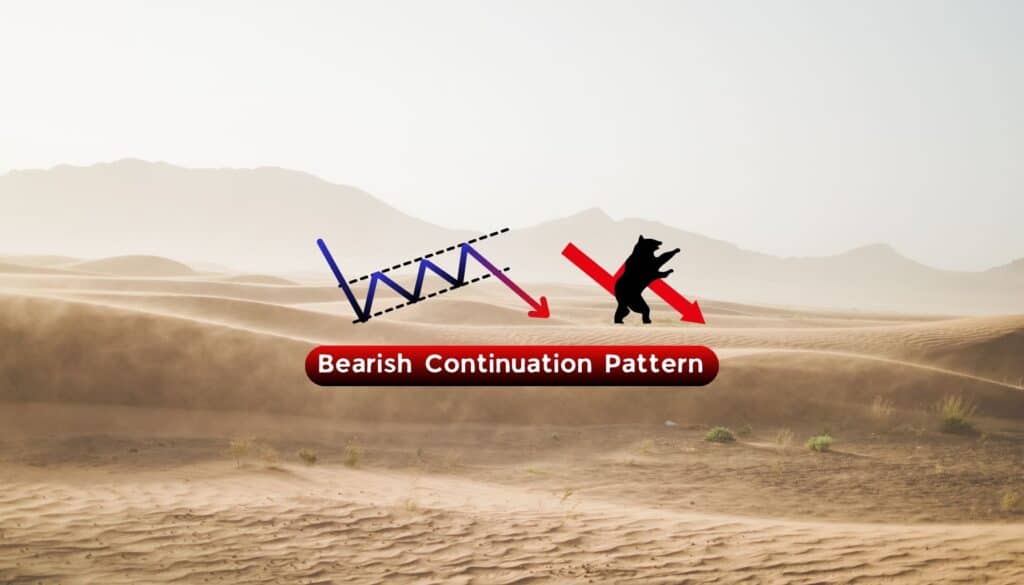
The bearish pennant suggests a continuation of a downtrend after a brief consolidation phase, forming a symmetrical triangle that slopes slightly upwards.
Conversely, the bull pennant reveals an uptrend continuation, forming after a significant price increase, with the consolidation phase creating a symmetrical triangle that slopes slightly downwards, signalling a pause before the upward trend resumes.
Bullish Pennant vs Ascending Triangle Pattern
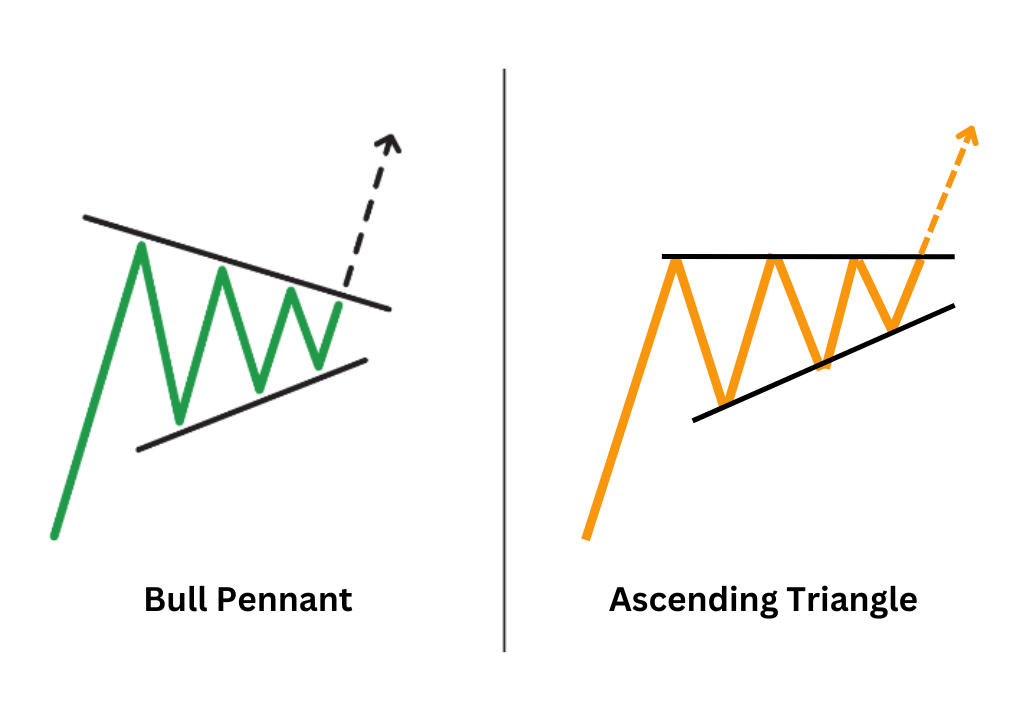
Both the bullish pennant pattern and the ascending triangle pattern start with an uptrend before the period of consolidation. Both consolidations form a triangle shape of converging trend lines. The pennant chart pattern contains two converging trend lines that slope in the opposite direction. On the other hand, the ascending triangle contains an upper trend line that is horizontal and flat as prices keep retesting resistance, but cannot break through.
Bull Pennant vs. Wedges

The bull pennant pattern is a continuation signal in a bullish trend, marked by a significant upward move followed by a consolidation phase forming a symmetrical triangle. This pattern suggests that the bullish trend will likely resume with a breakout to the upside after a brief pause.
Wedges are a type of chart pattern traders use to predict market movements. There are two types of wedges – rising wedges and falling wedges. A rising wedge occurs when prices consolidate between converging trend lines that slope upwards. This suggests a potential bearish reversal in an uptrend as buyers lose momentum. On the other hand, a falling wedge occurs during a downtrend when prices consolidate within downward-sloping lines. Unlike the bull pennant, which indicates a continuation, falling wedges often signal a bullish reversal. This implies that the uptrend could be reversed as buying pressure weakens.
Trading Bullish Pennant with Volume Confirmations

Volume confirmations help validate the pattern’s breakout, enhancing the reliability of the trading signal. Keep an eye out for a gradual decrease in trading volume during the formation of the pennant. This decrease in volume indicates the consolidation phase, where market participants take a break to evaluate their next moves. The diminishing volume is typical of the pennant’s consolidation, which signals a temporary halt in buying pressure.
When using volume to trade bull pennants, it is crucial to identify a significant increase in volume as the price rises above the lower boundary of the pennant. This sudden spike in volume indicates that the market has increased buying activity, pushing the price further up. It suggests that the breakout is not a false signal but a continuation of a bullish trend.
Implementing the Strategy:
Enter a buy position after confirming the breakout with a volume spike. This entry is based on the premise that the increased volume signifies strong market participation in the bullish continuation, offering a higher probability of a successful trade.
To manage risk effectively, place a stop loss just below the pennant’s lowest or breakout point. This protects the trade against the possibility of a reversal back into the pennant formation. Set a take profit level by projecting the flagpole height from the breakout point. This method estimates the potential upward move, allowing traders to lock in profits at a strategic level.
What Indicator is Best to Trade with a Bull Pennant Pattern?
The Fibonacci retracement tool can be handy when trading with a bull pennant pattern. It helps traders identify potential support and resistance levels during the consolidation phase of the pattern. Fibonacci retracement levels ensure the pennant’s consolidation does not retrace more than 50% of the initial flagpole rise.
Traders often apply Fibonacci levels to the initial surge that forms the flagpole. This provides insights into possible retracement levels where the price might stabilize before resuming the uptrend.
What are the Common Mistakes Traders Make When Trading a Pennant Pattern?
Deep Retracement Level: Traders engage in trades when the pennant’s retracement level is too deep, such as at 60%. This can significantly diminish the chart pattern’s reliability and increase the risk of unsuccessful trades.
Ignoring Volume Indicators: Traders must pay more attention to volume during the pennant’s formation. Generally, the volume should decrease during consolidation and increase significantly when the price breaks downward. You may receive false signals if you enter a trade without considering this volume confirmation.
Stop Loss levels: Setting the stop-loss just above the high point of the pennant is important to limit potential losses from an unexpected upward price reversal. Traders should avoid placing it too tight to prevent premature stop-outs.
FAQ
Is it possible to trade a pennant pattern with Fibonacci retracement ?
Yes, it is possible to trade a pennant pattern using Fibonacci Retracement. Traders often apply Fibonacci levels to the initial move (flagpole) to identify potential support or resistance levels during the pattern’s consolidation phase to determine optimal entry and exit points.
Can a pennant pattern be traded with moving averages?
Yes, a pennant pattern can be traded with moving averages such as a simple moving average (SMA) or exponential moving average (EMA). Moving Averages can help identify the trend before the formation of the pennant and signal entry or exit points when the price breaks out of the pennant formation, aligning with the moving average direction.
When is the best time to trade a pennant pattern?
The best time to trade a bullish pennant pattern is after a clear and significant initial move (the flagpole) and once the pattern has fully formed, ideally with a breakout on high volume. This ensures the pattern’s reliability and the continuation of the trend.
Can the bull pennant pattern fail?
Yes, the bull pennant pattern can fail if the breakout does not occur as expected or if it lacks sufficient volume to sustain the move, leading to a false breakout or reversal of the trend.
How reliable is the bull pennant?
The reliability of the bull pennant pattern is increased when there is a surge in volume during the breakout, indicating strong market consensus on the continuation of the uptrend.
How often does the bull pennant pattern happen?
The bull pennant pattern occurs relatively frequently in markets experiencing solid downtrends. However, its frequency can vary depending on market conditions and the time frame.
Is the pennant pattern profitable?
When traded correctly, the pennant pattern can be profitable. Its effectiveness lies in signalling the continuation of a trend, offering opportunities for timely entry and exit points with proper identification, volume confirmation, and risk management strategies.
Can pennant formations signal both continuation and reversal patterns?
Pennant formations primarily signal continuation patterns, indicating a pause before the prevailing trend resumes. They are not typically used to signal reversals.
Is pennant pattern for beginners?
Yes, the pennant pattern can be suitable for beginners due to its clear and identifiable structure, making it easier to spot and understand in the context of trend continuation. However, successful trading with this pattern still requires practice and an understanding of volume confirmation and proper risk management.


