Written by:

Reviewed by:

- December 5, 2025
- 24 min read
14 Volume Indicators Traders Use
What is Volume?
Volume measures how much of an asset is traded during a given period. Traders use it to judge whether a price move has real conviction behind it, which translates into clean upswing or downswing.
Importance of High Volume
High volume, shown by a larger than average volume bar, signals strong interest and participation from traders. This is important because it shows where real capital is entering the market.
On higher timeframes like the 1H and above, these candles carry more weight, and comparing them to average volume or relative volume helps gauge how meaningful the activity is.
Reading a high-volume candle requires nuance. Its meaning depends on preceding market structure, price action, and earlier volume bars. High-volume candles can signal:
- Breakout: Price expands beyond a range with strong follow-through.
- Fakeout: Price pierces a level but quickly returns inside the range.
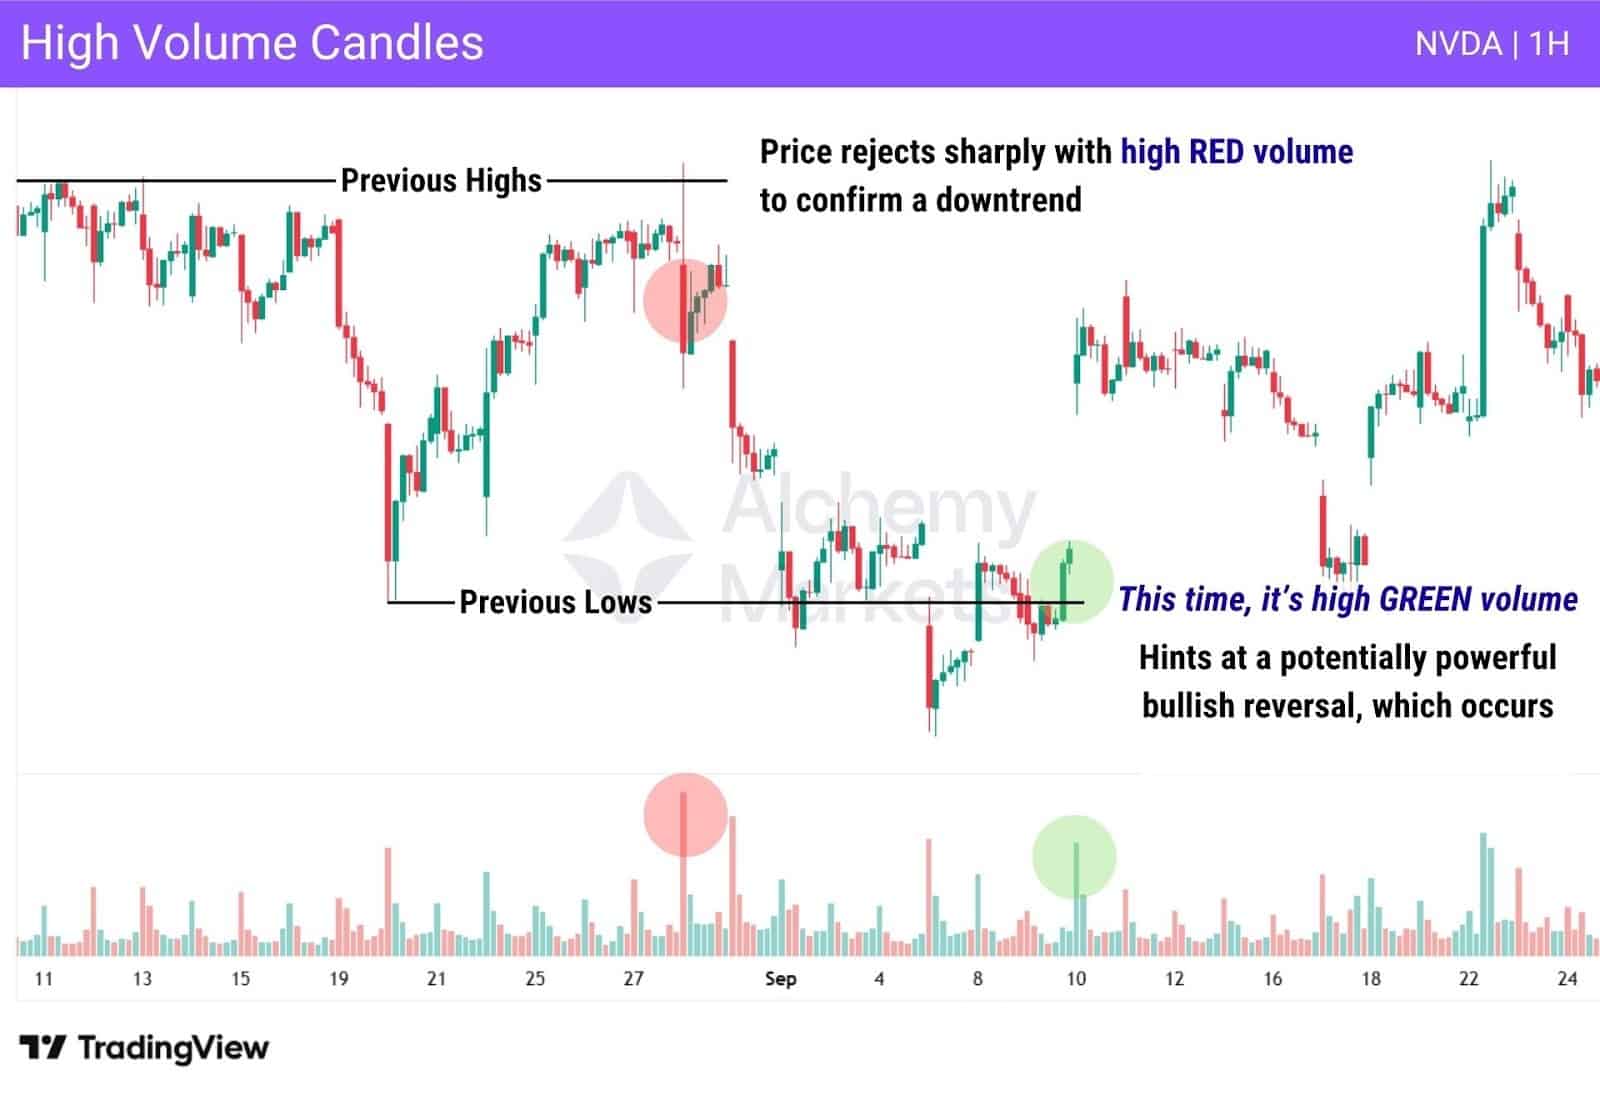
- Reversal: A rejection candle at key support or resistance with high volume is often a reversal.
In general, a high volume bullish candle suggests strong buying pressure, while a bearish one implies aggressive selling.
When price pierces a level with high volume and holds, it signals a genuine breakout attempt. But if price rejects a level with high volume, it often marks a short term trend reversal within a larger trend continuation.
For example, if the overall trend is bearish but price rallies into resistance (a short-term bullish move), a high-volume rejection signals a bearish reversal in the short term and a continuation of the broader bearish trend.
Occasionally, you’ll see a full market reversal when price taps into major support or resistance with extreme volume (long term flip), but remember: the trend is your friend until it ends. Always read high-volume candles in context to decide whether you’re seeing a breakout, fakeout, or reversal.
Importance of Low Volume
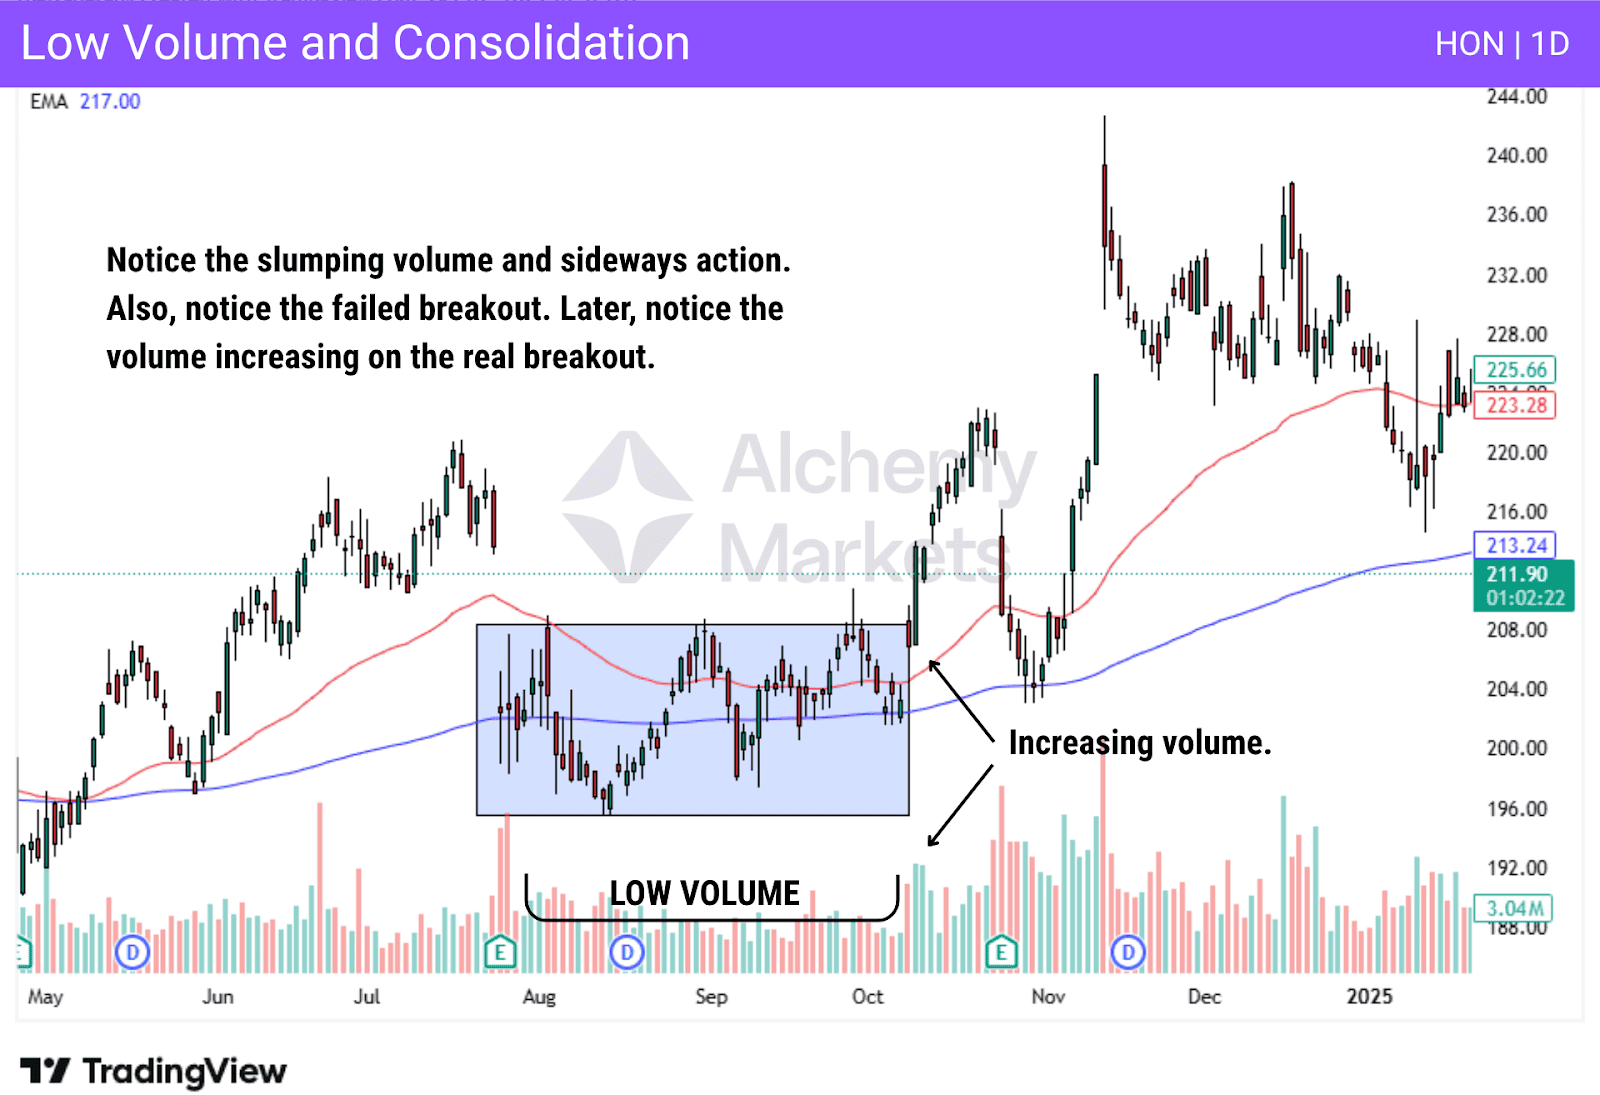
Low volume reflects a lack of interest or participation in the market. This is important because it shows that neither buyers nor sellers are strongly committed, often leading to slow, sideways movement. Price may drift within a range as traders wait for a catalyst to act.
Periods of low volume can look uneventful, but they often precede major breakouts. As interest returns and volume begins to climb, it signals that conviction is building again.
When that increase aligns with a clear break from consolidation, it confirms that real participation is entering the market.
| How to Interpret Volume Bars | |
| Spike at support or resistance | If price pierces; it indicates a breakout. If price rejects it signals a rejection. If price pierces then dips back into range—fakeout. |
| High volume without price move | Suggests accumulation/distribution or an exhaustion spike near the end of a trend. Often precedes a trend reversal, as heavy participation without price progress shows buyers or sellers losing control. |
| Low volume on pullback | Implies the pullback lacks conviction; selling pressure is weak. |
| FX market volumes | Forex data is based on tick counts rather than true trade size. Additionally, forex is decentralized so it’s only the volume with that broker and volume readings may be incomplete. |
What are Volume Indicators?
Volume indicators are technical analysis tools that focus on trading volume, selling pressure, and buying pressure, helping you determine whether buyers or sellers are in control of the market. Many trading strategies will incorporate volume indicators to confirm trades and give trading signals for traders to use.
Basic Guidelines for Using Volume Indicators
Many traders will use volume indicators for their technical analysis. Numerous trading strategies utilise these indicators, with the overall volume typically exchanged being used to confirm a move on a price chart. However, some also use overbought and oversold conditions as trading signals.
Volume indicators are used in congruence with other technical indicators and price action, typically being another one of the technical analysis tools in a larger trading system.
Types of Volume Indicators Traders Use
There are many types of volume indicators available for people to use in financial markets. Many will use these indicators to determine who is controlling the market and market sentiment, as they can reveal whether buyers or sellers are in control.
Choosing the Right Volume Indicator: Comparison Table
With so many volume indicators available, it’s easy to feel overwhelmed.
To help you cut through the noise, we’ve grouped each one by what it does best — whether it’s spotting trends, confirming breakouts, or catching reversals. Use this quick overview to figure out which tools make the most sense for your trading style.
Scan the table below to match each indicator to your strategy at a glance.
| Indicator | Best Timeframe | Type of Market Condition | Traders That Use Them |
| Volume (Pure Volume Indicator) | All timeframes (especially intraday) | Works in all conditions — confirms breakouts and reversals | Day traders, scalpers, swing traders |
| On Balance Volume (OBV) | 1H – Daily | Trending markets | Swing traders, position traders |
| Money Flow Index (MFI) | 15M – Daily | Ranging and reversal markets | Swing traders, momentum traders |
| VWAP (Volume Weighted Average Price) | Intraday | Trending or consolidating sessions | Day traders, institutional traders |
| Volume Profile | 4H – Weekly | Consolidation and breakout zones | Swing traders, market profile analysts |
| Volume Price Trend (VPT) | 1H – Daily | Trending markets | Swing and position traders |
| Volume RSI (VRSI) | 1H – Daily | Reversal and overextended moves | Momentum traders, swing traders |
| Chaikin Money Flow (CMF) | 1H – Daily | Trend continuation and divergence setups | Swing and position traders |
| Accumulation/Distribution | 1H – Daily | Accumulation/distribution phases before trend shifts | Swing traders, volume analysts |
| Klinger Oscillator | 1H – Daily | Trend reversals and divergence zones | Technical analysts, swing traders |
| Ease of Movement (EOM) | 1H – 4H | Low-volume trending periods | Swing traders, volume-flow specialists |
| Positive Volume Index (PVI) | Daily – Weekly | Bullish trends and volume confirmation | Position traders, long-term investors |
| Negative Volume Index (NVI) | Daily – Weekly | Bearish corrections and pullbacks | Position traders, institutional analysts |
| Trade Volume Index (TVI) | 1H – Daily | Short-term breakouts and scalps | Intraday traders, scalpers |
Be sure to test different input lengths and smoothing periods to find your volume indicator best settings, since even small changes can make a big difference depending on your strategy.
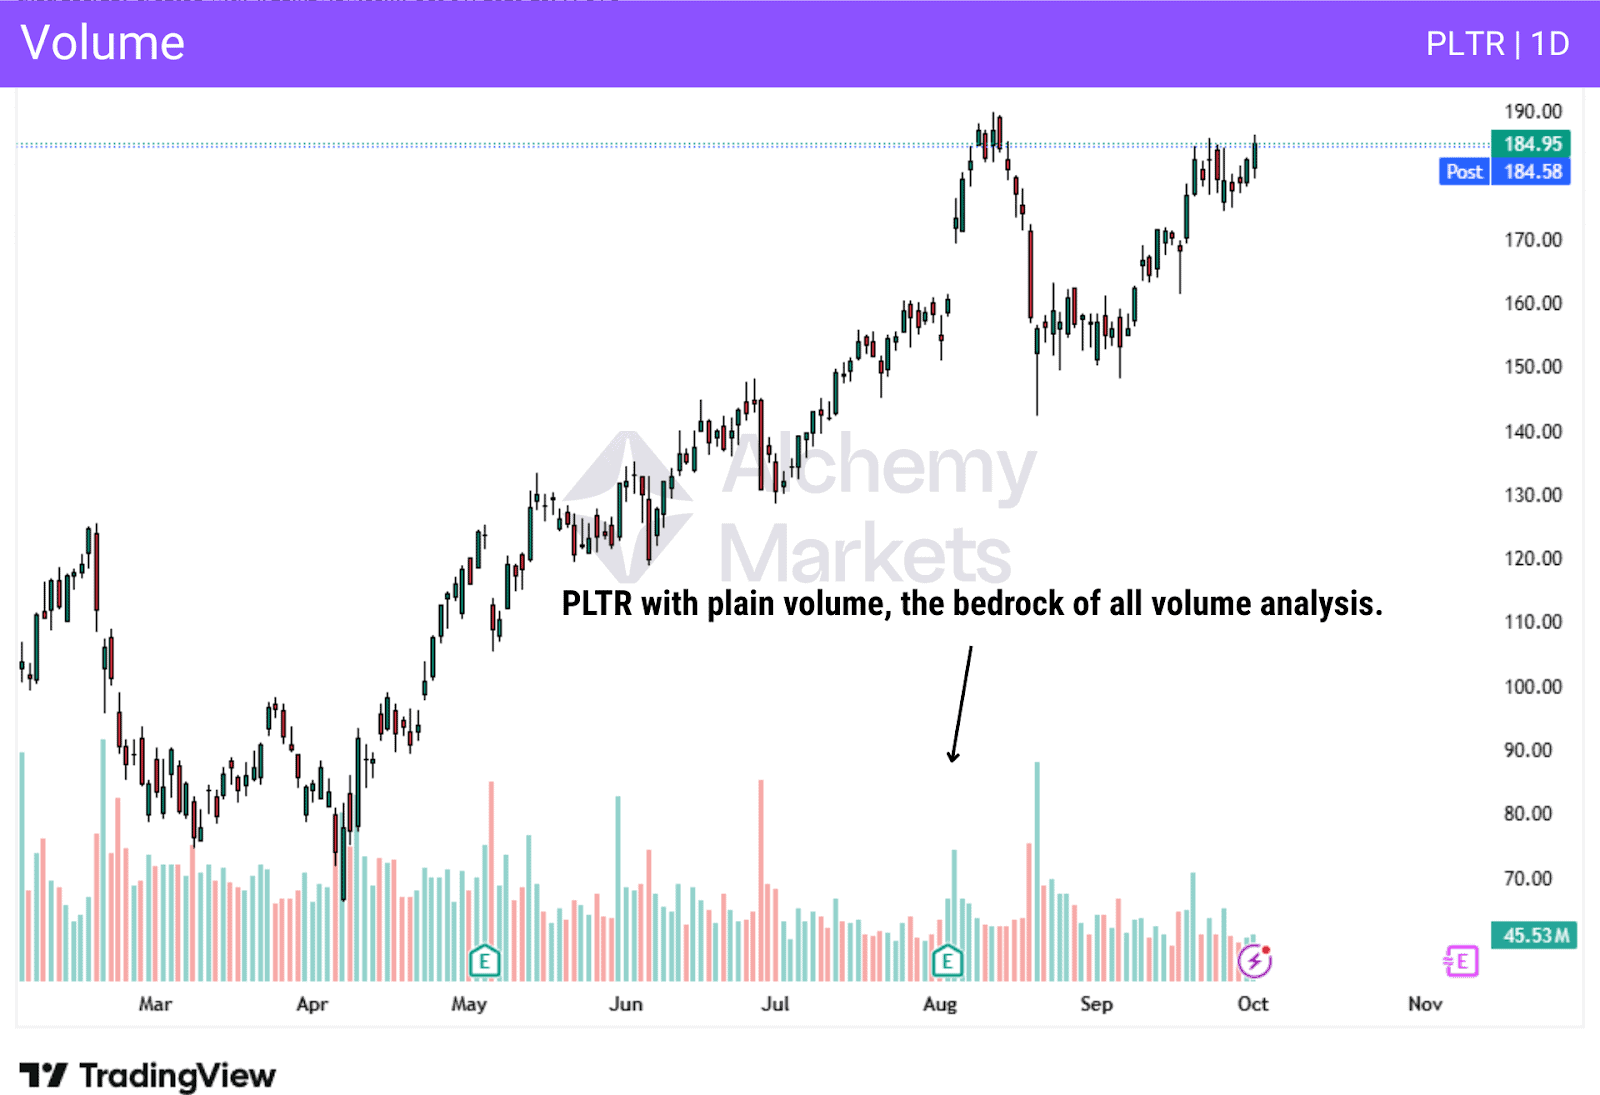
1. Volume By Price Bar
What is it:
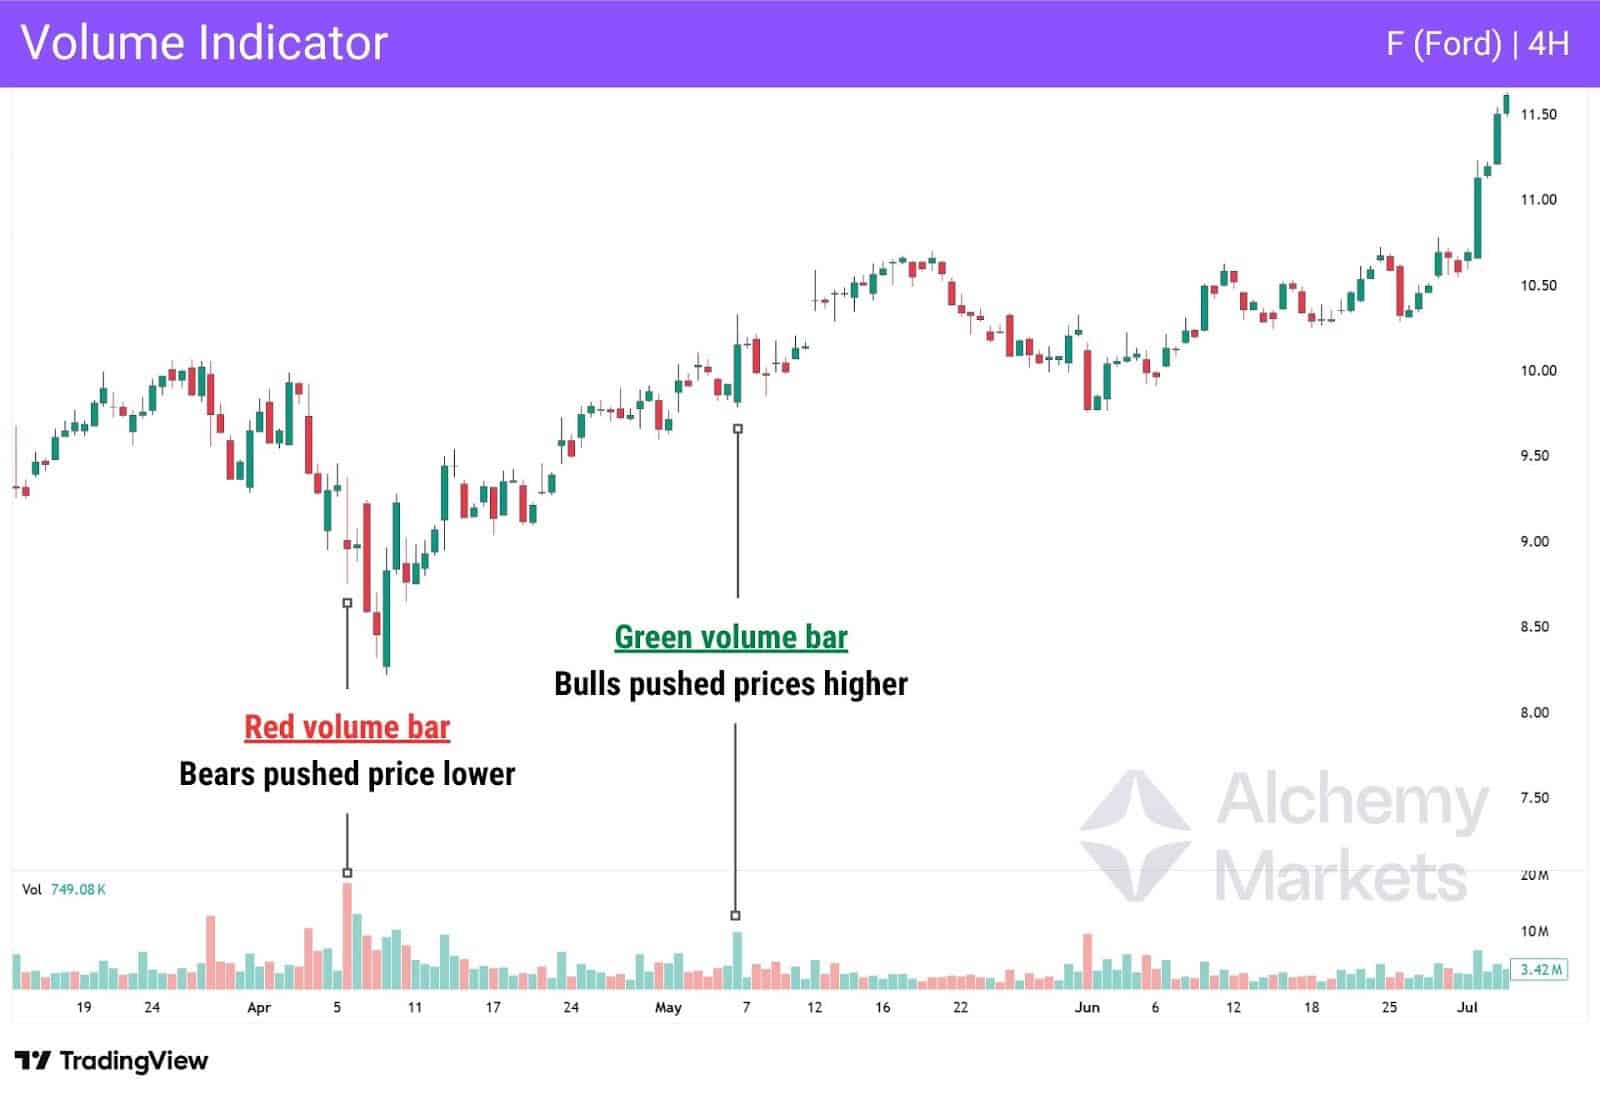
Volume in financial markets is the total number of shares or contracts that are traded for a specific asset during a specific period of time, such as a day, hour, etc. The volume of an asset suggests the liquidity, market activity, with higher volume typically suggesting more confidence in the price trend.
How does it work:
Volume is determined by completed executions in a financial market. Every contract or share that is bought and sold will be represented by the volume indicator, showing how many transactions occurred during a specific time frame.
Why traders use it:
Traders will use volume primarily for confirmation of a price move. As a general rule, the higher the volume, the more confirmation that the market sees in a move. Conversely, if the volume is low, it shows a general disinterest in that asset.
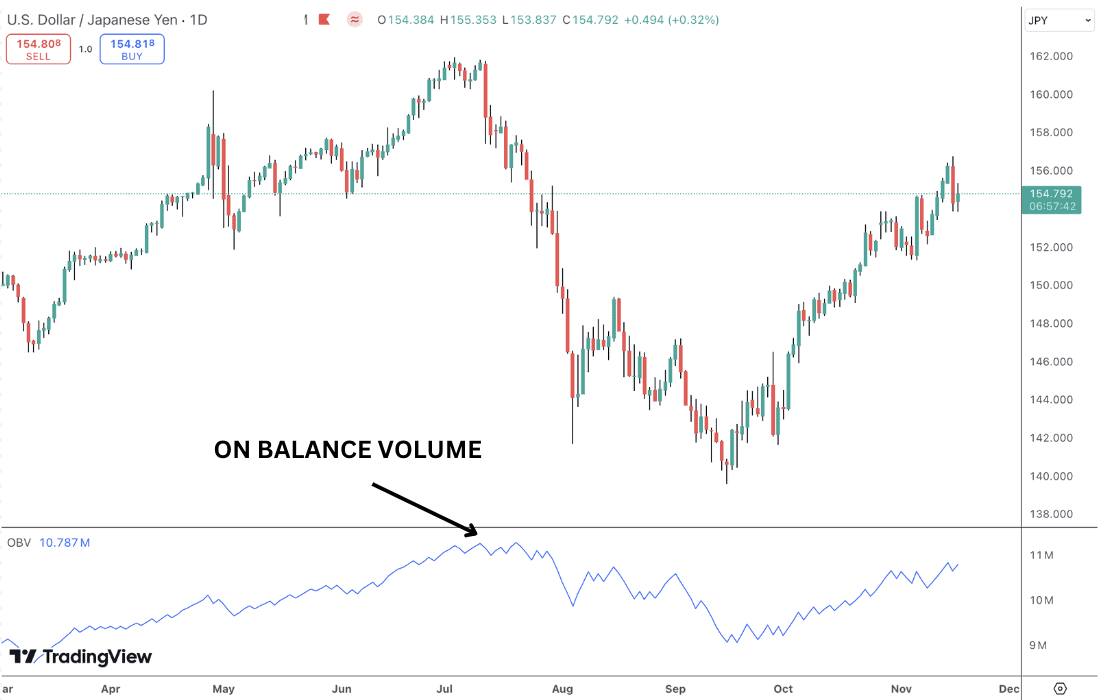
2. On Balance Indicator (OBV)
What is it:
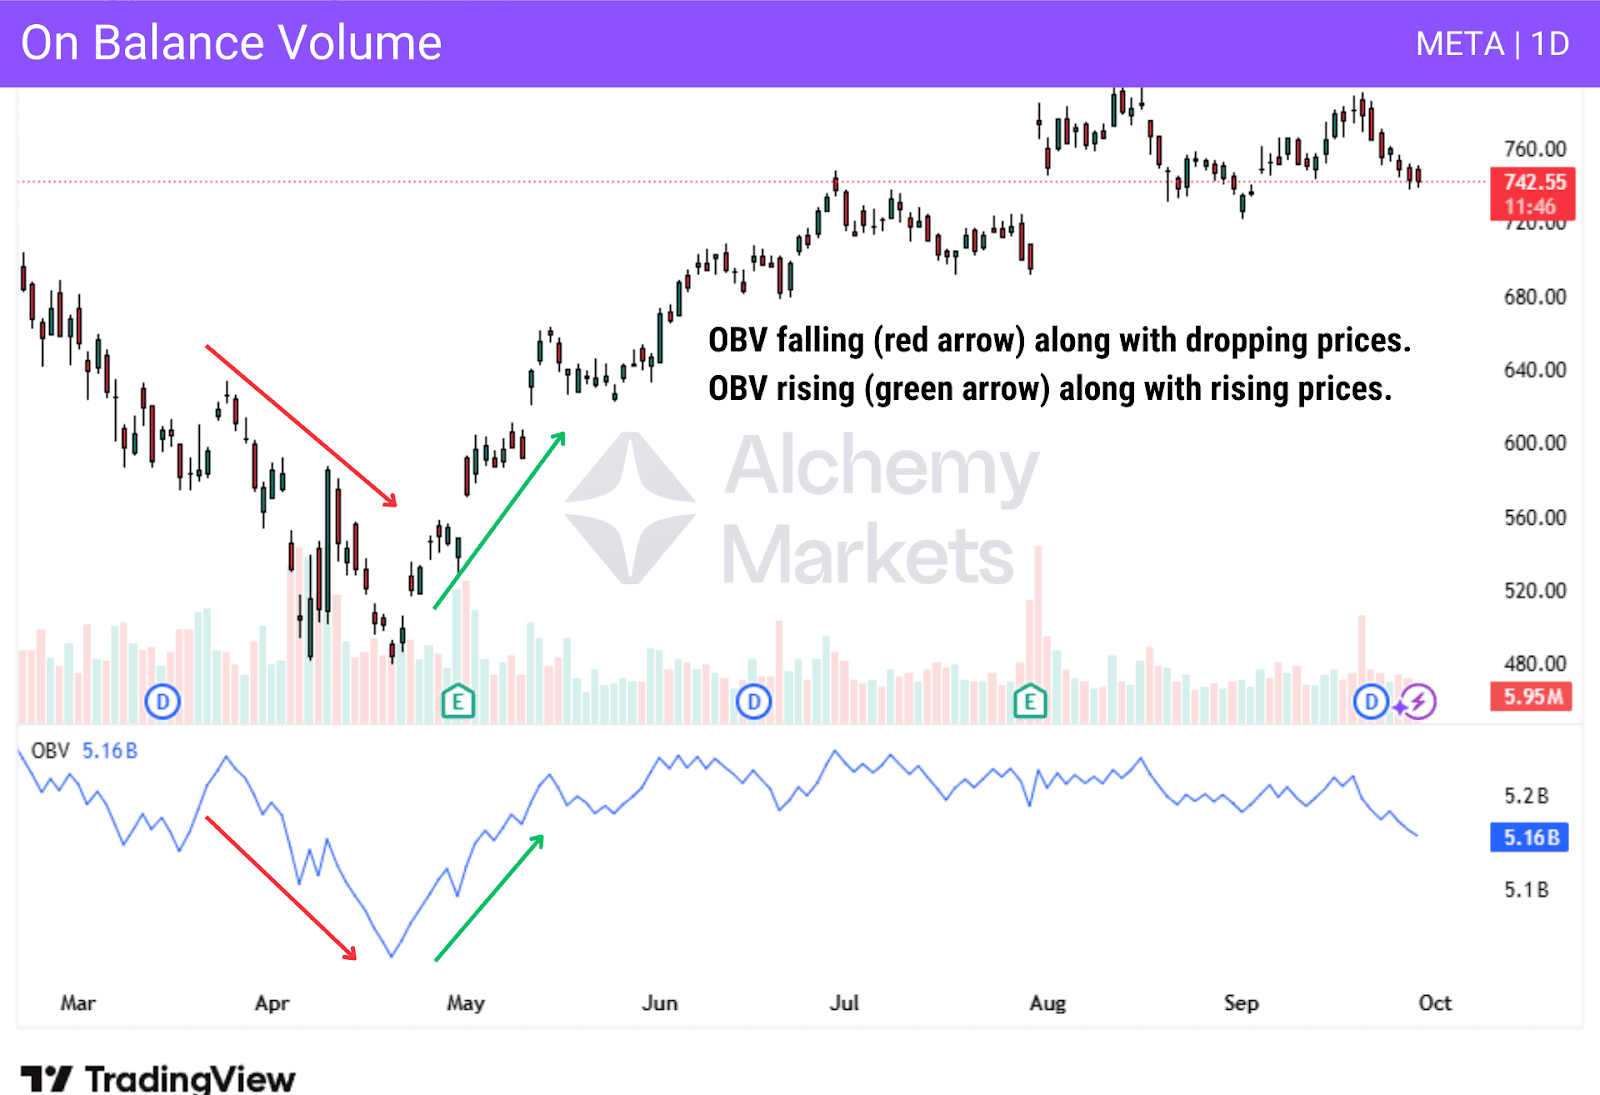
The On Balance Volume indicator was invented in 1963 by Joseph Granville. It was built with volume being the main parameter that moves the stock market. It has since been adapted for use in other markets, with on balance volume being used by traders worldwide, and a loved volume indicator by many.
How does it work:
If a new candle closes higher than the previous one, the volume of that candle is added to the total cumulative volume in the indicator. If a close is below the current candle, then that volume is subtracted from the total cumulative volume.
Why traders use it:
Traders who use this indicator as part of their trading strategy believe that prices in the asset are often preceded by changes in the indicator. Some believe that future price movements are considered to be “more reliable” if cumulative volume has been picking up.
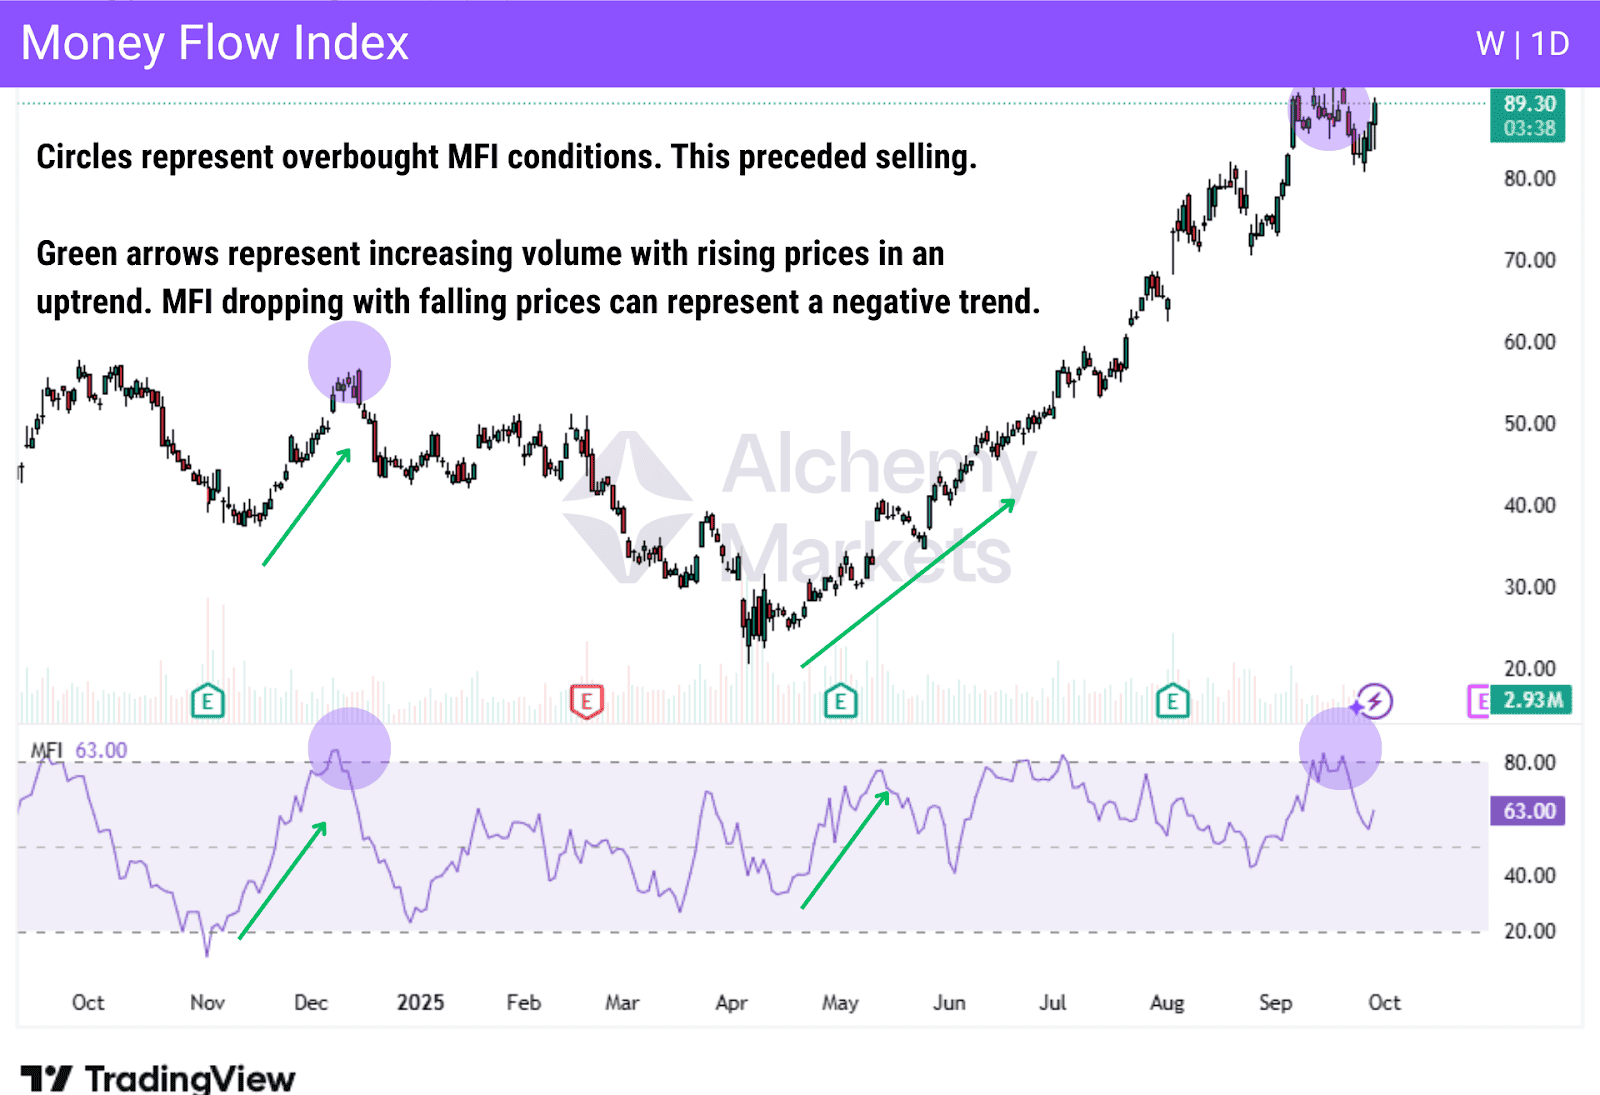
3. Money Flow Index (MFI)
What is it:
The Money Flow Index is a volume indicator that came about from the John Wells Wilder book, New Concepts in Technical Trading Systems, released in 1978. The indicator tracks the dynamics of inflows into a market over a given amount of time.
How does it work:
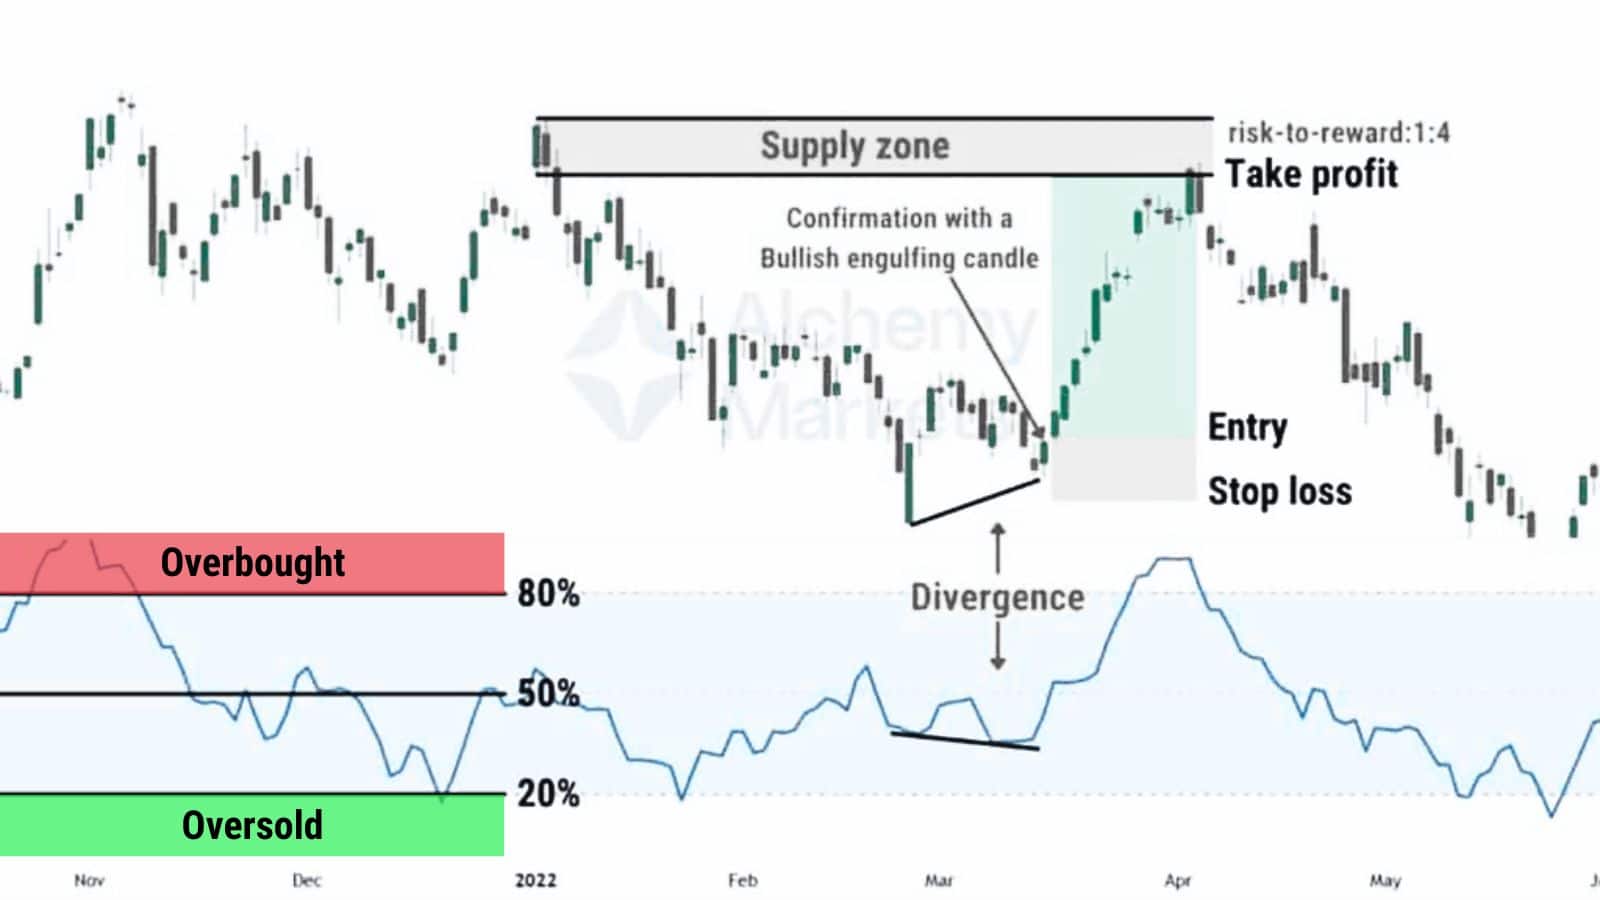
The MFI has a value ranging from 0 to 100, enabling traders to recognise buying and selling pressure within a market. It can also assist traders in identifying both overbought and oversold conditions. Furthermore, the MFI may reveal divergences between volume and price, which could lead to potential trading decisions being made.
Why traders use it:
Traders like the Money Flow Index because it is essentially a volume‑weighted Relative Strength Index, which can make the MFI more sensitive than the RSI indicator alone. This makes it useful for spotting divergences and reversals earlier than price‑only oscillators.
Recommended Settings: 14-period default; 7–10 for faster signals, 20–25 for swing setups.
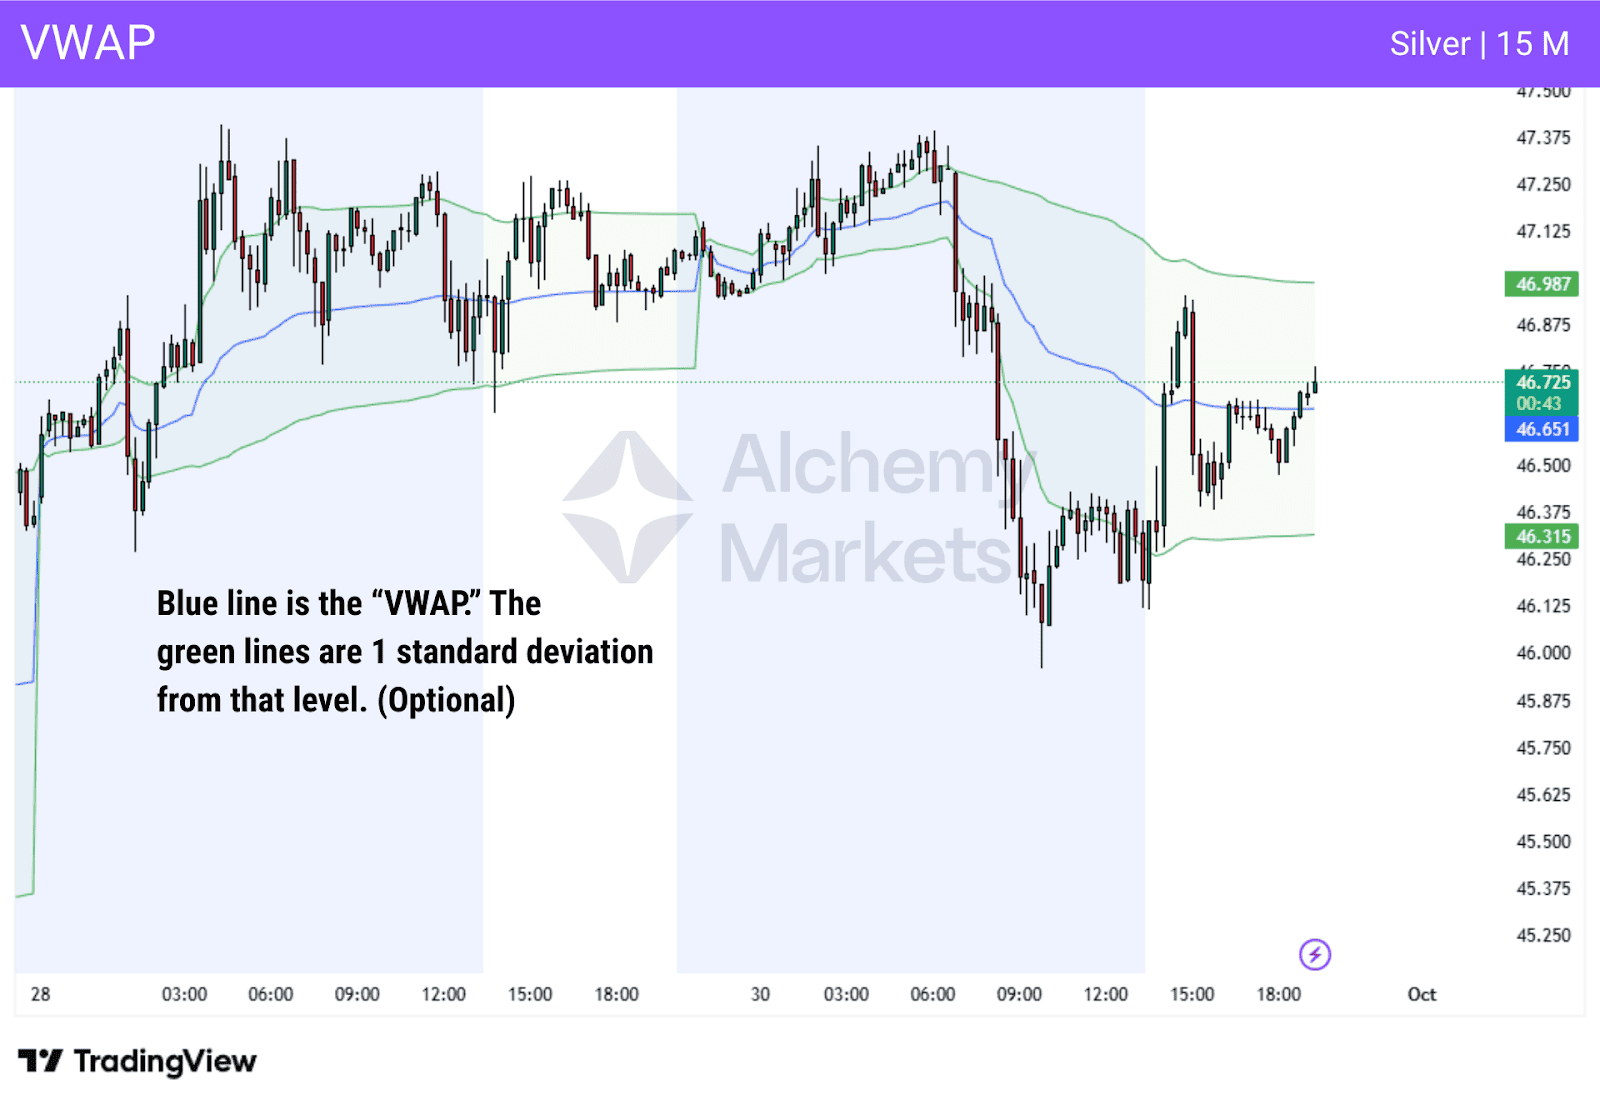
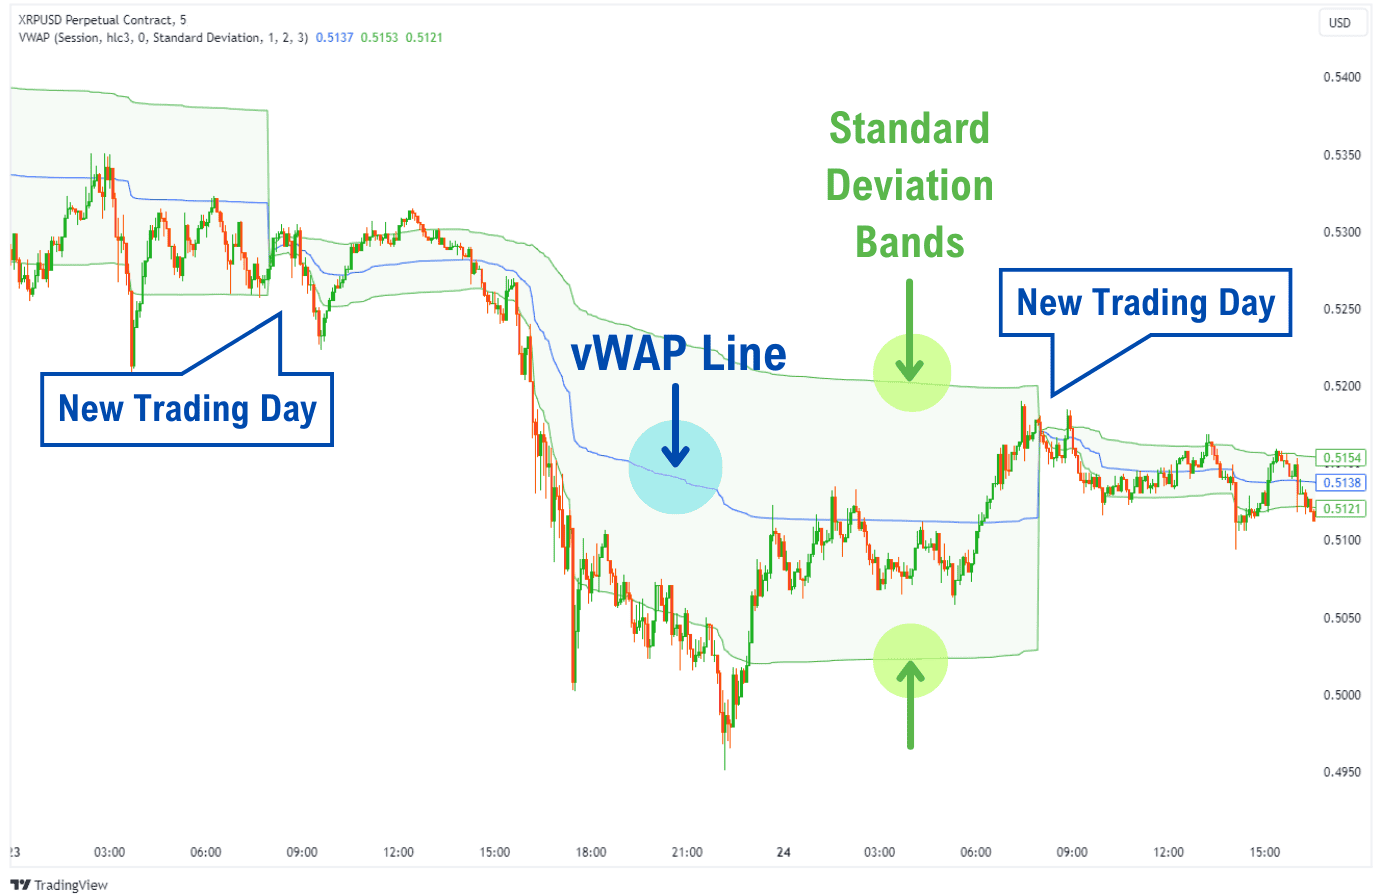
4. Volume-Weighted Average Price (VWAP)
What is it:
The Volume Weighted Average Price indicator shows the price and volume that is where the most trades taken in a security. Beyond simple trading volume, it also shows the most common price of the most traded volume, showing the trend through the eyes of “bigger players.”
How does it work:
VWAP helps eliminate noise in the markets as it shows where most of the bigger volume is trading. When the price rises above VWAP, it is considered to be a bullish trend, while price movements below VWAP are typically thought of as bearish.
Why traders use it:
Traders will use this indicator to see the typical price of transactions, which can show and gauge market sentiment. Also, some traders will use it as potential support and resistance as well. VWAP is used by many institutional traders, making it a favourite of traders worldwide.
Recommended Settings: Use session or weekly vWAP for daytrading. Use anchored vWAP for swing trading.
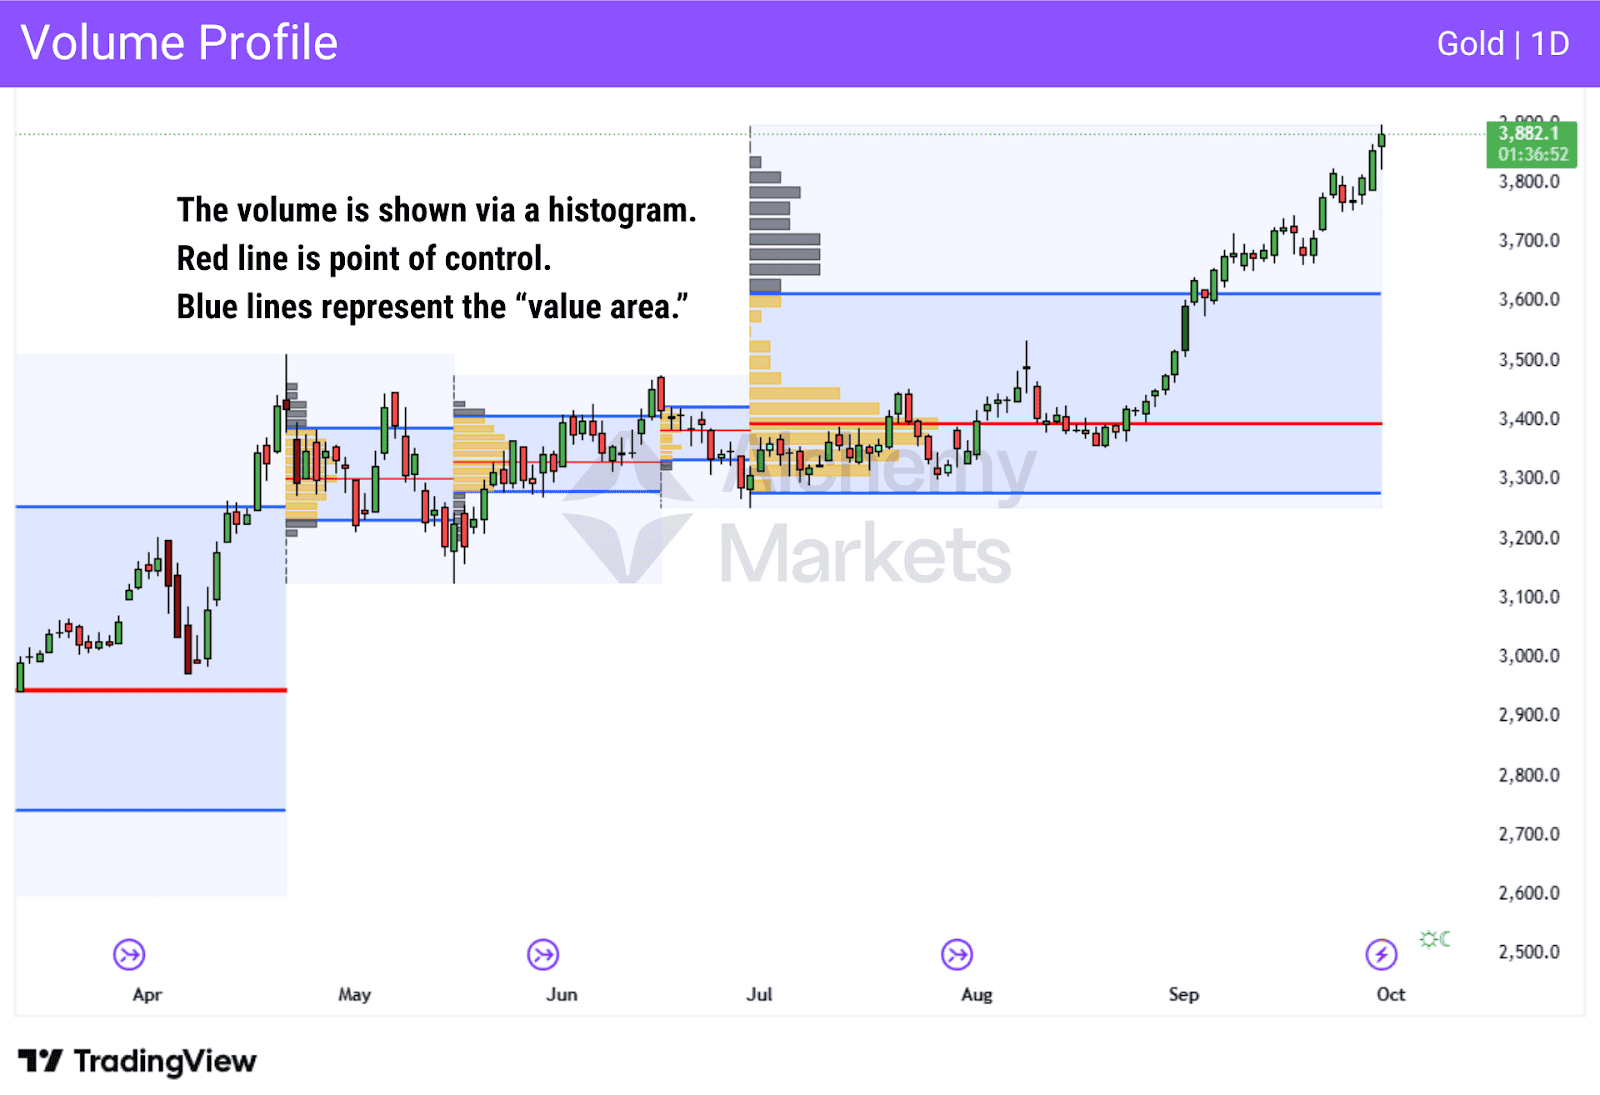
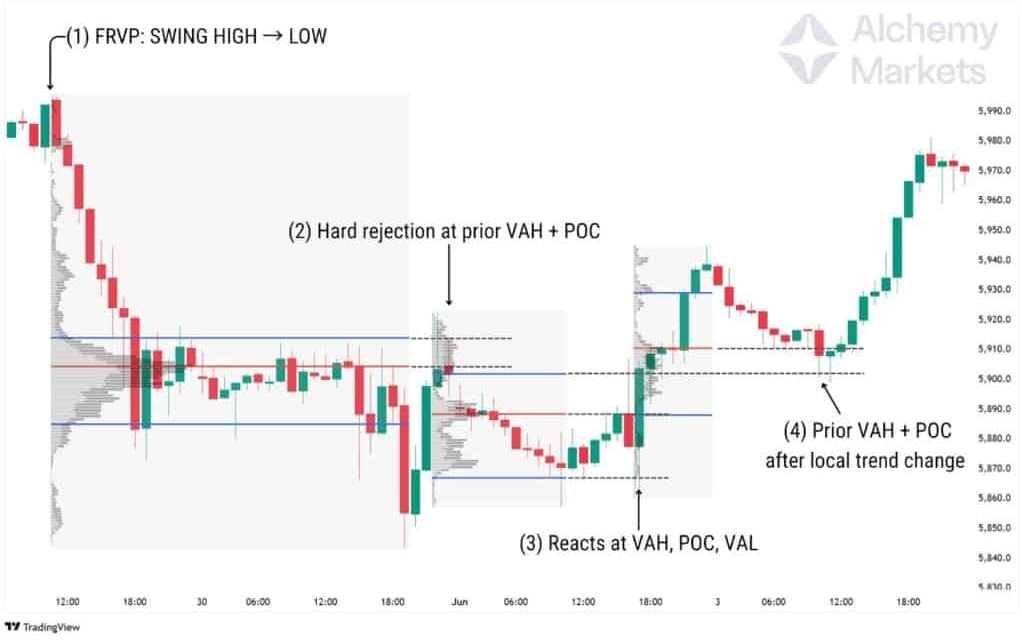
5. Volume Profile Indicator
What is it:
The volume profile indicator is used to display total trading volume at different price levels in a market. At this point, the indicator gives a point of control, a value area, and plots nodes of both high volume and low volume.
How does it work:
Each price level will record a certain number of transactions, printing a sideways histogram on the chart that will allow you to visualise price movements in the spectrum of where the largest amount of transactions happened. It will also show where the most volume was traded, known as the point of control. The value area is typically plotted with 70% of the total volume traded in that range.
Why traders use it:
The volume profile indicator is used to show where nodes of volume can be found on a chart. That being said, it is typically used in futures and stock markets, where volume is easily found and disseminated by traders to give hints on where we are going.
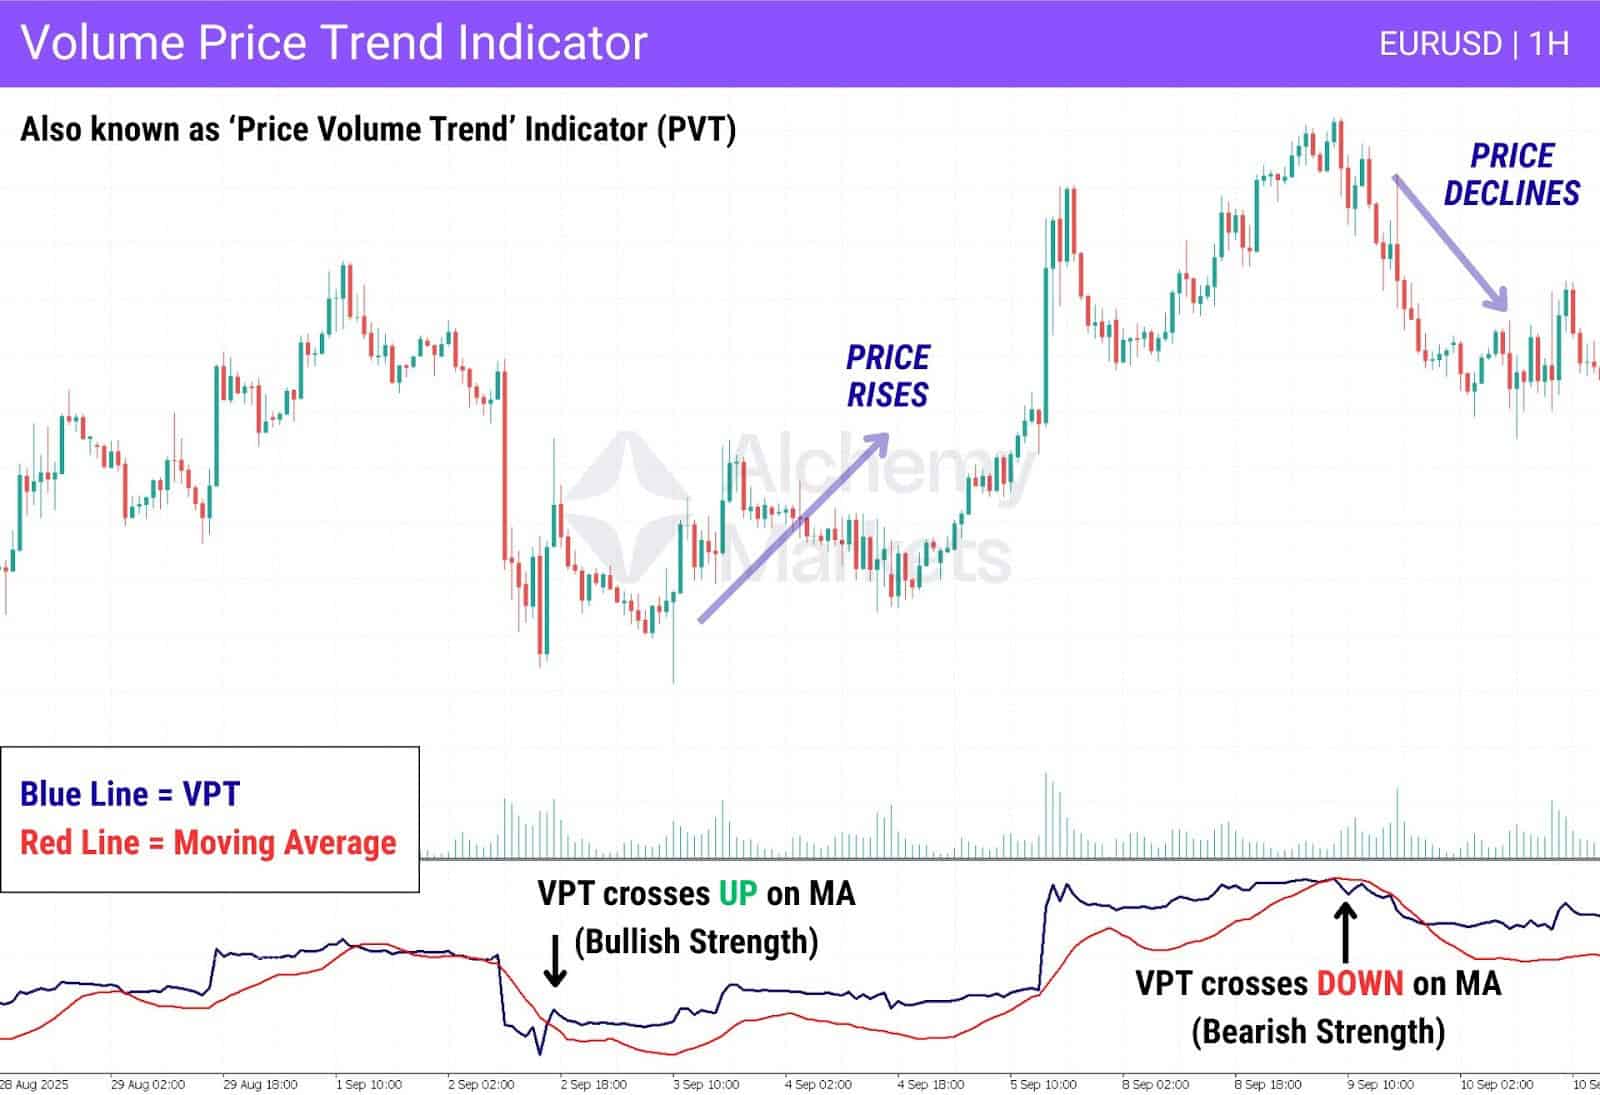
6. Volume Price Trend Indicator (VPT)
What is it:
The Volume Price Trend indicator shows the price direction and the strength of that price movement. It has a cumulative volume line that will add or subtract a multiple of the percentage change in the price trend and current volume, reflecting upward or downward movements.
How does it work:
The indicator will show the balance between supply and demand for an asset. The percentage change in price shows the relative supply or demand for the market, while the volume in the indicator shows the pressure in the move. The VPT line crossing the moving average line, or signal line in the indicator, shows the direction of the potential trading signal.
Why traders use it:
Traders like to use this indicator because it clearly shows the overall trend and the force behind it. Price movements are looked at through the prism of the momentum and demand versus supply, and therefore, it can give a “heads up” on market sentiment.
7. Volume RSI (VRSI)
What is it:
Volume RSI is similar to the standard RSI indicator, but instead of price, it uses volume to print the results. Like most volume indicators, it focuses on the volume traded in a market in relation to buying pressure and selling pressure.
How does it work:
The volume RSI indicator plots a 50 centre line, with the overall range between 0 and 100. The idea is that when the Volume RSI is above the 50 level, the indicator is flashing a bullish signal. Alternatively, if it breaks below the 50 level, it can send a bearish trading signal. Some traders will also use it for signs of divergence.
Why traders use it:
Traders love the simple interface and the clear signal that this technical indicator tends to produce. For example, in an upward trend, if the Volume RSI breaks above the 50 level, traders will look at that as further confirmation. Positive or negative divergences can also be spotted for those who prefer those trading signals.
Recommended Settings: 14-period standard; 7–9 for quicker feedback in fast markets.
8. Chaikin Money Flow Indicator
What is it:
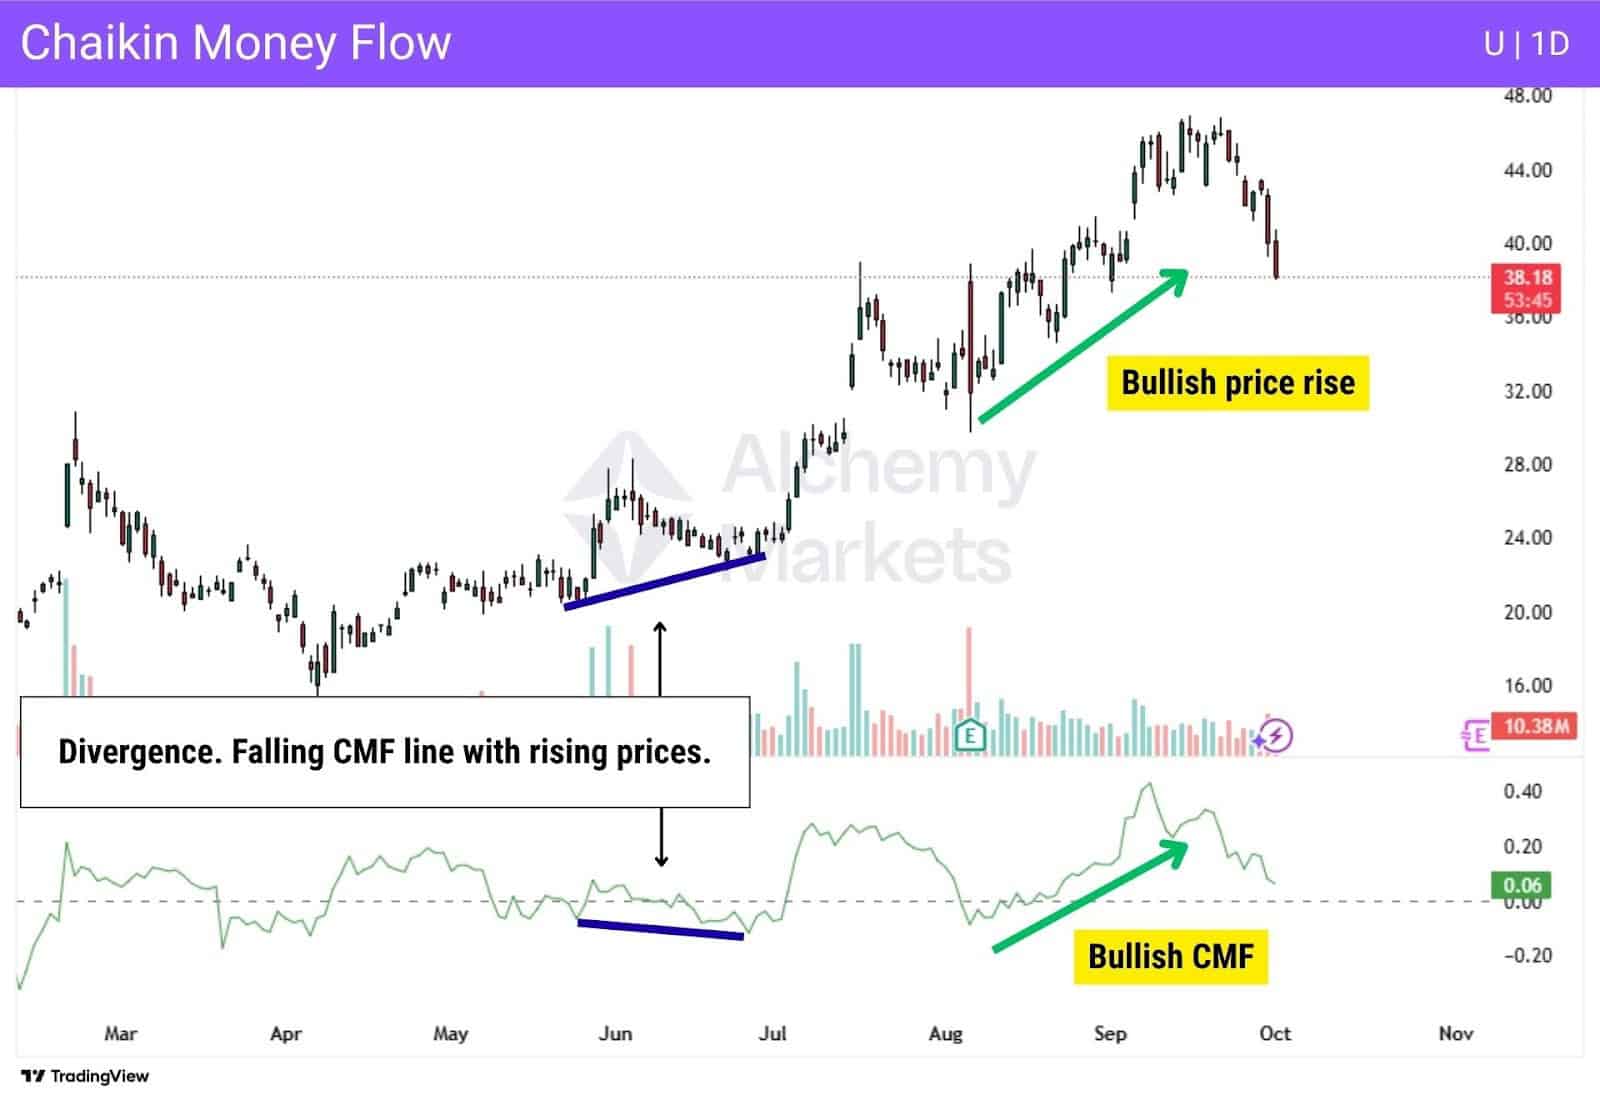
The Chaikin Money Flow Indicator is a volume indicator that helps measure the flow of money into or out of a market over a period of time. The idea is to find strength or weakness in a market, or overbought and oversold conditions.
How does it work:
The Chaikin Money Flow Indicator adds the money flow volume for a look-back period, normally 20 or 21 days, although this can be different depending on the trading system being used. The volume indicator fluctuates above and below a zero line, like many oscillators.
When the CMF value is above the zero line, it suggests strength. When it is below the zero line, it suggests weakness. There are also overbought and oversold signals, suggesting a potential turnaround. Furthermore, divergence can also be spotted.
Recommended Settings: 20- or 21-day period standard; shorten to 10–14 for quicker reactions.
Why traders use it:
Traders like the versatility of the CMF, as it can show so many different signals and signs of where the market seems to be heading, as well as when it is overdone. The volume indicator is popular, and a lot of people will find it helpful.
9. Accumulation/Distribution
What is it:
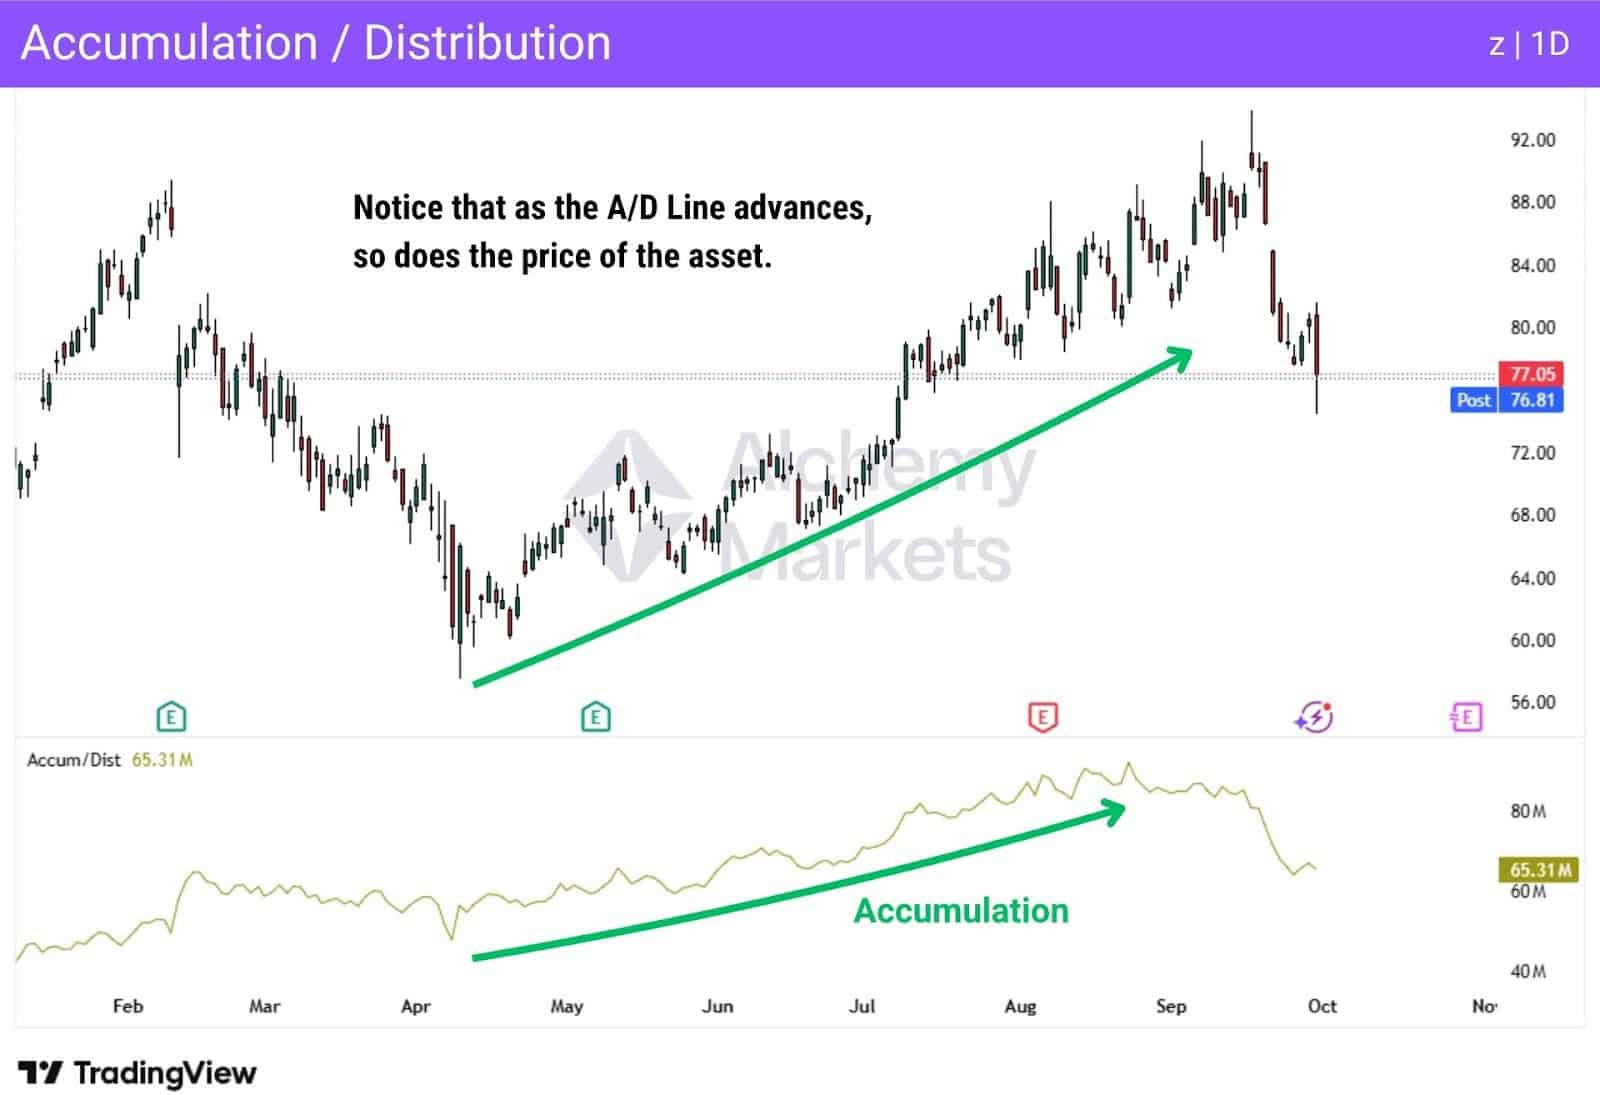
The Accumulation/Distribution indicator is a volume indicator that helps determine the supply and demand of an asset. The idea is that it can try to determine if a stock is being accumulated (bought) or distributed (sold).
How does it work:
The A/D line shows the potential accumulation or distribution of an asset, with a rising line showing more buying, and a falling line showing more selling. Traders will also look for divergence with price, as it can show a potential turnaround in the trend.
Why traders use it:
Traders like the way it clearly shows the idea of further buying in the market or selling it. The indicator is used in conjunction with price action, as it can confirm what is going on in the price chart. It can also show when there is divergence, and this is also a favourite indication using this technical indicator.
10. Klinger Oscillator
What is it:
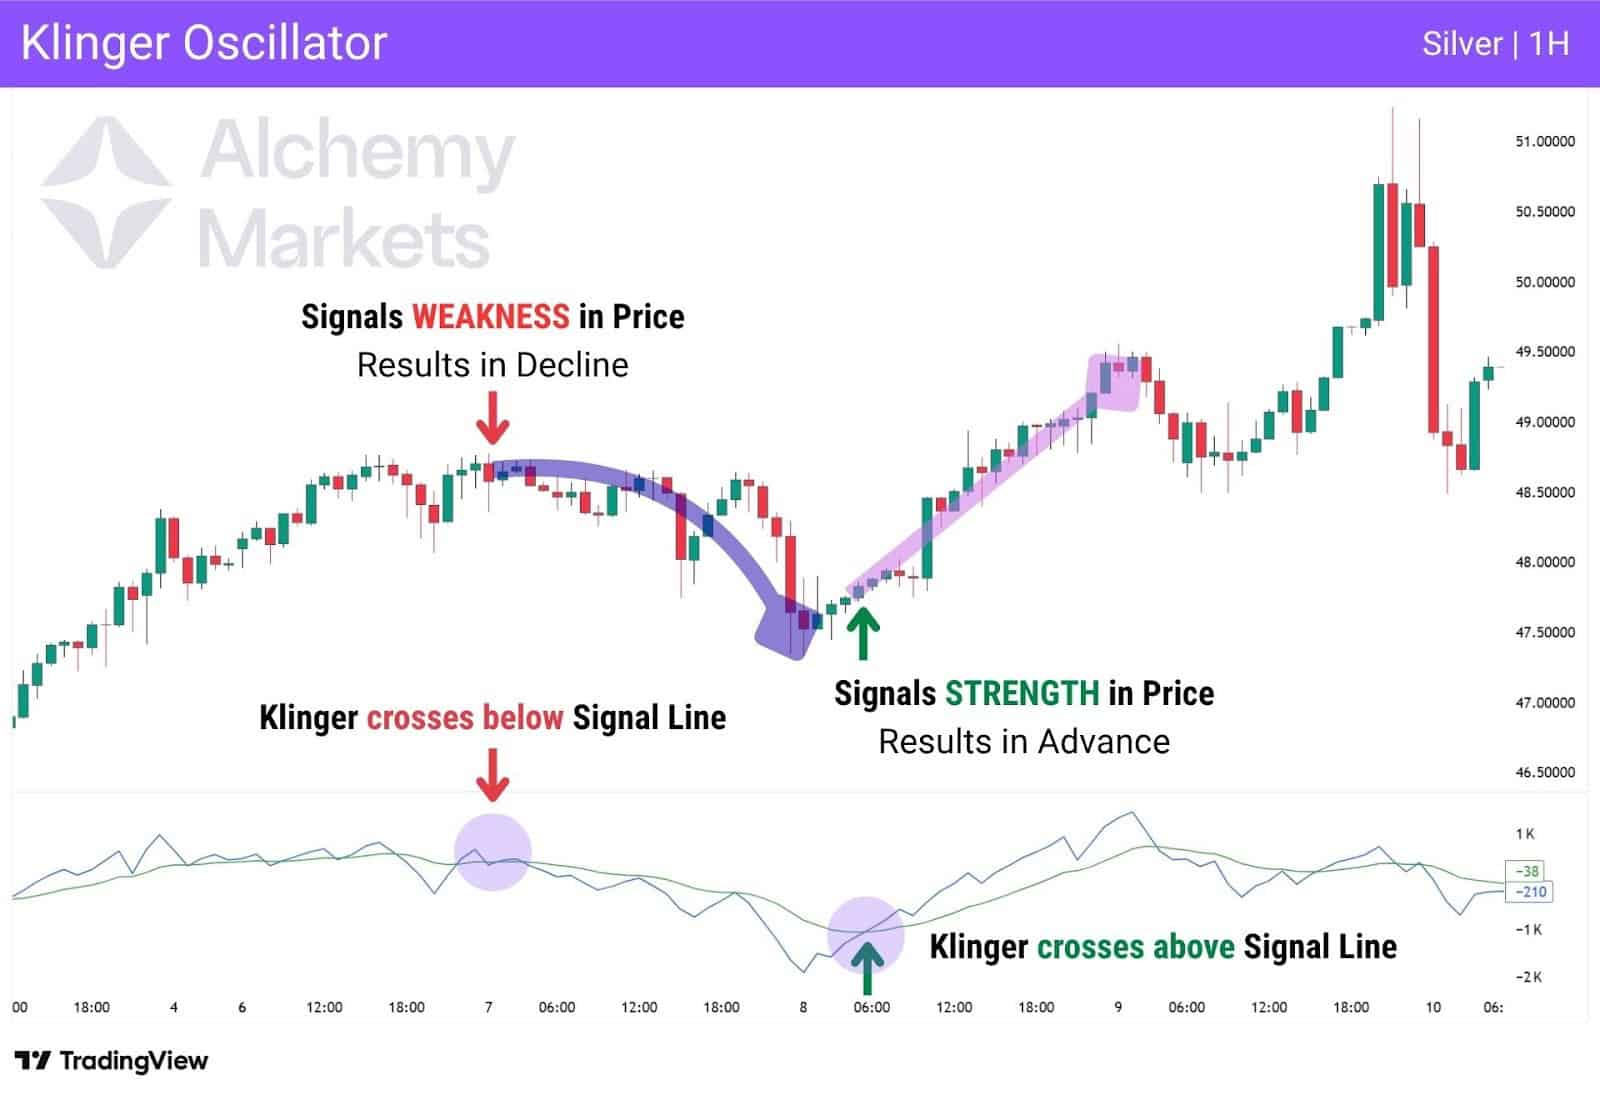
The Klinger Oscillator, named after its inventor Stephen Klinger, has been around since 1977. The oscillator helps to predict long-term trends in monetary flows, but also remains sensitive to short-term price movements.
How does it work:
This volume indicator shows the difference between two exponential moving averages and how the volume influences direction. A crossover of the two moving averages can be thought of as a potential reversal trading signal, while the two averages moving in the same direction can show confirmation of the trend.
Why traders use it:
The simplicity of the information shown in this volume indicator is one main reason, and the ability to follow longer-term trends tends to attract a lot of followers of this indicator. However, it can generate false signals if not used with other technical analysis tools.
Recommended Settings: 34- and 55-EMA base with 13-signal line; adjust for volatility.
11. Ease of Movement Indicator (EOM)
What is it:
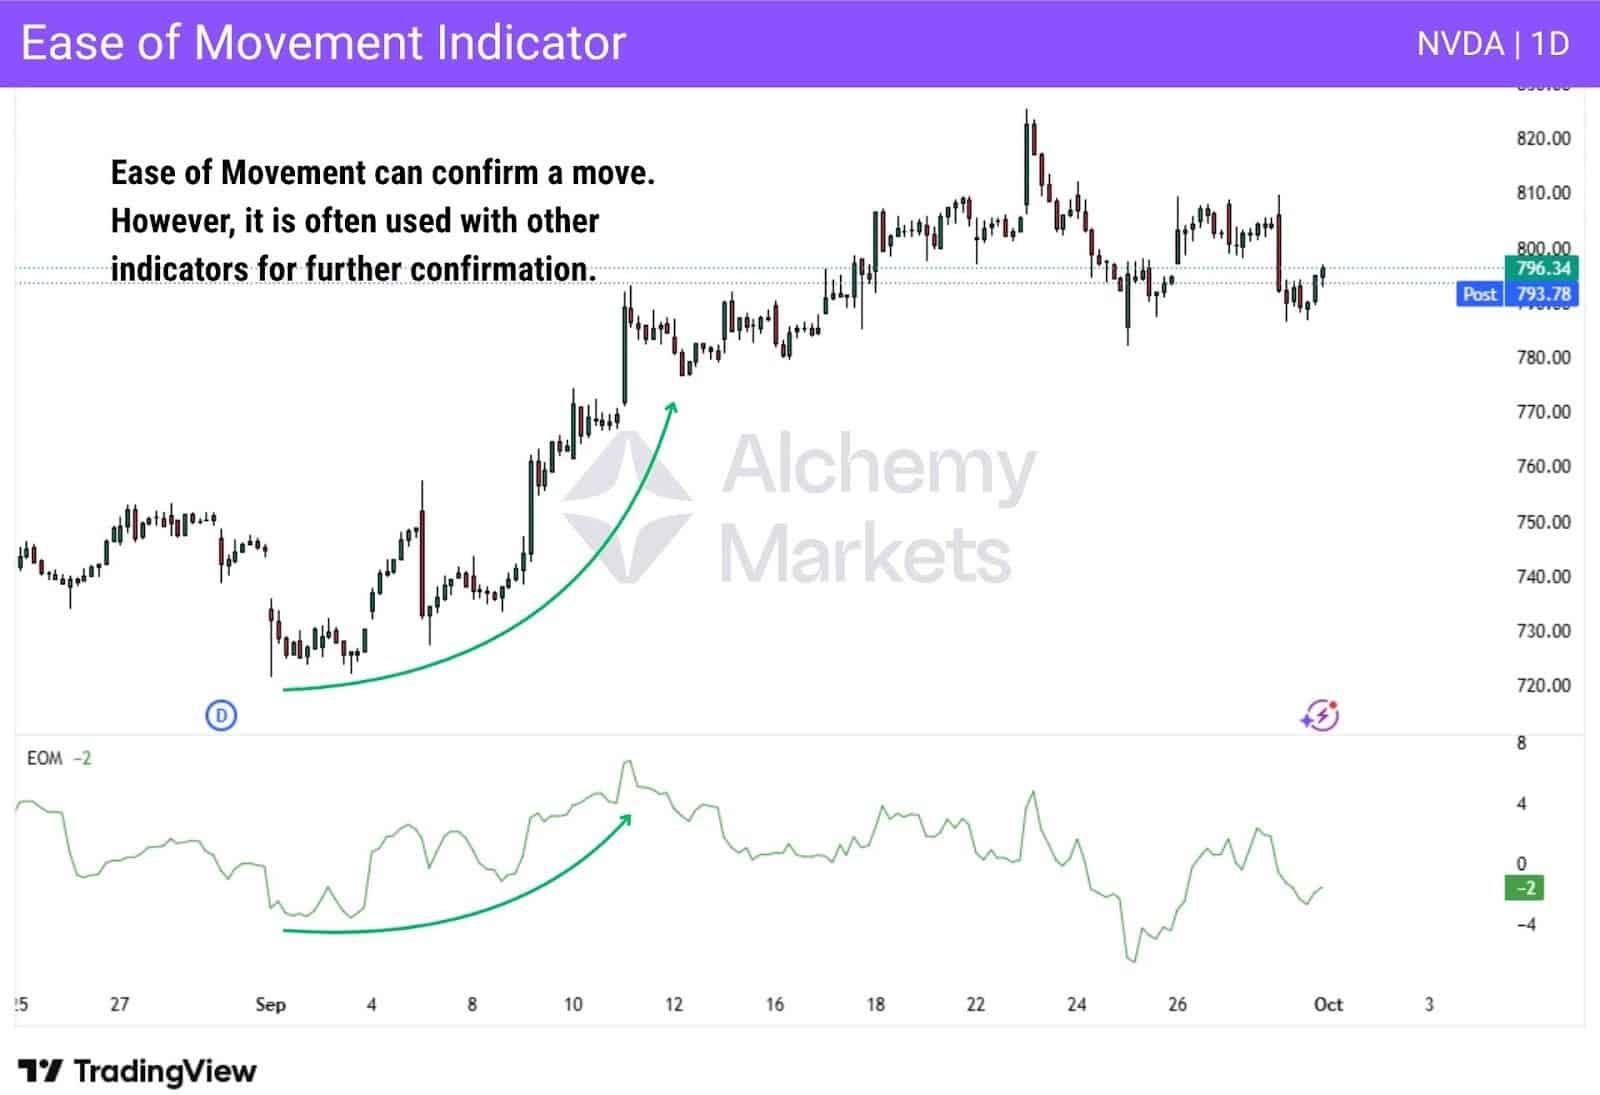
The Ease of Movement indicator is a technical analysis indicator that measures the correlation between price changes and trading volume. It shows positive and negative values, and uses a moving average to smooth out signals.
How does it work:
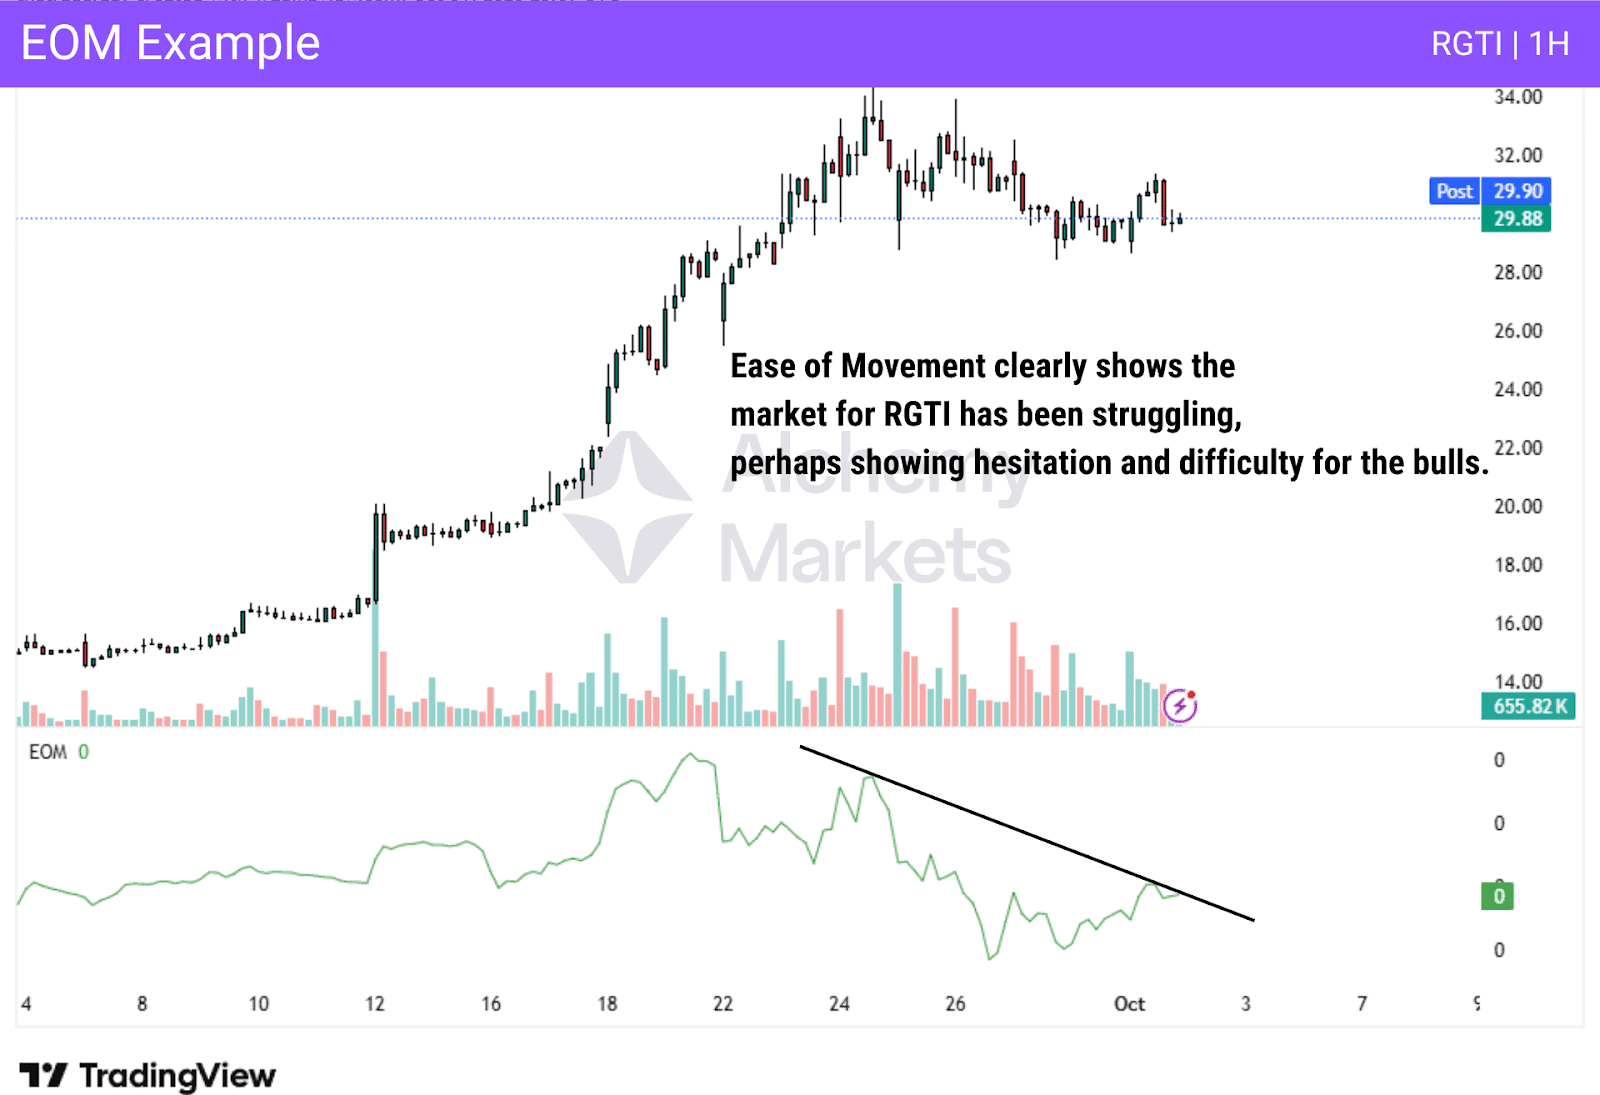
The indicator takes the distance moved, a “box ratio” which is a way to measure volumes as well, and then uses an exponential moving average to smooth things out. It will show a positive, negative, or zero reading. When there are positive readings on the indicator, it shows the market is rising with ease. When falling and negative, it shows the market is falling with relative ease as well.
Why traders use it:
Traders use this volume indicator to verify trading signals and to see how easy a move is being produced, with the idea that the easier it is, the more likely it is that continuation will come into the fray.
The standard 14-period smoothing is ideal for most traders, though swing traders may extend it to 20 for a cleaner signal. Intraday traders often drop it to 10 to better catch quick shifts. Fine-tuning these smoothing periods is a simple way to find your volume indicator best settings.
Recommended Settings: 14-period smoothing typical; shorten to 10 for intraday or extend to 20 for swing.
12. Positive Volume Index (PVI)
What is it:
The Positive Volume Index is a volume indicator that uses volume and price to show how price movements are driven by positive days. Most of the time, it is used in conjunction with the Negative Volume Index to see how volume on both sides of the trade is influencing price action.
While this volume indicator can be used by itself, it is often paired with the negative version to see what is moving under the hood to drive prices in the market.
How does it work:
The Positive Volume Indicator measures how volume compares between the current session and the previous one. If the current volume ends up being lower, there will be no change with this indicator.
If the volume is higher during this session than the previous one, then the PVI is calculated using those inputs. Often, traders will use trendlines on the indicator to follow bigger money.
Why traders use it:
Traders will typically use this volume indicator to determine whether the positive volume is increasing, thereby showing positive momentum. It is common to use this indicator with the Negative Volume Index to determine which of the two types of volume is stronger.
13. Negative Volume Index (NVI)
What is it:
The Negative Volume Index is a volume indicator that includes volume and price to show how price movements are influenced by down days. Often, it is used in conjunction with the Positive Volume Index to see how volume influences price action.
While it can be used on its own, this volume indicator tends to pair with the positive version to give a complete picture of everything that is going on under the hood in the markets.
How does it work:
The indicator measures how volume compares between the current session and the previous one. If the current volume is higher, there will be no change. If the volume is lower, then the NVI is calculated given those inputs. Often, traders will use trendlines on the indicator to follow bigger money.
Why traders use it:
Traders can use this volume indicator to determine whether the down volume is increasing, thereby showing negativity. It is common to use this indicator with the Positive Volume Index to get “both sides of the story.”
14. Trade Volume Index (TVI)
What is it:
The Trade Volume Index is a technical indicator that measures the flow of money into or out of a market based on price changes and volume. This helps traders determine whether there is accumulation in a market or distribution.
How does it work:
The indicator calculates the minimum tick value (MTV), which is often set at 0.5. The price change is also calculated from the intraday price minus the last intraday price. If the change in price is greater than the MTV, then the TVI shows accumulation. If it is lower, then it shows distribution.
Why traders use it:
TVI is used to calculate unseen accumulation and distribution in a financial market. It is a bit esoteric, but there are a lot of uses for the indicator, as it can often give a “heads up” to changes in the market behaviour from a short-term perspective.
What Is The Best Indicator For Volume?
There’s no single “best” volume indicator. The success you get from applying them to your strategy will depend on the eligibility of your strategy itself, and also the liquidity of the markets.
| Popular Volume Indicators by Market | |
| Forex Markets | Used to gauge market participation (tick-based, due to no centralized exchange). Popular indicators include On Balance Volume (OBV), Volume Price Trend (VPT), and Positive/Negative Volume Index (PVI/NVI). |
| Stock Market | Used to measure buying and selling pressure (utilizing real transaction data). Popular tools are the Money Flow Index (MFI) and Chaikin Money Flow (CMF). |
| Futures and Indices | Used to highlight largest traded volumes and areas of institutional activity. Key indicators are the Volume Profile and VWAP (Volume-Weighted Average Price). |
Ultimately, the most effective indicator is one that fits your trading system and helps confirm your read on market structure, not just price.
What Is The Best Volume Indicator For Options Trading?
When trading options, one of the most popular volume indicators available is the put-call ratio. The put-call ratio will measure the difference between the number of puts bought and the number of calls bought.
The higher the number, the more bearish the indicator becomes. The lower the number, the more bullish the situation can be. This is a common indicator that both options traders and stock traders will use in their trading systems.
Best Volume Indicator for Day Trading
While there is no single “best” indicator, the most popular and effective volume indicators for day trading are the Volume-Weighted Average Price (VWAP) and the Volume Profile.
VWAP (Volume-Weighted Average Price):
- This is a favorite among institutional traders and day traders. It calculates the average price of an asset based on both price and volume within a single trading day, resetting at the start of each new session.
- Traders use it as a benchmark for value; trading above the VWAP is often seen as bullish for the day, while trading below it is seen as bearish. It also acts as a dynamic level of support or resistance.
Volume Profile:
- This tool is essential for day traders as it displays the total volume traded at specific price levels, rather than over time. It highlights the “Point of Control” (the price with the most volume) and “Value Area” (where 70% of the day’s volume occurred).
- This allows day traders to instantly see key support and resistance zones based on where the market has shown the most interest.
Best Volume Indicator for Swing Trading
For swing trading, which spans several days to weeks, traders typically prefer volume indicators that measure cumulative buying and selling pressure and help identify overbought or oversold conditions. The most common choices are the On Balance Volume (OBV) and the Money Flow Index (MFI).
On Balance Volume (OBV):
- This is a powerful cumulative indicator that adds volume on up-days and subtracts it on down-days. For a swing trader, a rising OBV confirms that volume is flowing in to support a bullish price swing (and vice versa for a bearish swing).
- Divergences between price and OBV often serve as early warnings of a trend reversal, helping swing traders position ahead of a full market reversal.
Money Flow Index (MFI):
- This indicator is often described as a “volume-weighted RSI.” It measures both the speed of price changes and the volume associated with them.
- For swing traders, the MFI is excellent for identifying overbought and oversold conditions (typically above 80 or below 20), which can help time entries and exits at the extremes of a market swing.
What Indicators Work Best With Volume Indicators?
Momentum indicators like RSI or MACD pair well with volume tools to highlight divergences, which highlights the potential for a reversal. This combination helps traders filter out higher probability setups.
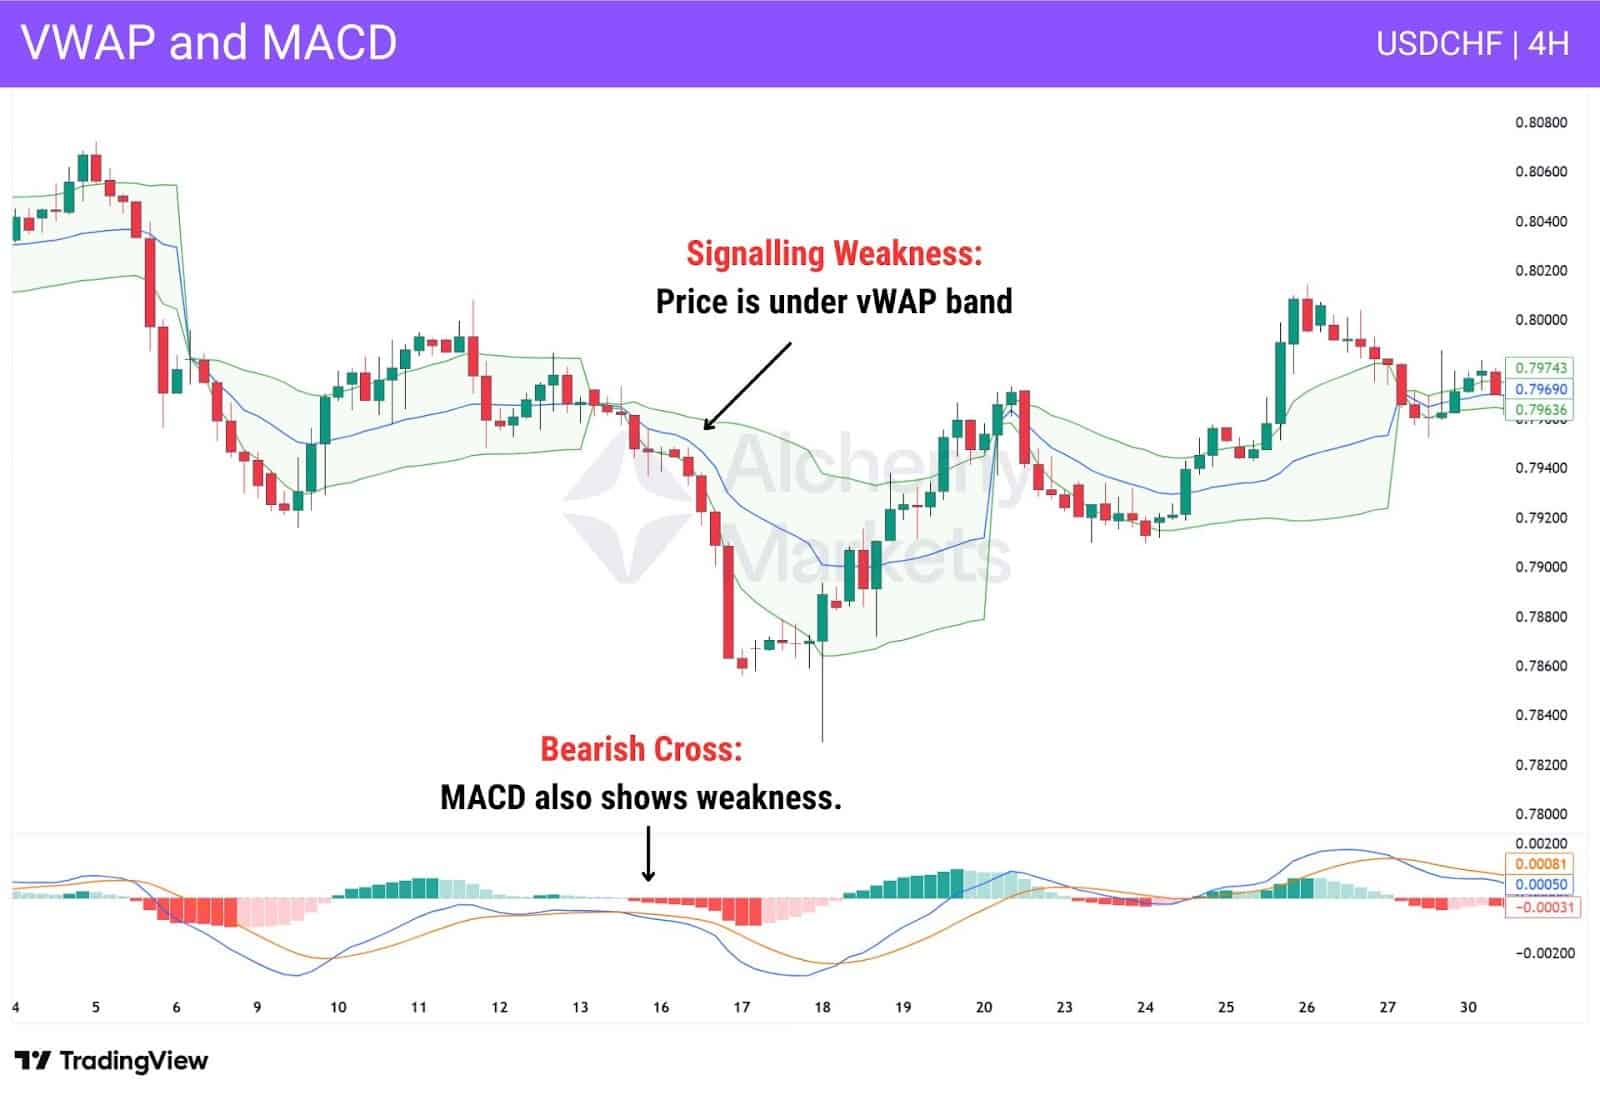
For example, when price drops below the VWAP’s standard-deviation band, it signals weakness but can also set up a return toward the VWAP line. Pairing VWAP with a momentum indicator such as MACD clarifies whether that rally is a true reversal or just a short retracement.
If price re-enters the VWAP band while MACD still shows weakness, it suggests the VWAP will likely act as resistance.
Advantages of Trading with Volume Indicators
- Easy to interpret: Volume indicators are typically easy to understand and use.
- Effective across all timeframes: Volume is universal across timeframes.
- Universal: Volume is useful in multiple financial markets.
- Works with other tools: Volume can often complement other indicators.
Disadvantages of Trading with Volume Indicators
- Data: Some markets, like FX and CFDs, have no centralised volume data.
- False signals: Volume indicators can sometimes generate false signals.
- Lagging indicator: The volume indicator is lagging, showing past activity.
- Limited predictability: Volume cannot predict future behaviour.
FAQ
What is the most common time frame for measuring volume?
The most common time frame used for volume analysis is the daily time frame. While many volume indicators can be used in different time frames, most of the time volume is referenced on the daily time frame.
What trading signals can be provided by volume?
Many traders will use volume to confirm multiple trading signals, including:
- Confirming breakouts and breakdowns.
- Spotting trend reversals in a market.
- Identifying market strengths and weaknesses.
- Timing entries and exits in a market.
In the case of a pullback, how can volume be interpreted?
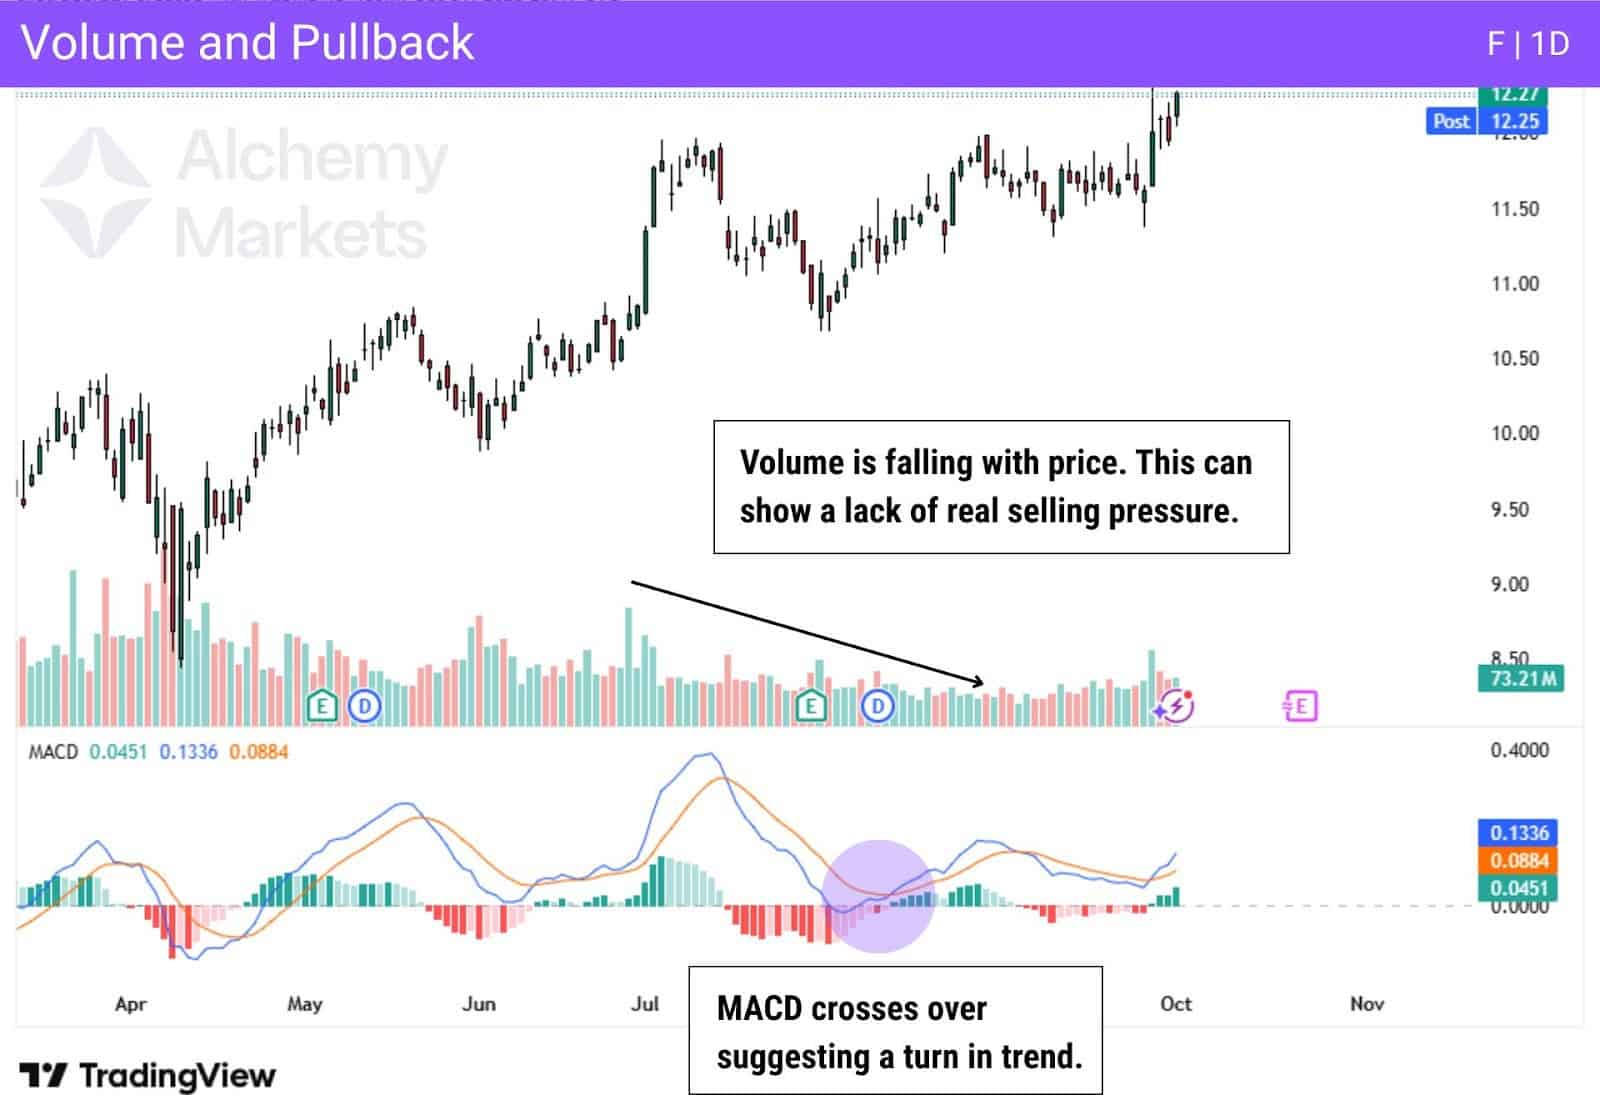
In case of a pullback, volume can be very important in order to indicate the strength or weakness of a move. If the volume is low and the pullback is occurring, it could signify that the pullback and selling pressure are temporary.
As with most things involving technical analysis, volume matters. With a lack of volume, it shows that the underlying condition is a short-term phenomenon.
What volume indicator is most reliable?
There is no way to determine what the best volume indicator is, as technical indicators can vary in effectiveness in different market conditions. While future price movements can be inferred, the reality is that the indicator that a trader chooses will be a personal decision.
There are many popular volume indicators that you can use, as seen in this article. Many trading strategies will employ volume indicators to assist in technical analysis.
Which Volume indicator has the highest accuracy?
While this is a tricky question to answer, many traders rely on the On Balance Volume indicator to measure volume in markets where the data is available. Other technical indicators that are popular due to their usefulness and accuracy include Money Flow Index, Volume Weighted Average Price, and Chaikin Money Flow.
How do volume indicators work?
Volume indicators used in technical analysis can calculate a value based on tick volume, as well as contract or monetary volume. Both are commonly used in technical analysis, as well as the subset known as volume analysis.
Tick volume is based on the frequency of changes in price or movements in a market. This reflects the market activity and liquidity. Tick volume is calculated as the total number of deviations in price within one tick, or the minimum price fluctuation.
With contract or monetary volume, the value is calculated by taking the number of trades executed or the funds in the market. The advantage of this type of volume is that every trade will be taken into account, possibly confirming the price trend witnessed.
Is volume a leading or lagging indicator?
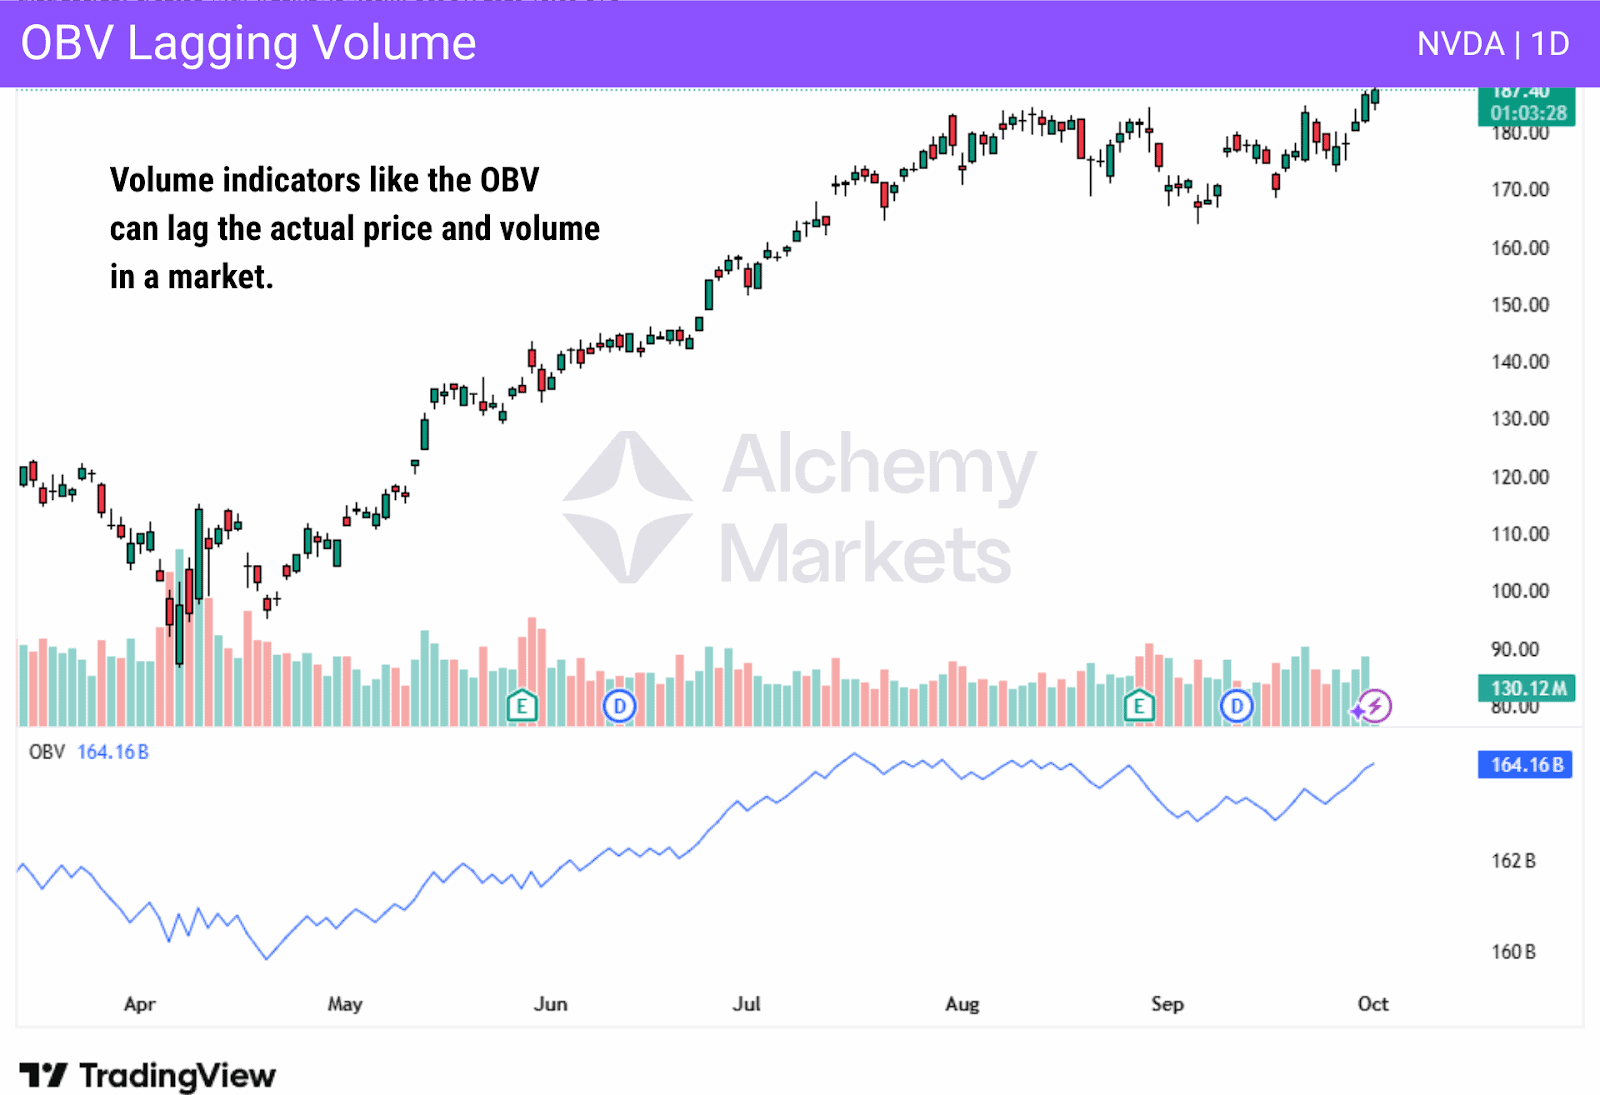
In general, volume is lagging as it is only confirmed what has already happened. The use of volume as a technical indicator is mostly used for confirmation. However, some will use spikes in volume with no price movement as potential accumulation or distribution. Some traders will also use volume indicators to look for divergence.