


Written by:

Reviewed by:


Bullish
- July 17, 2025
- 35 min read
Bear Trap Trading Guide
Imagine this: a bear charges through the woods, hot on the heels of a hunter. The hunter, cornered against a tree, braces for the worst. Suddenly—click. The bear steps into a trap. In an instant, roles reverse. The hunter, once prey, now holds the upper hand.
This isn’t just a wilderness tale; it’s a vivid metaphor for a bear trap in trading. Just when the market seems to be in a relentless downtrend, signaling further losses, it abruptly reverses.
Bear traps are deceptive. They lure in traders with the illusion of a continued downturn, only to snap back violently. It’s a stark reminder that markets can be as unpredictable as nature itself.
So, the next time the charts scream “sell,” remember the hunter and the bear. Sometimes, the trap isn’t set for the prey—but for the predator.
What is a Bear Trap in Trading?
A bear trap is a false bearish signal in technical analysis that tricks traders into shorting only to see the market reverse higher. This sudden reversal often triggers a short squeeze, forcing short sellers to buy back their positions at a loss, and results in a strong move to the upside.
Bear traps are especially common during negative news events, which make the breakdown seem more convincing. While potentially lucrative, they can be equally punishing for traders (bears) caught on the wrong side.
How to Identify the Bear Trap in Trading?
Bear traps are hard to spot in real time because they look like strong bearish signals on the surface. Price breaks key support levels, sentiment turns negative etc., and everything seems to favour the bears.
But to find a bear trap, you need to recognise when the bearish signal is likely to fail. This will look different depending on the setup — and that’s what makes them tricky.
Step 1: Identify a bearish setup.
This could be a clean break below support, a bearish divergence, or something like a death cross (which was especially relevant with Bitcoin in 2021). You’re essentially looking for the point where traders are likely to go short.
Step 2: Watch for signs the bearish move is failing. There are a few ways this shows up:
- A sharp V-shaped recovery back above support.
- Price consolidates below support, then reclaims it.
- A heavy wick below support that fully recovers within the same candle — often driven by extreme fear or liquidity grabs.

Detecting bear traps successfully requires a keen understanding of chart structure, market sentiment, and sometimes even where we are in the market cycle (e.g. the disbelief stage of a market cycle).
How Does Bear Trap Trading Work?
Bear traps work because they align two powerful forces: bearish market psychology and technically valid bearish signals.
Together, they create a setup where the majority of traders are confidently positioned to the downside, which ironically sets the stage for a sharp move in the opposite direction.
There are typically two bullish forces behind a bear trap:
- Institutional buying: Smart money steps in to accumulate discounted assets at high volume, pushing price higher.
- Short squeeze mechanics: A flood of short positions enters the market. Once price starts to recover, these traders are forced to buy back their positions at a loss, accelerating the rally.
Bear traps are most common after a strong rally — a phase when markets begin to believe the asset is overvalued and that a long-term top may be forming.
They tend to occur either as retracements within an uptrend, or during choppy consolidation phases near the highs. This sentiment primes traders to react to any bearish signal as confirmation that the bull run is over.
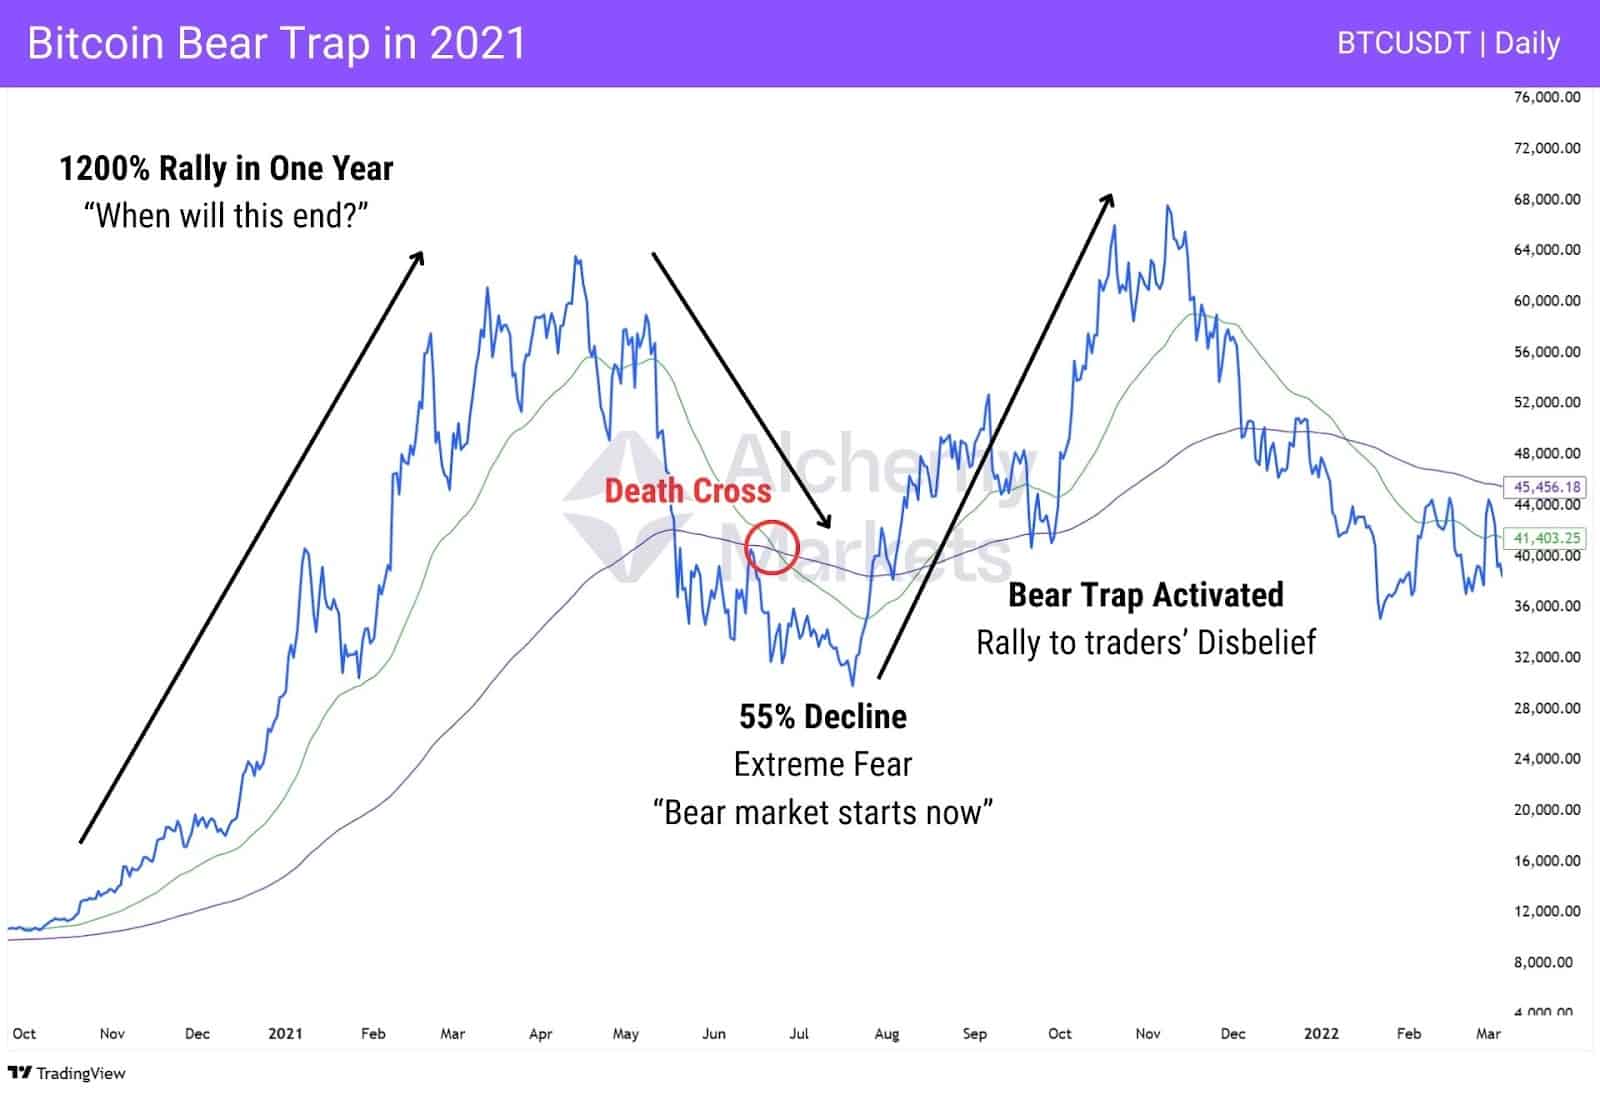
Take Bitcoin’s Death Cross in 2021 as a textbook example.
After a 1200% rally in just one year, the market grew increasingly sceptical that the uptrend could continue. Following a -55% correction, dragging sentiment into extreme fear.
When the Death Cross signal appeared (Daily exponential moving average 50 crossing below the 200), many traders interpreted it as confirmation of a new bear market.
What happened instead? Prices rallied by another 127% rally, pushing Bitcoin to new all-time highs.
This highlights how bear trap crypto setups feed off emotional extremes and well-known technical signals. The market essentially hands traders a convincing reason to go short, but the moment too many do, the trap is sprung.
Bear Trap Chart Patterns
A bear trap can look like a deep retest of a support, or temporary rejection from resistance as price attempts to break out.
While this sounds simple in theory, spotting a bear trap in real time can be incredibly difficult. That’s because it looks convincingly bearish as price slices through support — and that’s exactly why it works in trapping traders to the wrong side.
So in order to spot a bear trap, we need to be flexible with our thinking, and be able to shift from bearish to bullish in an instant. Fortunately, there are signs you can look for in the chart before a bear trap is sprung.
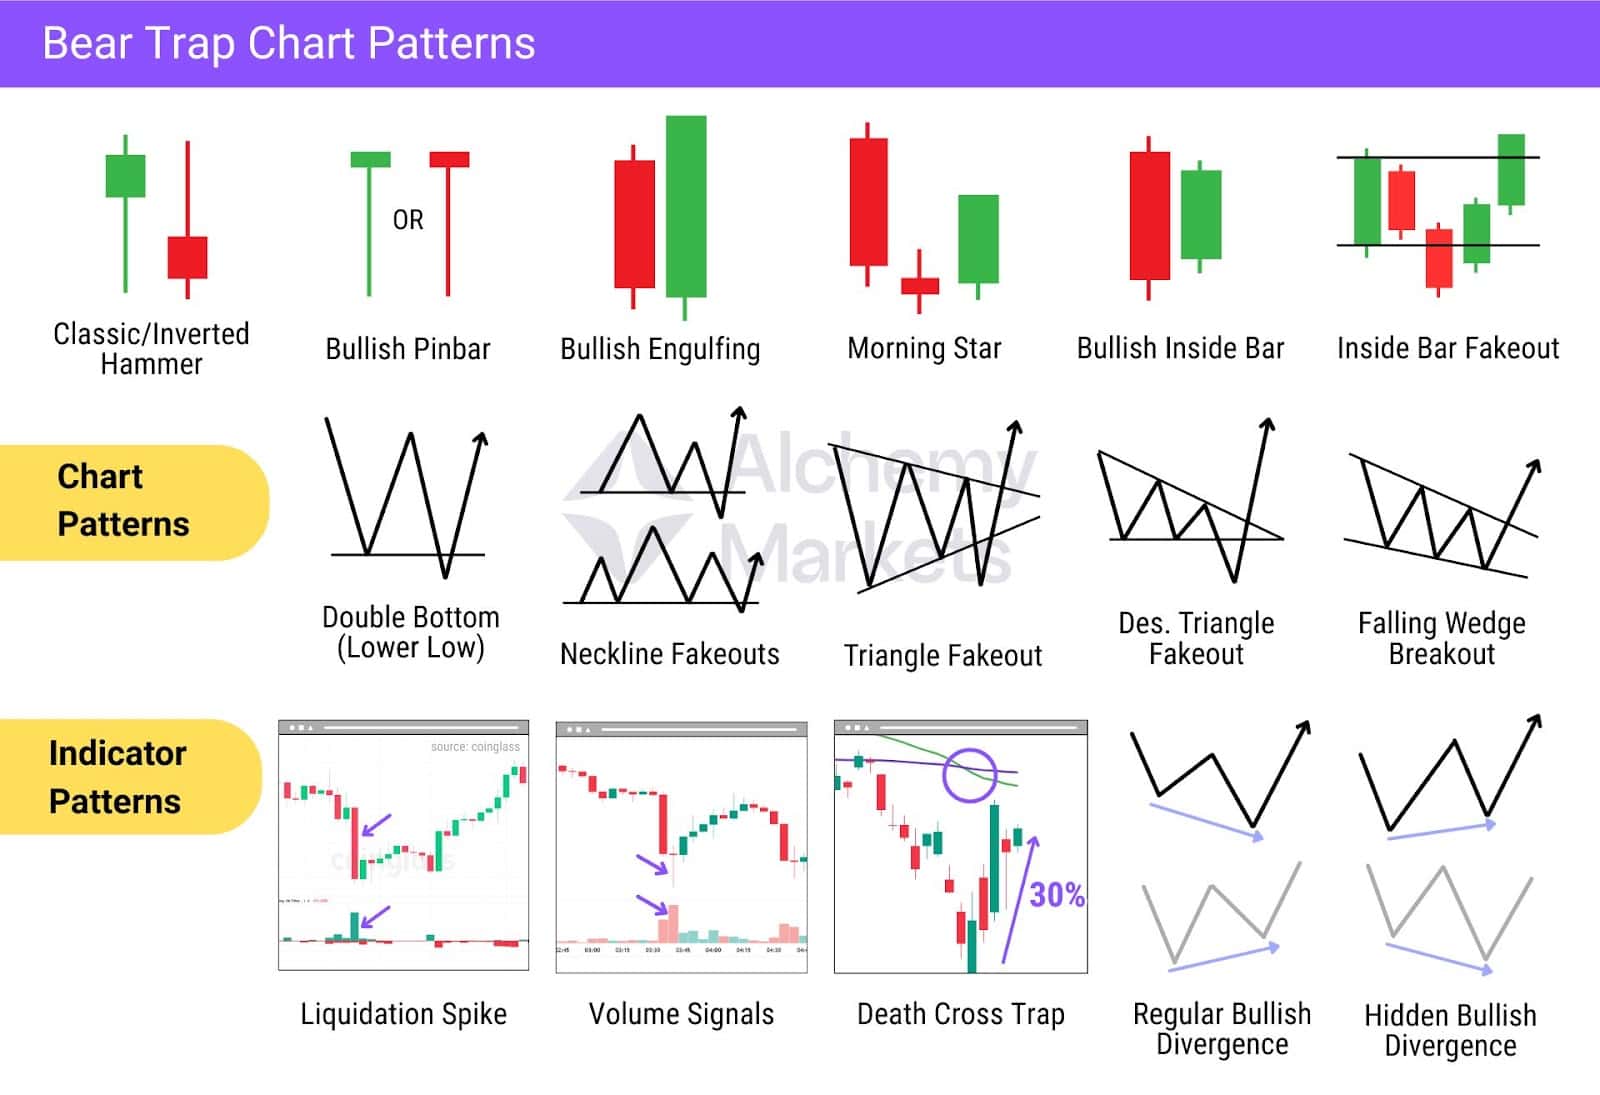
Here’s a simple breakdown of the various ways a bear trap can show up in the chart, and with what indications:
- Bullish Reversal Candlesticks
These candlesticks often appear at the moment the trap is being set. They usually form right after price breaks support and draw in short-sellers, but then flip direction — showing that buyers have stepped in with strength. The most common ones to spot are the hammers, pinbars and bullish engulfing patterns, but they can get as complex as the Hikkake, or Inside Bar Fakeout. In this pattern, the price breaks the inside bar low (bearish trigger), but then sharply reverses higher — catching shorts off guard. - Classic Chart Patterns
In relation to chart patterns, bear traps tend to form in two ways. One is a classic bullish pattern formation, the other is a false breakdown (fakeout) of a bearish pattern.
A double bottom, for example, forms when the price makes equal lows at a price level. But sometimes, the second low can form lower than the first low — quickly sweeping up long liquidity and appearing like a break of support. Alternatively, a descending triangle (classic bearish pattern) can initially break down, but quickly snap back, reclaiming support and rally.
Both scenarios can be equally devastating for bears and bulls, taking out early long positions and tricking bears into aggressively shorting at the lows. This combination of trickery creates the perfect conditions for a short squeeze. - Indicator Patterns
These patterns require tools like oscillators or order flow metrics to spot a bear trap. Bullish divergence, volume spikes, and liquidation spikes are all key signals that the downtrend may be ending. When these occur near support or during a false breakdown, they often signal a trap is forming and a bullish reversal may follow.
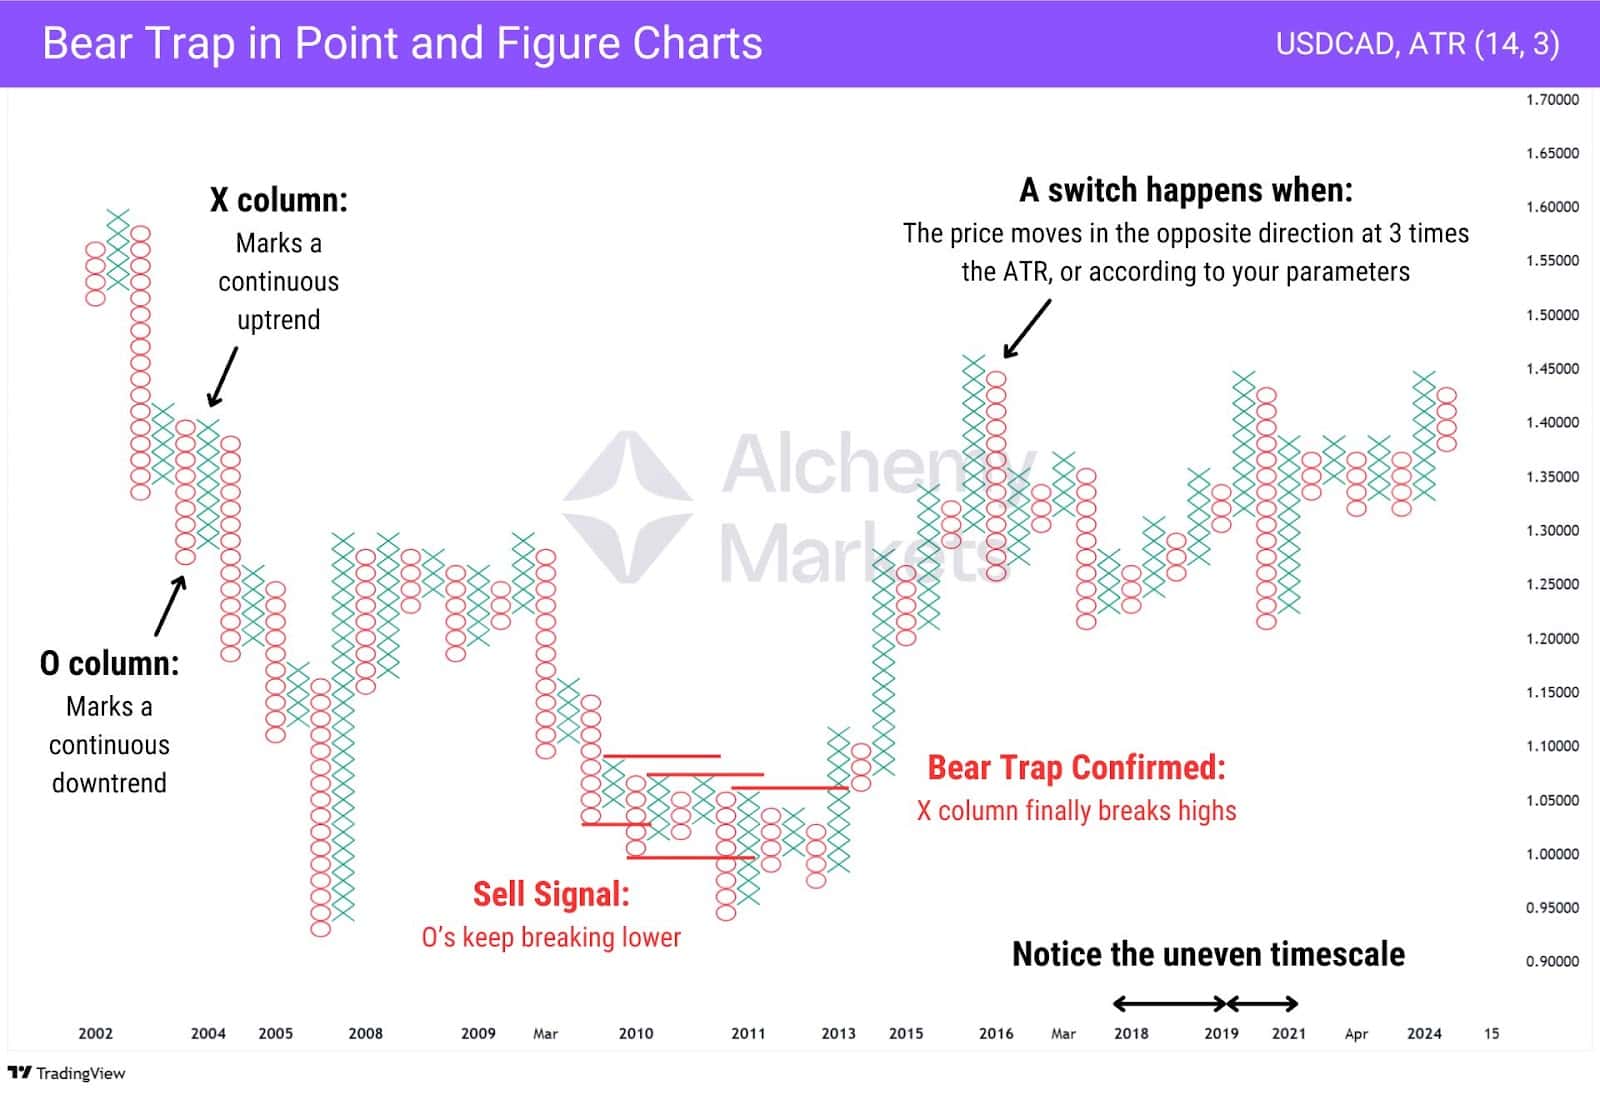
Bear Traps in Point and Figure Charts
Bear traps are still defined the same way on a Point and Figure (P&F) chart as they are on a line or Japanese candlestick chart. However, since P&F charts plot price action only—ignoring time—how you read and trade a bear trap is slightly different.
Confusing to grasp, we know. Especially if this is the first you’re hearing about P&F charts, but think of it like this:
- If there was a tug of war, the referee doesn’t record every twitch of the rope.
- They only mark progress when one side clearly pulls the rope far enough.
- And if the rope swings back the other way? They don’t switch scores until the new side pulls far enough.
That’s how Point and Figure works. It filters out noise and only plots clear directional moves.
So, when the bears seem in control (with O’s breaking lower and X’s not breaking its prior highs), the bear trap is revealed when the bulls come back strong with X’s breaking above a prior high.
Bear Trap Trading Example
From 2007 to 2009, the S&P 500 plunged over 57% during the U.S. financial crisis — a prime bear trap stock market environment where sentiment was deeply bearish, setting the stage for a sharp reversal. As price broke down, traders grew increasingly confident in their short positions, setting the stage for a classic bear trap that ultimately triggered the next bull market cycle.
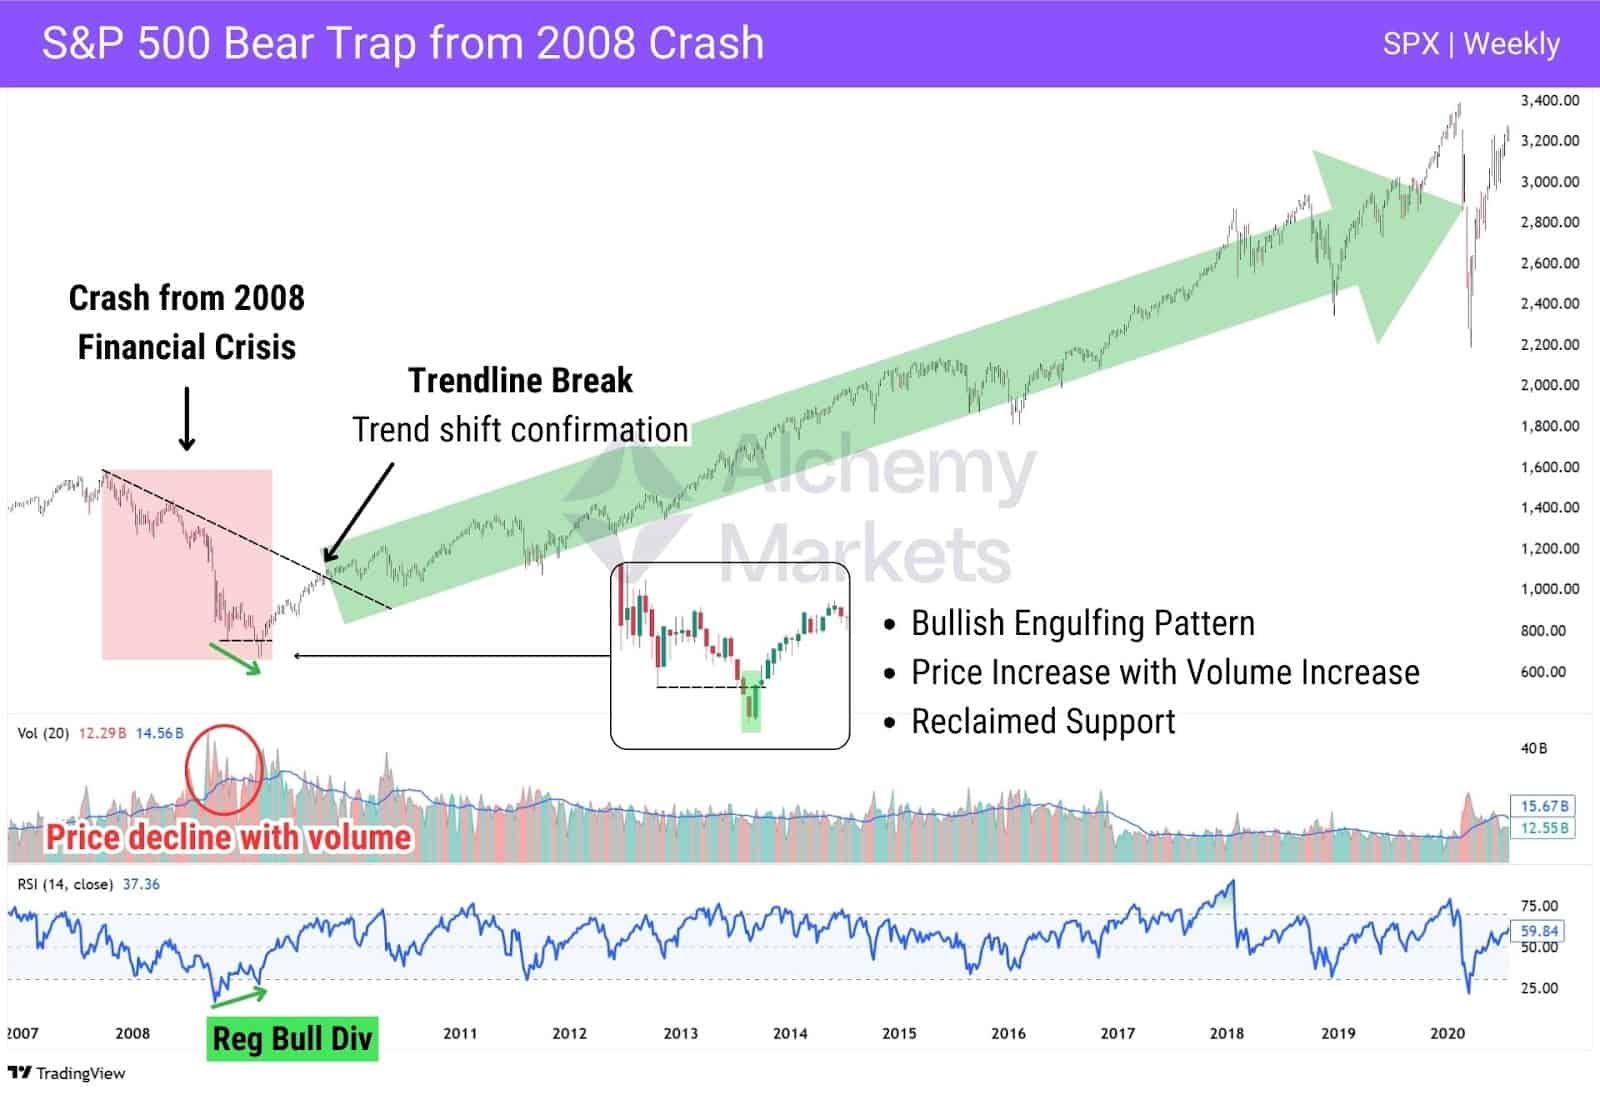
On the weekly timeframe, March 2009 marked the low — and a series of reversal signals emerged. The first clue was a regular bullish divergence: price made a new low, but RSI printed a higher low, signaling momentum loss in the downtrend. At the same time, a bullish engulfing candle formed above the previous low, followed by a confirmation candle closing above it on rising volume.
Notably, the two candles marking the final low came on high-volume red bars on the volume indicator, showing aggressive selling and likely capitulation. This type of flushout often marks the emotional climax of a move, and with sellers fully committed, conditions for a short squeeze are present.
Taken together, these signals strongly point to a bear trap in play. For added confirmation, the eventual break of the weekly descending trendline signals a broader trend shift, turning the trap into a full-on reversal.
How To Avoid a Bear Trap
Believe it or not, the key to bear trap trading for beginners is psychology and confirmation. Now that we’ve established that bear traps are false bearish breakdowns, it’s important to examine how you yourself normally trade.
Do you chase breakouts? Or do you wait for a confirmation first before shorting?
If your answer is the latter, great! You’re already halfway there.
By waiting for a proper confirmation on a bearish idea, you improve your odds of filtering out bear traps, particularly the ones that aggressively snaps back and reclaims support levels.
But some traps are more subtle — price grinds lower, lingers below a broken level, and lures in shorts before springing the reversal. That’s where a layered approach helps.
Here’s the filter checklist:
- Price Action First: A sharp reclaim of support or failed follow-through is often the first clue.
- Divergences: Regular or hidden bullish divergences on RSI, MACD, or Stochastics can confirm the setup.
- Candle Confirmation: Bullish reversal patterns — hammers, engulfing candles, inside bars— help lock in the signal.
- (Optional) Flow Conflicts: Cumulative Volume Delta (CVD), Volume, and Liquidations are contextual, yet powerful tools to add to your analysis. Depending on how the price action plays out, the flows can give confirmation on the likelihood of a bear trap or short squeeze.
Flow Conflicts: How to Read CVD, Volume and Liquidations
Flow metrics can help sharpen your conviction when reading breakdowns — especially in futures or derivative-heavy markets. Tools for this data vary, and some aren’t accessible via platforms like TradingView or MetaTrader. But when you do have access, these signals can expose the cracks in a false move.
To simplify, here’s a breakdown of how to interpret them in the context after a price decline.
📈Cumulative Volume Delta (CVD)
| Behaviour | Interpretation | Bear Trap Likelihood |
| Price 🔼 CVD 🔼 | Buyers successful in pushing price higher | Medium — Momentum breakout; trap likely already passed |
| Price 🔼 CVD 🔽 | Rising price despite net selling (Bullish Divergence) | High — Bear Trap may be in play, buyers overpowering bears |
| Price 🔽 CVD 🔽 | Sellers in control, strong selling | Low — Trend continuation or flush more likely |
| Price 🔽 CVD 🔼 | Sell orders absorbed by buyers | High — Potential Bear Trap as sellers may get trapped |
📊Volume Indicator
| Behaviour | Interpretation | Bear Trap Likelihood |
| Price 🔼 Vol 🔼 | Buyers stepping in | Low — Likely breakout from bear trap already completed |
| Price 🔼 Vol 🔽 | Low commitment on bounce | Medium — Weak recovery unless volume increases to confirm reversal |
| Price 🔽 Vol 🔽 | Weak selloff, momentum stalling | High — Weak follow-through after a breakdown suggests sellers are losing control |
| Price 🔽 Vol 🔼 | Panic selling or stop run | High — Rapid selling at the lows hint at a flushout and easily trapped sellers |
💥Liquidations
| Behaviour | Interpretation | Bear Trap Likelihood |
| Price 🔼 Liq 🔼 | Late shorts getting liquidated | High — Shorts are trapped and fueling the squeeze |
| Price 🔼 Liq 🔽 | Recovery with no forced exits | Medium — Lacks fuel, but reversal could still build on structure |
| Price 🔽 Liq 🔽 | Selloff with no panic or forced liquidations | Low — No emotional flush, so trap risk is limited |
| Price 🔽 Liq 🔼 | Forced long liquidations or stop run | High — Flushout complete; watch for reversal if price snaps back above support |
Keep in mind, order flow metrics are optional — not essential for spotting bear traps.
The core of your read still comes from price action and divergences. But once you understand how to interpret CVD, the volume indicator, and liquidations, flow data becomes a powerful complement.
It won’t replace the setup, but it can highlight a bear trap earlier and give you added confidence in your trade. With the right context, order flow data can take your bear trap trading to the next level.
How to Escape a Bear Trap
Getting caught in a bear trap isn’t the end — but escaping cleanly depends on preparation and discipline.
1. Stick to your risk plan.
The first line of defense is proper risk management. If you’ve sized your short position appropriately, getting stopped out shouldn’t blow up your account. It might sting, but it’s contained. Emotional attachment to the position is what keeps traders stuck — so let your stop do its job and move on.
2. Exit early on reversal signals.
If you start seeing signs of a trap — like bullish divergences, volume fading on new lows, or liquidation spikes into support — cut the trade or reduce exposure. You don’t need perfect timing; you just need to recognise that conviction in the breakdown is fading.
3. Use a trailing stop if you’re unsure.
Still think price could go lower, but suspect a trap might be forming? Set a tight trailing stop. This gives you downside exposure while protecting profits if the move snaps back. If the breakdown holds, you stay in. If it reverses hard — you’re out with limited damage.
Bear Trap Trading Strategies
As shown above, bear traps are detectable, if you know what to look for.
The key is reading market sentiment, spotting patterns that match the mood, and recognising the telltale signs of a failed breakdown. With those pieces in place, you’ll be able to sidestep the trap or even trade the reversal with conviction.
Trading a Bear Trap In an Uptrend
One of the most reliable ways to spot and trade bear traps in an uptrend is by looking for hidden bullish RSI divergences, where price forms a higher low, but RSI prints a lower low.
This signals that sellers stepped in aggressively but failed to break the market’s uptrend structure. With shorts now positioned close to the higher low, their stop losses and liquidation levels sit just above. That creates ideal conditions for a short squeeze once price reverses, and a bear trap springs into action.
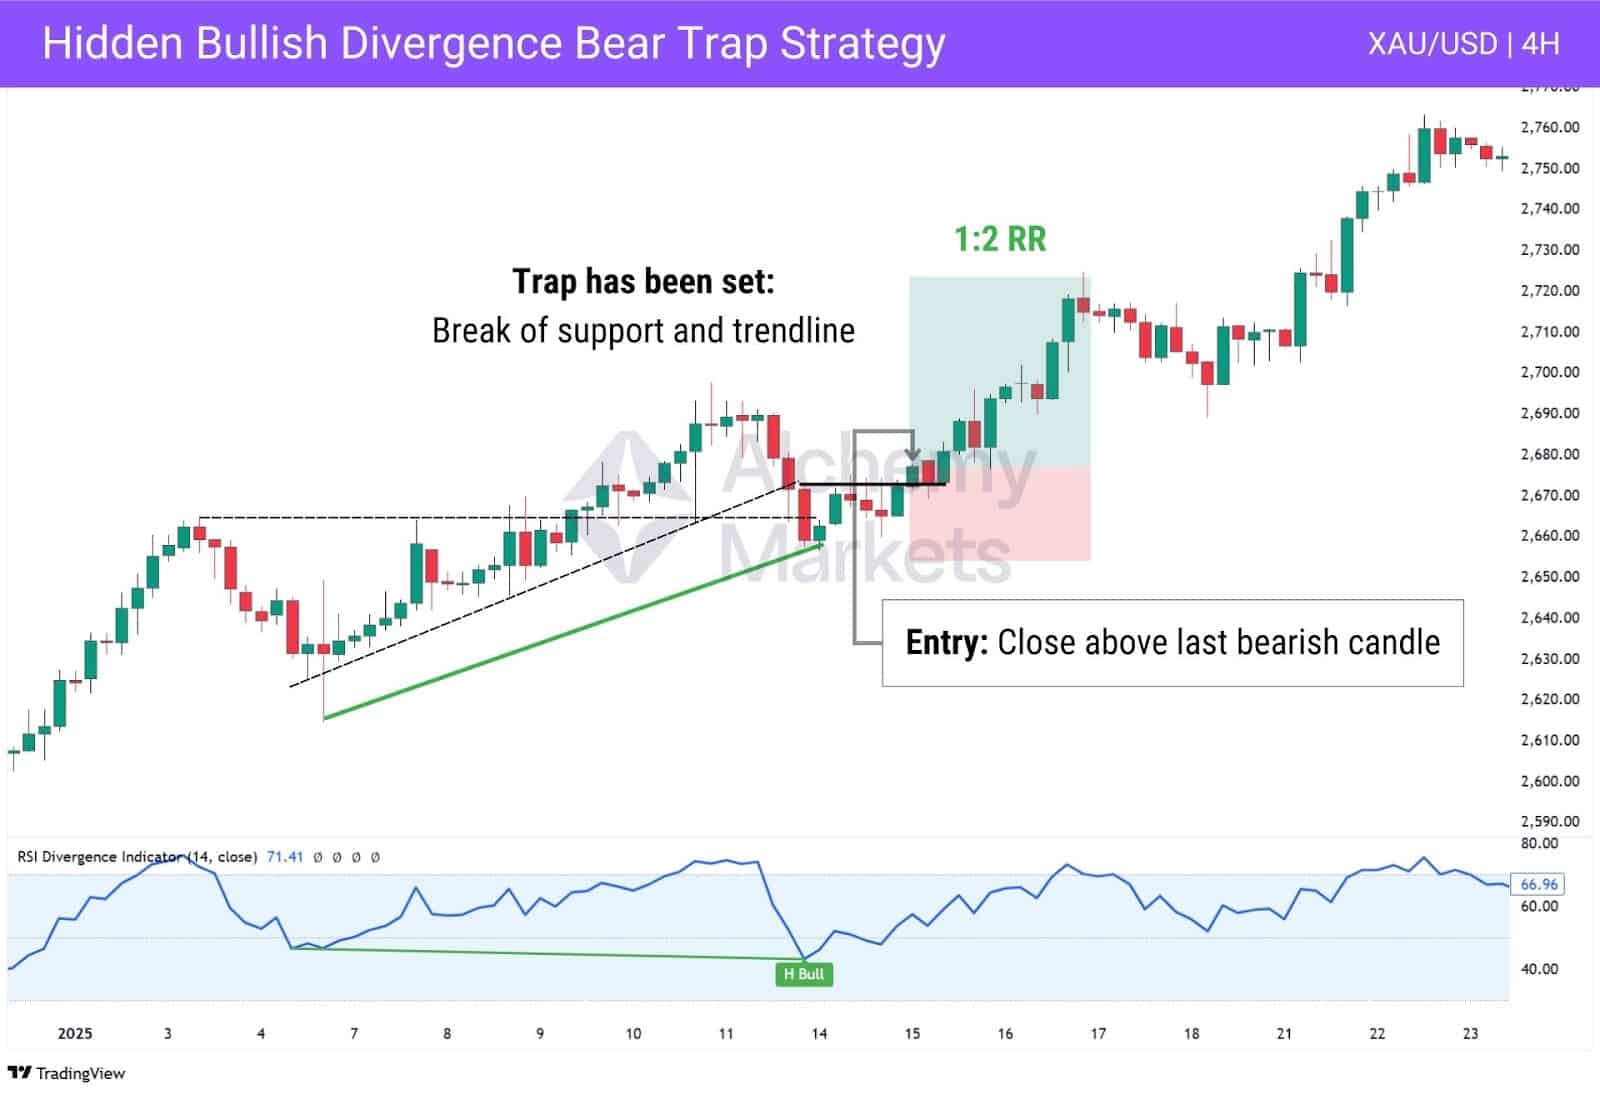
Notice how You can consider the following to set up this strategy:
- Indicator: Use the RSI indicator or RSI divergence indicator to spot hidden bullish divergences.
- Conditions: Price is falling after a technical level is broken.
- Entry: When the price closes above the high of the last bearish candle.
- Take Profit: At least 1:2 risk-to-reward.
- Stop Loss: Just below the recent low with a little bit of breathing room.
If you aren’t comfortable with using the RSI (relative-strength indicator), you may substitute with other momentum oscillators such as the Stochastics, or Stochastic RSI.
Trading a Bear Trap In a Downtrend
To trade a bear trap within a downtrend, you’d look for the inverse of the hidden bullish divergence—regular bullish divergences. This is when the price forms a lower low, but the RSI did not. It’s an indication that selling momentum is weakening, and signals a bullish reversal is now a possibility.
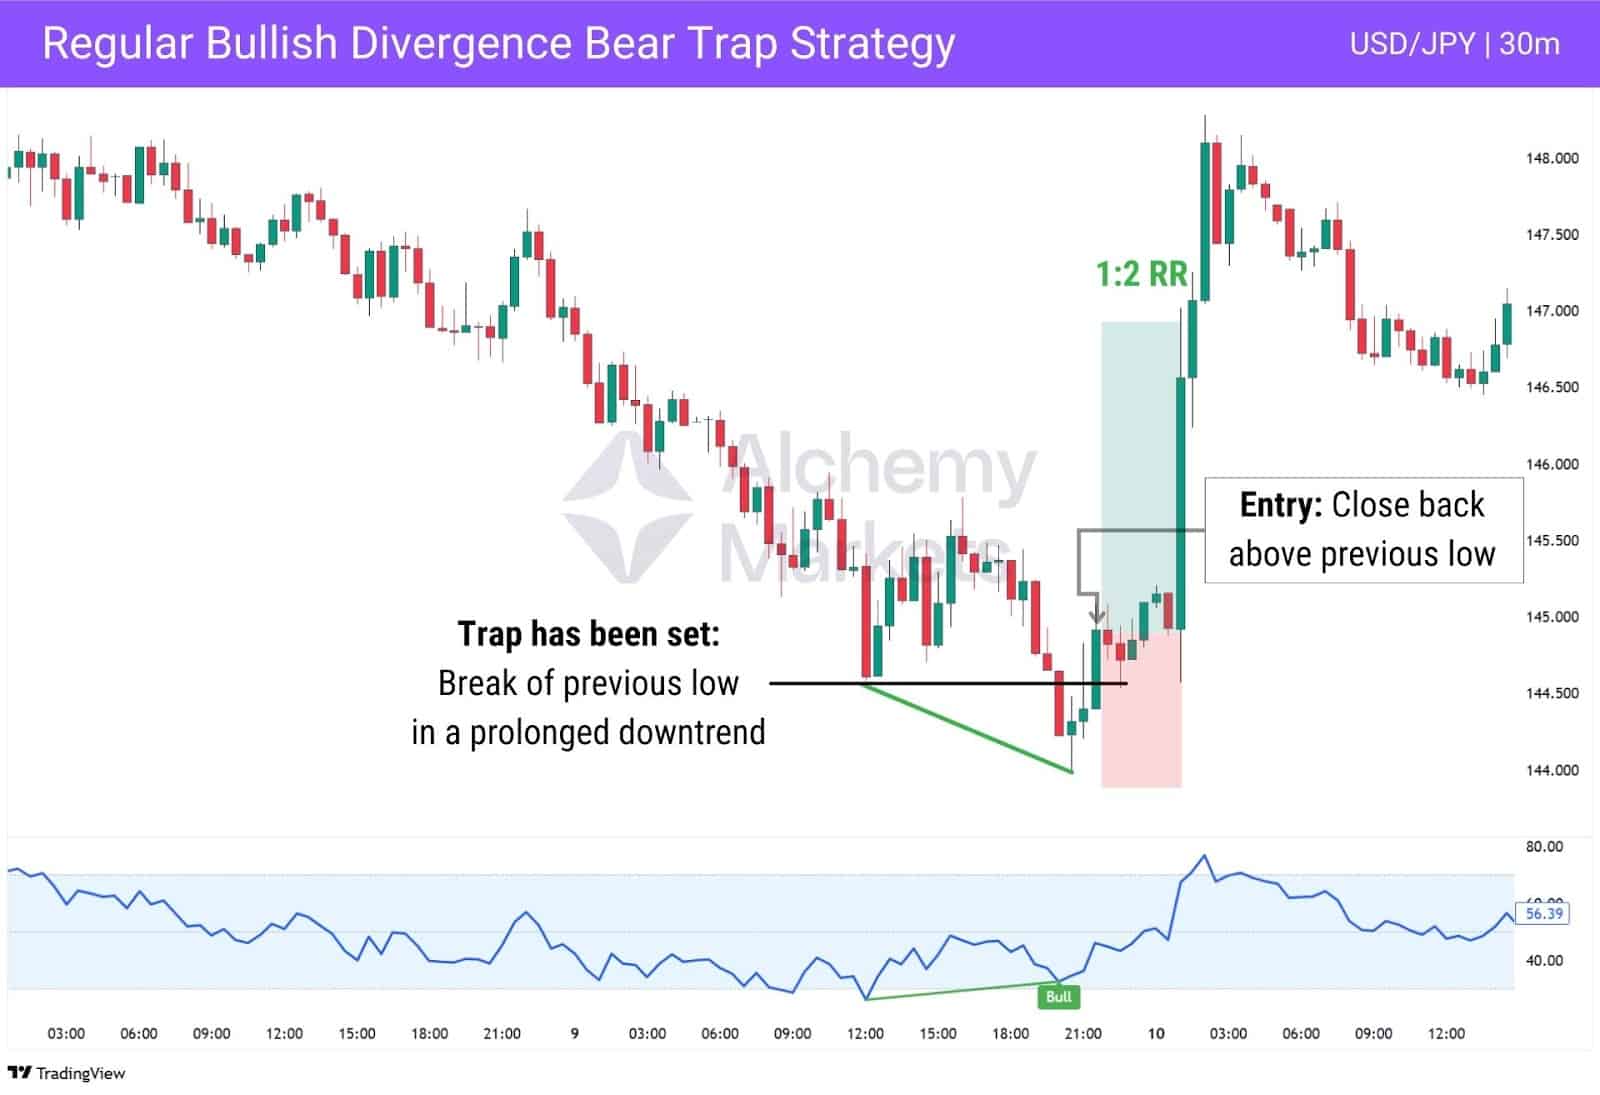
You can consider the following to set up this strategy:
- Indicator: Use the RSI indicator or RSI divergence indicator to spot regular bullish divergences.
- Entry: When the price closes above the previous low.
- Take Profit: At least 1:2 risk-to-reward.
- Stop Loss: Just below the recent low with a little bit of breathing room.
Again, you may substitute the RSI indicator with other momentum indicators that provide divergence signals, such as MACD.
Trading on Exit from the Trap
You can trade bear traps effectively by identifying the price zones where shorts are most vulnerable—typically just below key support levels or recent lows, where many traders have entered short positions. While price action alone may hint at a potential trap, order flow data provides a clearer, more reliable edge.
One of the best tools for this is the Cumulative Volume Delta Candles (CVDC) indicator. It displays the delta (market buys minus market sells) on each candle, helping us pinpoint where aggressive selling has occurred—areas where short sellers are most likely to get trapped.
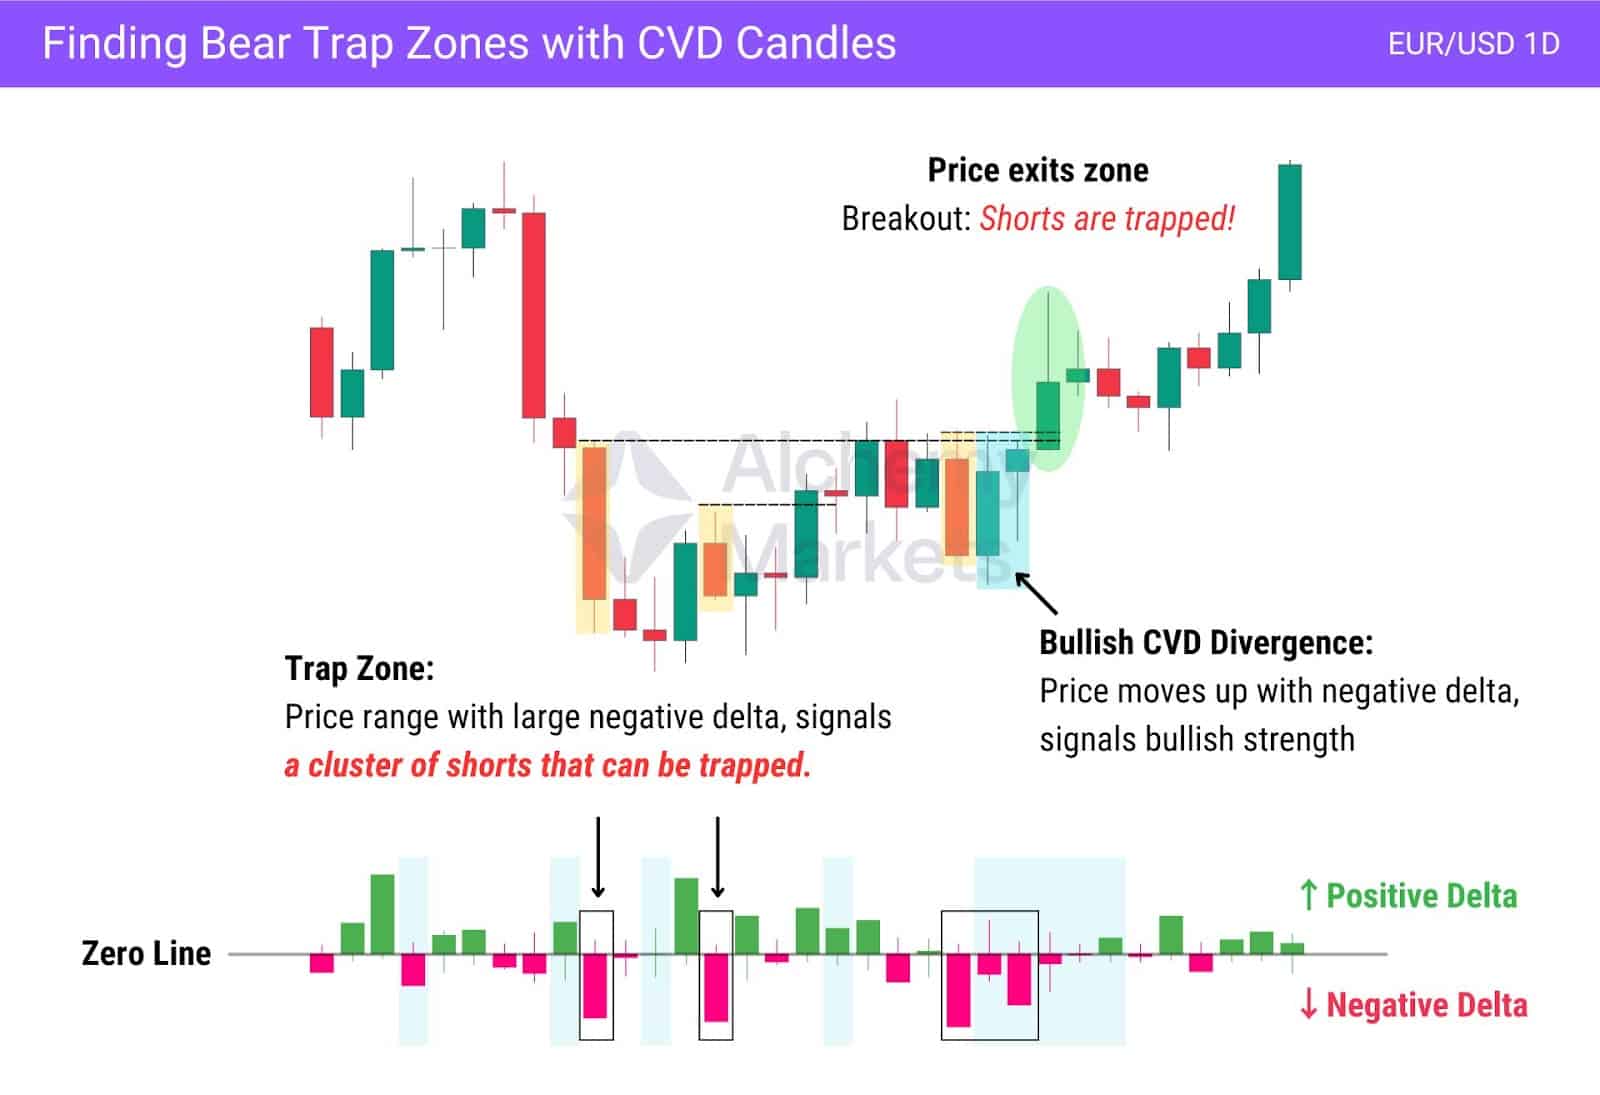
Significant negative delta spikes (where market sells exceed market buys) highlight areas where aggressive shorting has taken place. These price ranges can be marked as trap zones—zones that will trigger a bear trap once price reclaims the highs.
At that point, most shorts in the zone are sitting in drawdown, prompting them to either exit their positions (flipping from sell to buy) or risk forced liquidation. Either outcome adds buy-side pressure, fuelling a short squeeze and accelerating the rally.
This brings us to the strategy’s core concept: “Trading the Exit”. When price closes above the trap zone, it confirms that sellers are trapped, often leading to a sharp move higher as short liquidations begin.
Marking out every single candlestick with a large negative delta is impractical. It can easily lead to analysis paralysis. And while this method is partly discretionary, we can still apply structure by filtering for only the strongest signals.
That’s where Bullish CVD Divergence comes in. It helps us filter out the noise and focus on the setups that matter. When price starts to move higher while delta remains negative, it signals that sellers are still active—but buyers are quietly taking control. This kind of hidden strength often appears just before a short squeeze.
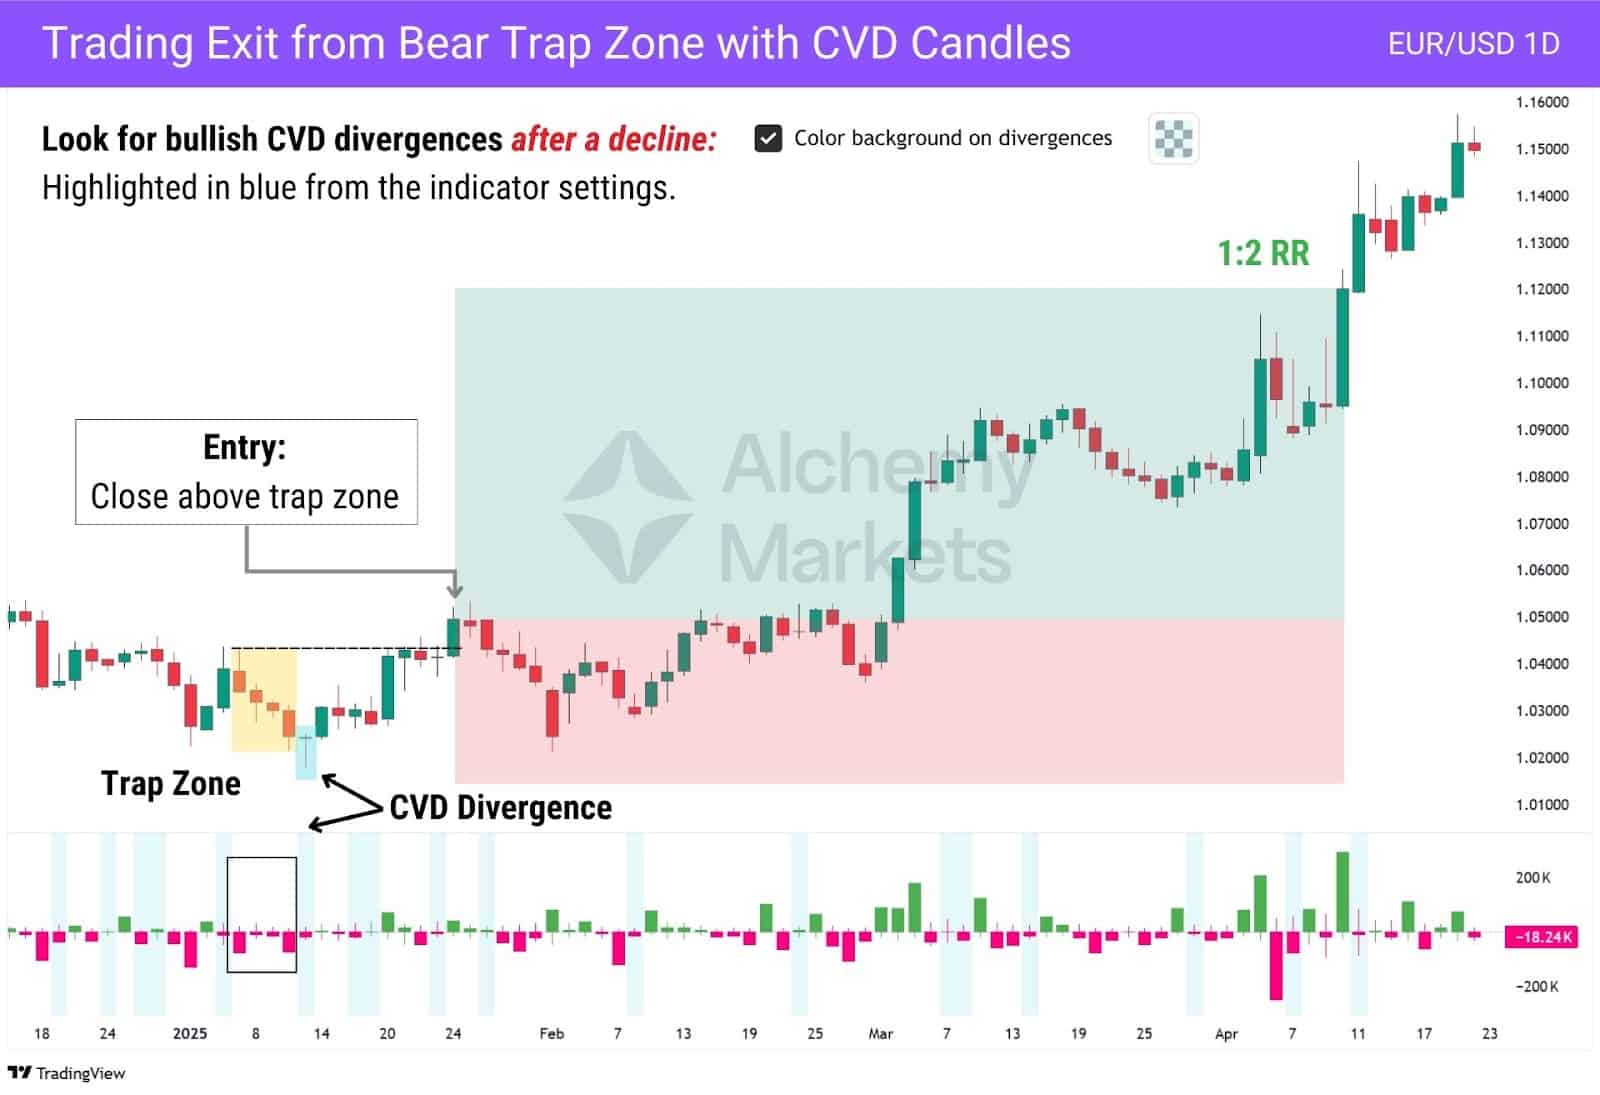
Here’s how you turn that into a trade:
- Find a Bullish CVD Divergence after a price decline.
- Look within the decline to find candles with large negative delta.
- Mark the highest point (including the wick) from those negative delta candles—this defines your trap zone ceiling.
- Enter long if the price breaks above the trap zone ceiling—this confirms the idea of a short squeeze.
- Stop loss below the most recent swing low, and target 1:2 take profit.
Unlike simply just using support and resistance, CVD helps you see where shorts can be potentially trapped, allowing us to take an educated approach to trading an “Exit” from the bear trap.
Buy Inside the Trap (CVD and RSI Divergence Strategy)
For aggressive traders, buying inside the bear trap—rather than waiting for a breakout above the trap zone—offers a chance at higher risk-to-reward setups. However, this comes with a higher failure rate, so having numerous supporting divergences and a confirmation candle is a must.
To reduce risk, we look for bullish divergences between price and:
- The CVD Indicator (showing hidden buyer absorption)
- The RSI Indicator (showing waning bearish momentum)
Unlike the “Trading from Exit from Trap” strategy that waits for price to close above the trap zone, this approach front-runs the move by entering when price closes above the CVD divergence candle. Additionally, this is an intraday strategy, therefore, we recommend using the 15 minute or 5 minute for this strategy.
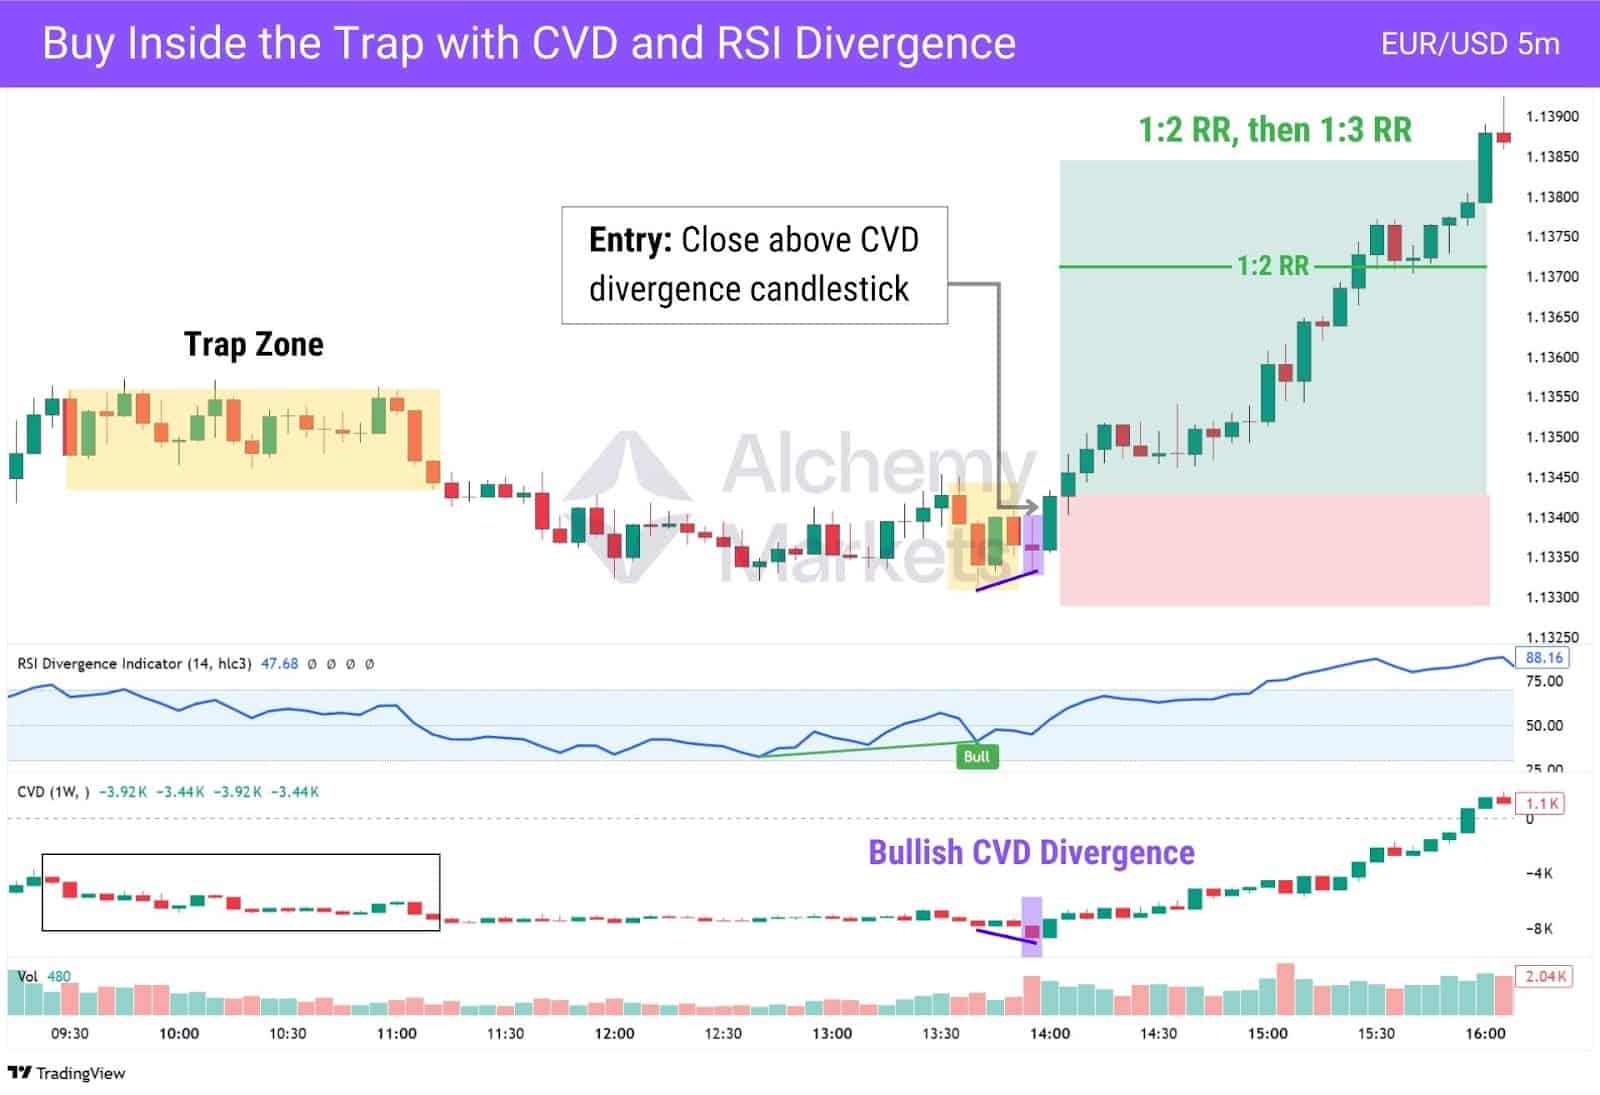
Notice how in the example above, we did not wait for a confirmed close above the two trap zones to punch in a long entry. Rather than waiting for a break above the $1.1360 trap zone high, the entry is taken earlier with a close above the CVD divergence candle. This allows for a tighter stop and stronger risk-to-reward.
Here’s how to trade the “Buy Inside the Trap” setup:
- Add the CVD and RSI indicator to your chart, then use a timeframe lower than a single day.
- CVD should be anchored to 1 week, giving us a smooth, continuous view of volume delta across the trading week.
- Watch for a bullish RSI divergence and bullish CVD divergence at around the same price zone.
- Identify the candle which confirms the bullish CVD divergence — CVD indicator punches in a lower low, but price does not.
- Enter long on a close above that candle, this signals buyers are absorbing the sell pressure.
- Stop loss below the recent swing low, and target 1:2, then 1:3 risk-to-reward.
This strategy can target a 1:3 risk-to-reward because it essentially front-runs the “Trading the Exit from the Trap” setup, which already offers a 1:2 RR. One option is to secure partial profits at 1:2, then let the remaining position run toward 1:3 or the next swing high — allowing you to lock in gains while still capturing extended moves.
Bear Trap Trading with Trend Confirmation
You can trade a bear trap by using Exponential Moving Averages (EMAs) to confirm when a downtrend has shifted into a new uptrend. EMAs are useful because they show the average price over time, with more weight on recent candles. For example, the EMA-20 tracks the last 20 candles, while the EMA-50 tracks the last 50.
This strategy uses two EMAs:
- Fast EMA: EMA-20
- Slow EMA: EMA-50
We wait for a bullish crossover, where the EMA-20 crosses above the EMA-50, signalling that the trend is shifting upward. Then it’s time to look for an entry—there are two methods we recommend for seeking an entry. Depending on which one you prefer, you can use that strategy or even apply both simultaneously.
Entry Setup: Looking for a Bounce at the EMA
This setup leverages how EMAs act as dynamic support and resistance during trending markets. Since we’re looking to capitalise on a potential bear trap, we’re specifically focused on moments when a downtrend flips into an uptrend — and price respects that new trend by bouncing off the EMAs.
The EMA-20 and EMA-50 are ideal for this. They’re widely respected by traders, responsive to price shifts, and help confirm whether a breakout is legitimate or just a fakeout.
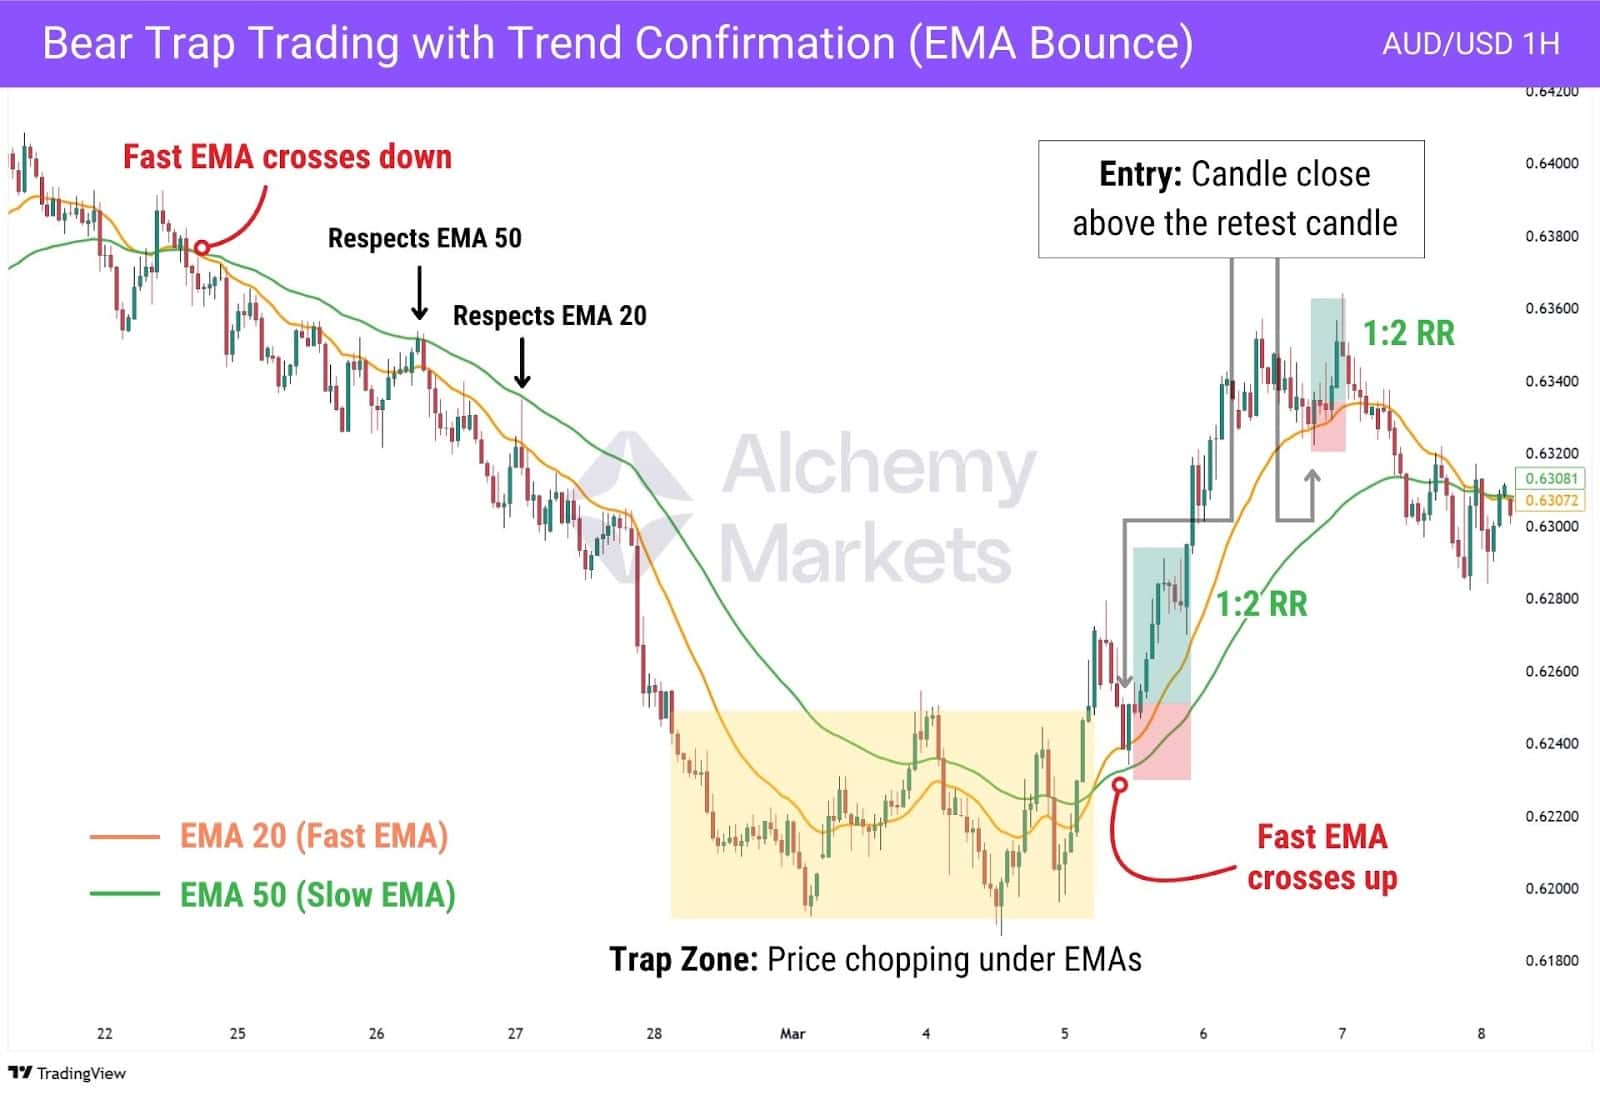
After a bullish crossover, here’s how to trade it:
- Wait for price to pull back to either the EMA-20 or EMA-50.
- Look for a bullish candle to close above the candle that touched the EMA. This signals that buyers are stepping in.
- Enter long on that close, with a stop loss just below the EMA-50, and target 1:2 risk-to-reward.
- This method gives you structure-based confirmation that the trend is holding, while still entering early enough to benefit from the reversal momentum.
Entry Setup: Fair Value Gap Breakout
This approach focuses on momentum. A Fair Value Gap forms when price moves aggressively, leaving a visible gap between the wicks of the first and third candles in a three-candle sequence. These imbalances often act as magnet zones where price returns before continuing.
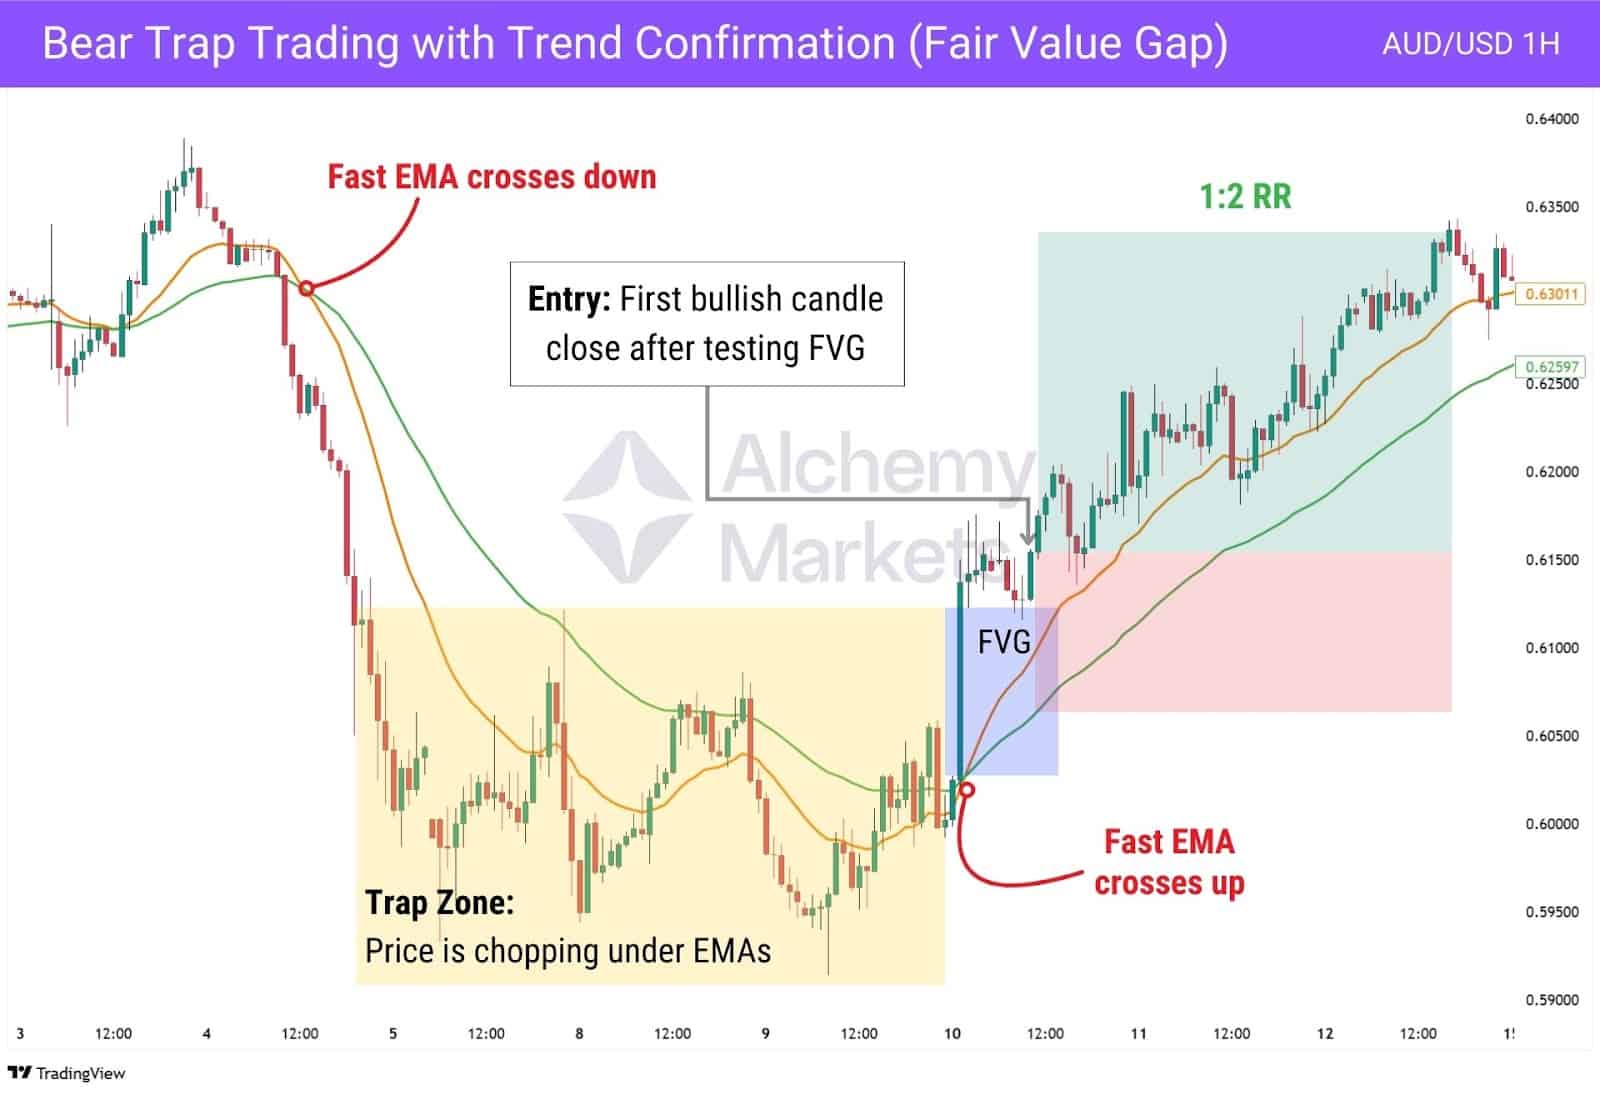
After the crossover:
- Wait for price to pull back into a clean bullish FVG.
- If price wicks into the FVG and closes bullishly above the gap, it signals strong continuation.
- Enter long on that close, with a stop just below the EMA-50, and target 1:2 risk-to-reward.
This setup lets you enter early after a trap, even if price doesn’t fully retest the EMAs.
Mean Reversion Trading Strategies
This method uses volatility extremes to identify potential bear traps. Bollinger Bands® plot expected price extremes based on a moving average and standard deviation. Most traders use the 20-SMA as the midpoint, but here, we upgrade it to a 50-EMA for smoother trend context.
The strategy looks for price to close outside the lower band after a sharp drop, signalling an overstretched move. To confirm exhaustion, we add the Bollinger Band Width (BBW) indicator. When the BBW line hits its highest expansion in 40 periods, it often means price is ready to snap back inside the bands, making it a high-probability bear trap setup.
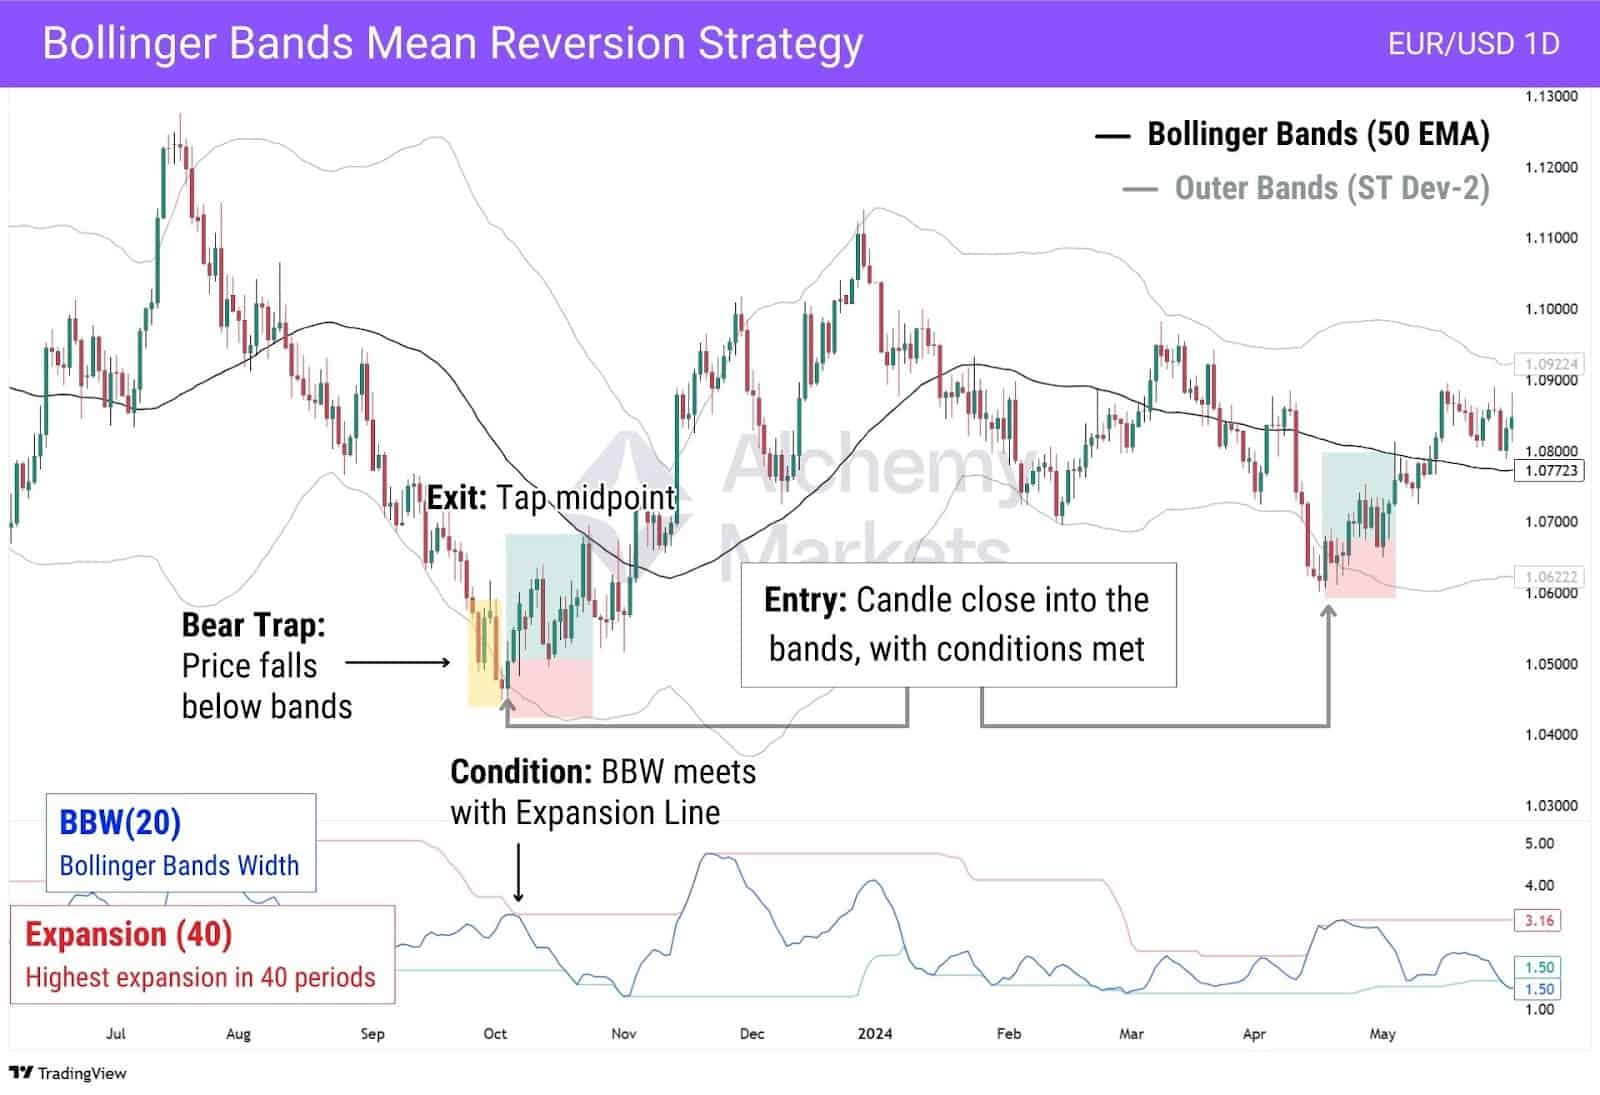
Here’s how it works when put together:
- Use Bollinger Bands with a 50-EMA basis and standard deviation of 2.
- Look for a candle that closes below the lower band after a clear drop.
- Add BBW (length 20, expansion 40) and wait for the BBW line to hit the expansion level.
- Enter long on a strong bullish candle that closes back inside the bands.
- Stop loss: Place just below the wick of the lowest candle.
- Take profit: Target the middle band (EMA-50), or upper band for an extended move.
| Note: This is just one way to approach mean reversion trading.Mean reversion setups often carry a higher risk of false signals, since you are trading against the immediate trend. Although this strategy is adjusted for CFD trading by layering multiple confirmation factors, it’s still advisable to trade with a smaller lot size to manage risk during potential reversals. |
Bear Trap Trading with RSI
We’ve already explored how RSI bullish divergence helps spot bear traps during trends. But what if you don’t see any divergence during a sharp selloff?
Can a bear trap still form without it? Absolutely.
In sharp, aggressive drops, price sometimes falls so quickly that divergence never has time to appear. Then, it suddenly snaps back, catching late sellers off guard. In these cases, you’ll want to lean on a stack of other confluences to build conviction around a potential reversal.
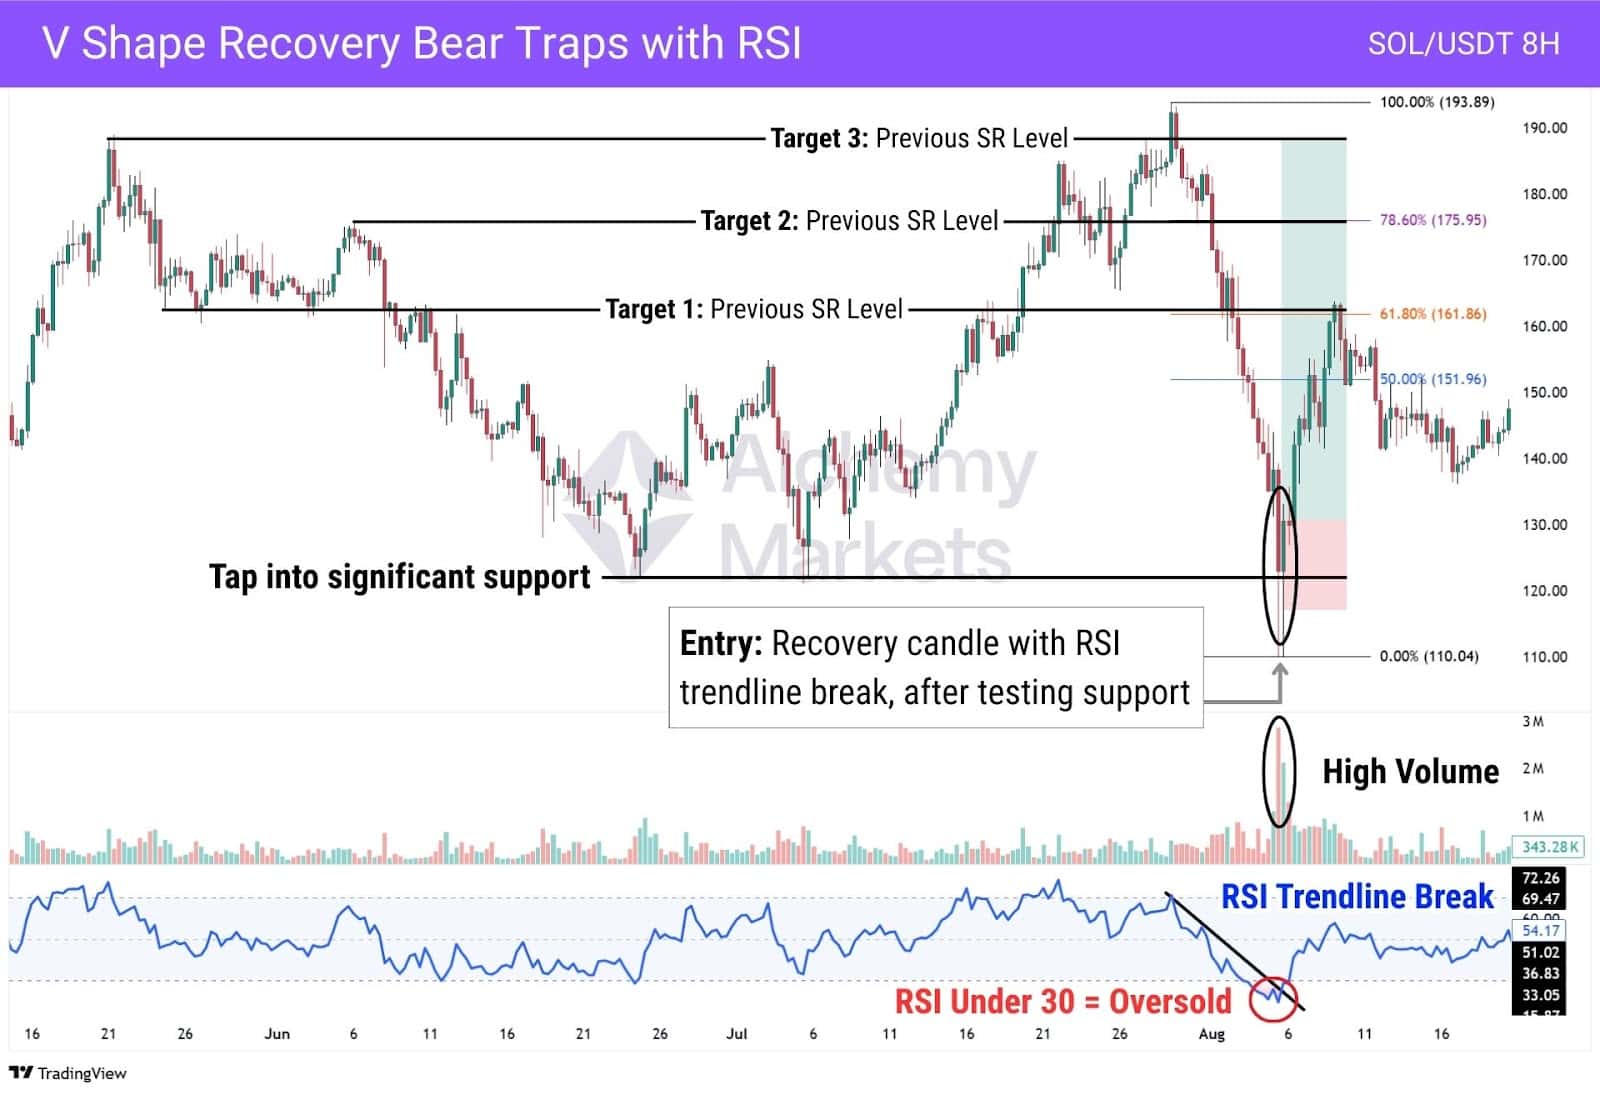
Here’s what to look for:
- Price hits a clean support level
- RSI drops below 30 (oversold)
- A sharp recovery candle forms with strong volume
- RSI breaks above its descending trendline resistance
When these signals align, you don’t need divergence to act. The trap is already springing.
And remember: a trap doesn’t need to recover the entire drop—it just needs to snap back hard enough to trap sellers.
💡 If there’s no divergence, use a combination of support, RSI oversold, trendline break, and a high-volume recovery candle to spot a bear trap.
| Confluence | How to use it |
| RSI Divergences | Spot early signs of reversal by watching for price and RSI moving in opposite directions.Most useful when it forms before the drop hits support. |
| Support Levels | Look for price to reject clean support levels. The sharper the bounce, the stronger the trap. |
| Resistance Levels | Use old resistance to place take-profit targets or confirm exits. These are likely zones where traders will sell. |
| Large Wicks | A long wick into support shows failed selling pressure. Acts as confirmation that buyers are absorbing supply. |
| RSI Trendline Break | Draw a trendline on RSI’s downtrend. A break signals momentum is shifting, especially after price tests support. |
| RSI Oversold Signal | RSI, or relative strength index, under 30 shows exhaustion.Wait for it to recover back above 30 before looking for entry confirmation. |
📊 Breaking Down the Setup: No Divergence, Still a Trap
In the example above, notice how there are no divergences—our biggest “cheat code” for spotting bear traps is missing…
But look again: a high-volume flush into major support, followed by a strong recovery candle closing back above the level, paired with an RSI oversold signal and a trendline break. Together, this stack screams bear trap, and recognising it gives us a reason to act.
This concept can be applied across all your bear trap trading setups, because with a bullish divergence, this signal would be even stronger.
🧭 What This Means for Your Trading
Even without RSI divergence, you can still spot bear traps by stacking other confluences—like support levels, volume spikes on the volume indicator, and RSI trendline breaks. It’s about reading what the market is showing, not waiting for the perfect signal.
Since V-shaped recoveries don’t always reclaim the entire drop, structure your exits around nearby resistance or fib zones. This way, you lock in gains without relying on best-case scenarios.
Bear Trap Trading with MACD
The MACD, or Moving Average Convergent Divergent, is a unique momentum indicator that signals trend shifts on both the long and short term. This ability comes from the duo display of moving average lines, and a histogram (displayed as columns/bars) within the same indicator.
The lines are split into the MACD Line and Signal Line, which represent:
- MACD Line — Represents the difference between the 12 and 26 exponential moving averages
- Signal Line — The average of the MACD Line across 9 periods
The MACD Line tracks longer-term momentum. If price makes a new low but the MACD Line doesn’t, that’s your bullish divergence. Just like how a bullish RSI divergence works, the MACD’s is a clear sign of the downtrend losing steam.
The histogram adds another layer. It reflects the distance between the MACD and Signal Line, which is interpreted as short-term momentum. When the bars shrink while price drops, it signals momentum is fading—once again, signals a weakening downtrend.
This approach taps into the full potential of the MACD: combining structural (MACD Line) and short-term (histogram) signals. It gives you a layered read that RSI can’t match on its own. RSI spots momentum shifts, but the MACD can offer confirmation in the way of signalling double divergences.
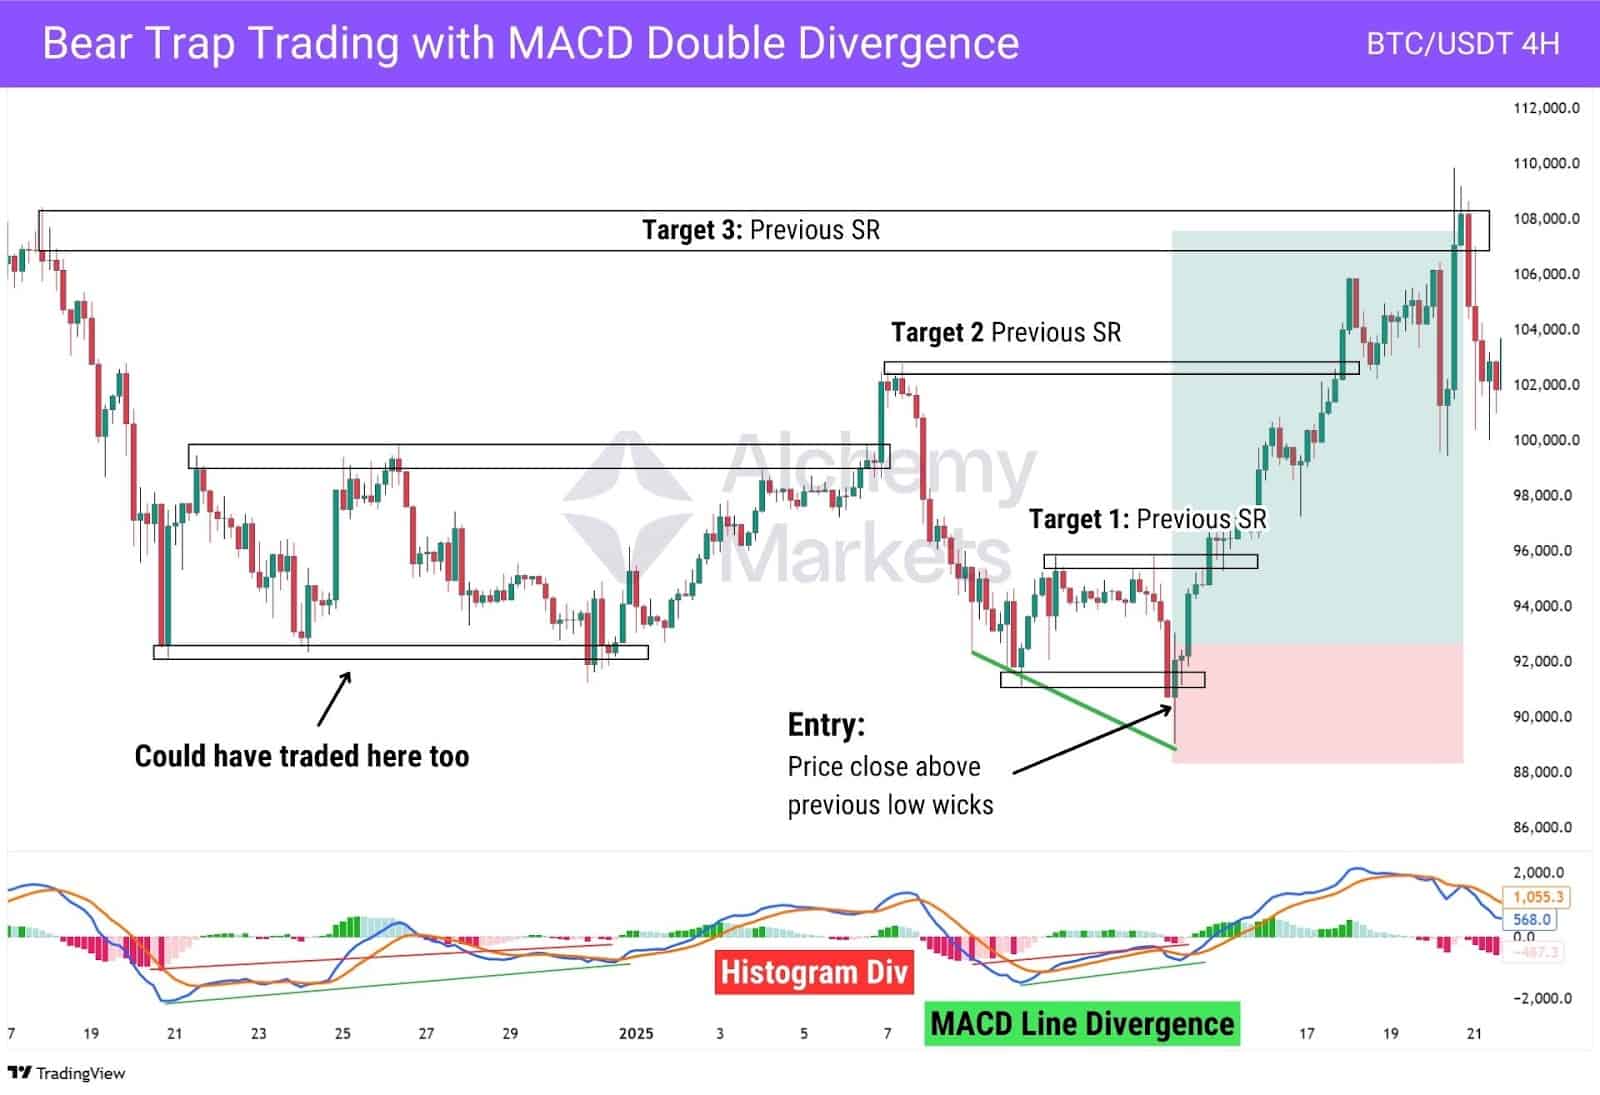
In this Bitcoin 4H setup, price breaks to a new low, but both the MACD Line and histogram print higher lows—bullish divergence on two fronts. That’s your cue: momentum’s fading, not accelerating.
Here’s how the MACD double divergence setup would look in a trade:
- Spot a bullish MACD double divergence in a downtrend — price makes new lows, but MACD Line and histogram doesn’t.
- Wait for a bear trap, where price breaks the prior low’s wick area but quickly reclaims it (close above).
- Enter on the reclaim candle; place stop just below the pivot low.
- Take partial profit at prior highs, then scale out at nearby resistance zones.
Bear Trap Trading with Fibonacci Retracement Levels
Bear traps often show up during deep price pullbacks, especially around the 61.8% and 78.6% Fibonacci retracement levels. These zones tend to be areas where panic selling slows and buyers quietly start stepping in.
In traditional markets like stocks, commodities, and major forex pairs, price often respects the 61.8% level. But in lower liquidity markets like crypto, it’s not uncommon to see prices dip below, and bounce from 78.6% instead.
To identify a potential bear trap using Fibonacci levels, here’s what to look for:
- A bullish RSI divergence during a downtrend
- A small upward push, showing early buying interest
- A retracement back to 61.8% or 78.6%, followed by a bullish price reaction
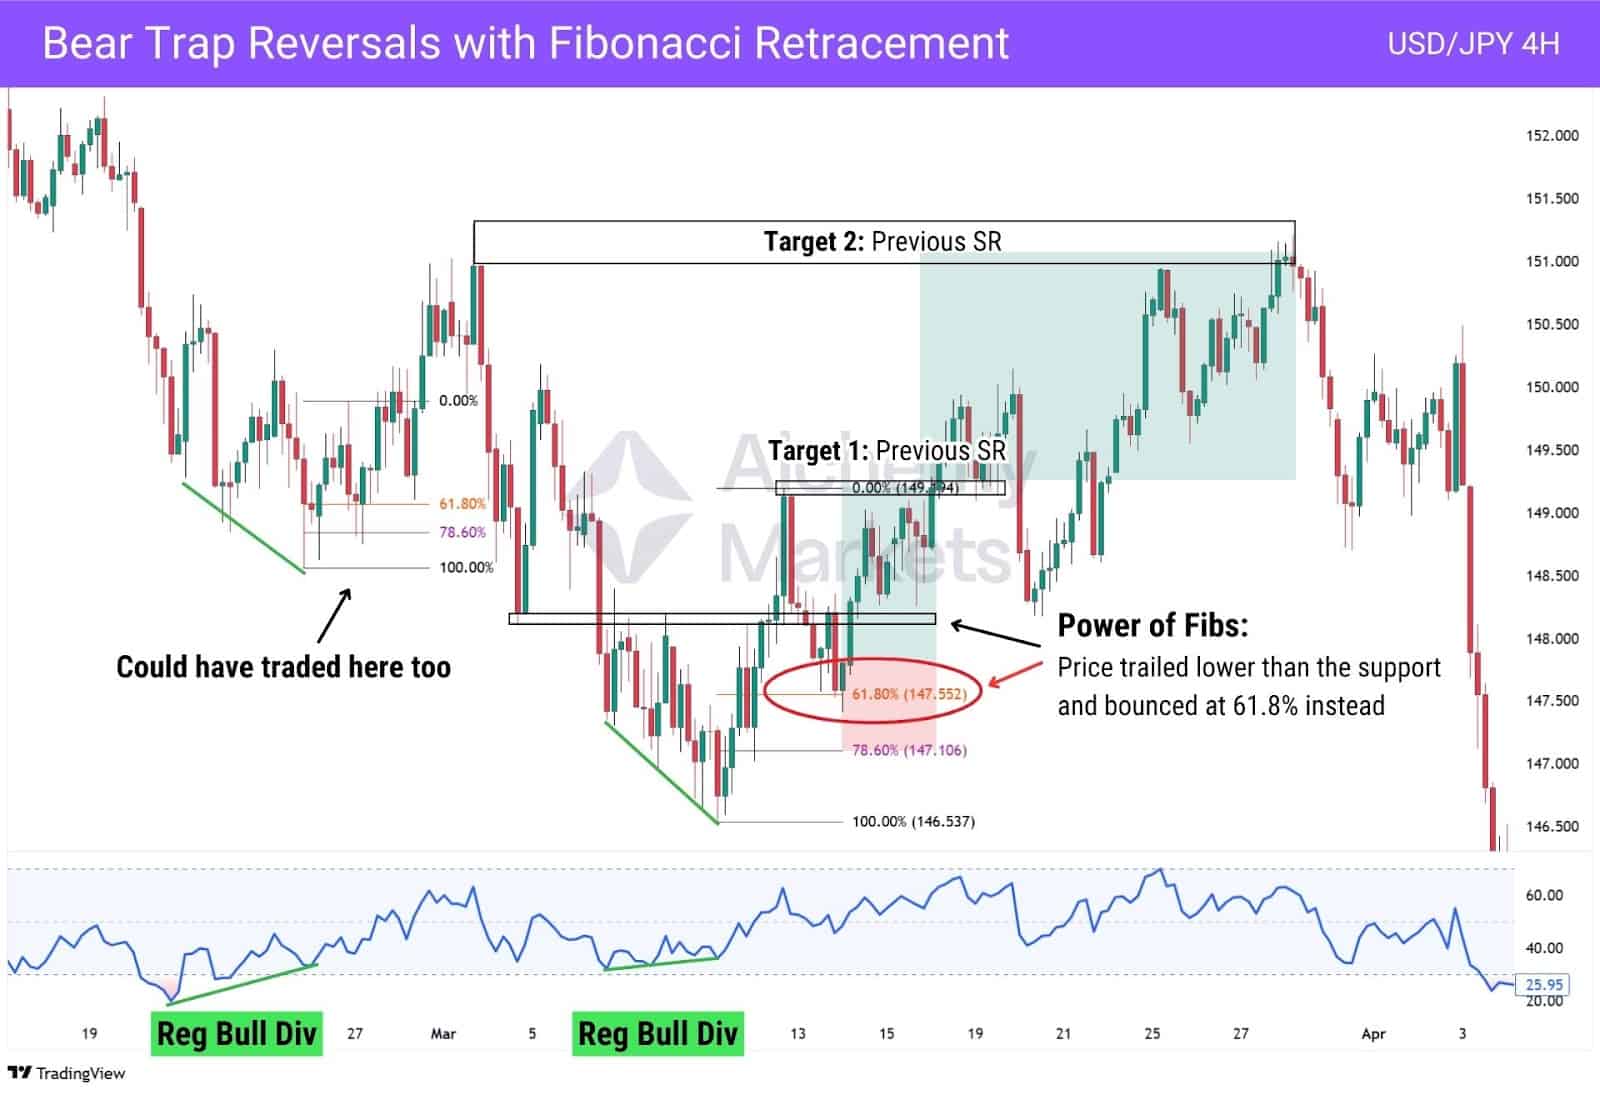
Take a look at the USD/JPY 4H chart above. Following a regular bullish divergence, price pushed higher, and then retraced into the 61.8% level. Even though it dipped below a support zone, it held and rallied cleanly back to previous highs.
Combining RSI signals with key Fibonacci levels is a simple, yet logical approach to trading bear traps:
- A bullish RSI divergence alerts you to the possibility of a bear trap…
- While the Fibonacci retracement provides you with a logical point of entry.
Here’s how it would look in a trade:
- Spot a bullish RSI divergence in a downtrend (price makes lower lows, RSI doesn’t).
- After the first bounce, draw a Fibonacci retracement from the swing low to high.
- Wait for a pullback into the 61.8% or 78.6% zone, and look for a bullish reaction (wick or close back above).
- Set your stop loss just below the next Fib level (e.g. below 78.6% if entering at 61.8%).
- Take partial profit at the swing high, then scale out at nearby resistance levels.
Adjustments for Long-Term Investors
Bear traps often appear during periods of heightened market uncertainty. Headlines around economic policy, geopolitical tensions, or global events like pandemics can trigger sharp price declines, fuelled by fear and sudden shifts in sentiment.
These conditions can set the stage for a bear trap: where the market sells off aggressively, only to rebound just as quickly.
This raises important questions for long-term investors:
- How should portfolios be adjusted during such periods?
- Is it better to reduce exposure, or wait for the tide to turn?
As Warren Buffett famously said, “Be fearful when others are greedy, and greedy when others are fearful.” But acting too early—without a clear strategy—can leave investors exposed to prolonged drawdowns, sometimes stretching years or resulting in significant unrealised losses.
A more risk-conscious approach is to diversify across asset classes.
For example, during broad equity market declines, traditionally defensive assets like Gold may hold value better—helping to offset potential losses elsewhere in the portfolio.
Some investors also consider using trailing stops as part of a disciplined exit strategy.
These can help secure profits or reduce downside, while maintaining the flexibility to re-enter when market conditions turn favourable—particularly if a bear trap reversal begins to unfold.
Bear Traps in Day Trading
Bear traps are especially dangerous for day traders because the trap can spring within minutes — triggering a sudden surge to the upside that wipes out short positions. This is particularly common during news events or shortly after major announcements, when volatility spikes and emotions run high.
This EUR/GBP 30-minute chart illustrates just how punishing and profitable bear traps can be. In fast-paced environments like this, a well-timed entry can deliver fast returns — if you’re on the right side of the trade. For bears caught on the wrong side, traps like these can just as easily destroy an account.
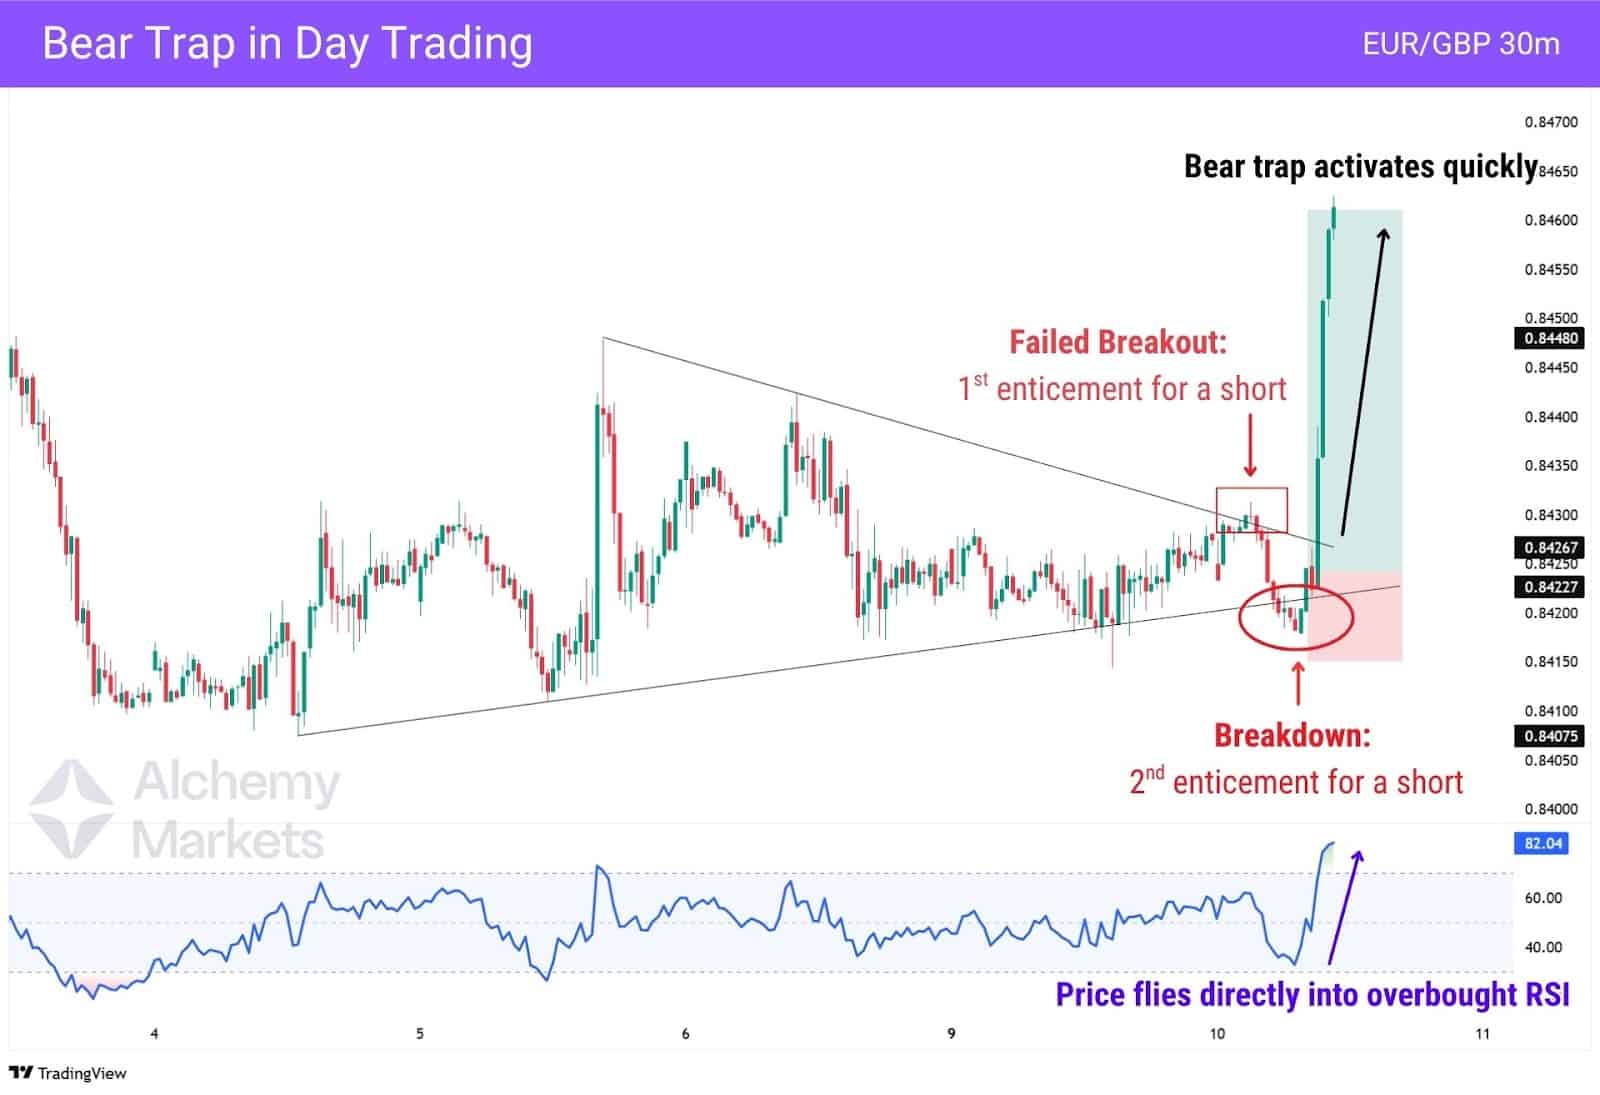
Notice how this bear trap forex structure played out:
- A symmetrical triangle appeared, and the initial breakout attempt failed towards the upside, which drew in early short-sellers expecting a reversal. (1st enticement)
- Then, price breaks cleanly below the lower trendline and even retests it as resistance successfully. This convinced more traders to go short. (2nd enticement)
- But instead of continuing lower, price snaps back above the trendline and springs the trap. Within moments, the market surges like a straight line up, pushing the RSI into overbought territory.
An important factor to note here is that — there were no bullish divergences leading up to this bear trap, proving how difficult and deceptive it is to spot a bear trap, especially in highly reactive intraday markets.
Advantages of Trading on the Bear Trap Trading
Bear traps, when properly identified, offer several benefits for tactical traders:
- High Risk-to-Reward Opportunities: Since you’re entering just as trapped sellers are exiting, the resulting move can be explosive. Well-timed entries can yield 1:2 or even 1:3 setups.
- Capitalize on Fear-Driven Moves: Bear traps often emerge during panic selling, creating deep discounts that favour contrarian entries.
- Clear Technical Triggers: Whether it’s bullish divergences, reclaimed support levels, or large volume spikes—bear traps often come with distinct visual cues.
- Short Squeeze Momentum: The trap’s reversal is powered by both fresh buyers and trapped sellers covering their positions—accelerating the price in your favour.
- Great for Reversal Traders: If your strategy thrives on mean reversion or price structure shifts, bear traps offer a high-probability entry point when coupled with confirmation tools like RSI, MACD, or CVD.
Disadvantages of Trading on the Bear Trap Trading
Despite their potential, bear traps are not without risk:
- Difficult to Spot in Real-Time: Most traders only identify the trap after it’s sprung. Pre-empting the move requires skill and confluence.
- High Failure Rate Without Confirmation: Aggressively entering “inside the trap” without multiple divergences or signals can result in premature trades.
- Volatile Entry Conditions: Bear traps often emerge from emotional, volatile markets, making slippage, spread spikes, and whipsaws more common.
- Requires Fast Decision-Making: If you’re too slow, you miss the move. If you’re too early, you risk being wrong and stopped out.
- Not Always Clean Breakouts: Some traps fake the recovery and then resume the downtrend, especially in low-liquidity environments.
Bear Trap vs Bull Trap
Bear traps and bull traps are both deceptive setups that catch traders on the wrong side of the market. The difference lies in the direction: a bear trap tricks traders into going short before the price rallies, while a bull trap tempts them to go long right before a drop.
Understanding the psychology and price structure behind each can help you avoid being caught in these common reversal scenarios.
| Aspect | Bear Trap | Bull Trap |
| Signal Direction | False bearish signal | False bullish signal |
| Traders Affected | Short sellers (bears) | Long buyers (bulls) |
| Market Reaction | Sudden reversal upward | Sudden reversal downward |
| Typical Formation | Break of support followed by sharp reclaim | Break of resistance followed by sharp rejection |
| Common Trigger | Panic selling, fear, poor economic headlines | Euphoria, greed, overbought technicals |
| Resulting Move | Short squeeze, new uptrend or sharp rally | Long liquidation, breakdown or pullback |
Bear Trap vs Legitimate Bearish Move
Understanding the difference is key — especially in bear trap stock market scenarios where fake breakdowns often occur at key technical levels, or during high-volume selloffs.
The challenge is telling the difference early, especially when both setups start by breaking support. This comparison table highlights the clues that separate a bear trap from a genuine downtrend, so you can avoid getting faked out.
| Feature | Bear Trap | Legit Bearish Move |
| Reclaim of Support | Often reclaims the broken level quickly | Breaks and holds below support |
| Volume Profile | High volume on bounce or flush (capitulation) | Steady rising volume through breakdown |
| Divergences | Bullish divergence present on RSI, MACD, or CVD | No bullish divergences or confirmation signals |
| Follow-through | Limited or no follow-through on breakdown | Strong continuation to new lows |
| Trapped Traders | Yes – typically short sellers | No trap – bearish structure plays out normally |
FAQ
What are the Common Bear Trap Bias to Watch out for?
These common trading biases can cloud your judgment and increase your chances of falling into a bear trap.
Confirmation bias
Traders often interpret chart patterns or news in a way that supports their existing bearish view. They ignore opposing signals and get blindsided when the market reverses.
Loss aversion
Once in a short position, traders may hold on too long to avoid locking in a loss. This hesitation often turns a small mistake into a bigger one as price moves against them.
Recency bias
If recent moves have been bearish, traders assume the trend will continue. They forget that markets can flip quickly, especially after extended drops or emotional selloffs.
How Does a Bear Trap Affect Retail Traders?
Retail traders often chase breakdowns without waiting for confirmation, especially with overleveraged positions. This effectively turns most retail traders’ positions into fuel for a short squeeze, allowing the bear trap to come into fruition when the price snaps back.
Are Bear Traps More Prevalent in Certain Market Types or Conditions?
Yes. Bear traps tend to show up in highly emotional markets. Bear trap crypto setups, for example, are common due to the retail-driven nature of the space — where sentiment can flip rapidly on fear or hype.
During major news cycles — like wars, tariff announcements, or surprise economic data — markets such as oil, gold, and Forex often become vulnerable to bear traps, as volatility surges and emotional trading takes over.
What Actions Should a Trader Take If They Anticipate the Formation of a Bear Trap?
This is especially important in bear trap trading for beginners, where acting without confirmation is a common mistake. Pause and reassess. Look for signs of a reversal like bullish divergence, volume fade, or reclaimed support before jumping in.
Is It Possible to Predict Bear Traps Using Technical Analysis?
They can’t be predicted perfectly, but they can be anticipated. Tools like RSI, MACD, volume, and structure shifts help build the case.
How Does a Bear Trap Contrast with a Market Correction?
A bear trap is a short-term fakeout. A correction is a genuine price decline, usually part of a larger trend shift or macro change.
Is a Bear Trap the Same as a Short Squeeze?
Not exactly. A bear trap sets up the conditions for a short squeeze, but the squeeze itself is the result of trapped shorts rushing to exit. Think of it this way: the bear trap…traps the bears. The short squeeze is the killing blow.
Is a bear trap good or bad?
A bear trap is neither inherently good nor bad — it depends entirely on your position in the market.
- ✅ Good for long traders and investors who spot it early — it signals a potential bullish reversal after a false breakdown.
- ❌ Bad for short sellers — they get caught when price reverses upwards, forcing them to cover at a loss.
On higher timeframes, like the daily or weekly chart, a bear trap can suggest the end of a long-term downtrend, which is bullish news for buyers.
Is the market in a bear trap?
To detect if the overall market is in a bear trap, watch how price behaves after a breakdown. If it quickly reclaims key levels and volume shifts in favour of buyers, there’s a good chance a trap is in play.
What is the psychology behind the Bear Traps?
Fear and overconfidence drive most bear traps. Traders see a breakdown and rush to short, convinced the market will keep falling. But when the price suddenly reverses, both panic and disbelief sets in. Some traders panic to exit, while others stay convicted to their short bias, only to get stopped out or liquidated at a greater loss later. Due to these mentalities, bear traps usually lead to a short squeeze.
Is Bear Trap Trading bullish or bearish?
A bear trap is bullish as it is a false breakdown of a bearish signal. The initial move draws in shorts, but the real opportunity comes when price reverses and traps them. Traders who spot the trap early can ride the upside with strong momentum behind them. It’s a contrarian play that rewards patience and confirmation.
Are bear traps actually effective?
Yes, when traded with proper confirmation and good risk management, bear traps can be highly effective. They often lead to sharp reversals driven by short covering and renewed buying. However, they’re also risky if misread or forced too early. The key is spotting confluence—structure, volume, and momentum must all align.


