


Written by:

Reviewed by:

Bearish
Bullish
- November 3, 2025
- 31 min read
Order Block Explained
Order Blocks are a part of Smart Money Concepts, a new trading approach which aims to capture the intention of large institutional traders by studying specific patterns and price action.
Since the late 2010s, the SMC trading approach grew from niche theory to mainstream retail strategy — spawning a wide range of discussions about its tools, such as order blocks, fair value gaps, and more.
Learn about one of the corner stones in Smart Money Concepts in this guide: Order Blocks!
What is an Order Block?
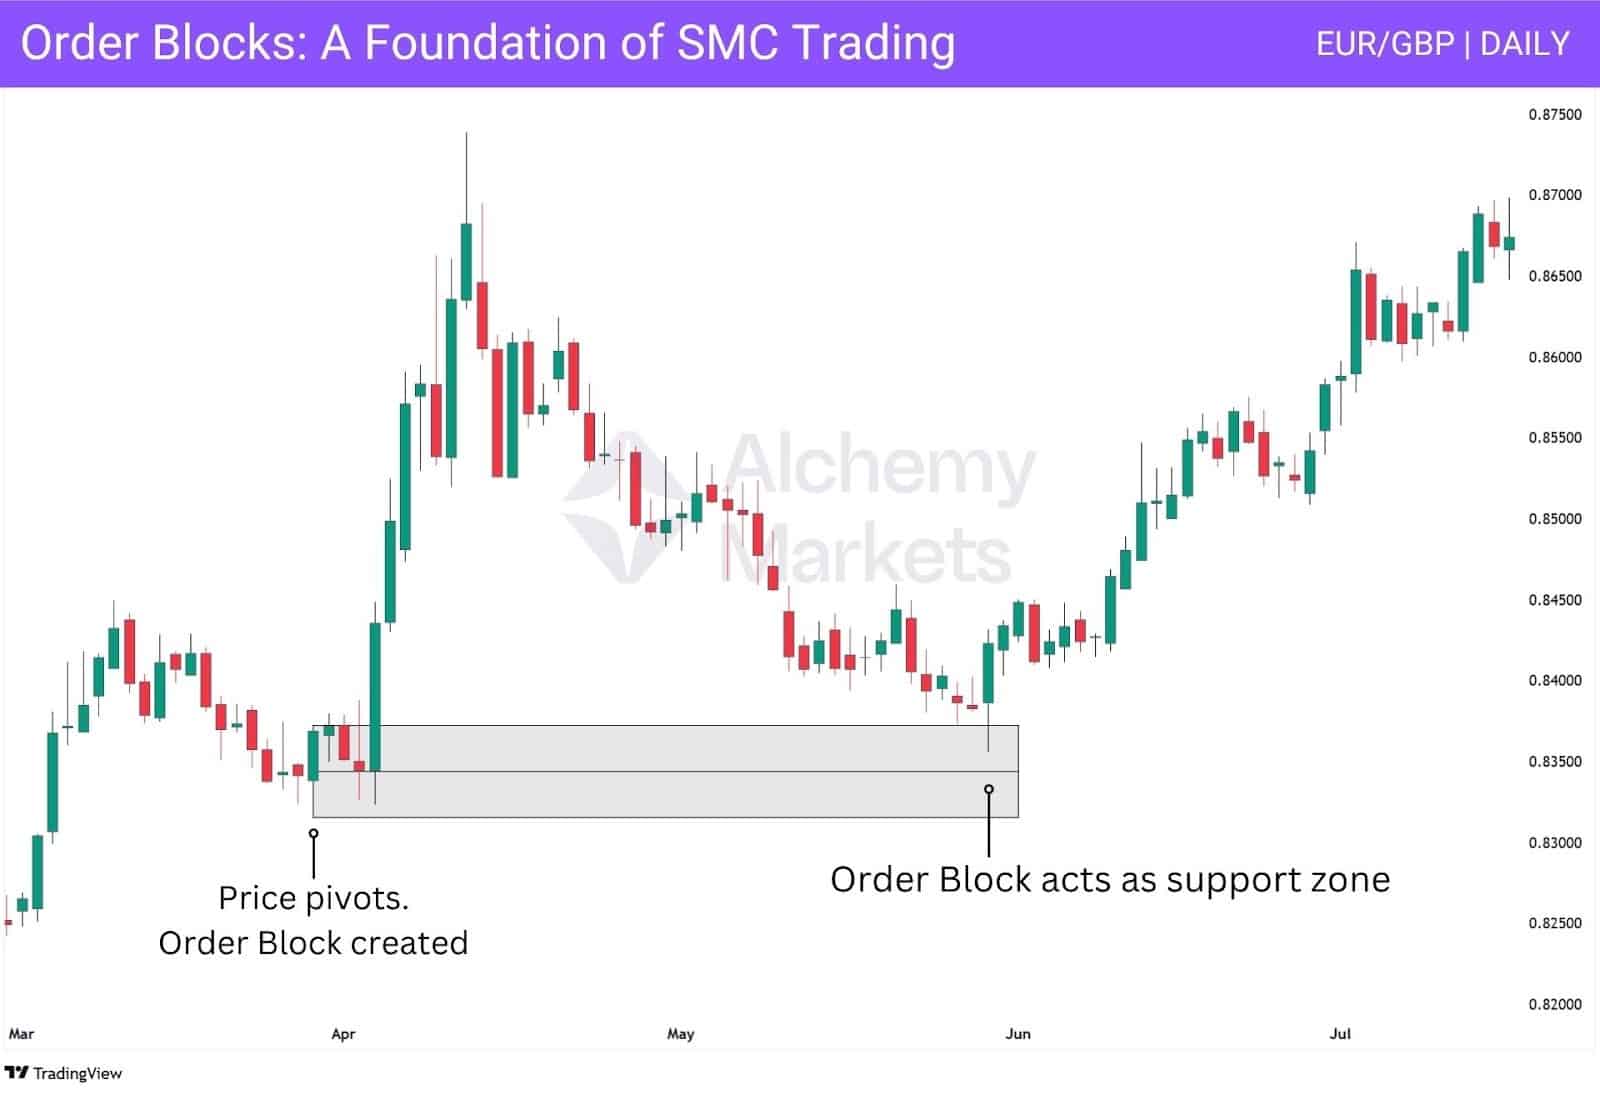
An order block is a way to mark support and resistances, primarily used by Smart Money Concept traders. The order block, or ‘OB’ for short, is a defined price range believed to contain unfilled institutional buy or sell orders.
So, what happens when the price revisits an area with large, unfilled orders?
Those orders get filled, and price pivots away sharply. That is the core principle of an order block.
How to Identify an Order Block
An order block is the full price range of the final candle in a directional move. This is usually:
- The last bearish candle before an uptrend.
- Or, the last bullish candle before a drop.
Think of it like a footprint: price was moving one way, then suddenly reverses. That last candle marks where big players “put their foot down” to stop the price in its tracks. This leaves behind a clear zone of interest for us to trade.
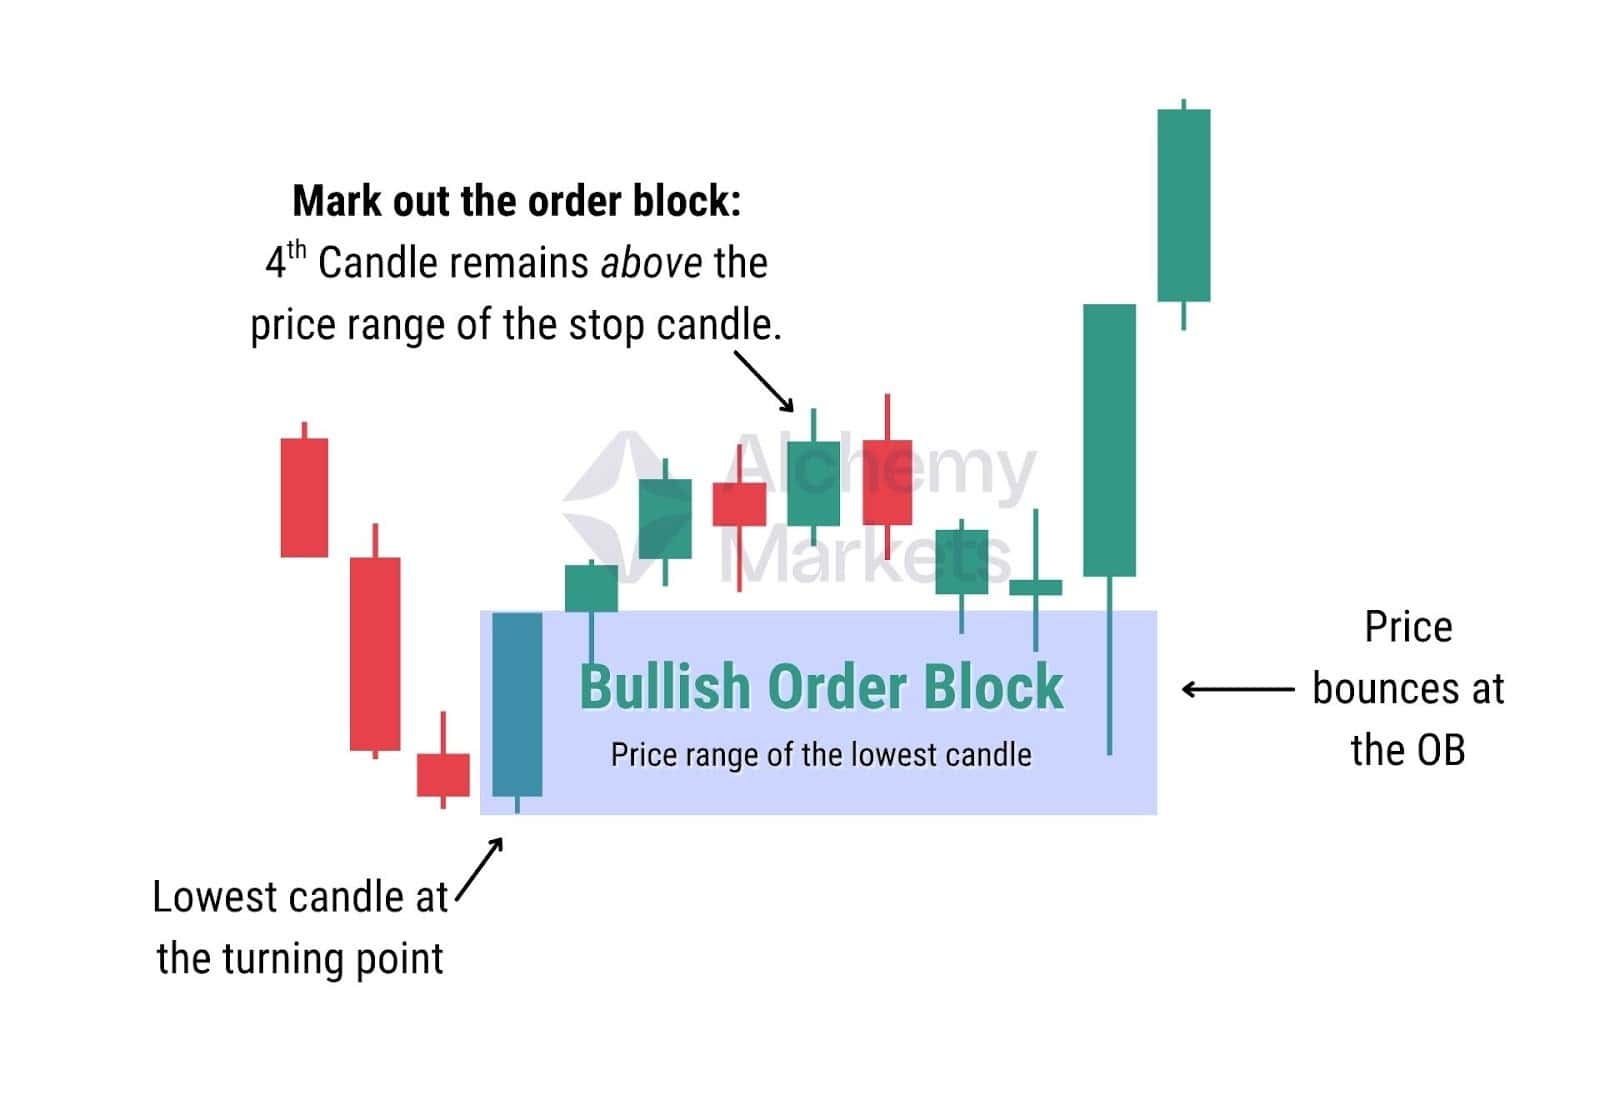
How to Identify a Bullish Order Block
To spot a bullish order block, look for the following:
- Price was in a clear, bearish directional leg.
- The price stops and reverses, making a clear pivot or zig-zag.
- The bullish order block is the price range of the highest candle at the turning point.
Now, you may be scratching your head… How would I know when exactly the price makes a clear pivot?
Great question — and thinking that way already makes you a more critical trader. The truth is, most order block guides don’t give a clear rule for this. So here’s a practical tip we use:
- Check the fourth candle after the stop candle.
- If the price remains above the price range of the stop candle, you can confidently mark out a bullish order block.
How to Identify a Bearish Order Block
To spot a bearish order block, look for the following:
- Price was in a clear, bullish directional leg.
- The price stops and reverses, making a clear pivot or zig-zag.
- The bearish order block is the price range of the highest candle at the turning point.
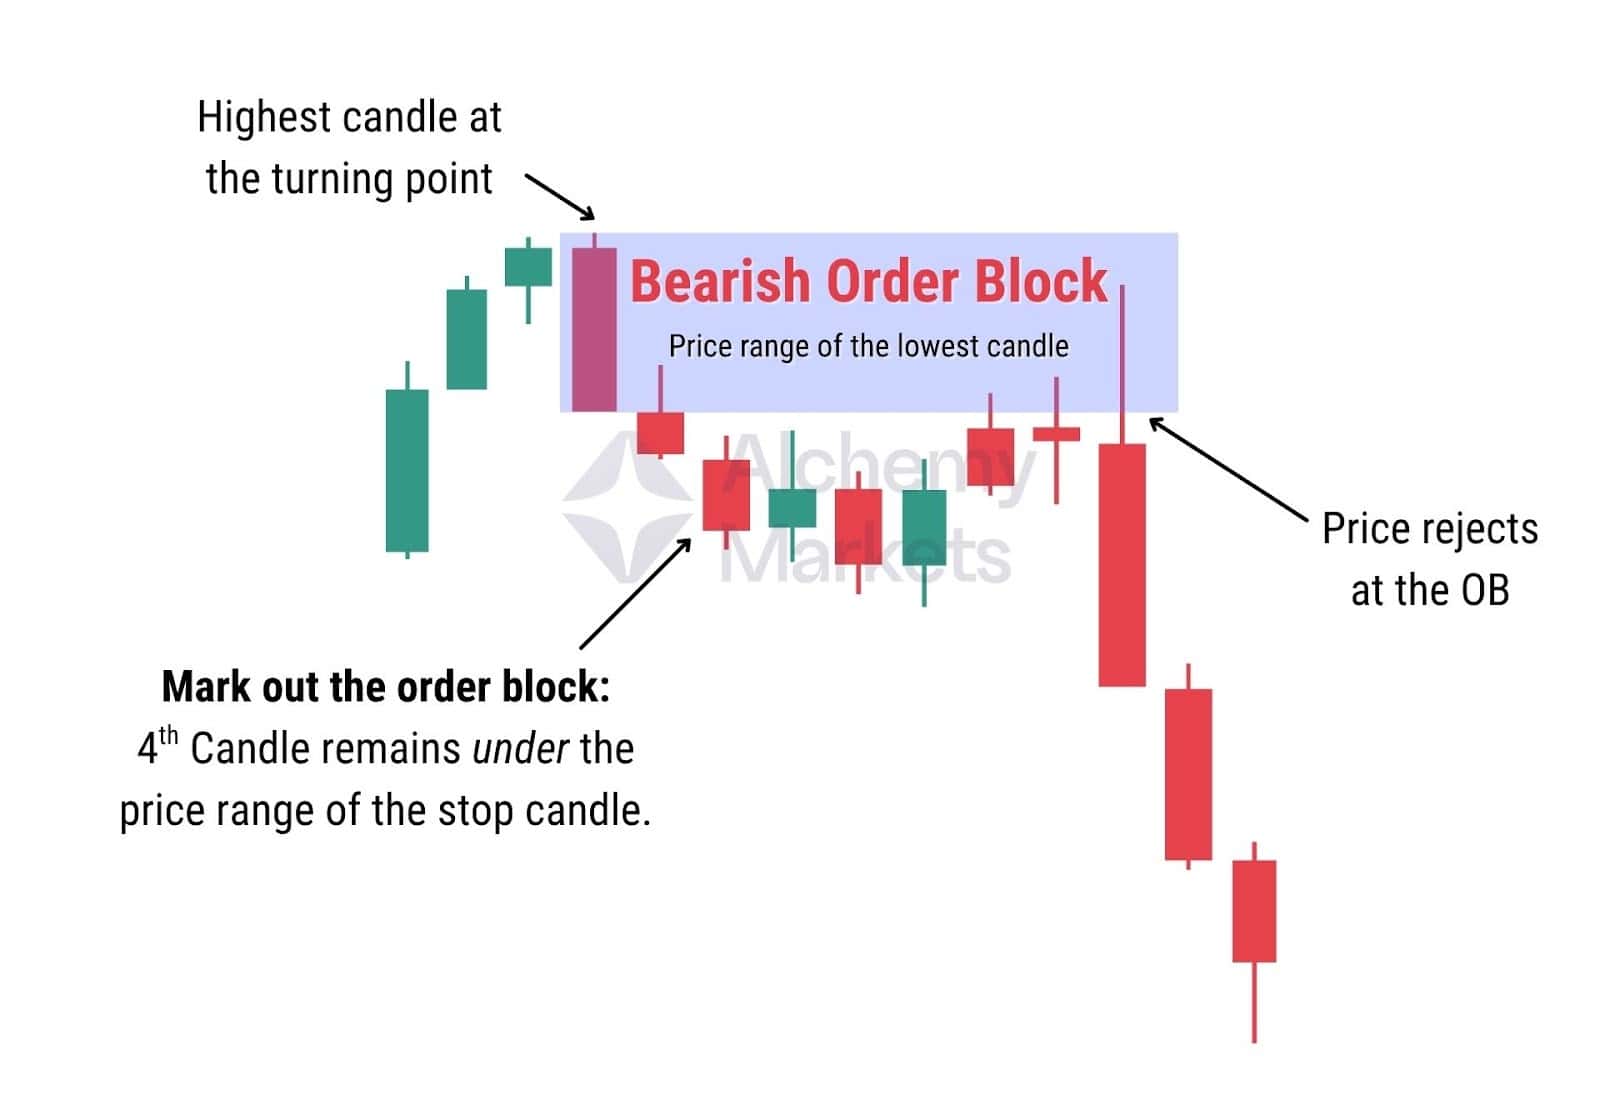
Remember the clear pivot principle we mentioned? The inverse logic would apply here:
- If the fourth candle stays below the high of the stop candle, you can confidently mark it as a valid bearish order block.
How Does Order Block Work?
Depending on where the price is in relation to an order block, it either acts as a support or resistance zone:
- If the price is above an order block, the OB fulfills the role of a support zone.
- If the price is under, the OB fulfills the role of a resistance zone.
Simple enough. But! The concept of order blocks can definitely run much deeper than that.
How we expect price to react at an order block will shift depending on the macro trend, fundamental factors, and even the type of order block (yep — there’s more than just bullish and bearish).
Types of Order Blocks
Order blocks go beyond just bullish and bearish setups. There are other types with unique roles; each one behaves differently depending on market context.
Understanding these roles can help you gauge:
- How price is likely to react to an order block.
- When or when not to trust the strength of an order block.
- Which type of order block suits your strategy (entry, continuation, or reversal).
Bullish Order Block
A bullish order block is a support zone that sits below the current price. Price is more likely to increase if it ever reaches a bullish order block; but note that success is never guaranteed. Bullish order blocks can fail, turning it into a bearish breaker block.
Bearish Order Block
A bearish order block is a resistance zone that sits above the current price. Price is more likely to fall if it ever reaches a bearish order block. However, in the event price breaks a bearish order block, that zone is then flipped into a bullish breaker block.
Breaker Block
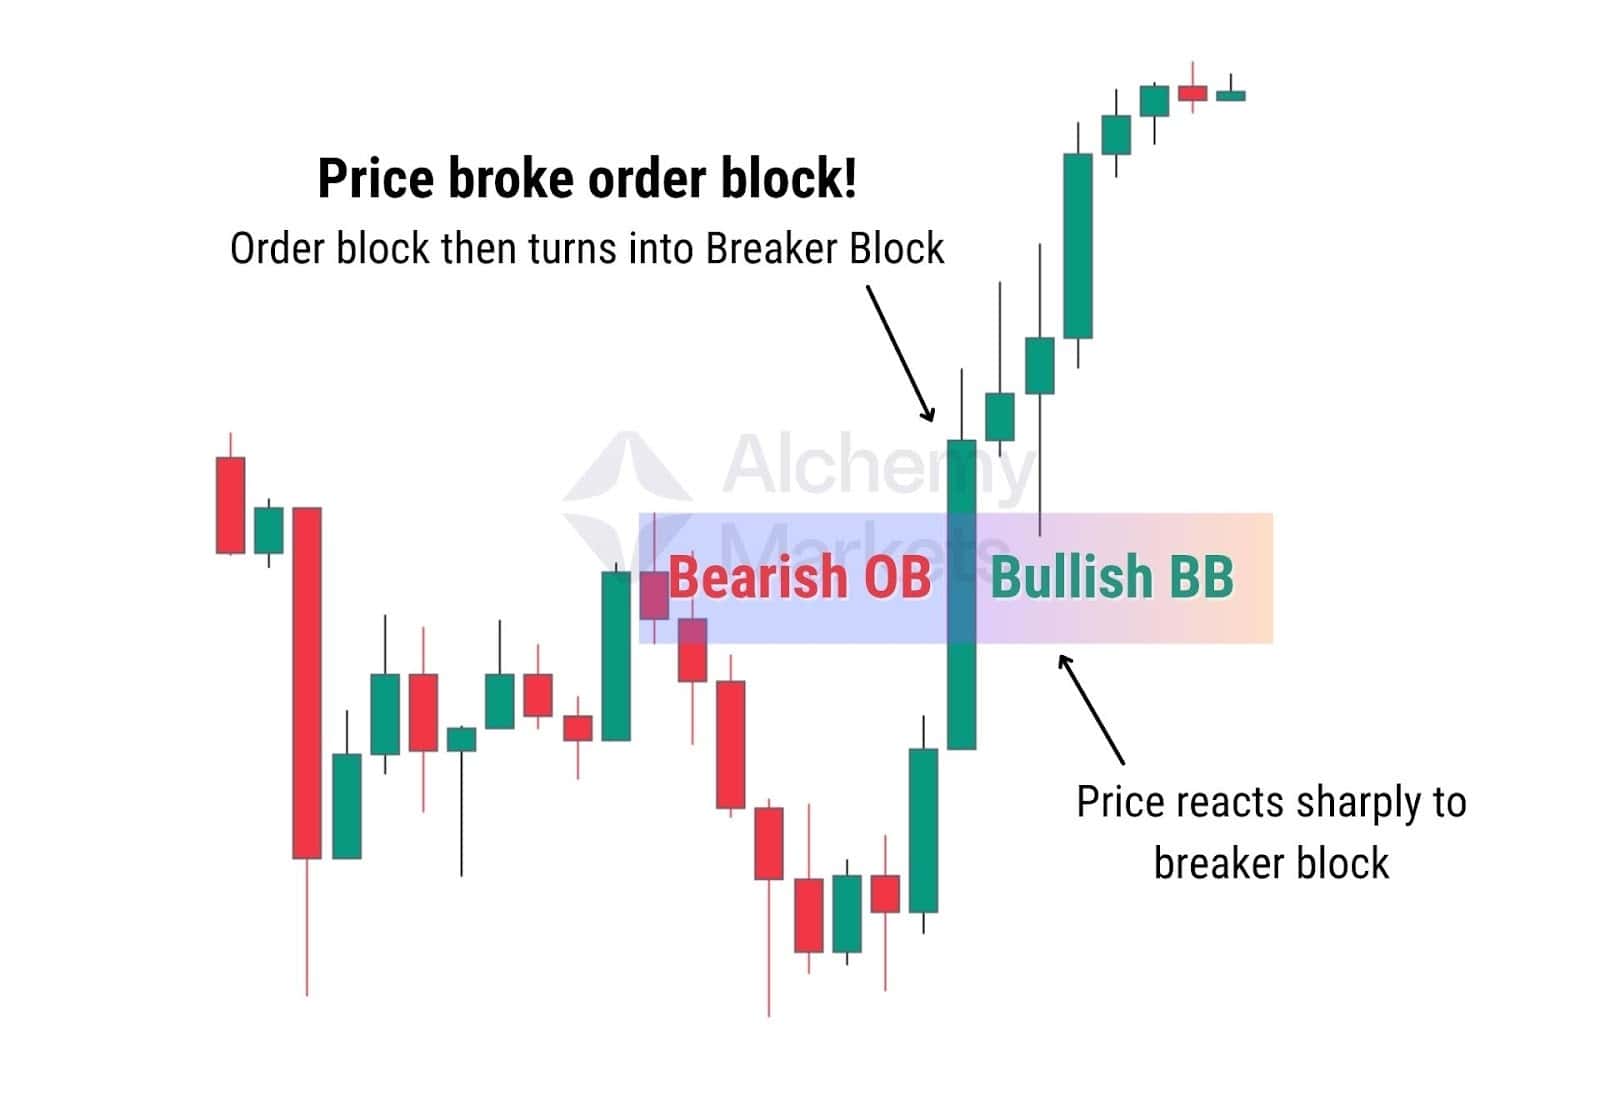
Breaker blocks (BB) are order blocks that price has broken through; hence the name. Functionally, it acts like a regular order block: if price is above, it’s support; if it’s below, it’s resistance. The key difference here is that a breaker block has flipped sides. What used to be support now acts as resistance, and vice versa.
Rejection Block
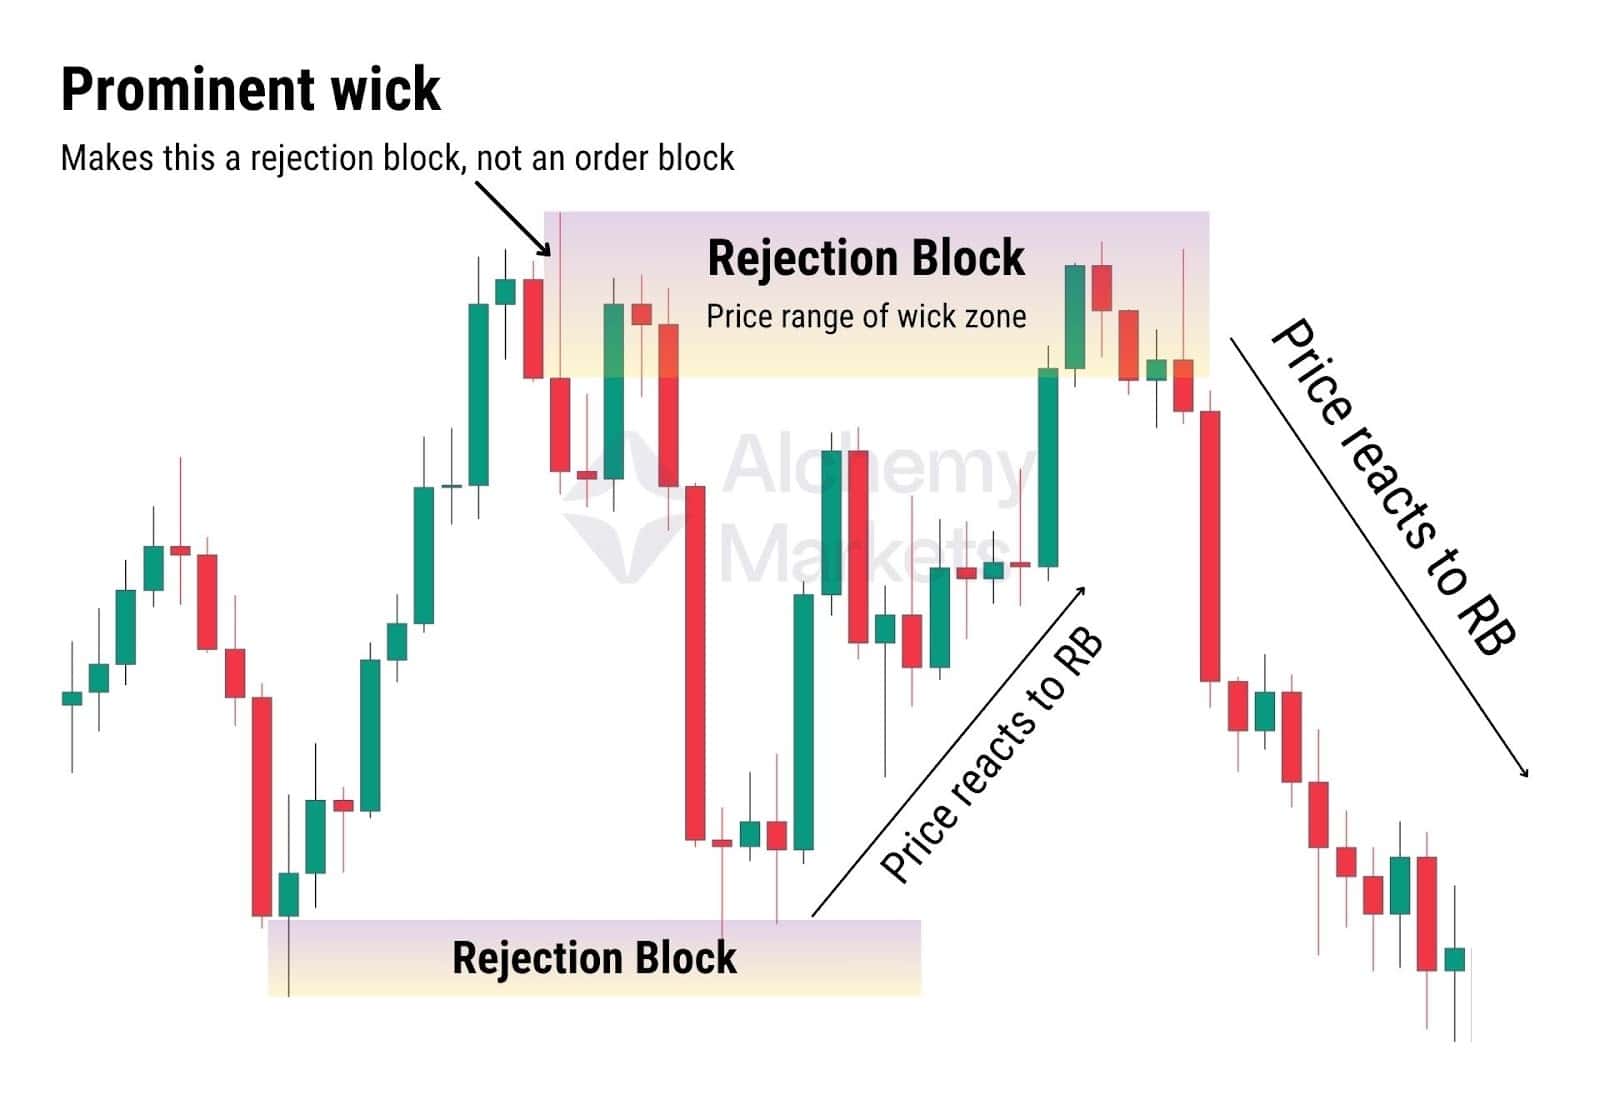
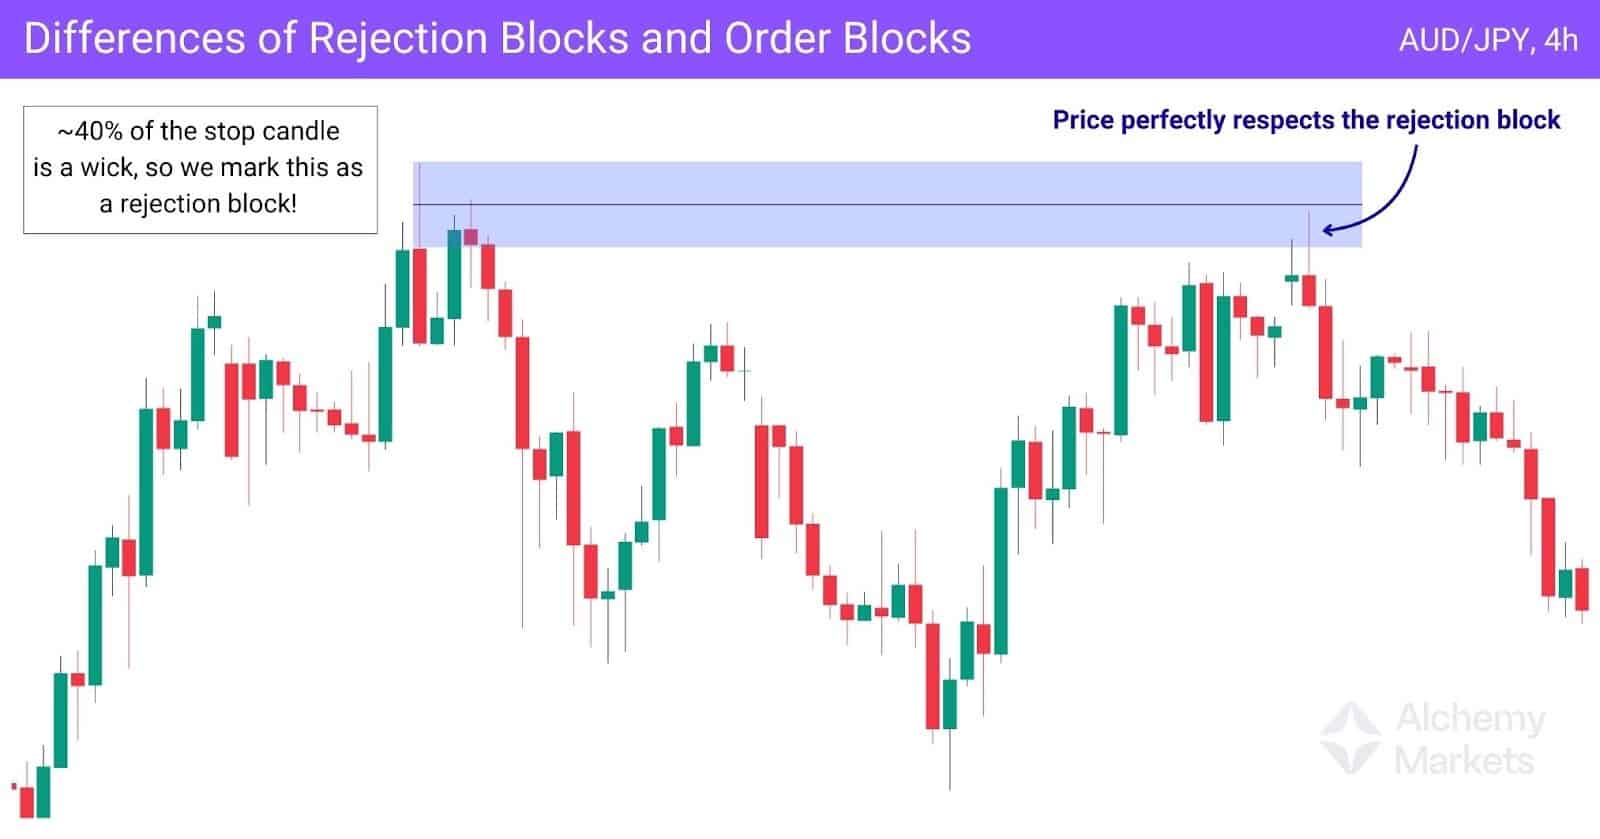
A rejection block is a specific type of order block characterised by a large wick. And instead of marking the full candle range, you focus only on marking the wick zone.
The rejection block has this important distinction from the standard order block for the following reasons:
- The wick represents the strongest reaction where price was sharply rejected.
- Such reactions suggest buyers or sellers may defend the level if the price returns.
- Quick moves often leave unfilled orders behind, which historically is likely to be revisited.
Now, there’s no hard rule when it comes to determining a ‘large wick’.
However, systemising it could be very helpful for beginners. A good rule is to look for wicks that are around 40% of the entire candle’s range. This ensures a level of objectivity in your decision between marking a standard order block, or a rejection block.
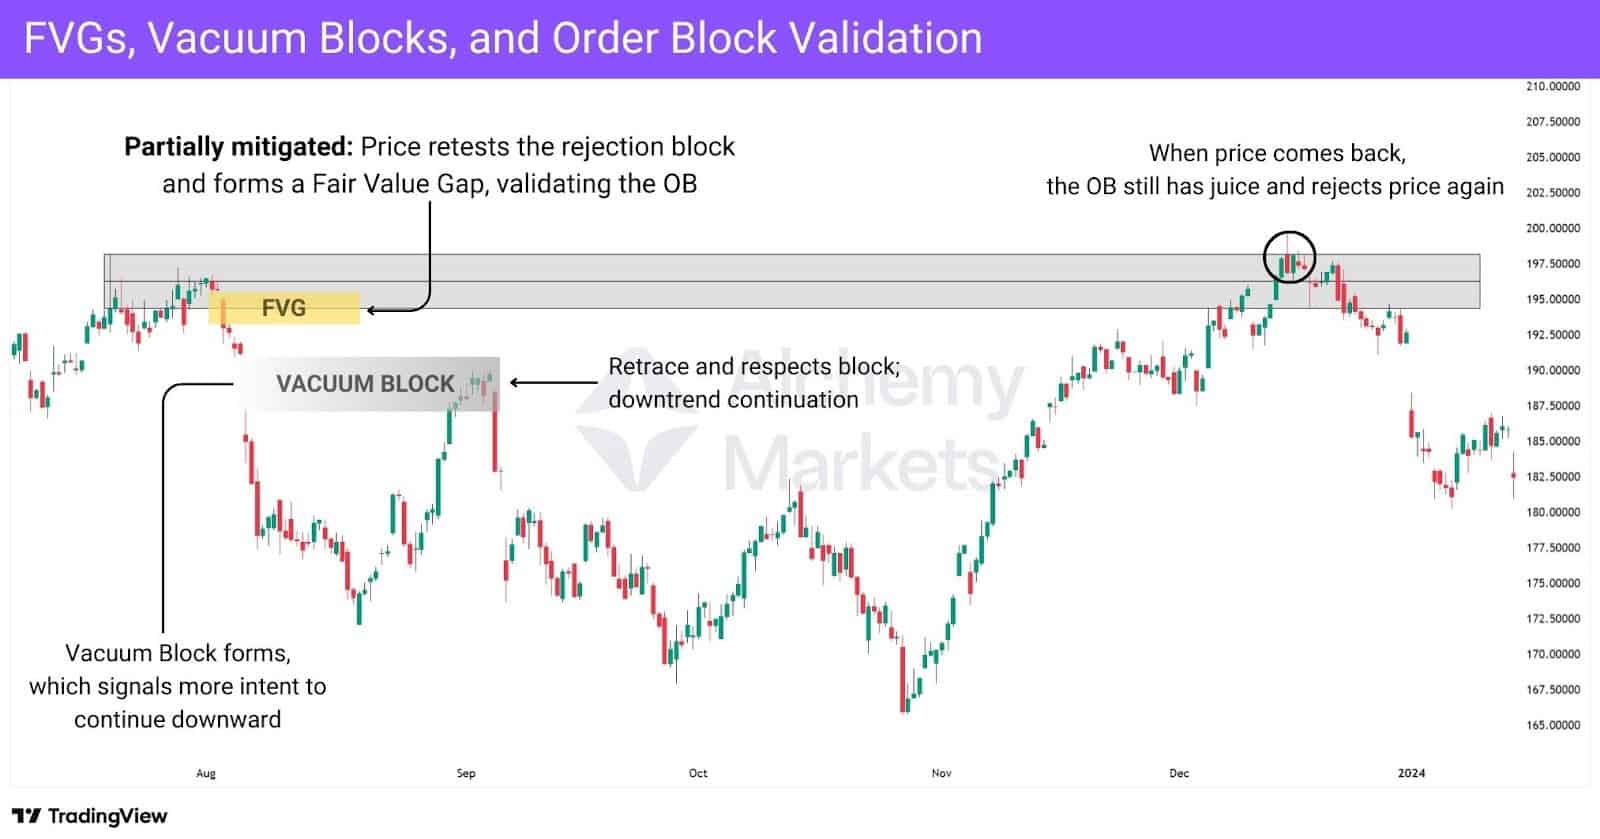
Vacuum Block
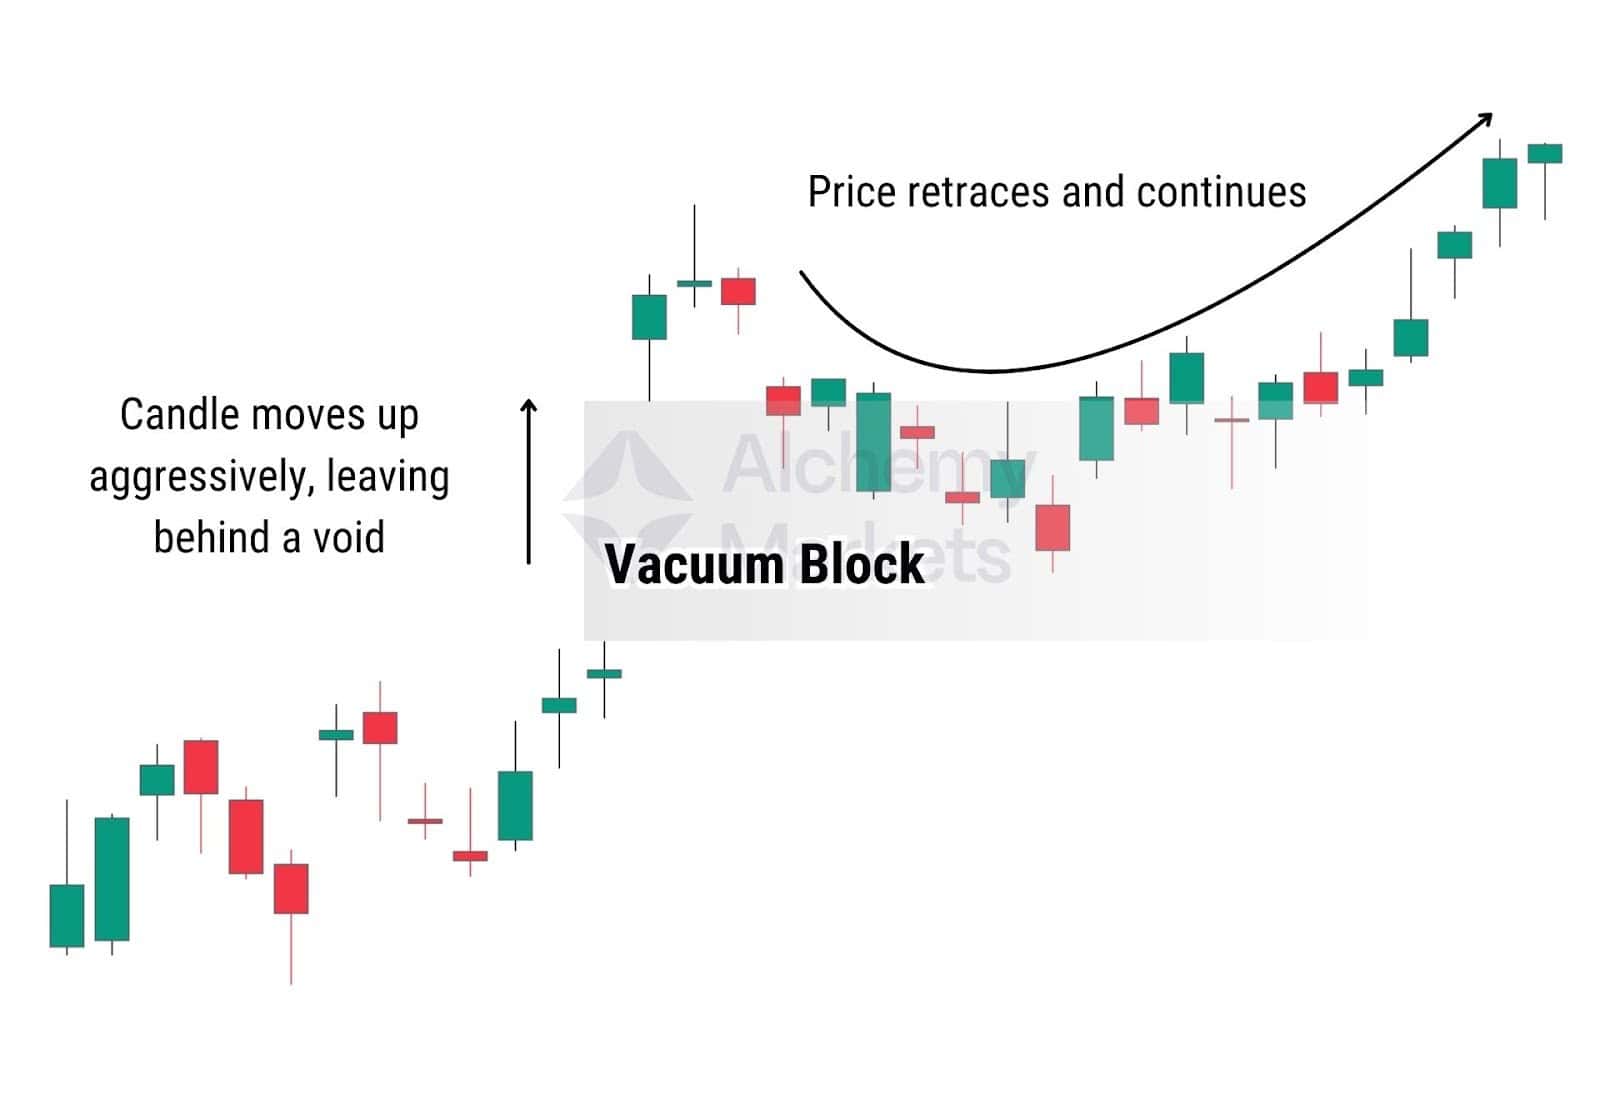
Vacuum blocks are a niche term for a common market gap, mostly used by ICT traders, a subgroup within the Smart Money Concepts framework. Normally, candlesticks open and close in sequence with little spacing. But sometimes, price moves so aggressively that it leaves a visible gap between two candles, which is an area where no trades occurred.
Imagine if the price of a pair of Nike shoes suddenly jumped from $50 to $80, without ever testing $55, $60, or anything in between. That’s essentially what happens in a market gap, or what ICT traders call a vacuum block.
When this happens, the market is briefly in shock — did we really just jump that high or that fast? This uncertainty often causes hesitation, allowing price to drift back into the vacuum zone and “ask” the market: are you actually willing to buy or sell here?
In a gap up, buyers might see that return as a second chance:
“Nike just shot to $80, but now it’s back to $60? I’m buying!”
The same logic, of course, then applies in reverse for sellers after a gap down:
“Nike just went down to $20, but now it’s back at $40? I’m getting rid of these!”
Order Blocks Indicators
There are no OB indicators built into platforms like TradingView or MetaTrader by default. That means if you want one, you’ll need to rely on community-built indicators.
While there are plenty of options out there (many of them free), they all take different approaches in how they detect and define an order block. So if you’re choosing to use an indicator, be sure to carefully inspect how it calculates and determines the order block.
Standard Order Block Indicator
Here’s the catch: many order block indicators will differ in the way they define these zones. This happens because the order block is a relatively fresh concept in trading, and has various definitions. Some indicators calculate simply by detecting a pivot based on price, while some tools calculate volumetric order blocks based on order flow.
In this article, we’ve defined it in the most common way it’s used — as a price zone marked by either the higher or lowest candle at a turning point (or pivot).
When choosing a standard OB indicator, ask yourself:
- Does it use the full candle range or just the body?
- Is it marking the pivot candle or the one before it?
- Are there too many overlapping zones? Some filters (like the 4-candle rule) can help reduce signal noise.
Different indicators use different logic, so be sure their rule set matches the way you want to trade.
Order Block Breaker Indicator
Here’s where it gets a bit tricky — once price breaks through an OB, many indicators simply remove it from the chart. That’s not ideal if you’re trying to spot breaker blocks (former OBs that now act as support or resistance).
Remember, there aren’t any native indicators to figure this. As a result, you want to closely inspect any community built indicators. What you want instead is either:
- An OB indicator that retains mitigated OBs, so you can still see the structure
- Or a tool that specifically highlights breaker blocks
Just keep in mind: if an indicator’s OB logic is too rigid or narrow, that’ll directly impact how the breaker is visualised too.
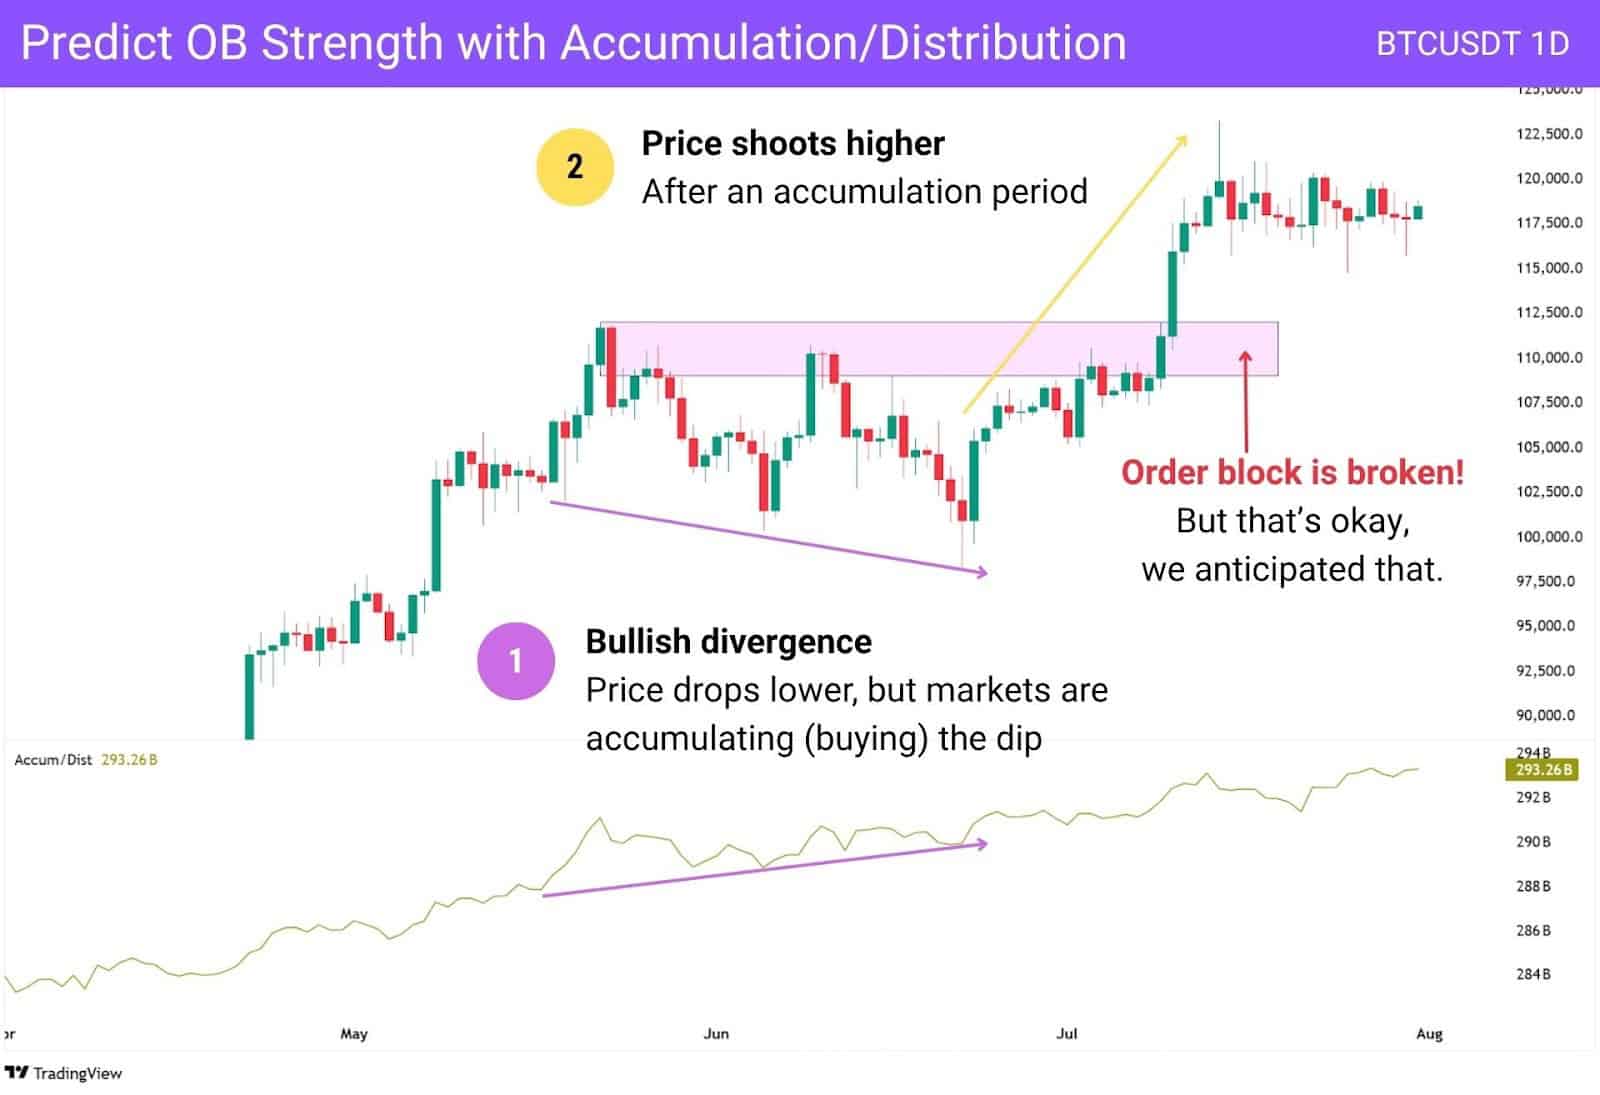
Accumulation / Distribution
Accumulation/Distribution (A/D) indicator is a volume-based tool that helps you understand whether a market is being accumulated (bought) or distributed (sold).
Unlike basic oscillators like RSI or Stochastic, this one actually considers both price movement and volume to build a cumulative running total, which gives it more weight in detecting shifts in buying or selling pressure.
So how does this help with Order Blocks?
It’s not about using A/D to draw OBs — it’s about using it as an early signal. When the A/D line is diverging from price (e.g. price is going up, but A/D is dropping), it could mean the current move is running out of steam. That’s your cue to start watching for a possible pivot — and that’s when you begin planning an order block.
Here’s how to combine them:
- Spot a divergence or exhaustion in the A/D line.
- Look for a sharp shift in price (pivot).
- Mark your OB using our standard rule: the highest/lowest candle before the reversal.
- Confirm with the 4-candle follow-through logic we shared earlier.
Think of A/D as your early warning radar. It doesn’t tell you where to trade, but it does a pretty good job of letting you know when to start paying attention.
Importance of Order Block
Order blocks are important because they are defined ranges where the market showed clear interest. Price previously pivoted away from these zones — which tells us that traders had actively entered positions there.
So when price revisits an order block, it’s arriving at a decision point: will those traders defend the zone again, or will the other side overpower them?
Unlike horizontal support and resistance lines, order blocks give you a range to work with. This helps you stay realistic when price deviates or wicks around a level — instead of expecting perfect reactions to a single line.
This zone-based mindset is key. It reflects how institutions trade: not with exact levels, but with areas where large orders were stacked. Because of their large trade volumes, institutions need to layer in their orders — otherwise, they risk only partially filling orders and moving market prices too drastically from their ideal entries.
That’s why OBs often act as reaction zones, and why they’re worth paying attention to.
Order Block Example
In this USD/JPY daily chart, we can see the market is clearly trending upward. Notice how price continues to respect the order blocks from previous retracements, often bouncing without retesting the exact same lows.
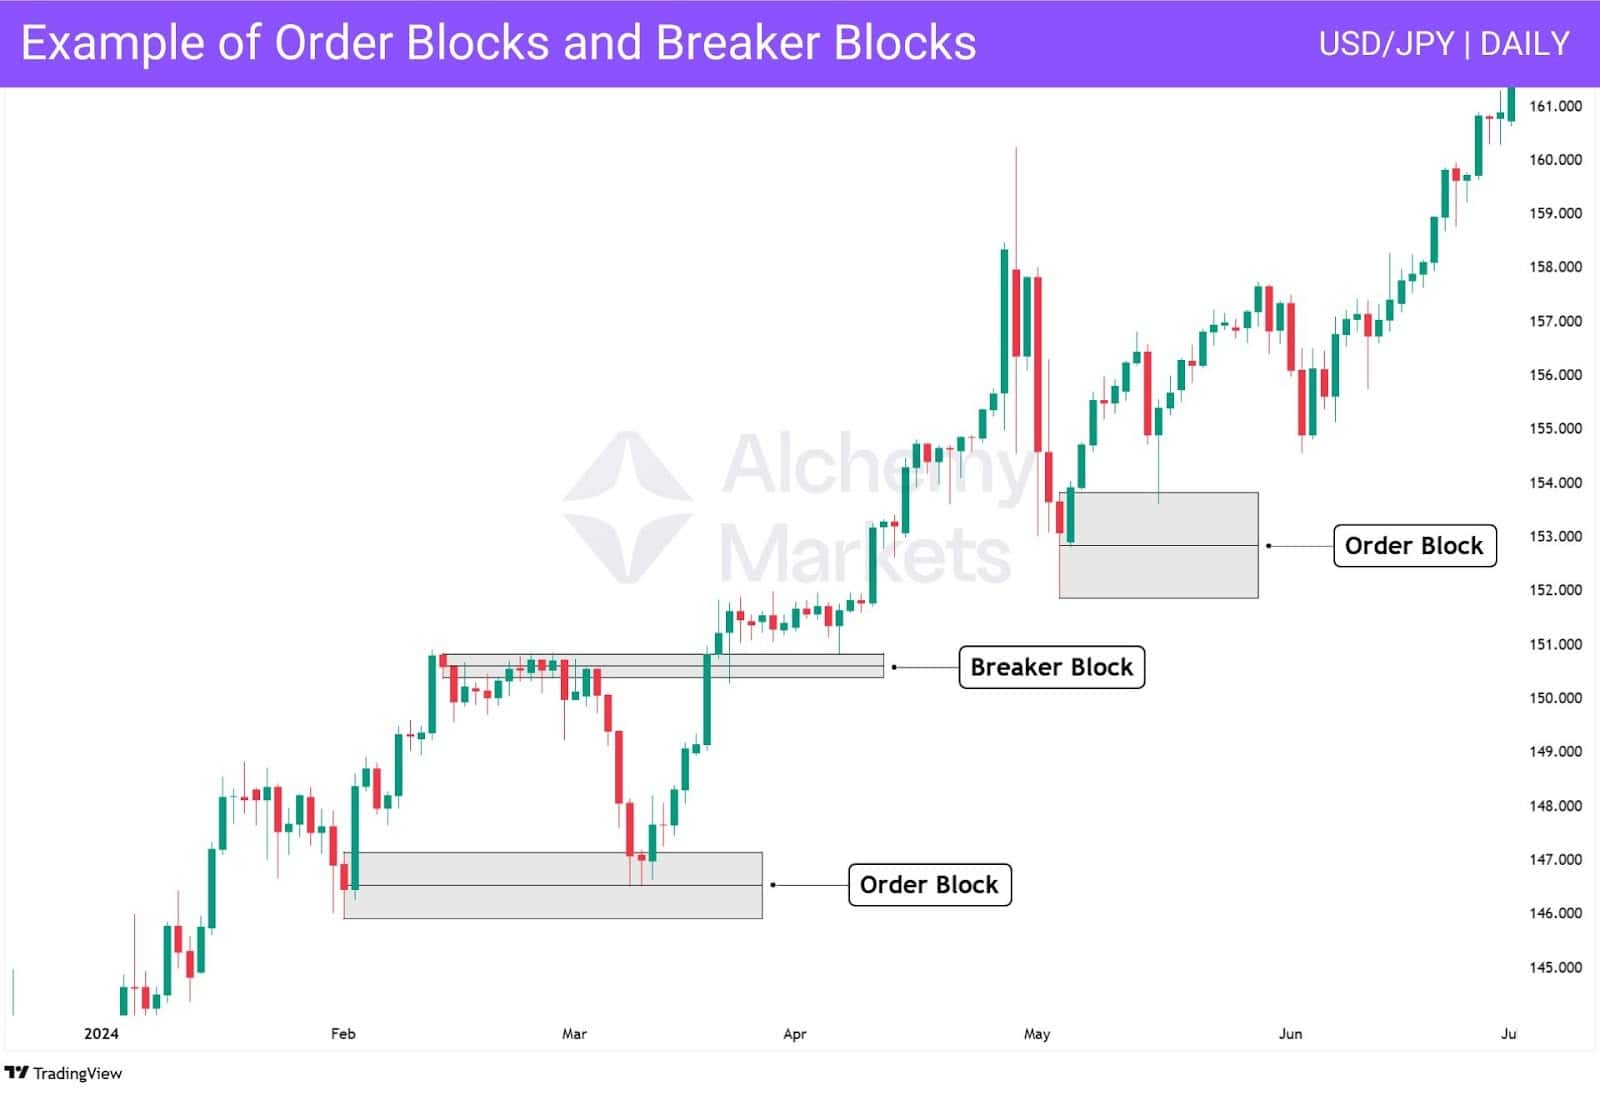
What stands out here is that price doesn’t need to touch the precise wick or body of a candle to react. Instead, it responds somewhere within the order block zone, showing the value of using a range over a fixed line.
This highlights one of the key strengths of order blocks: they blend the precision of horizontal support/resistance levels with the flexibility of zone-based thinking.
Whether you mark from candle bodies or wicks, both can be valid — and the OB helps you capture the best of both worlds — even when it turns into a breaker block, as seen above!
Order Block Strategies
An order block trading strategy is essentially a more refined way to mark support and resistance zones.
With so many choices in store, we’ll just focus on the most practical and unique ways people trade using order blocks — though keep in mind, they can be integrated into a much wider range of approaches.
Trading the 50% of an Order Block — Consequent Encroachment (CE)
Many traders treat the 50% mark of an order block as the key level to trade from. If the price returns to that level, it tends to react.
It’s where they’ll either set a limit order in advance, or wait for a reaction like a wick or reversal before committing. In Smart Money Concepts, this midpoint is called the Consequent Encroachment, or CE.
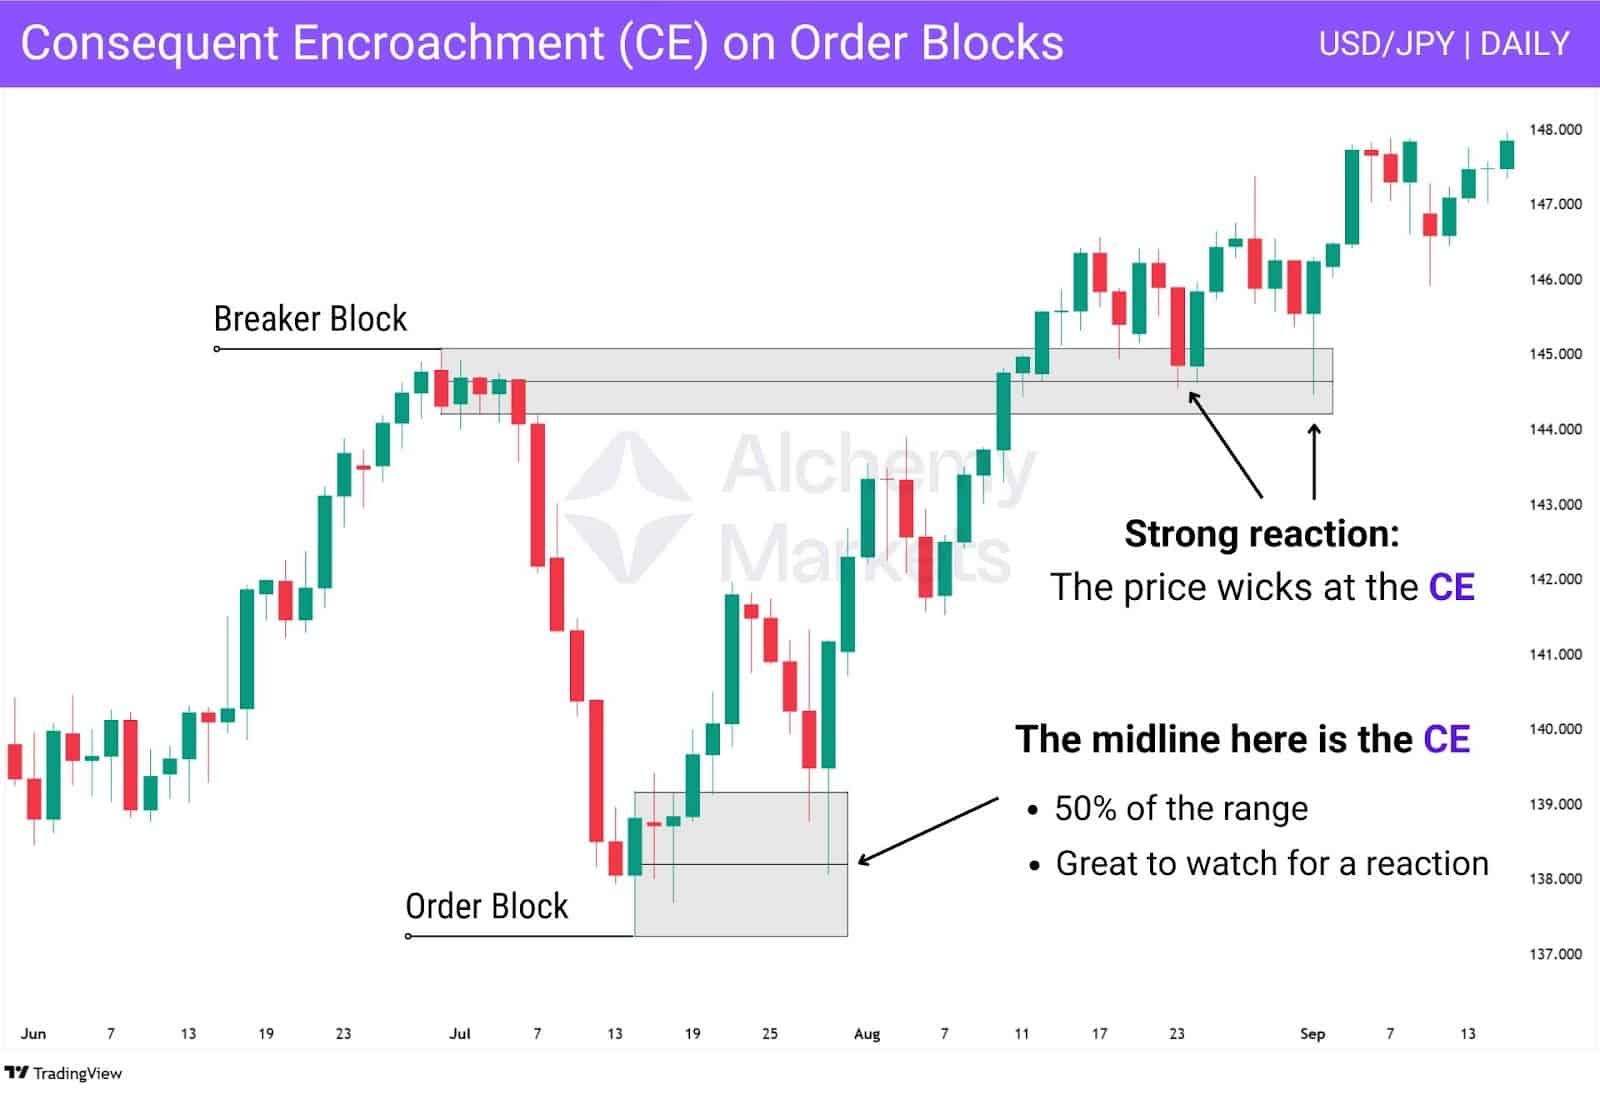
Looking at the USD/JPY example above, you’ll notice a common pattern: price taps the CE, wicks into it, and then reverses cleanly. That kind of reaction is a strong sign that buyers or sellers have stepped in to defend the zone.
Also worth noting: the CE remains a valid level even after an order block flips into a breaker block
Notice how in this chart, the price broke above the original bearish block, turning it into a bullish breaker. The CE still acted as a reaction point for the breaker block, supporting the USD/JPY price when it retraced.
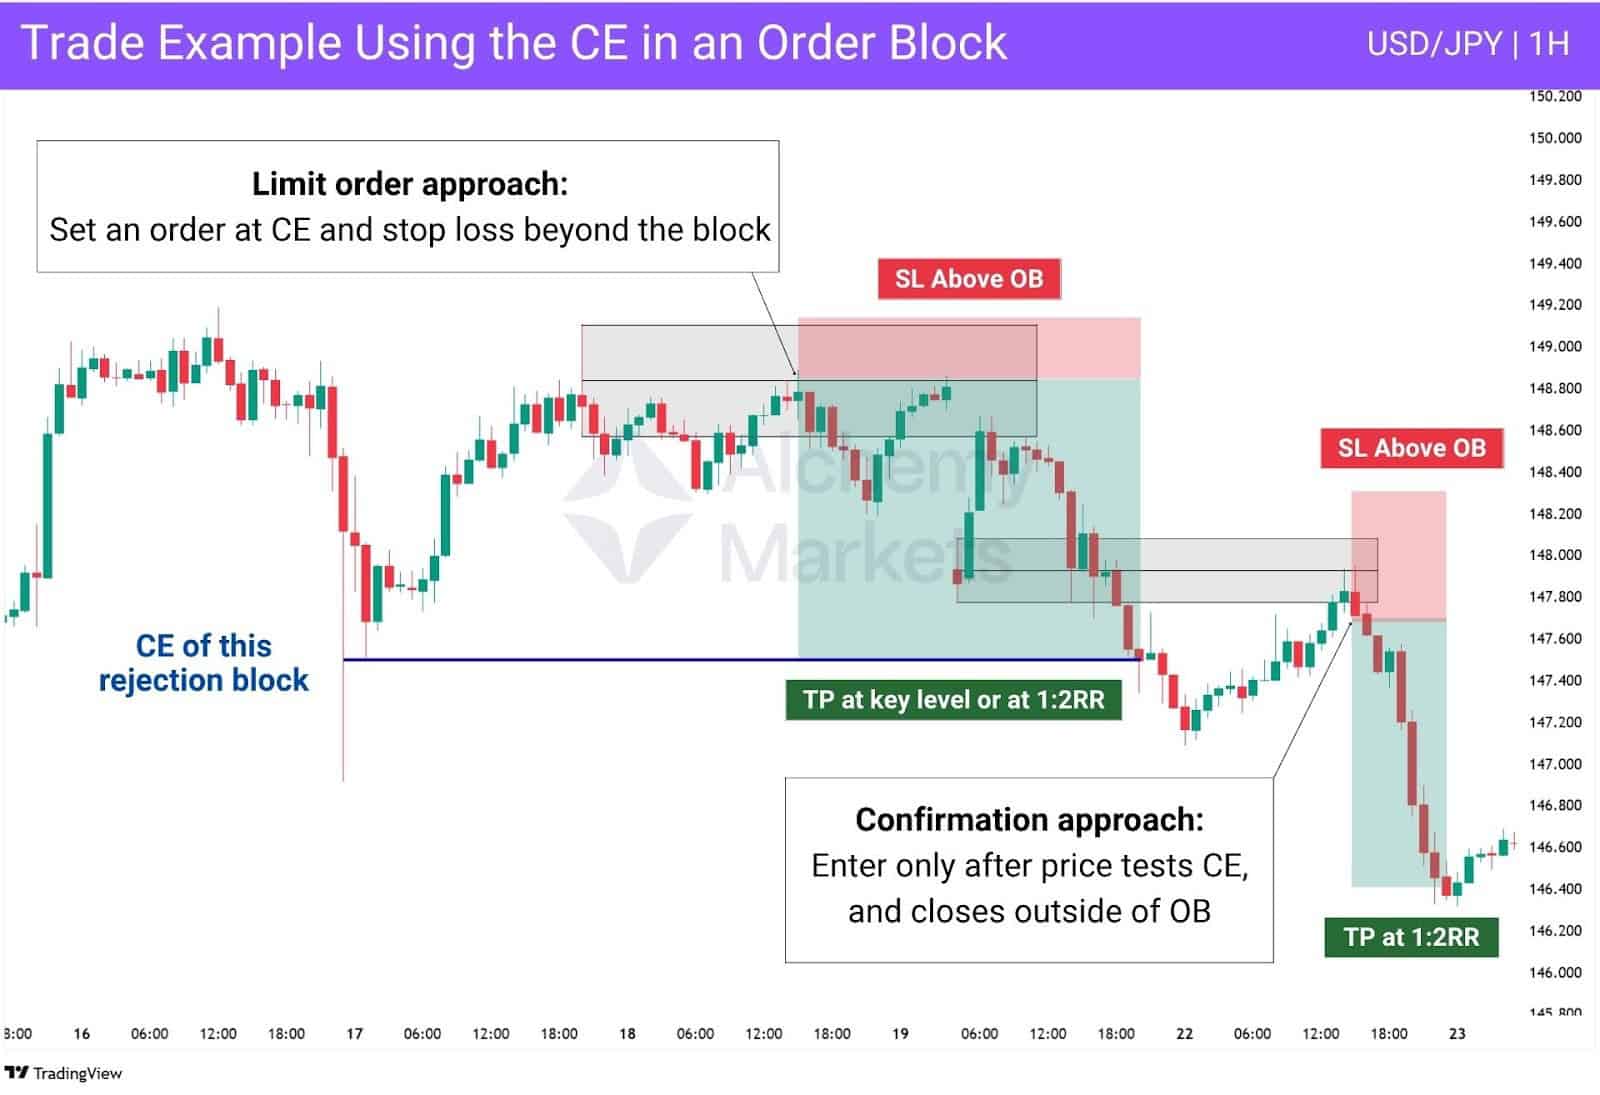
Let’s look at another example — this time with entries, stop losses, and take profits shown.
There are two main ways to trade the CE:
Limit order approach
- Place a pending order at the CE.
- Stop loss just outside the block.
- Target 1:2 RR or a nearby key level.
In this chart, we used the CE of a rejection block as a take profit zone — price respected it perfectly on the retest.
Confirmation approach
- Wait for the price to wick into the CE.
- Enter only if it closes above or below the block, confirming the strength of the move.
- For bullish OBs: Wait for price to close above the block.
- For bearish OBs: Wait for the price to close below.
In our example, the bearish CE gets wicked, then the price closes below — that’s your go signal. This second method adds a layer of confirmation for cleaner trades.
Combining Order Blocks with Fair Value Gaps
Fair Value Gaps (FVGs) are another core concept in Smart Money Concepts that can be paired with order blocks.
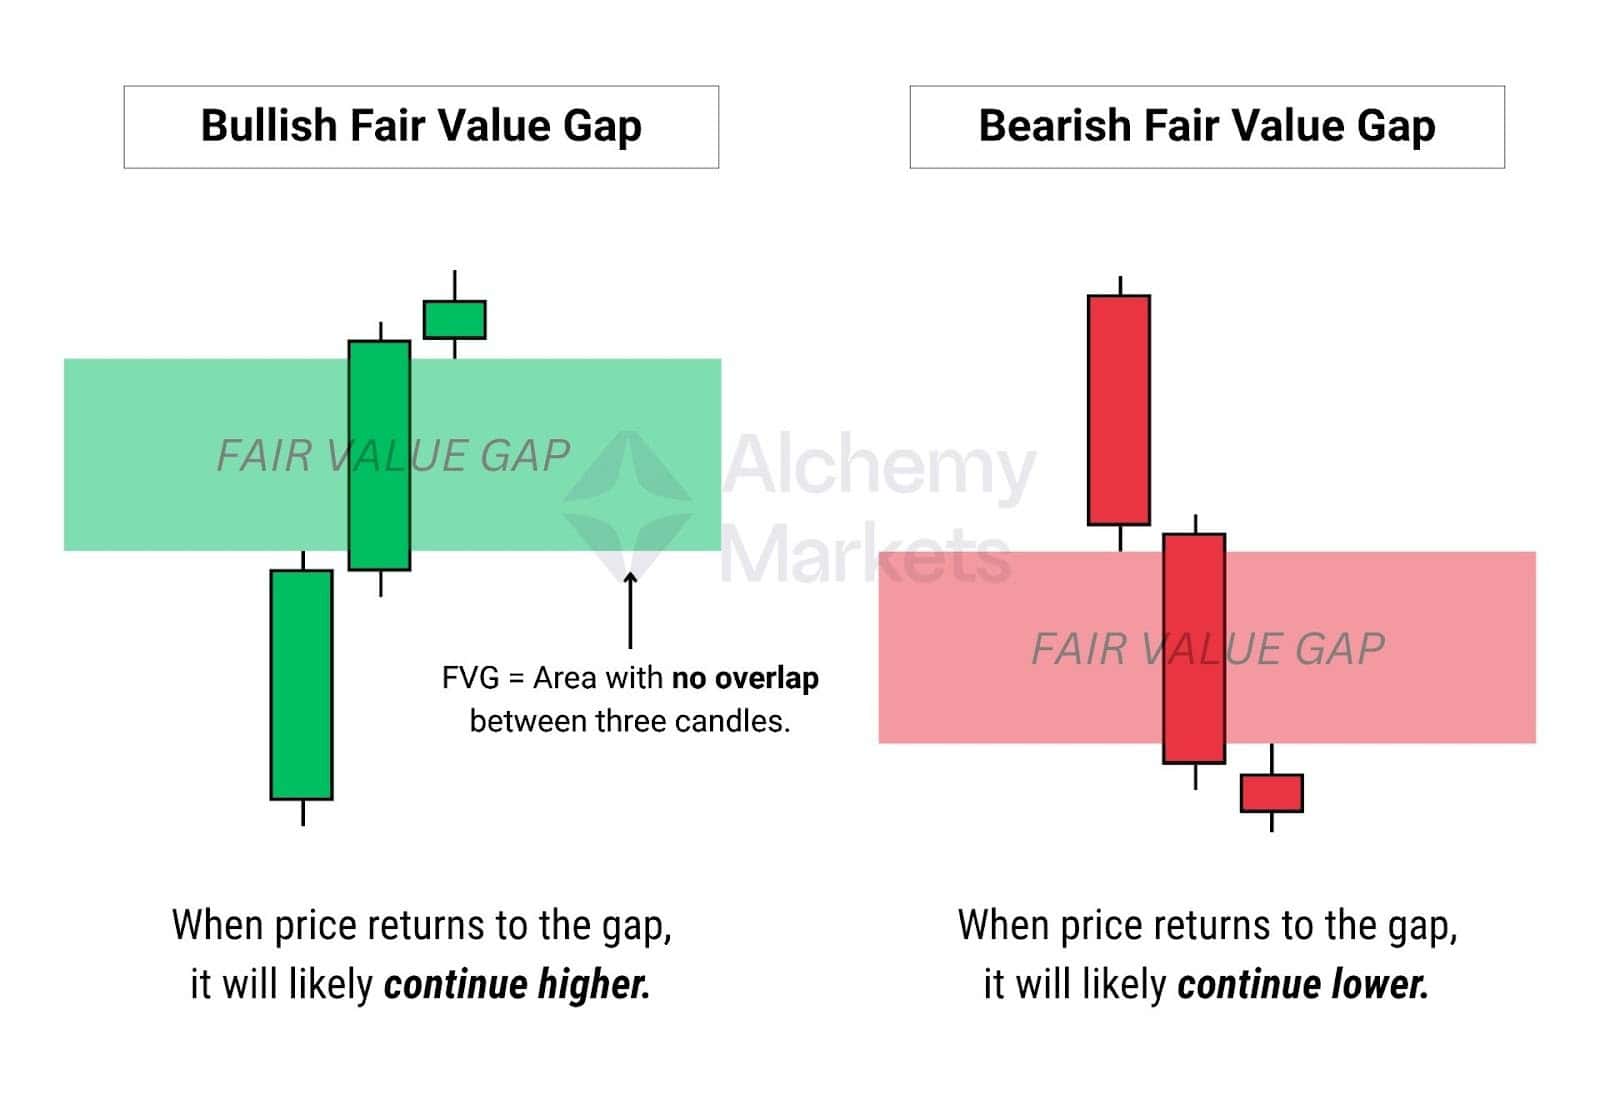
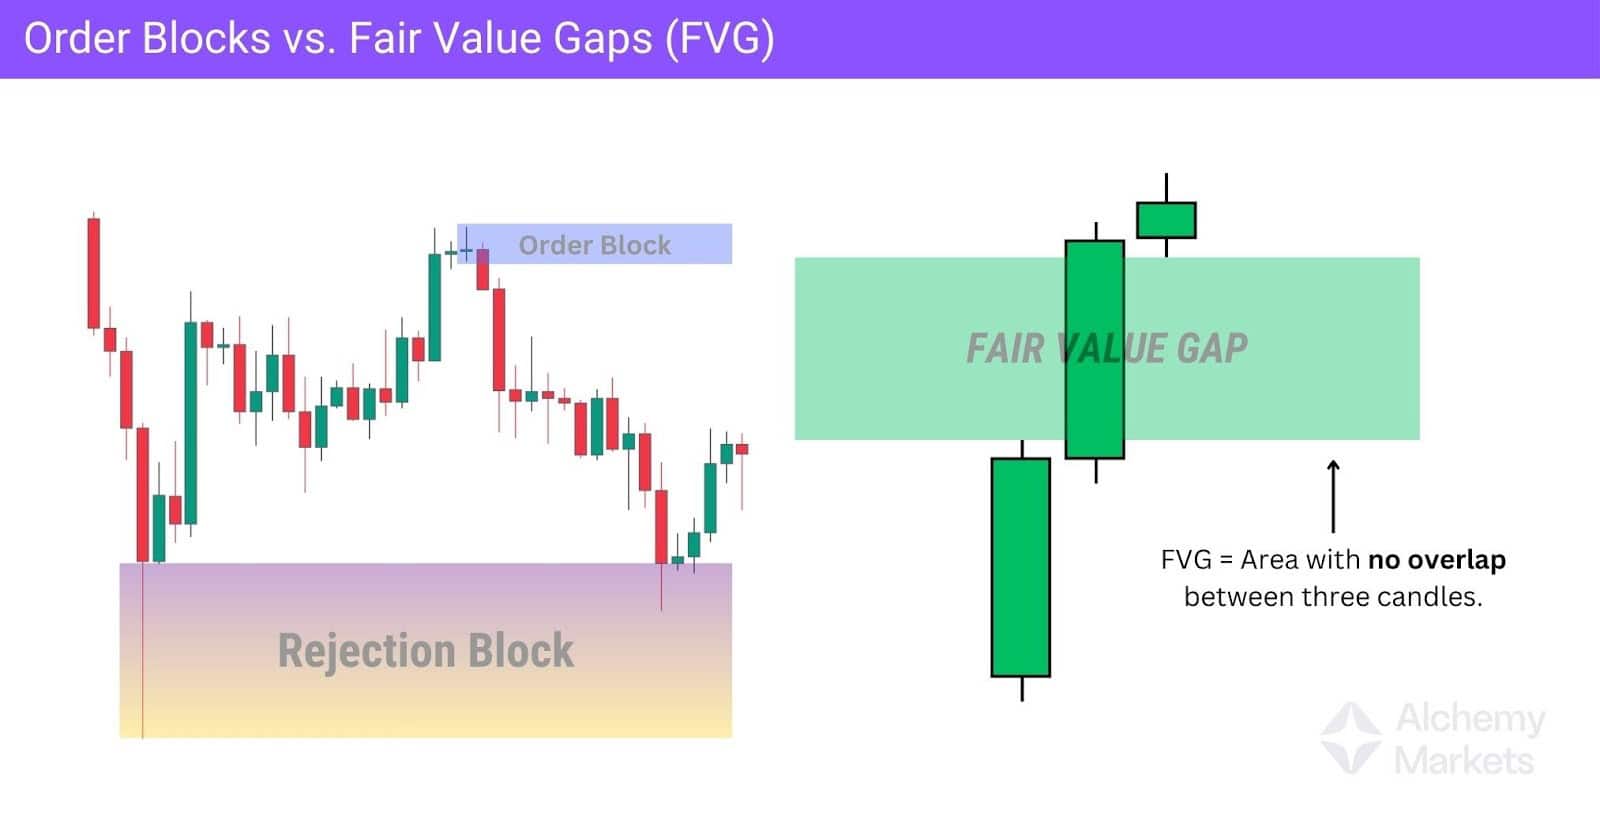
Technically, they are three-candle patterns that represent a strong, one-sided move in the market. When an FVG forms, it’s common for price to retrace into the gap, then pivot away — making it a key zone to watch for potential trade setups.
These gaps are formed by a large middle candle that moves so aggressively it doesn’t overlap with the candles before and after it. If the move was bullish, the FVG acts as a support zone. If the move was bearish, it acts as resistance.
So how does this relate to order blocks?
Well, Fair Value Gaps often appear around key structural levels, which include order blocks, rejection blocks, and breaker blocks.
When they do, they act as confirmation. The structure (OB) shows where price reacted, and the FVG shows how aggressively it moved away. Together, they signal both intent and strength.
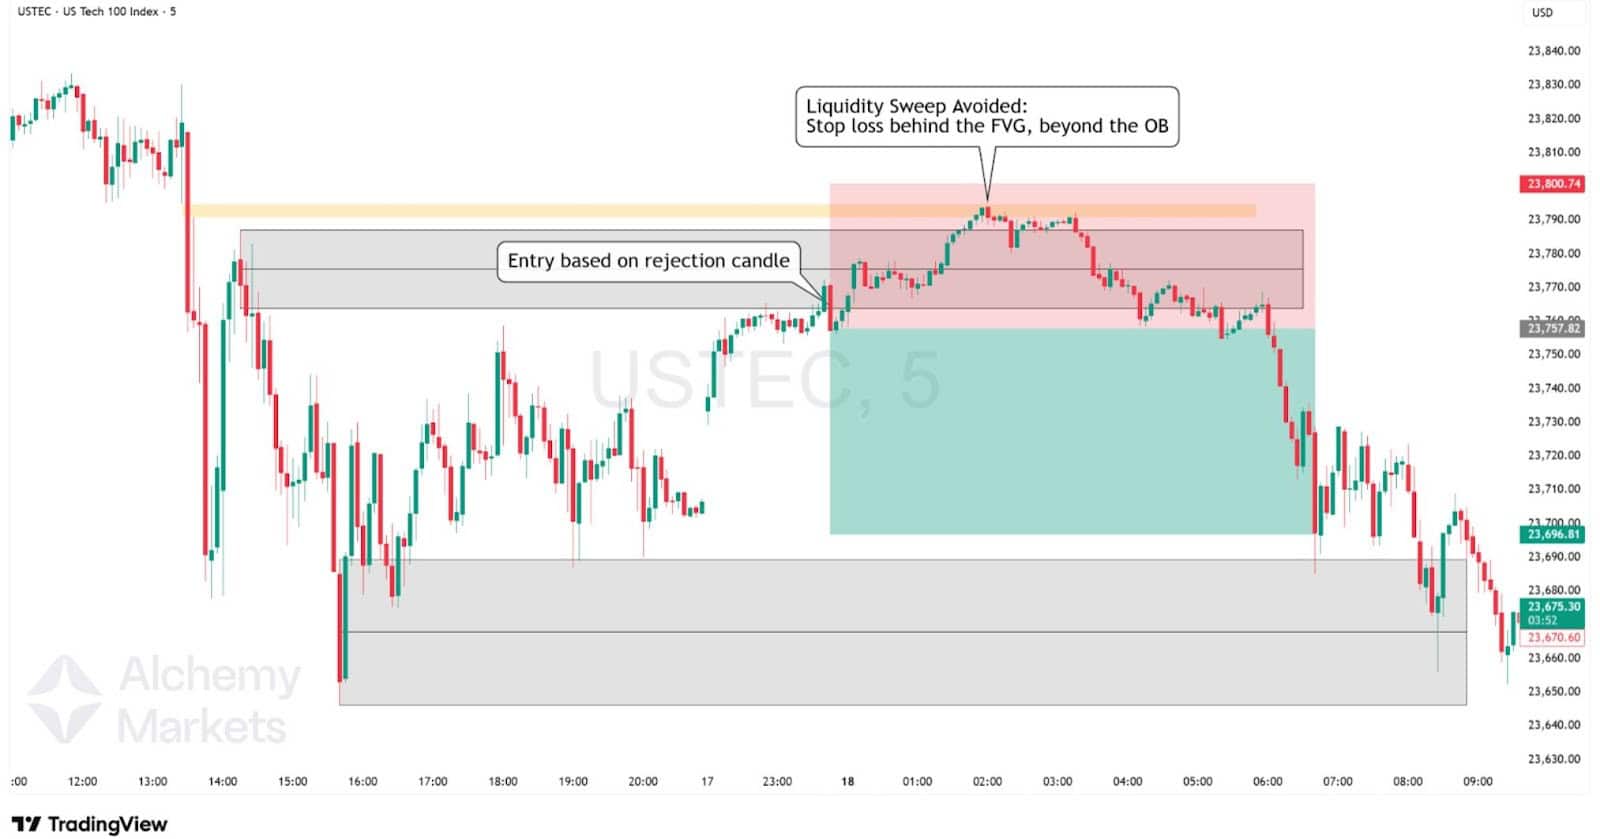
Since FVGs represent strong momentum, they can also shift how we approach the trade. If a fair value gap forms near an order block, we don’t always need to wait for a CE retest. Instead, the FVG itself can become the zone we trade from.
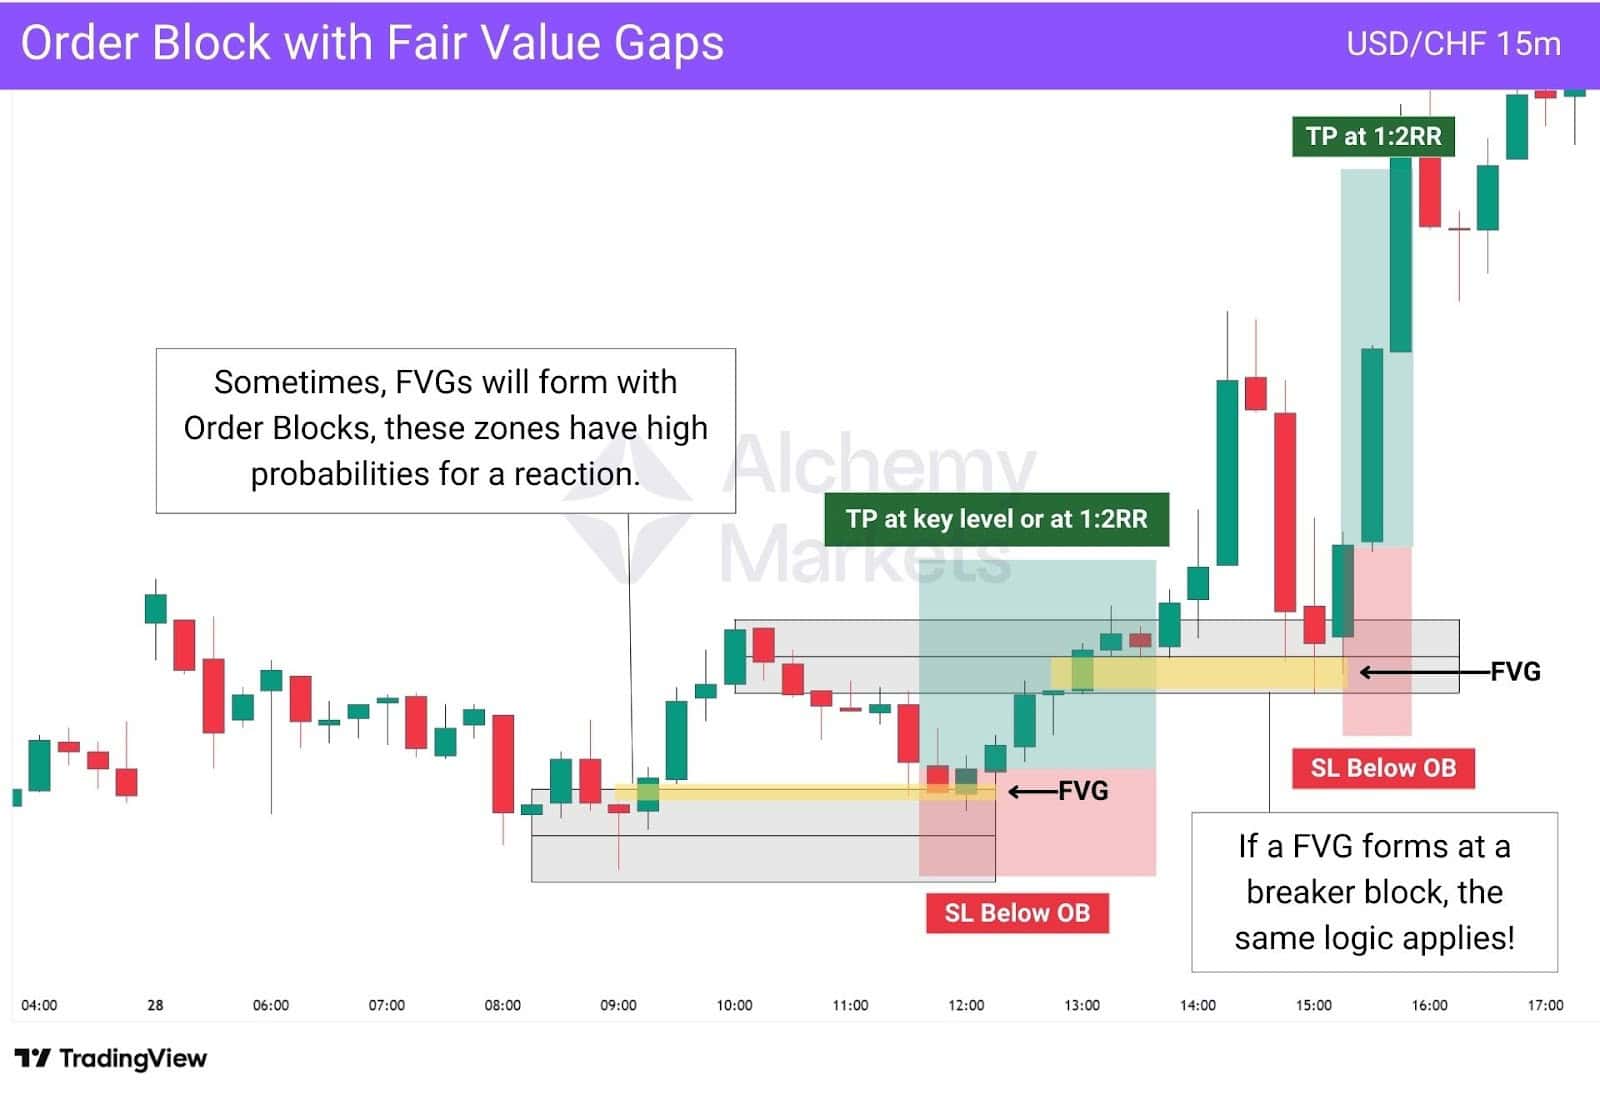
In summary:
- Observe if an FVG has formed near an order block, rejection block or breaker block.
- The FVG signals strong intent from the markets.
- Watch for a clean reaction at the FVG, and if the price creates a rejection candle, enter a trade targeting 1:2 RR or a key level.
For the stop loss, you can keep it either below the order block (for safer trades), or if you want to keep your risk capital low. Placing it below the FVG itself is also a valid option, although it does increase your odds of getting stopped out early.
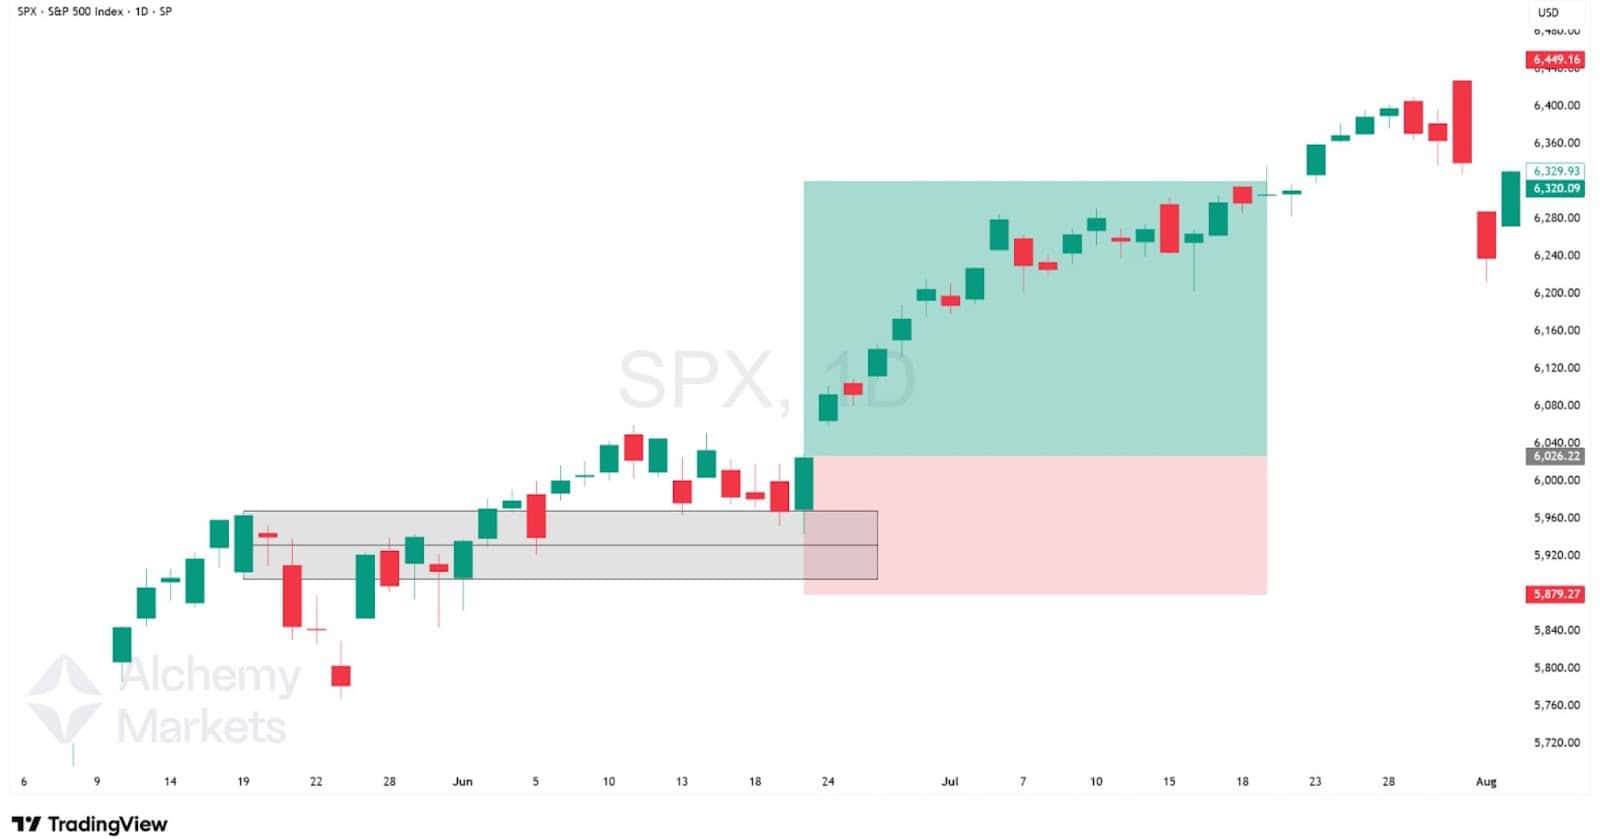
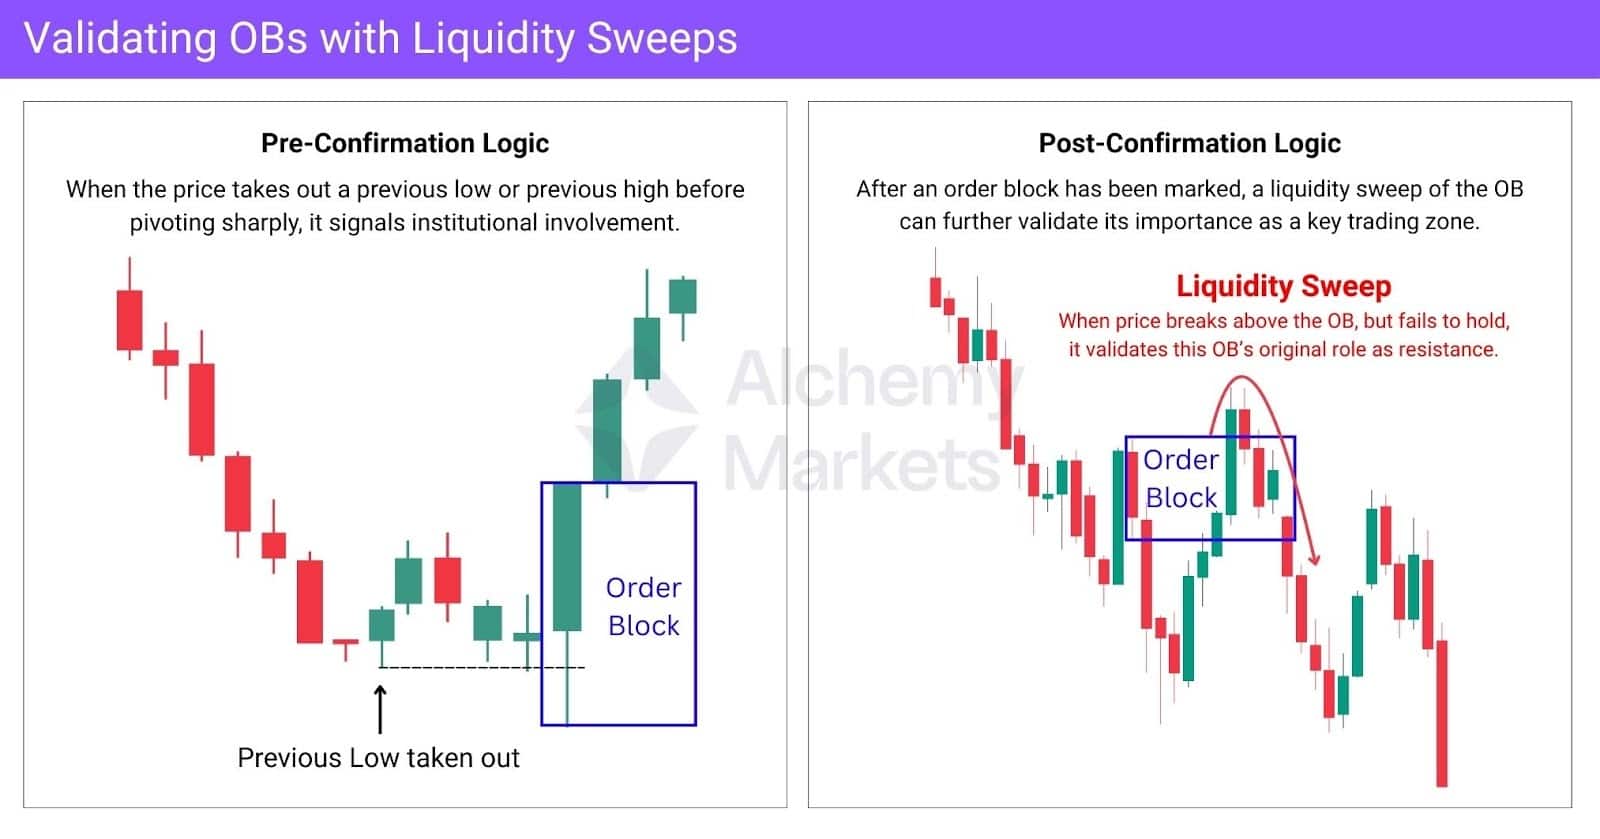
Liquidity Sweep: Trading Fakeouts of Order Blocks
Liquidity sweeps are a core Smart Money concept, often used alongside order blocks. They refer to false breakouts — when price pushes above a resistance OB or below a support OB, only to sharply reverse.
This concept connects directly to how most traders manage risk. Conventional trading teaches you to place a stop loss above resistance or below support. While logical, this practice creates a build-up of stop losses in concentrated zones. In Smart Money Concepts, these areas are known as liquidity zones.
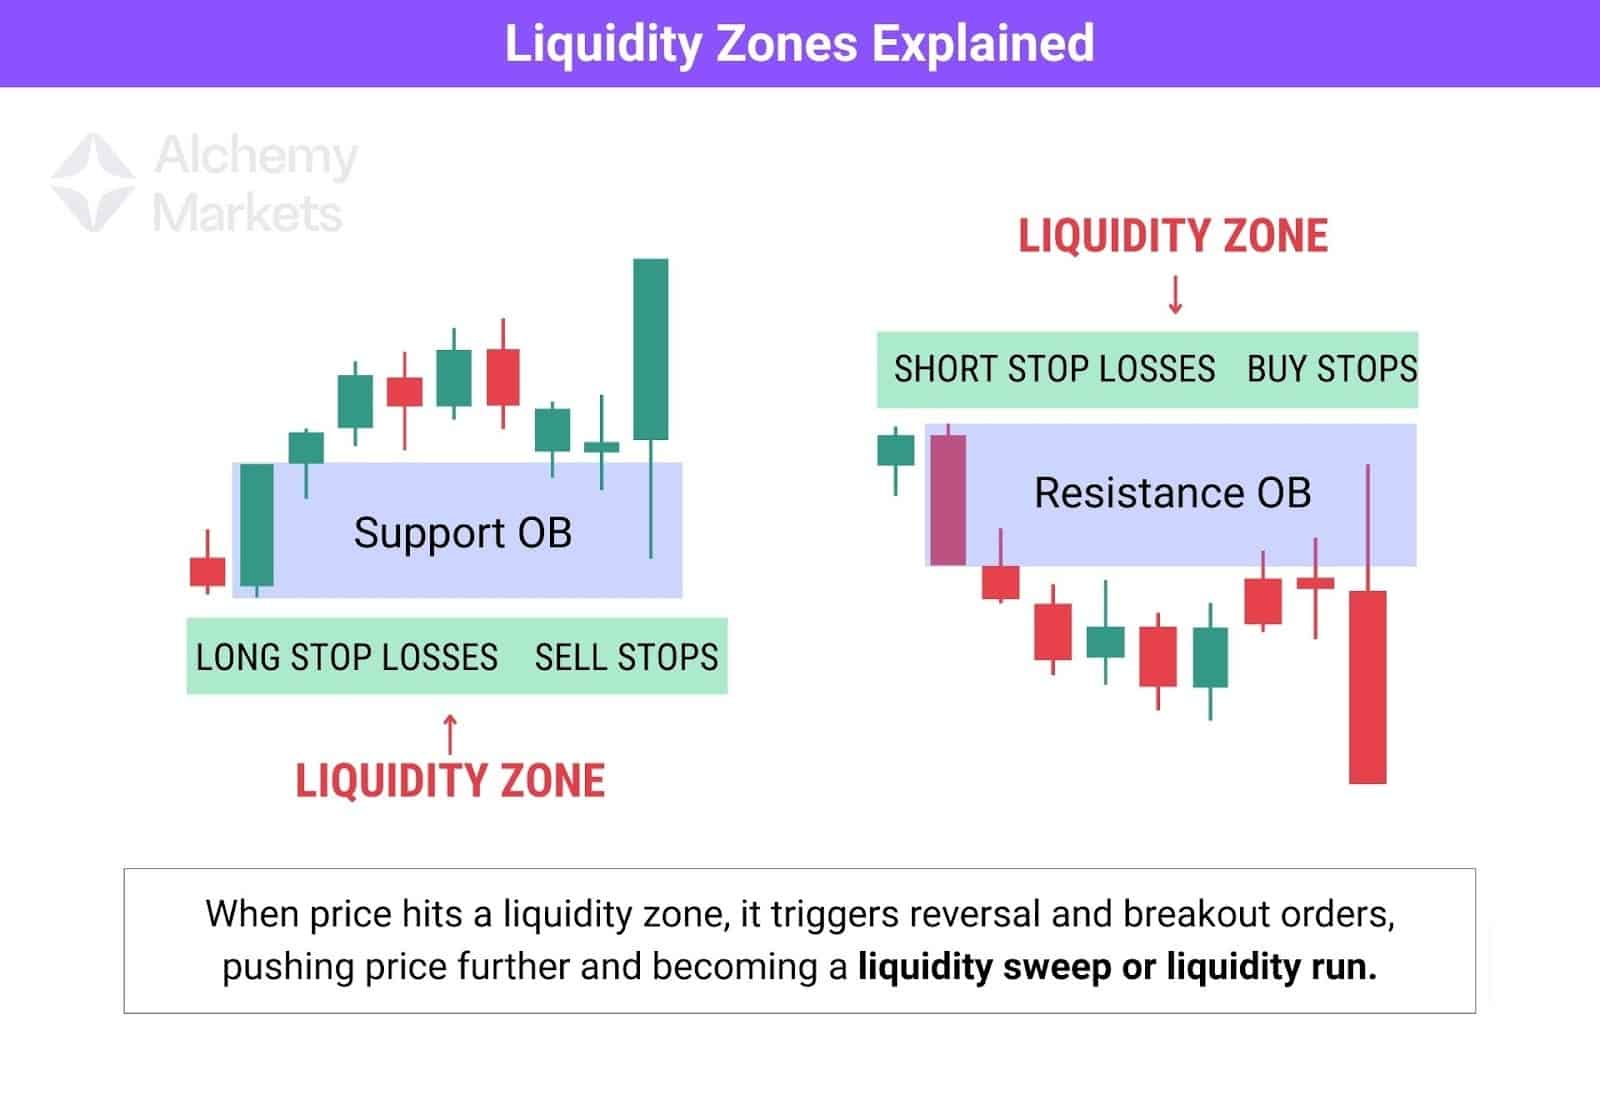
A liquidity zone isn’t just made up of stop losses. It also includes the Buy Stop and Sell Stop orders placed by breakout traders — which only get triggered when price breaks through a key level.
In other words, both retail exit orders (stop losses) and retail entry orders (breakouts) tend to cluster around the same zone. This creates a dense pocket of liquidity, making it an ideal target for larger players looking to fill bigger positions.
When price taps into one of these zones, one of two outcomes typically follows:
- It breaks through cleanly and continues with strong momentum — this is known as a liquidity run.
- Or it snaps back just as quickly after triggering orders — this is a liquidity sweep.
So how can we use this information to trade an order block?
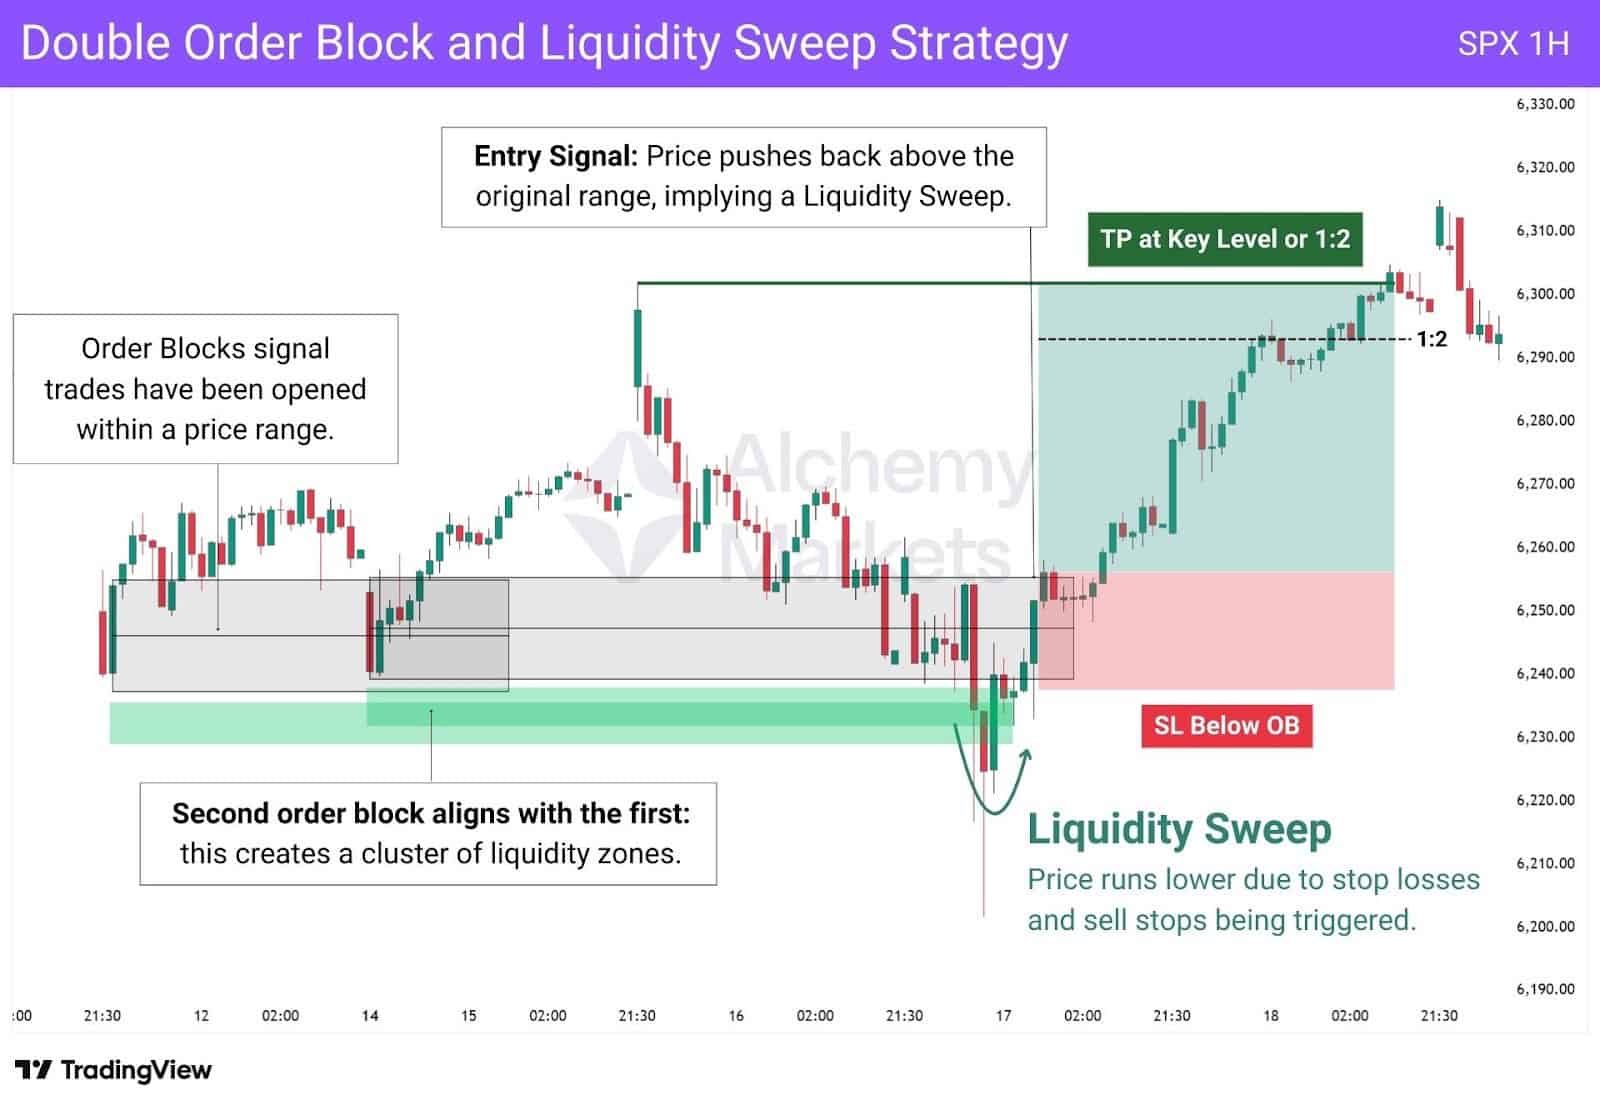
In our strategy, we’re looking for a liquidity sweep when two order blocks form around the same price area. This creates a more vulnerable liquidity zone — a perfect target for larger players to manipulate price into.
When price taps into this zone, we watch for one key behaviour: Does price reverse from here and break the original OB’s range?
If it does (with a candle close), that’s our confirmation that a liquidity sweep has occurred, and that’s our entry trigger. At this point, we treat the breakout as a trap and trade in the direction of the original OB’s bias.
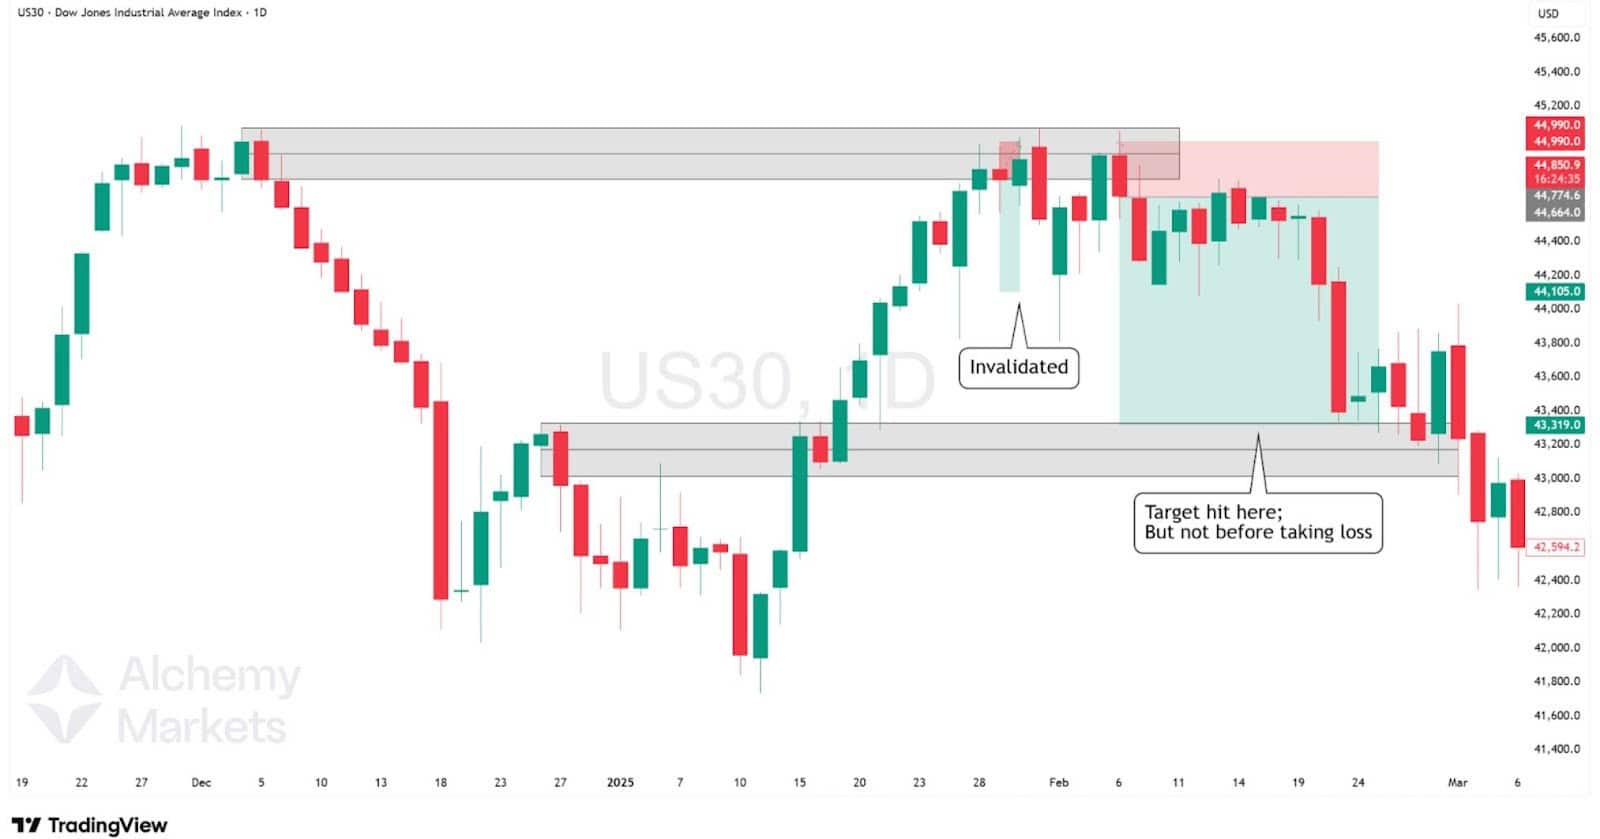
This strategy is powerful because it helps traders stay adaptive. Just because price breaks an order block doesn’t mean the resulting breaker block will hold. In fact, we just saw that it didn’t.
Liquidity sweeps often fuel strong reversals, because they signal that large players have stepped in with size, absorbing stop loss triggers and breakout entries from traders who were too early.
Think of it like this: all those stop losses, buy stops, and sell stops have become entry liquidity for institutional trades.
In summary:
- Wait for two order blocks to align at the same price zone.
- When price breaks the OB, it transforms it into a breaker block.
- However, if the price breaks the BB again (with a candle close), it signals a liquidity sweep.
- Enter in the direction of the original OB’s bias, set your stops below the OB and target 1:2 RR or the next key level.
Knowing this helps us avoid getting trapped, and positions us to trade with the big fish, not the krill.
⚠️ You don’t need two order blocks every time — but when they align, the case for a sweep gets stronger thanks to the stacked liquidity. Drop into a lower timeframe and you might just find overlapping blocks that validates this setup.
Identifying Key Order Blocks with Divergences
Divergence in trading refers to a mismatch between price and momentum. This happens when price makes a new high or low, but the momentum indicator doesn’t confirm it — often signalling a potential reversal.
Think of price and momentum as dance partners; usually, they move in sync. But, when the pair suddenly do not match in movements, it’s a sign the dance may soon be coming to an end.
| For example: Price makes a lower low, RSI makes a higher low. That’s a bullish divergence — it shows that downside momentum is weakening. |
So how does this translate into trading order blocks?
While the divergence gives you timing — a signal that a reversal may be coming — the order block helps you identify the price zone where that reversal is most likely to begin. Together, they create more refined, higher-quality setups.
The question now becomes — how do you identify the key order blocks worth trading?
The key is to wait for a divergence to form first. Only then do you mark out the order block at the pivot, and from there, watch the Consequent Encroachment (the 50% mark of the block) for a clean reaction.
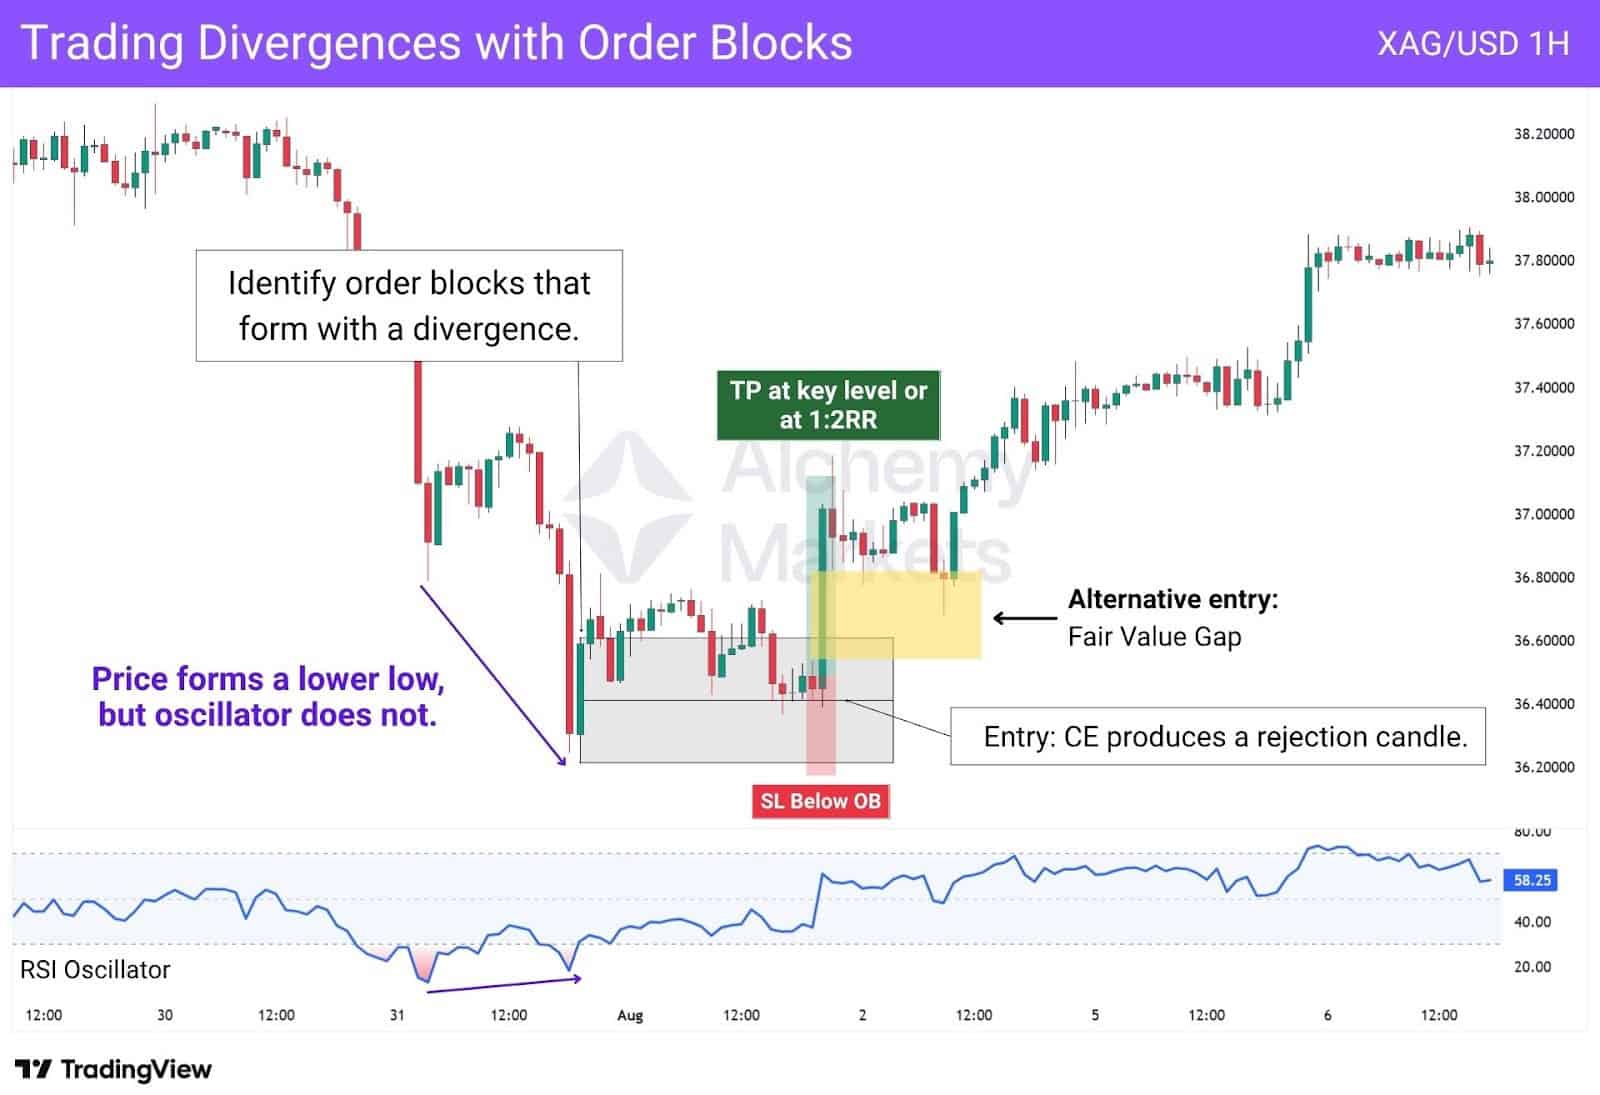
In the Silver trade example above, price makes a lower low while the RSI makes a higher low – a classic bullish divergence. Price then retests the CE (50% level) of the order block and pivots sharply higher.
Follow these steps to integrate divergences with order blocks
- Spot the divergence. A bullish divergence appears when price forms a lower low but the oscillator prints a higher low; a bearish divergence forms when price creates a higher high, but the oscillator does not.
- Identify the pivot. Once you see a divergence, watch for a clear pivot or change in market direction.
- Mark the order block. Define the order block at that pivot using the method described earlier (the full range of the last candle before price reverses). Apply the four‑candle follow‑through rule.
- Entry Conditions: You can place a limit order at the CE and pre-define your stop loss. Or, wait for a clear rejection candle to form before entering. If price forms a Fair Value Gap near the block, that can also serve as a refined entry trigger.
Altogether, this strategy — and the ones before it — show just how flexible order blocks can be.
When combined, they help build a clean, confident trade setup without adding unnecessary noise that clouds your decision-making.
Advantages of Order Block
Order blocks have gained traction for good reason: they work. While they’re a variation of basic horizontal support and resistance lines, they come with a few unique advantages:
- Defined Zone: Horizontal levels can be vague. Price might ignore them completely or wick right past them. Order blocks give you a clearer zone to work with, offering a more structured view of support or resistance.
- Combines SR Drawing Methods: Traders draw SR in different ways; some use the candle body, some the wick, others a zone between. An order block wraps all of that into one, since it covers the full range of the price move before the reversal.
- Rooted in Logic: OBs are formed by the actual candles that lead to sharp directional moves, which means there is a high likelihood that trades have been entered in that price range.
Disadvantages of Order Block
Order blocks are useful, but like any tool, they come with trade-offs:
- Subjectivity in Marking: Unfortunately in the SMC world, order blocks have been described differently. While the vast majority of interpretations are based on a single candle’s price range, there are other interpretations too. This can be confusing.
- Lagging Confirmation: You often need to wait for several candles after a move to confirm an order block. This part in itself can be subjective. For us, using the 4-candle filter works, but you may discover something else which aligns better.
- Assumes Institutional Intent: OB theory assumes institutional intent, but sharp moves don’t always mean institutions were behind them. Sometimes it’s just retail momentum, news-driven volatility, or random order flow creating the move.
How to Spot Fake Order Blocks
At the start of this article, we introduced the 4-candle follow-through rule to help identify valid order blocks. The idea is straightforward: once the stop candle forms, the fourth candle must stay above (for bullish OBs) or below (for bearish OBs) the candle’s range.
This confirmation helps filter out weak pivots and sharpens our focus on zones where price reacted with real strength; giving us a better shot at marking areas where institutions likely got involved.
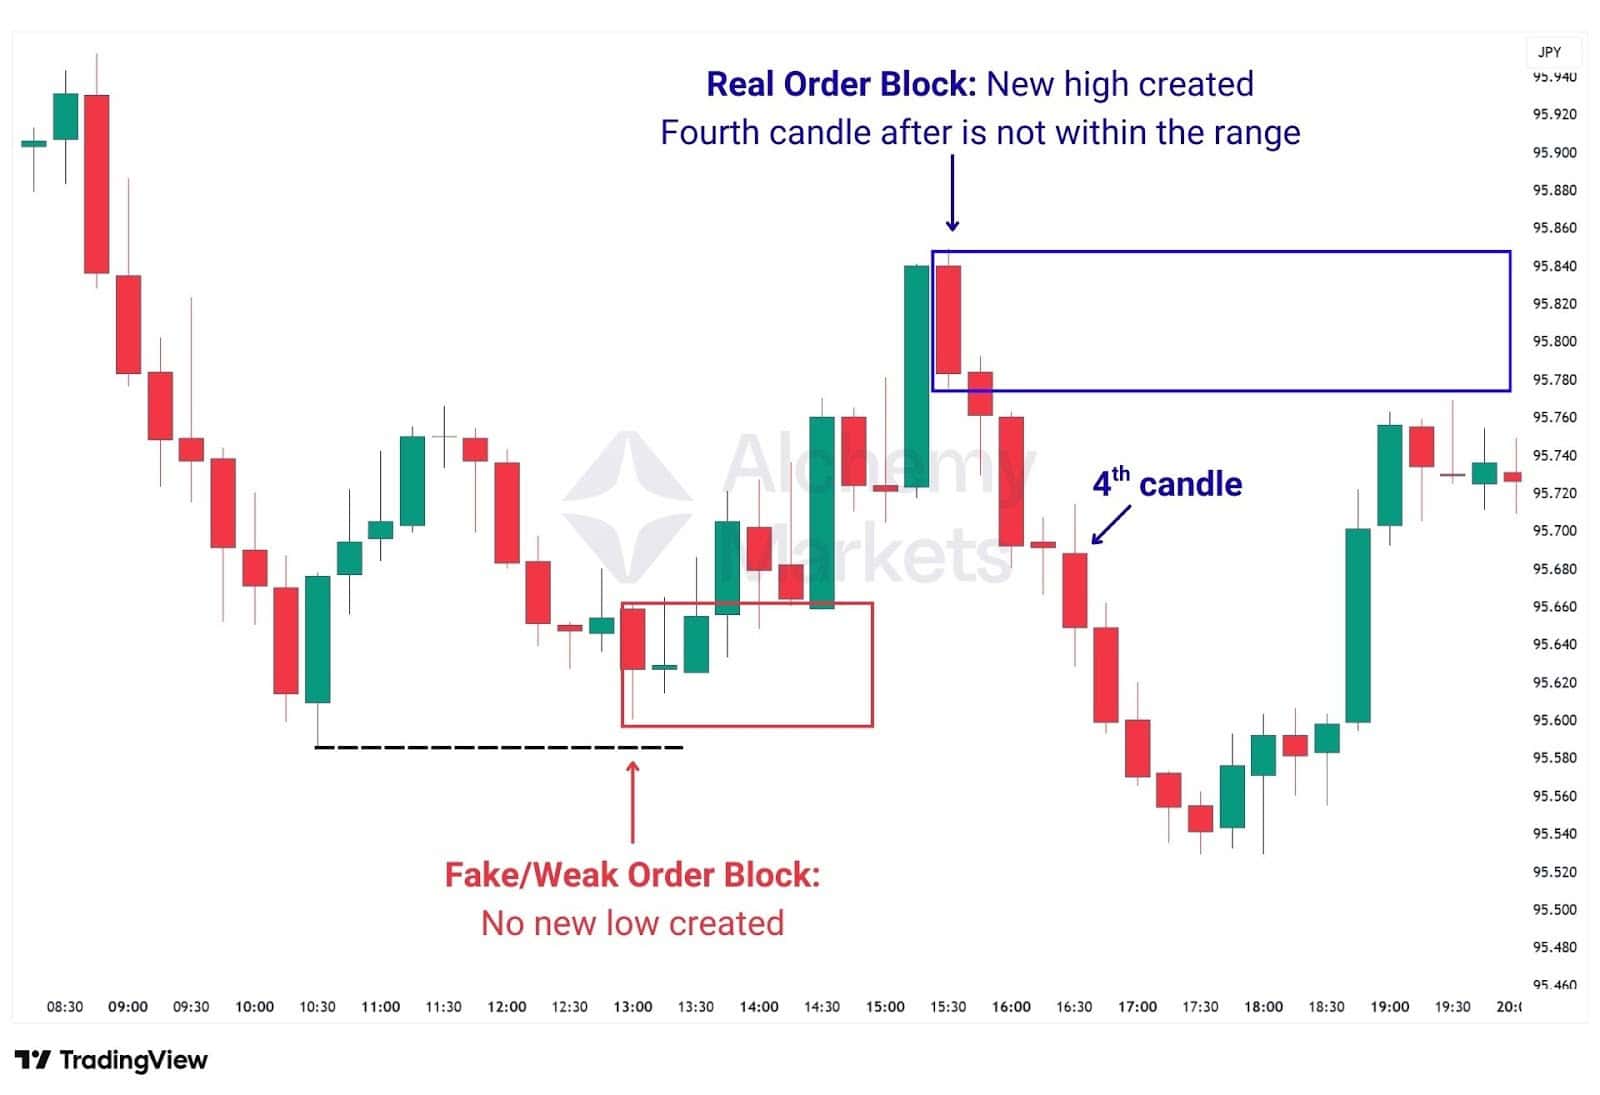
But, there’s also another useful filter: real order blocks tend to form at new highs or new lows; when there is a break of market structure.
This adds an extra layer of logic based on liquidity sweeps. These occurrences increase the odds of institutional involvement, since liquidity sweeps offer a chance for large players to enter at better prices.
| Bottom Line: Fake order blocks can be filtered out when you focus on strong moves, clear structure breaks, and pivots with solid follow-through. These are conditions which often hint at real institutional involvement. |
Risk Management When Trading Order Blocks
When trading order blocks, traders generally place stop losses in one of three ways — depending on their risk appetite and entry style:
1. Outside the Order Block
This is the most common approach. If you’re buying at a bullish OB, your stop is placed just below the block. If you’re selling from a bearish OB, your stop goes above it.
- Why: It gives the trade more breathing room in case of wicks or liquidity hunts.
- Best for: Traders who want higher probability entries, even if it means slightly wider stops.
2. Beyond the Consequent Encroachment (Midpoint Stop)
Some traders enter at the CE (the 50% level of the OB) and place their stop just outside the opposite end of the block.
- Why: Offers a tighter stop while still acknowledging the zone’s structure.
- Best for: Those using CE as a precision entry point, or when the order block has a large trading range.
3. FOLS Method (Fear of Liquidity Sweep)
If you’re worried about stop hunts, you need to think like the players doing the sweeping. Liquidity often clusters just outside or barely inside key structures like order blocks; especially around highs, lows, and midpoint entries. The goal is to place your stop where it’s unlikely to get hit unless your trade thesis is truly invalidated.
- Where: Use an FVG just outside the traded order block — above it for shorts, below it for longs.
- Why: Sweeps usually hit the first liquidity cluster. Going past the second zone increases the odds your idea is truly invalidated.
- Best for: Traders who want to filter out noise in the markets, especially on lower timeframes.
| Bottom Line: Where you place your stop depends on how precise your entry is and how much heat you’re willing to take. |
Combining Order Blocks and Breakers
Breaker blocks form when price invalidates an order block, then flips and respects the same zone from the opposite side.
Say a bullish OB gets broken and price drops, but then it retests the same zone and rejects downwards. That former bullish OB just became a resistance breaker. The same thing happens if a bearish OB is broken.
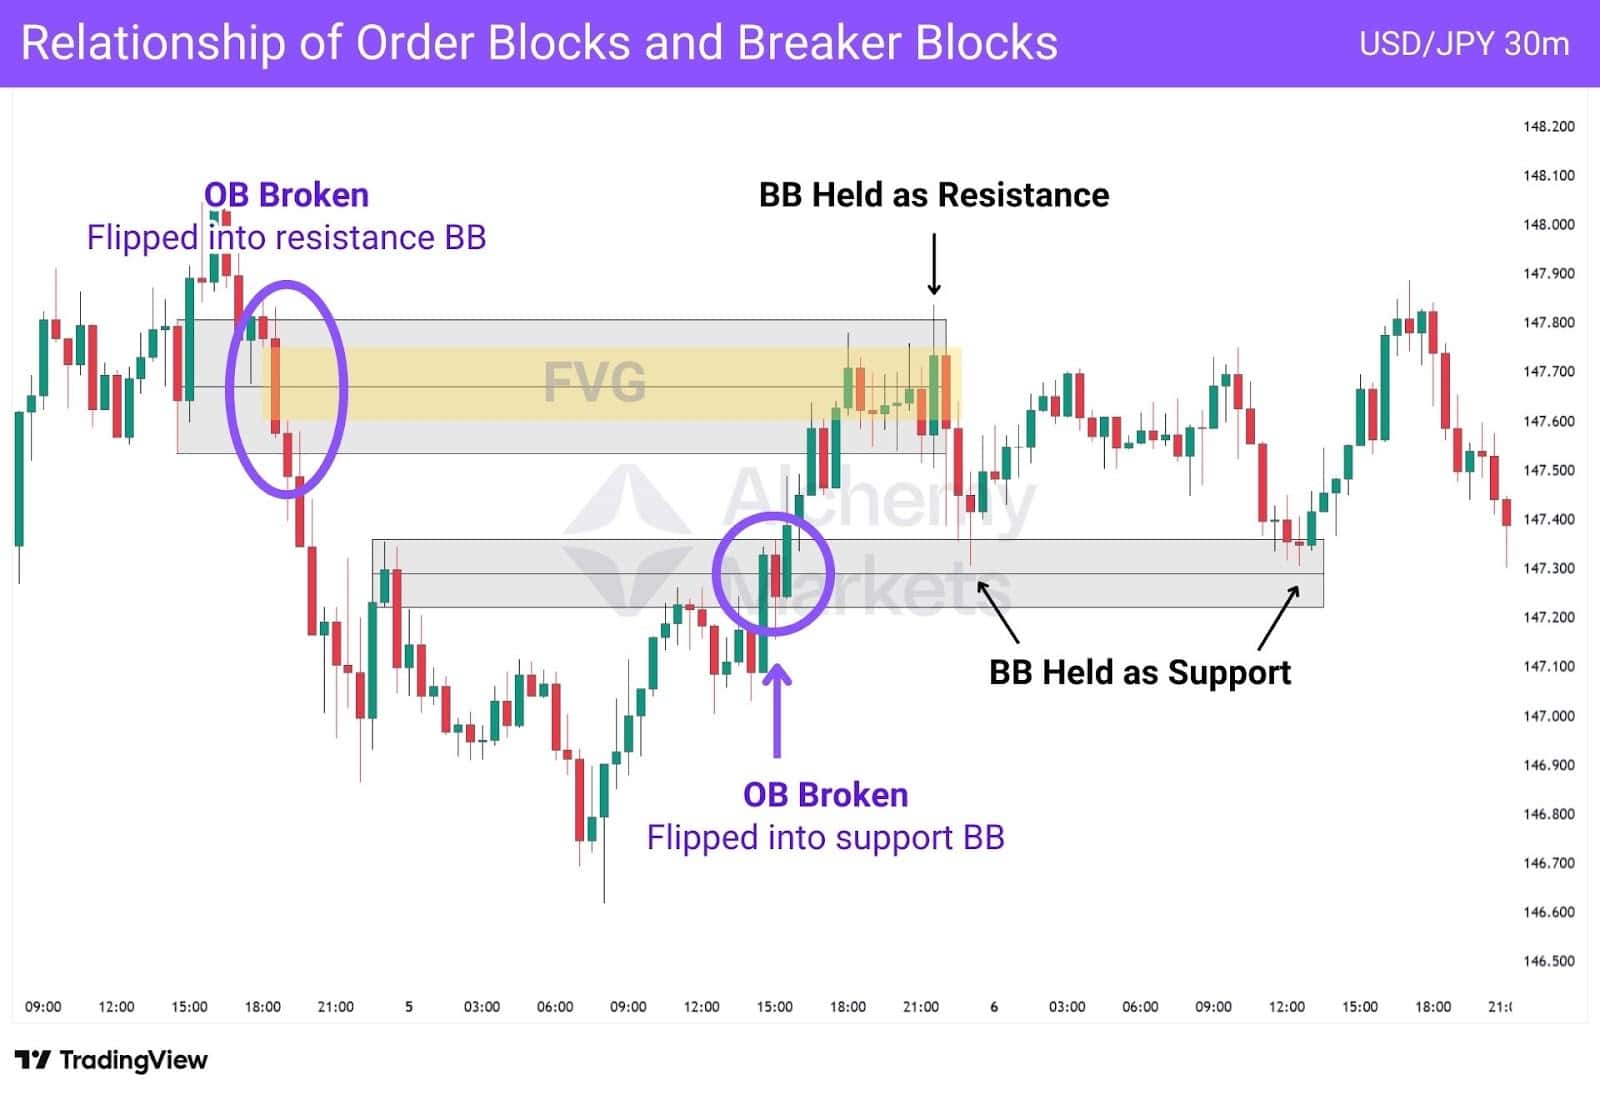
This shift tells us something: institutions may have used the original OB as a trap, only to return and defend the zone from the other side.
You can combine this logic with live OBs. If price first breaks the OB, then flips and respects the breaker with momentum (ideally with a FVG forming too), it’s a sign smart money is active. That’s your cue to look for trades in the new direction.
Valid vs Invalid Order Blocks
A valid order block shows real strength. It often:
- Occurs after a market structure break
- Gets a 4-candle follow-through
- Produces a clean reaction on retest
Invalid OBs tend to lack strong follow-through, appear inside chop, or don’t align with higher-timeframe pivots. Many traders over-mark blocks. Filtering with structure breaks and liquidity sweeps improves signal quality.
Take Out and Liquidity Sweep
A takeout happens when price briefly breaks above a recent high or below a recent low, often triggering nearby stop-losses. If price sharply reverses after this, re-entering and pushing past the original range, it signals a liquidity sweep.
Liquidity sweeps help validate order blocks both during and after formation. When an OB forms at a new high or low after a structure break, that sweep adds confluence that institutional orders are involved. But sweeps can also occur after an OB is already marked.
In these cases, the sweep acts as a shakeout; clearing weak hands before price returns to respect the OB. Whether used as a formation filter or post-hoc validation, sweeps enhance the OB’s credibility and improve the odds of catching real institutional intent.
Inefficiency and Imbalance
Price imbalances — such as Fair Value Gaps (FVGs) or Vacuum Blocks — happen when price moves so aggressively that it skips over a price zone, leaving a gap behind. This usually signals urgency and institutional intent.
When an FVG forms near an order block, it strengthens the case for that OB. It suggests the move wasn’t random but deliberate. Depending on the type of FVG, price might return to fill the gap or continue its momentum in the short term. Either way, the presence of a FVG near an OB confirms that institutional activity is likely behind an order block, making it more valid.
Unmitigated
Unmitigated order blocks are zones that haven’t been tapped yet. They’re seen as more reliable because they likely still contain resting institutional orders. When the price returns for the first time, it often reacts cleanly.
A mitigated block has already been touched — even a small wick counts as partial mitigation, since some orders may have been triggered. While this weakens the zone’s effectiveness, it doesn’t invalidate it completely unless price cuts through the entire block.
Some traders also use the CE (Consequent Encroachment) as a threshold. If price tags the CE, the block may be seen as less reliable. This isn’t based on literal order flow, as orders are not evenly distributed, but rather a guideline for gauging strength.
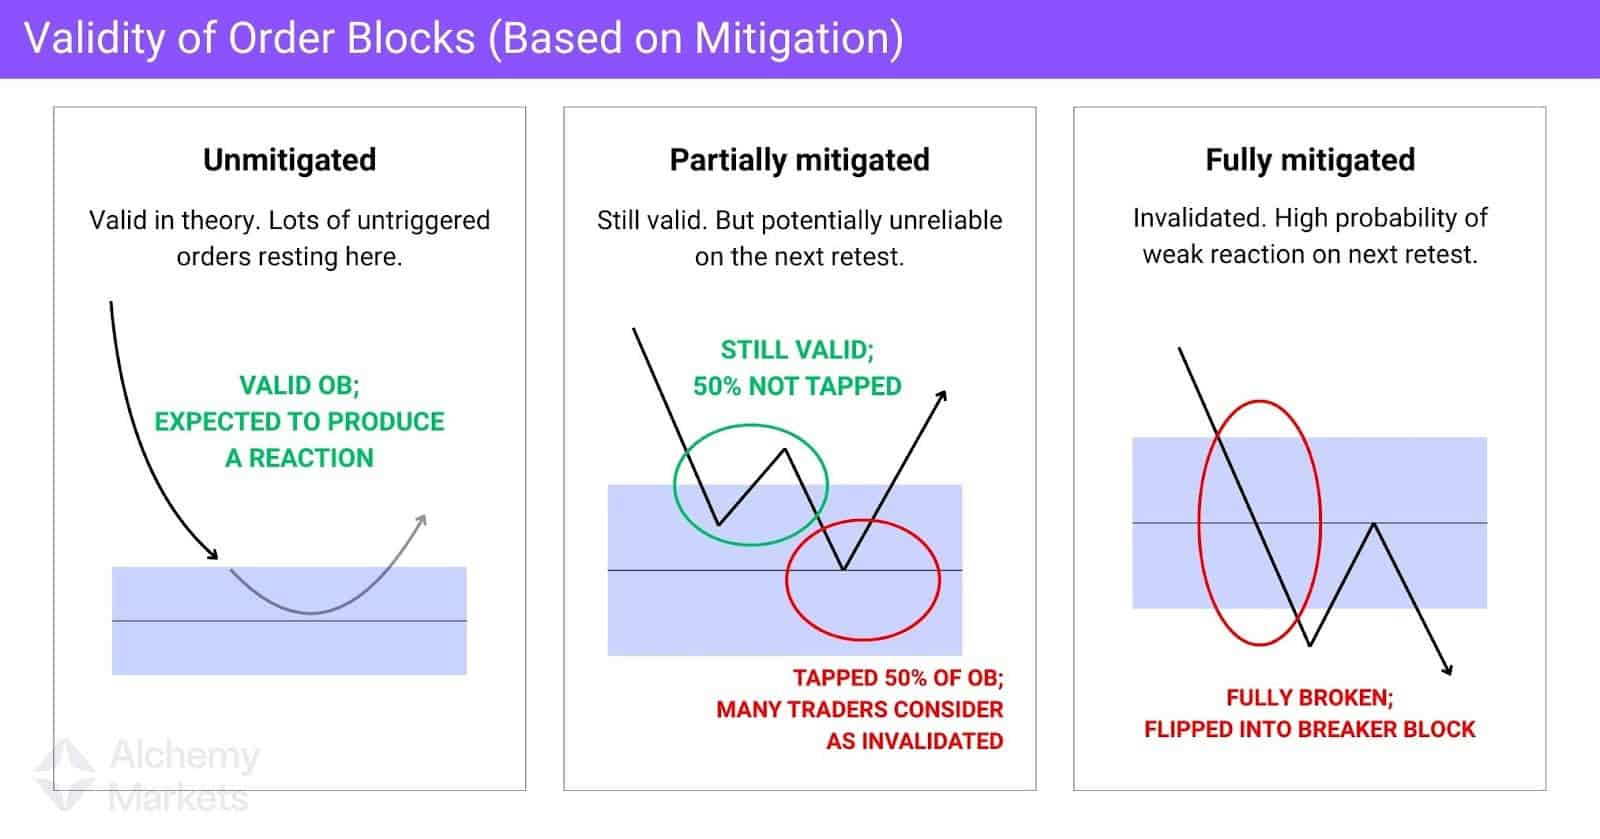
The bottom line? Fresh blocks tend to offer the best reactions. A partially mitigated block can still hold, but once price fully trades through it, the zone typically loses its strength and flips into a breaker block (unless a liquidity sweep occurs).
Rejection Block vs Order Block
Rejection blocks are a refined take on order blocks that focus purely on the wick of the stop candle, particularly when the wick makes up around 40% of the candle’s total size.
A long wick signals aggressive rejection, which SMC traders interpret as a sign that the most aggressive orders took place within that narrow range. The speed of the move also suggests that imbalances were left behind inside the wick zone.
While rejection blocks are recognised as a distinct type of structure, they’re typically traded just like standard order blocks — either by placing a limit order at the CE (50% mark) or waiting for price to shift out of the block before entering.
Order Blocks vs. Supply and Demand Zones
Both order blocks and supply/demand zones aim to identify areas where price is likely to react or reverse. In practice, order blocks and S&D zones work similarly; if a supply zone breaks, it becomes a demand zone — similar to how if a bearish order block breaks, it becomes a bullish breaker block. Liquidity sweeps on the other hand, are a fancier way to refer to bull traps and bear traps.
The real difference lies in their logic, marking method, and level of precision.
Here are the key differences between Order Blocks and S&D zones:
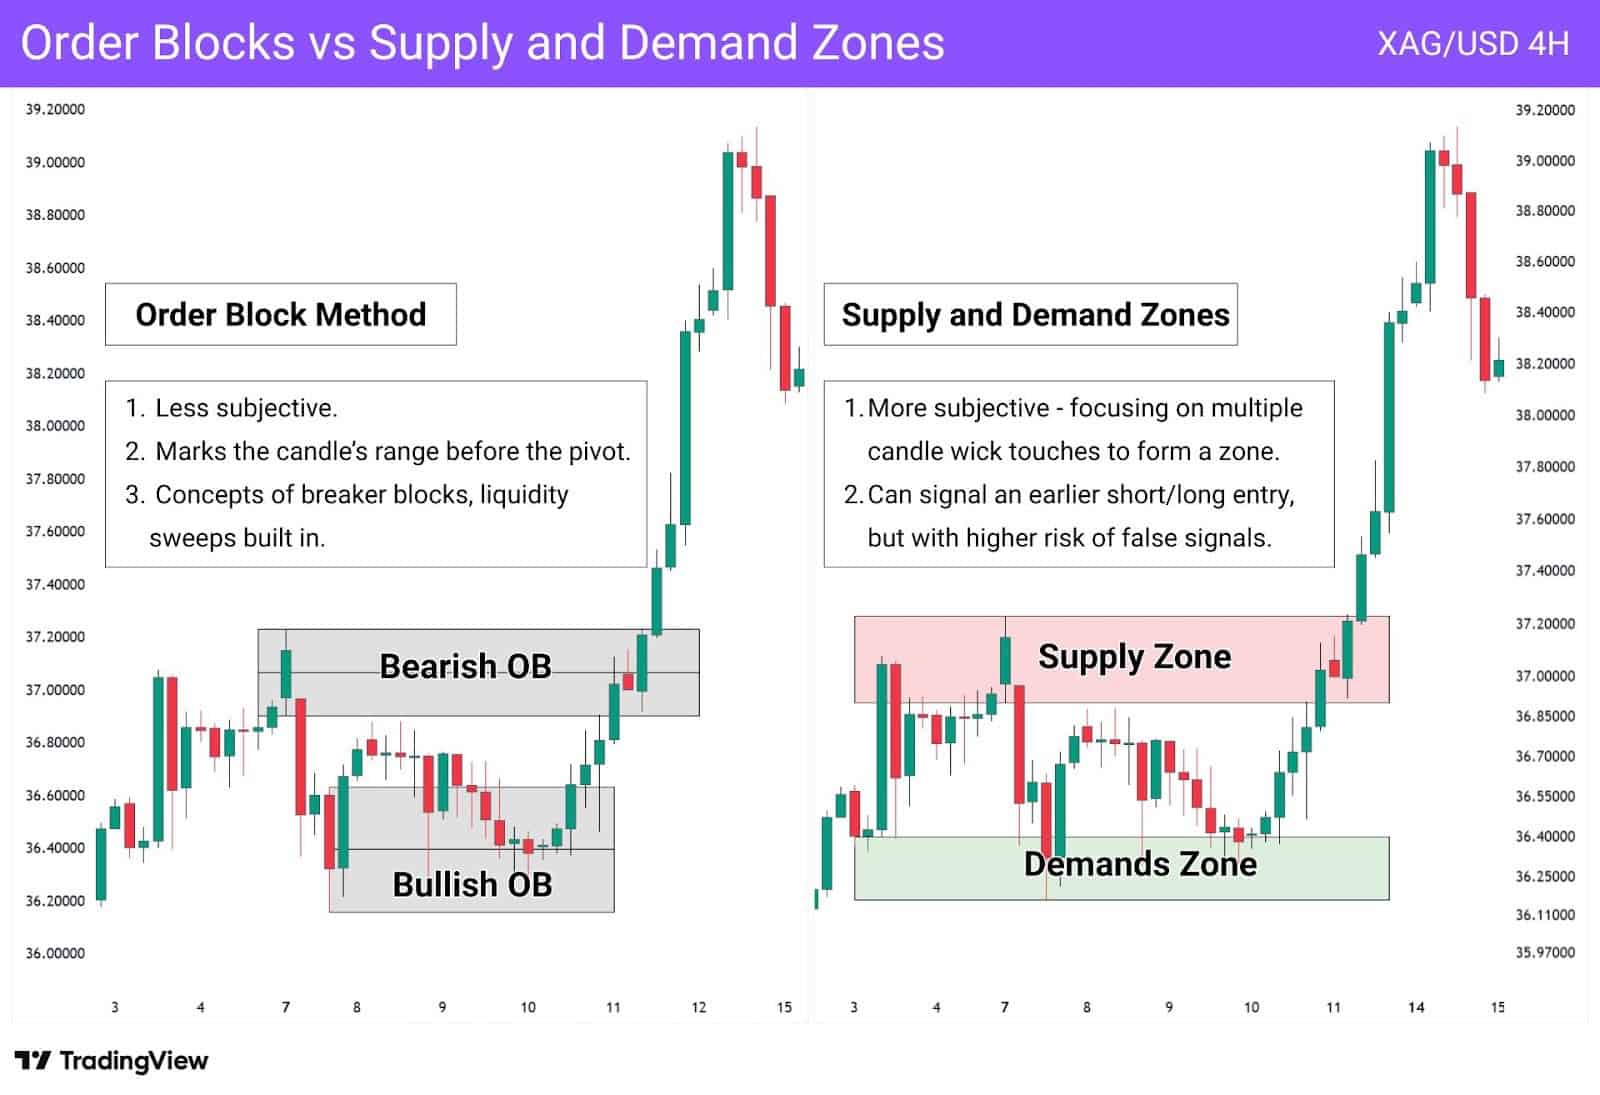
Order Blocks are rooted in Smart Money Concepts. They are defined by the last bullish or bearish “stop candle” before a sharp move in the opposite direction, often at a pivot high or low. These candles highlight institutional positioning, which explains why price often reacts when it revisits the area. In this sense, order blocks serve as approximations of where institutions have entered the market.
Supply and Demand Zones, meanwhile, are broader and more discretionary. They highlight areas where price has reacted before, usually marked by visible wicks or consolidation. These zones don’t necessarily reflect institutional activity, nor do they have one strict method of identification. They are simply approximations of where price has pivoted.
What is the difference between Order Block and FVG?
Order blocks and fair value gaps essentially act as support and resistances, but the key difference is that:
- Order Blocks (OBs) are retroactive and show the final bullish or bearish candle before a strong move, essentially marking where institutions entered with heavy buy or sell positions.
- Fair Value Gaps (FVGs) are predictive and form as three-candle patterns, highlighting where price has moved drastically, creating a zone it’s likely to return (similar to a vacuum block).
Both tools act like support and resistance, reflecting liquidity and institutional flow, but they’re not the same. OBs capture institutional footprints and are drawn from where price already pivoted, while FVGs capture skipped liquidity and often signal where a retracement could land next.
They’re not mutually exclusive either. A Fair Value Gap (FVG) can form inside an OB, reinforcing the same zone with both inefficiency and institutional entry. When that overlap happens, traders often treat the confluence as a higher-probability pivot point.
| Imbalance: Refers to an area where price moved so quickly that many orders went unfilled. Traders who had pending orders in that zone may not have been executed, leaving behind a “gap” of inefficiency. |
What Common Mistakes Should Traders Avoid When Using Order Block?
Marking Random Candles as Order Blocks
Not every pause or reversal candle qualifies as an OB. A true order block should mark the origin of a strong, directional move — ideally after a break of structure or a liquidity sweep.
Ignoring Confirmation Filters
Traders often forget to apply filters like:
- The 4-candle follow-through rule
- Unmitigated status — has the order block been partially or fully mitigated?
- Proximity to FVGs or liquidity zones. These filters help validate whether the OB is meaningful or just noise.
Drawing OBs Without Structural Context
Placing OBs inside consolidation or chop zones weakens their reliability. Strong OBs usually form after key highs/lows, breaks of market structure, or liquidity grabs.
Trading Every OB Blindly
Just because you see an OB doesn’t mean you should trade it. Smart traders wait for a clean reaction, confirmation candle, or other entry signal—especially on retests.
Poor Stop Loss Placement
Setting stops too tight inside or just outside an OB often results in being swept out. Many OB strategies call for stops below swing highs/lows or outside liquidity zones—not directly under the OB.
FAQs
How do I identify strong order blocks?
Look for OBs that form after a market structure break or liquidity sweep, with a clear pivot and 4-candle follow-through. Unmitigated blocks near FVGs or key levels tend to be stronger.
Which timeframes do order blocks work best on?
Higher timeframes (4H, Daily, Weekly) are ideal for spotting OBs with real institutional weight. Entries can be refined on lower timeframes such as the 5 minute or 15 minute timeframe.
What markets do order blocks work with?
Order blocks work across Forex, crypto, indices, commodities, and stocks. Basically, any market where institutional activity leaves a footprint or has any substantial volume.
Is order block trading profitable?
It can be, especially when combined with tools like FVGs, CE entries, and liquidity sweeps. Success depends on proper confirmation, context, and risk management.
What is the best order block in trading?
The best OBs are unmitigated, come after a structure break or sweep, and have clean follow-through. Those that later flip into breakers can also be powerful
Do professional traders use order blocks in trading?
It depends on how you define “professional.” Some full-time traders do incorporate order blocks, especially those who focus on structure and imbalance. The key takeaway isn’t that order blocks are some magical tool that’ll suddenly make you profitable, but rather, a disciplined trader can make any concept work with enough practice and understanding.
How do I know if an order block is valid or fake?
A valid order block usually aligns with a sharp pivot away from its level. To determine that, we added the 4-candle follow through rule. If price fails to sustain a close beyond the stop candle after four bars, it’s more likely an invalid block — as it is not a strong pivot.
Can someone explain how breaker blocks and vacuum blocks work together?
A vacuum and breaker block can form together if price closes just below a resistance order block (or above a support order block), but gaps in the next session. This break creates an overlap where both blocks align, marking a key zone of interest. Traders can look to this overlap for breakout trades — if the price retraces and provides an appropriate reaction.


