


Written by:

- Opening Bell
- May 8, 2026
- 6 min read
NFP Beat Supportive for DXY as Yields Climb
The jobs report is out, and it gave markets just enough to keep the dollar story alive without making this a clean victory lap for USD bulls.
US nonfarm payrolls rose by 115,000 in April, beating expectations of 62,000, while the unemployment rate held at 4.3%. March was also revised higher to 185,000, so the labour market is slowing, but it is not exactly breaking either, according to BLS and Reuters.
| Event | Previous | Forecast | Actual |
| Nonfarm Payrolls | 185K | 62K | 115K |
| Unemployment Rate | 4.3% | 4.3% | 4.3% |
That keeps the market in a slightly awkward middle zone. The data was not weak enough to drag rate-cut hopes back into the centre of the conversation, but it was also not hot enough to instantly turn into an inflation-panic story.
Part of the reason this matters is that equities have already been leaning into optimism this week. The Iran war headlines have flipped back and forth, but markets have mostly treated earnings as the bigger driver, especially around AI and semiconductors.
The confusion for many people will be that backdrop conditions: War, inflation, strong jobs and rate holds, are all great for the dollar. And yet, equities continue to rally.
With this NFP release, that trend only continues. Fundamentally speaking, today’s NFP is good for dollar, bad for markets; but it’s very likely that AI bulls won’t care.
Regardless, let’s break down what we need to see on DXY to begin fathoming a correction on equities.
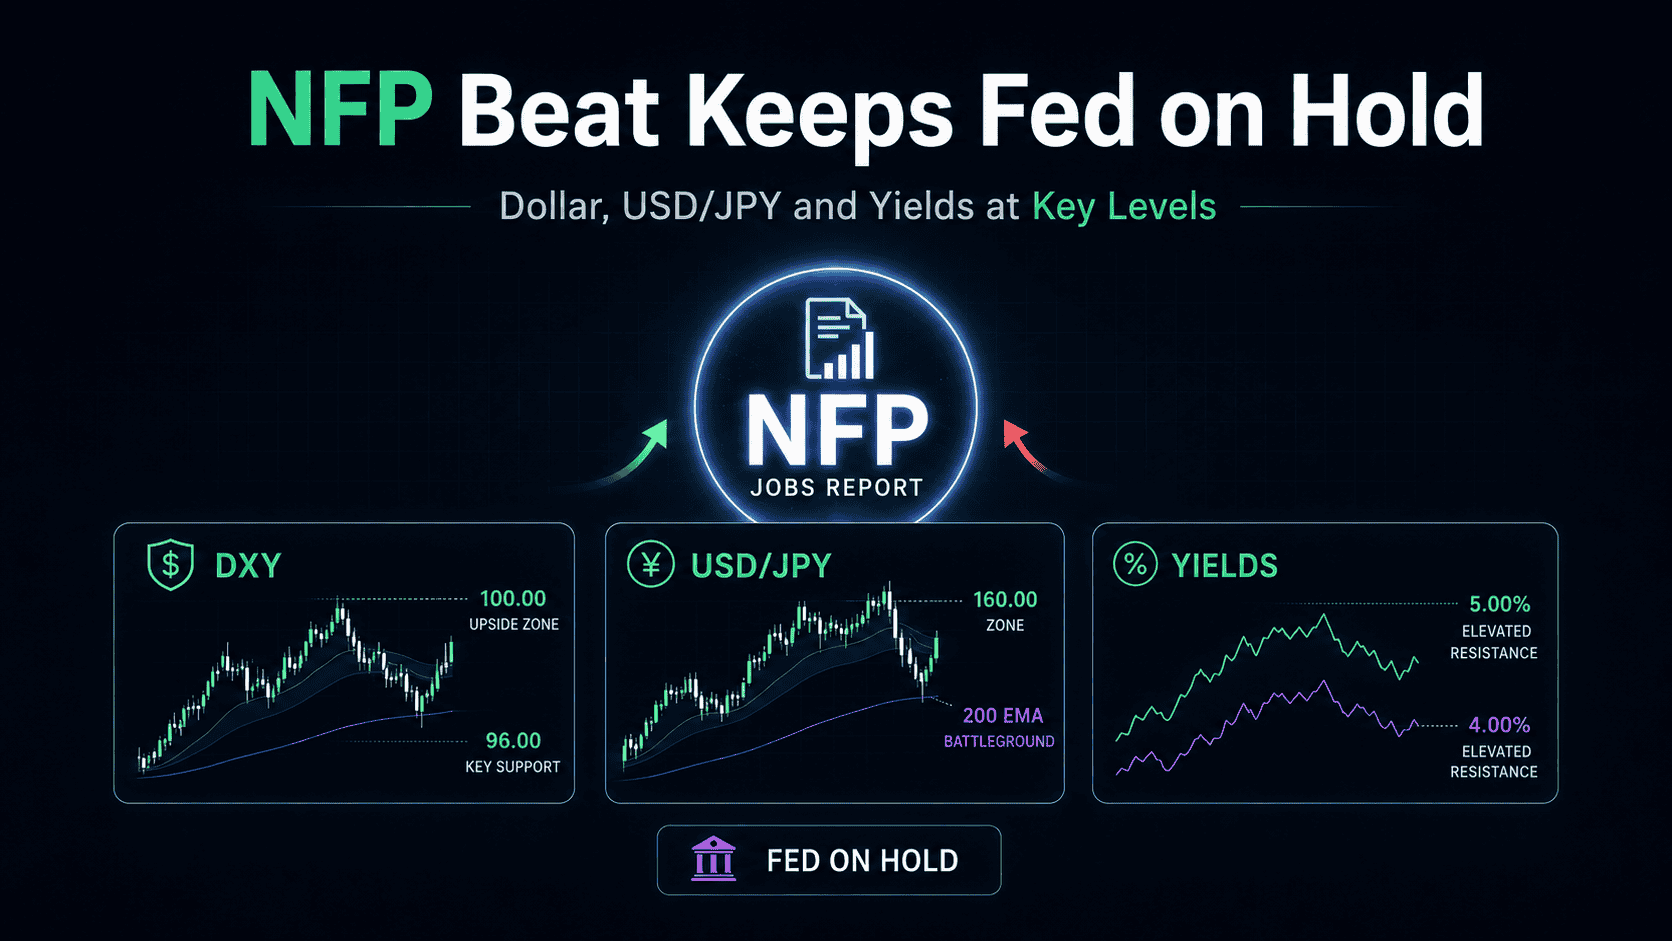
NFP Main Story: DXY Bulls Still Need the Retest

For DXY, the setup is close, but not fully confirmed yet.
The dollar recently tested the 96 zone, bounced, and made an initial bullish break above the 50-day EMA band. Under this band logic, the first upside break is the early signal that momentum may be shifting.
The cleaner confirmation usually comes when price retests the band, avoids losing the opposite edge, and then pushes higher again.
But, we are now seeing some weakness. For the second time now, DXY is retesting its opposite edge (lower band) and potentially threatening a break down.
While the NFP beat gives dollar bulls a better reason to defend the area, but price still needs to show that the retest can hold.
If DXY can hold or reclaim this band area and push back through 99.06-99.62, the recovery setup looks more convincing. From there, the next zone sits around 100.15-100.88.
If the lower side of the band fails instead, the earlier bullish break starts to look more like another failed bounce, and the 96.38-96.95 zone comes back into view.

Fed pricing is the other half of the DXY story.
The Fed held rates at 3.50% to 3.75% in April and kept its focus on maximum employment and returning inflation to its 2% objective. It also flagged Middle East developments as a source of uncertainty, which matters when oil and inflation risk are still part of the background, according to the Federal Reserve.
After NFP, the market still leaned toward a hold rather than a fresh cutting cycle. Reuters reported that the chance of a December hike fell to 18% from around 23%, while the odds of rates staying unchanged rose to 74.1% from 70.1%, based on CME FedWatch pricing.
So this is not really a “cuts are back” setup. It is closer to a “labour is holding up, rates are still being held, and dollar bulls have not been kicked out yet” setup.
USD/JPY Sub Story: 200 EMA Support Meets Intervention Risk

Japanese Yen is surviving partly because of interventions, but the question is – how long can that last?
Reuters reported that Japan intervened again during the early May holiday period, with Bank of Japan data suggesting officials may have spent around 5 trillion yen, or roughly $32 billion, between May 1 and May 6, following earlier suspected intervention of around $35 billion on April 30.
While USD/JPY holds the 200 EMA area, the technical case still leans constructive, with the 160 zone remaining the obvious upside magnet. If intervention pressure keeps capping the pair and price loses the 200 EMA instead, the risk is a deeper unwind toward the 150 zone.
In plain terms: The chart supports another push higher, but Japan is clearly trying to stop the move from turning too one-sided.
Yields Story: 2Y Supports the Hold, 30Y Keeps Pressure On

The 2-year Treasury yield has broken out of its previous downward structure (bull flag), the 50 EMA band has crossed above the 200 EMA, and yields are still holding above that moving-average structure.
That fits the FedWatch picture pretty well. Markets are not pricing an aggressive return to cuts; they are mostly pricing a Fed that can stay on hold because the labour market is still firm enough.
The next area to watch is the previous high near 4.03%. A push through that area would likely support DXY and USD/JPY further, while a failed move back under the EMA band would weaken the dollar recovery setup.

The 30-year yield is the heavier long-end story.
It is pressing into the 4.97%-5.08% zone, with the previous high near 5.15% and a rough bull flag target around 5.20% if the breakout follows through.
That 5% level is where the equity rally can start to feel less comfortable, even if earnings and AI optimism are still doing their job – because the backdrop of oil supply shock, sticky inflation, and AI capex still exists. This is especially true if yields hold at 5% after breaking through the current zone.
Bottom Line
Today’s NFP report was good enough to keep the soft-landing window open, but not weak enough to bring easy Fed-cut hopes back in any serious way.
For DXY, the focus is whether the 50 EMA band retest can hold.
For USD/JPY, the focus is whether 200 EMA support can survive intervention pressure.
For Treasury yields, the important point is that the 2Y and 30Y charts were already technically bullish, and NFP may now decide whether traders keep respecting those setups.
The market still has room to climb from here, especially if earnings optimism stays in control.
But if yields keep leaning higher, this rally gets a lot less comfortable, even if earnings still look optimistic on the surface.


