Written by:

- Opening Bell
- August 17, 2026
- 7 min read
How Much Oil Disruption Can Stocks Ignore?
On Saturday, August 15, Iranian Foreign Minister Abbas Araqchi said Washington would have to meet Tehran’s conditions before normal shipping through the Strait of Hormuz could resume.
One day later (that would be Sunday), Kpler registered zero commodity-vessel transits through the strait after tracking only five on Saturday, versus 31 across the previous weekend.
Yet on Monday, August 17, Brent was still trading around $89 and U.S. equity futures were higher. That is the contradiction behind the markets: the physical energy picture has worsened faster than the equity market has reacted.
The story moved from rhetoric to physical evidence
On Thursday, August 13, U.S. Defense Secretary Pete Hegseth said the Navy could maintain its blockade of Iran “indefinitely”, rotating ships as needed.
Treasury Secretary Scott Bessent said Washington was preparing further measures against Tehran.
The UAE also reported attacks on ADNOC vessels transiting Hormuz.
Araqchi’s Saturday condition then gave the shipping slowdown a political constraint: the Oman-Iran navigation work may provide a technical mechanism for traffic, but Tehran is still linking a normal reopening to wider U.S. concessions.
In other words, a shipping-lane framework is not the same thing as a political settlement.
Despite that, the market may still be right to avoid pricing a full supply choke. ADNOC said on Monday that it had sold at least 14 million barrels of spot crude to Asian refiners, and analysts argued that crude may struggle to move materially higher unless the remaining flows through Hormuz stop more completely or Bab el-Mandeb deteriorates further.
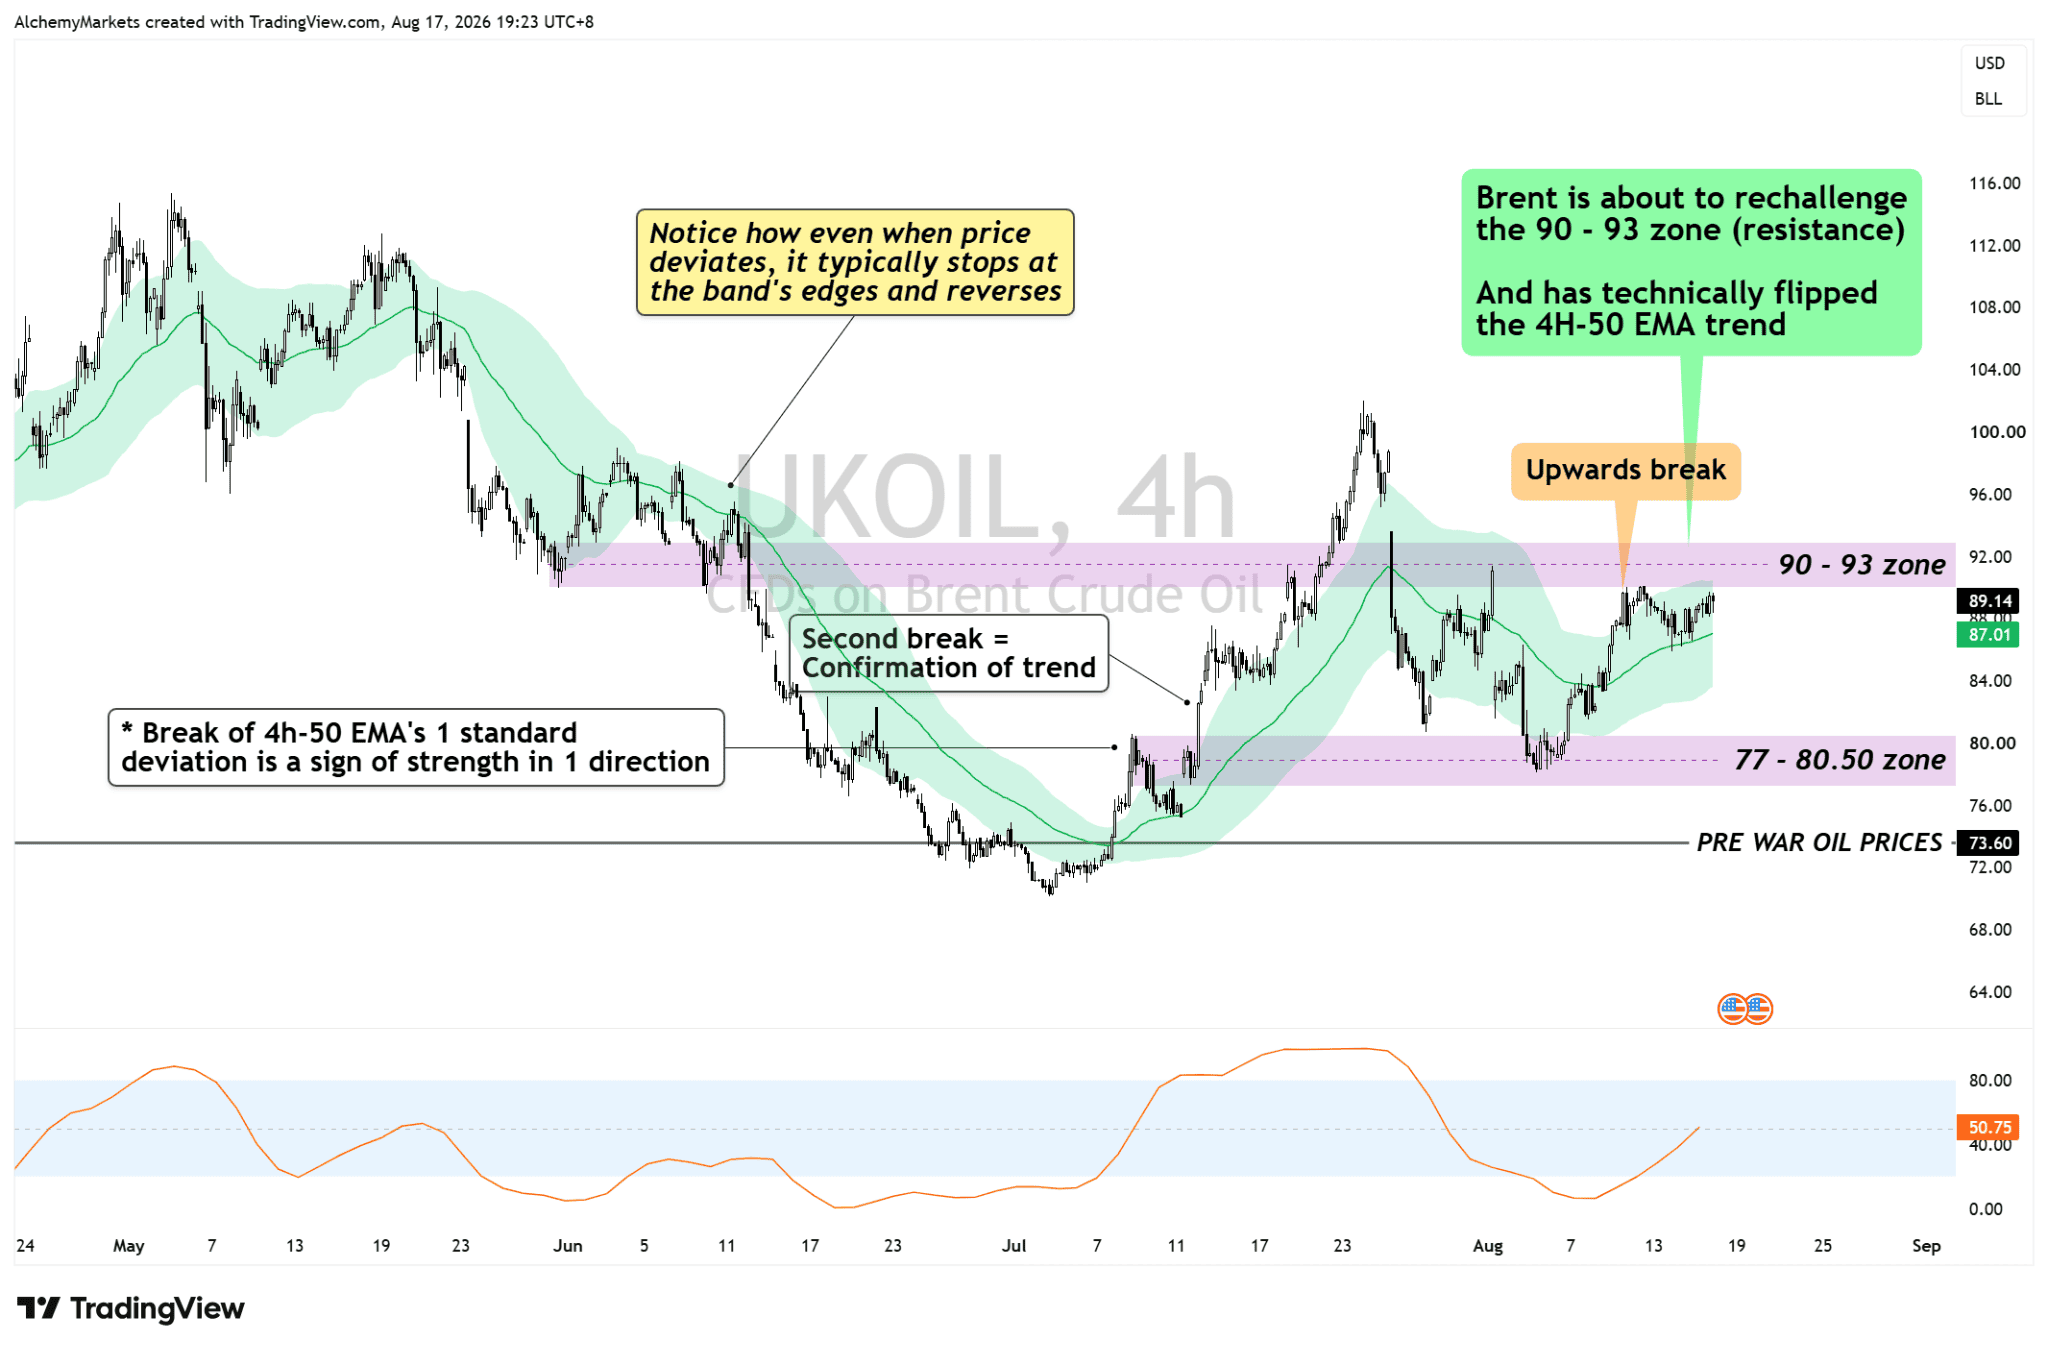
| Chart 1. Brent crude (UKOIL), 4-hour. Price has moved back above the 4H 50-EMA trend and is approaching the 90-93 resistance zone. The 77-80.50 area remains the nearer support reference. |
That is also what the Brent chart is saying. Price has reclaimed its 4 hour 50-EMA bollinger bands and is moving back toward the 90-93 resistance zone.
However, that move admittingly is looking weak, and without a clean breakout in the picture, crude oil remains suppressed.
A break above would be a stronger sign that the physical disruption is finally overcoming the market’s managed-disruption assumption. A rejection would keep that assumption intact for longer.
Crude may be understating the refinery problem
Since the start of August, crack spreads have widened again. European diesel margins are above $70 per barrel, versus roughly $25 at the start of the year, while gasoil and jet-fuel inventories remain well below normal.
That points to a tightening market for fuel products, not necessarily crude itself. Less refining capacity means diesel, gasoline and jet fuel become more expensive to produce and source.
For businesses, that can mean higher freight, transport and aviation costs. Companies either absorb those costs through weaker margins or pass them on through higher prices, keeping inflation pressure alive.
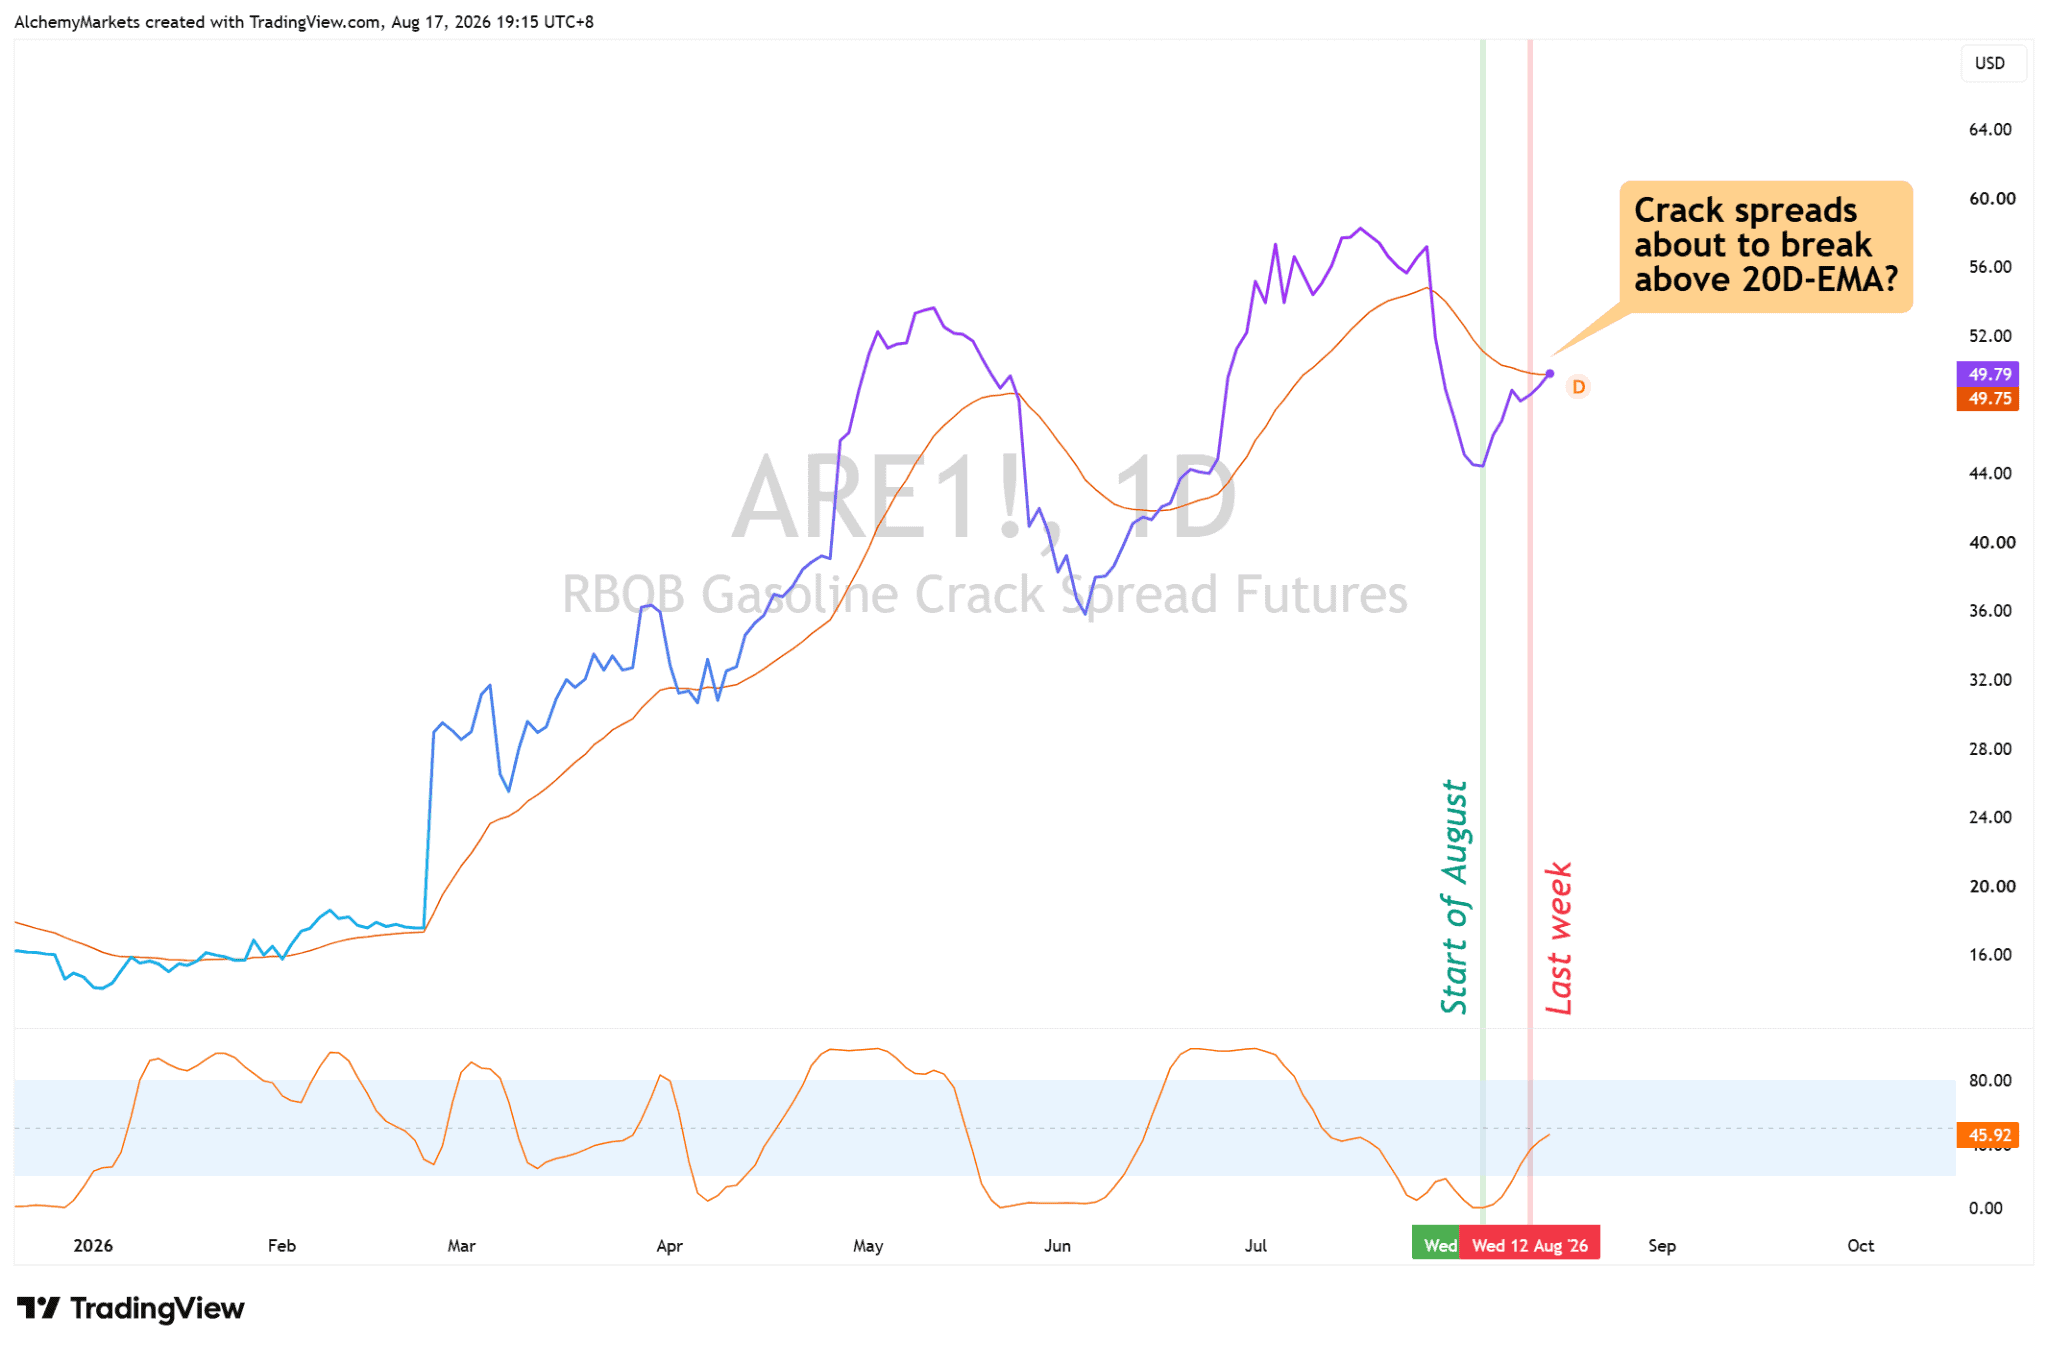
| Chart 2. RBOB gasoline crack spread futures (ARE1!), daily. The spread has rebounded toward its 20-day EMA after the early-August drop. A sustained break would strengthen the case that downstream product stress is rebuilding. |
The chart above is the RBOB gasoline crack spread futures. ARE1! has rebounded sharply and is testing its 20-day EMA. A sustained break would make a widening crack spread signal harder to dismiss.
Why stocks can still look through the shock
The strongest tailwind for equities is the U.S. rate path. For now at least, the outlook on the Fed’s rate decision in September looks considerably softer.
On Thursday, August 13, July producer prices (PPI) were unchanged month-on-month versus the original expectations for a 0.2% increase.
On Friday, August 14, July retail sales fell 0.6% against expectations for a 0.1% increase, while the GDP-sensitive control group fell 0.4% versus a 0.3% gain expected.
Those releases pushed September Fed-hike pricing sharply lower, with the implied probability of a hike falling from 52.5% just last week to around 30% today.
Lower expected short-term rates reduce the valuation pressure on growth stocks, even while oil remains elevated.
But there is a second interpretation. Falling two-year yields can also reflect weaker growth expectations. That is why the U.S. 2-year yield is a useful cross-check rather than a simple bullish signal for stocks.
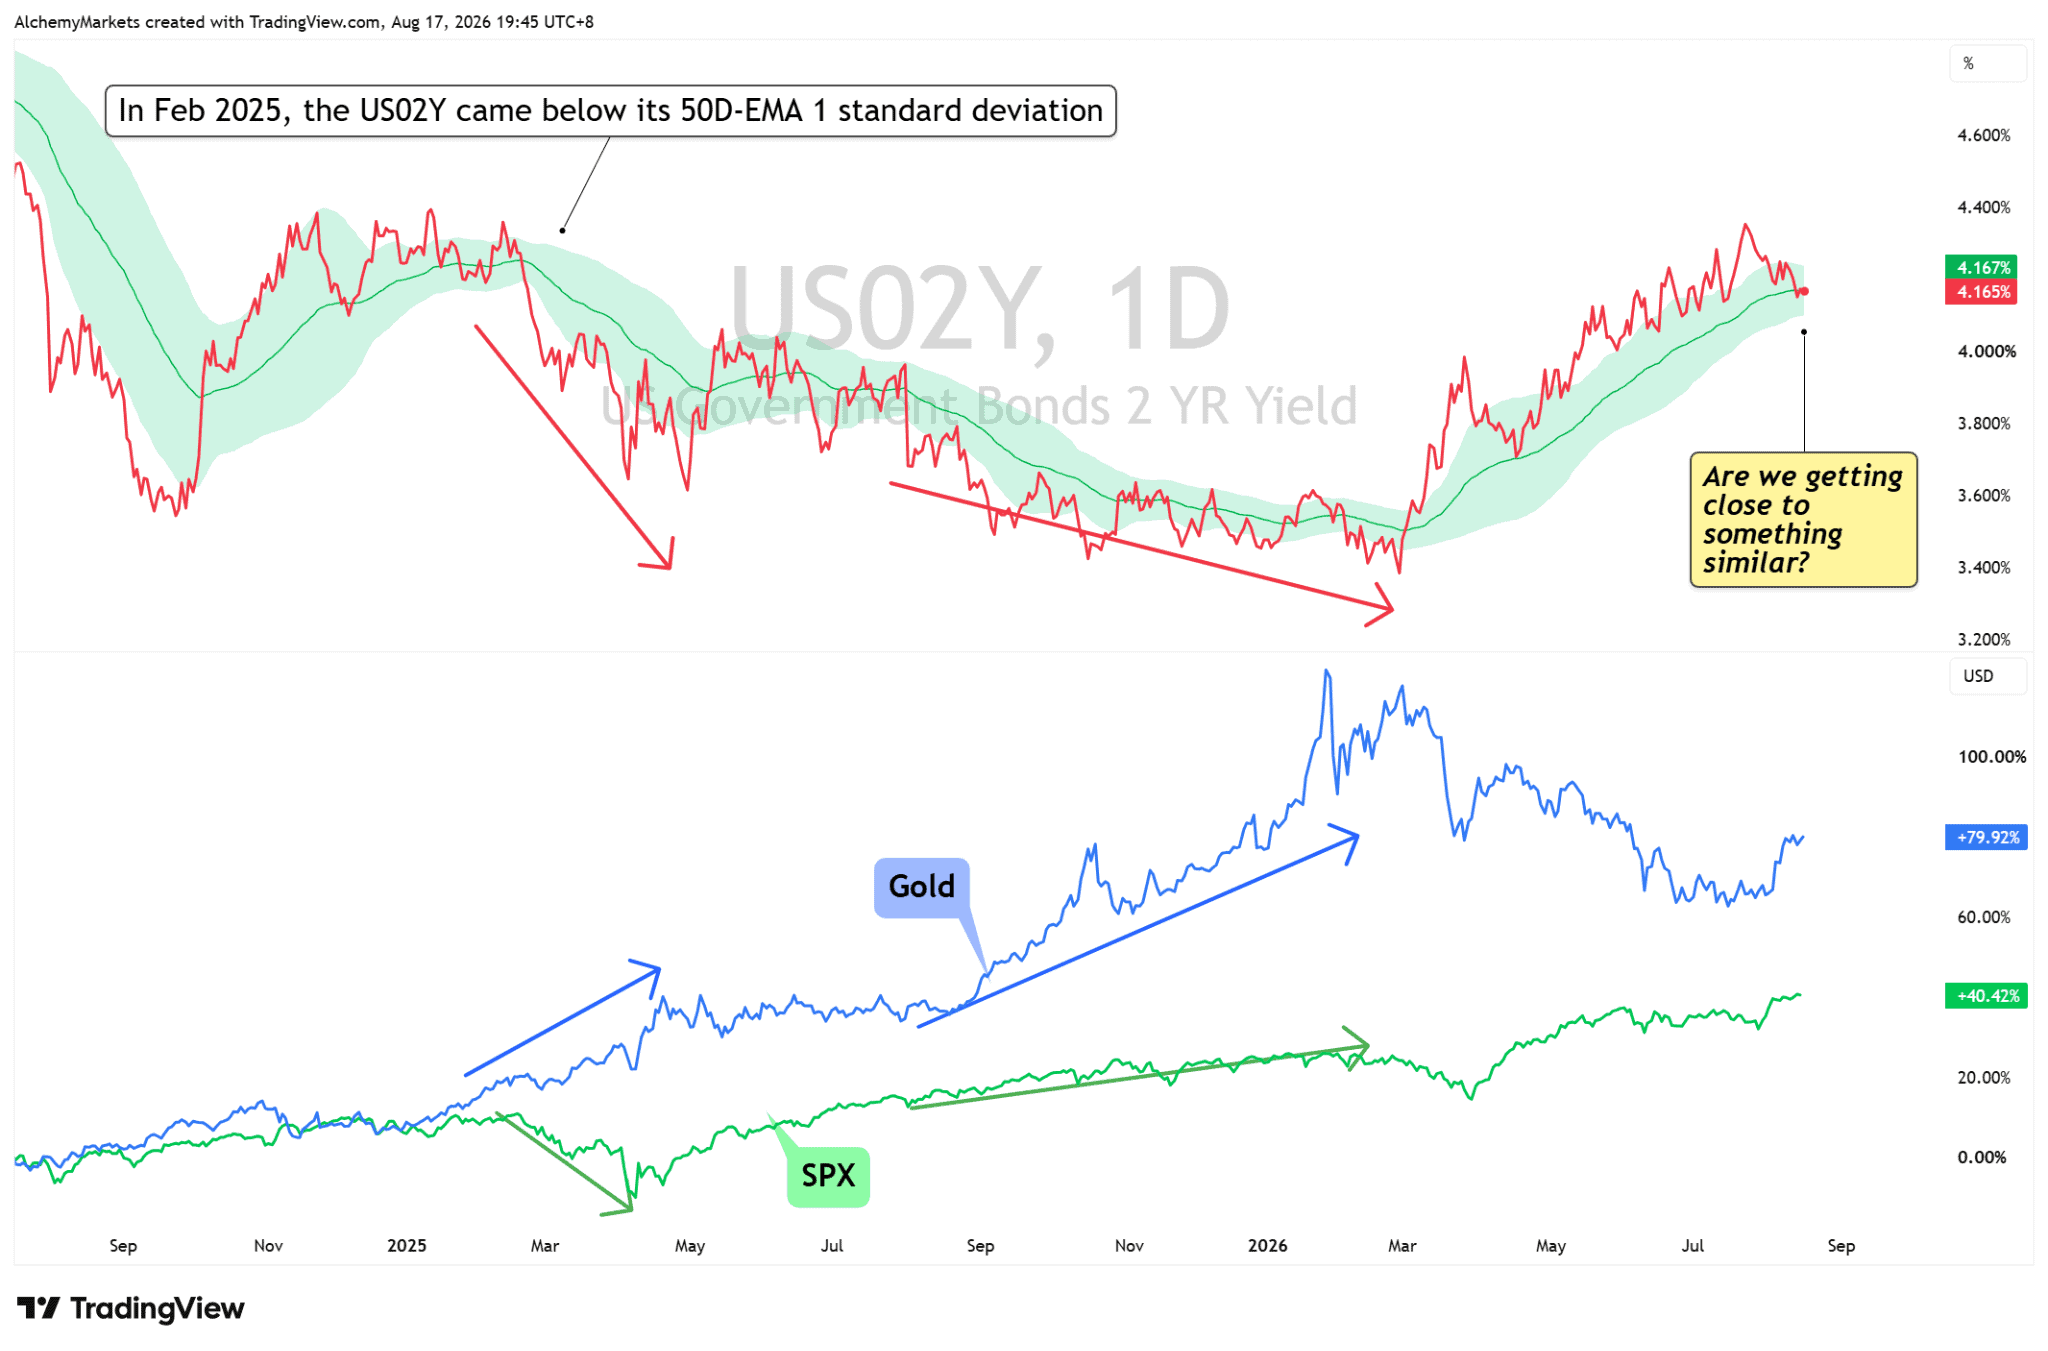
| Chart 3. U.S. 2-year yield versus S&P 500 and gold. The 2-year yield is testing its daily 50-EMA region. The February 2025 comparison is context, not a forecast: falling short-end yields can support valuations, but they can also reflect weaker growth expectations. |
The current 2-year yield is sitting around its daily 50-EMA region. If it continues lower because inflation and demand are cooling gradually, that can remain supportive for equities.
If it falls because the growth outlook deteriorates faster, the same move becomes less benign.
Earnings are the other part of the defence
The second reason stocks have been able to absorb the oil shock is earnings.
By Monday, roughly 84.8% of S&P 500 companies that had reported were beating estimates, while semiconductor names were recovering after the earlier AI-spending scare.
That makes technology leadership more than a chart story. As long as earnings continue to validate capital spending and semiconductors keep participating, the index can absorb more macro discomfort than it could in a weak earnings season.
The tolerance is being tested at a difficult technical area
The S&P 500 is now pressing the top of its long-run logarithmic channel around the 7,800-8,000 area.
The daily chart is overlaid with the longer-horizon 100-week EMA band, which has acted as an important structural reference during prior pullbacks.
Daily Stoch RSI is already elevated. That does not mean the index has to reverse here…
That being said, previous touches at the logarithmic channel’s high, combined with an overbought Stochastic RSI, have eventually been followed by a clear rejection towards the 100W-EMA band.
For now, the SPX can continue to deviate above the channel and make another high.
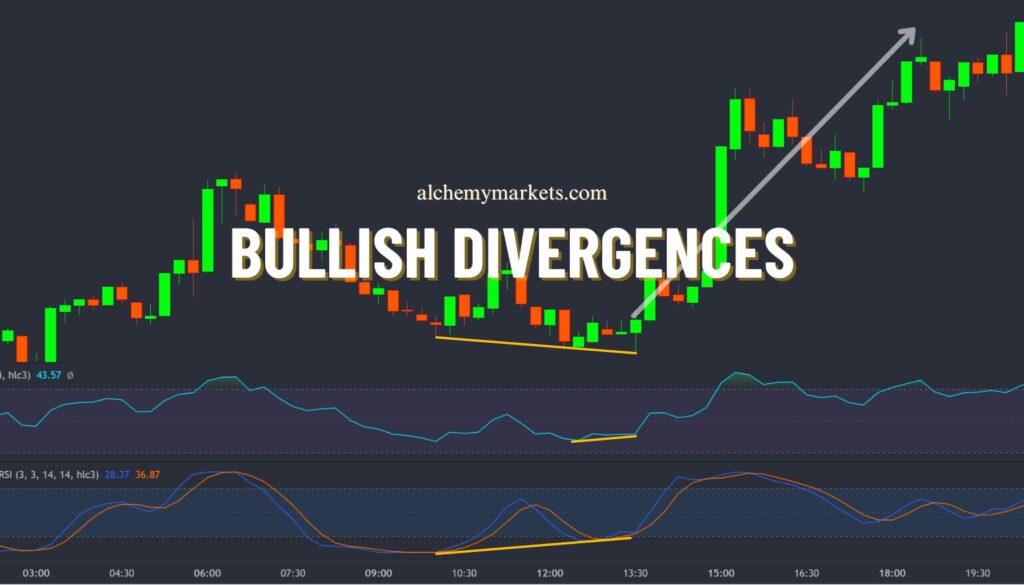
The more useful warning would be a marginal new price high while momentum fails to confirm it, creating a lower high (Bearish divergence) in Stoch RSI or another momentum indicator.
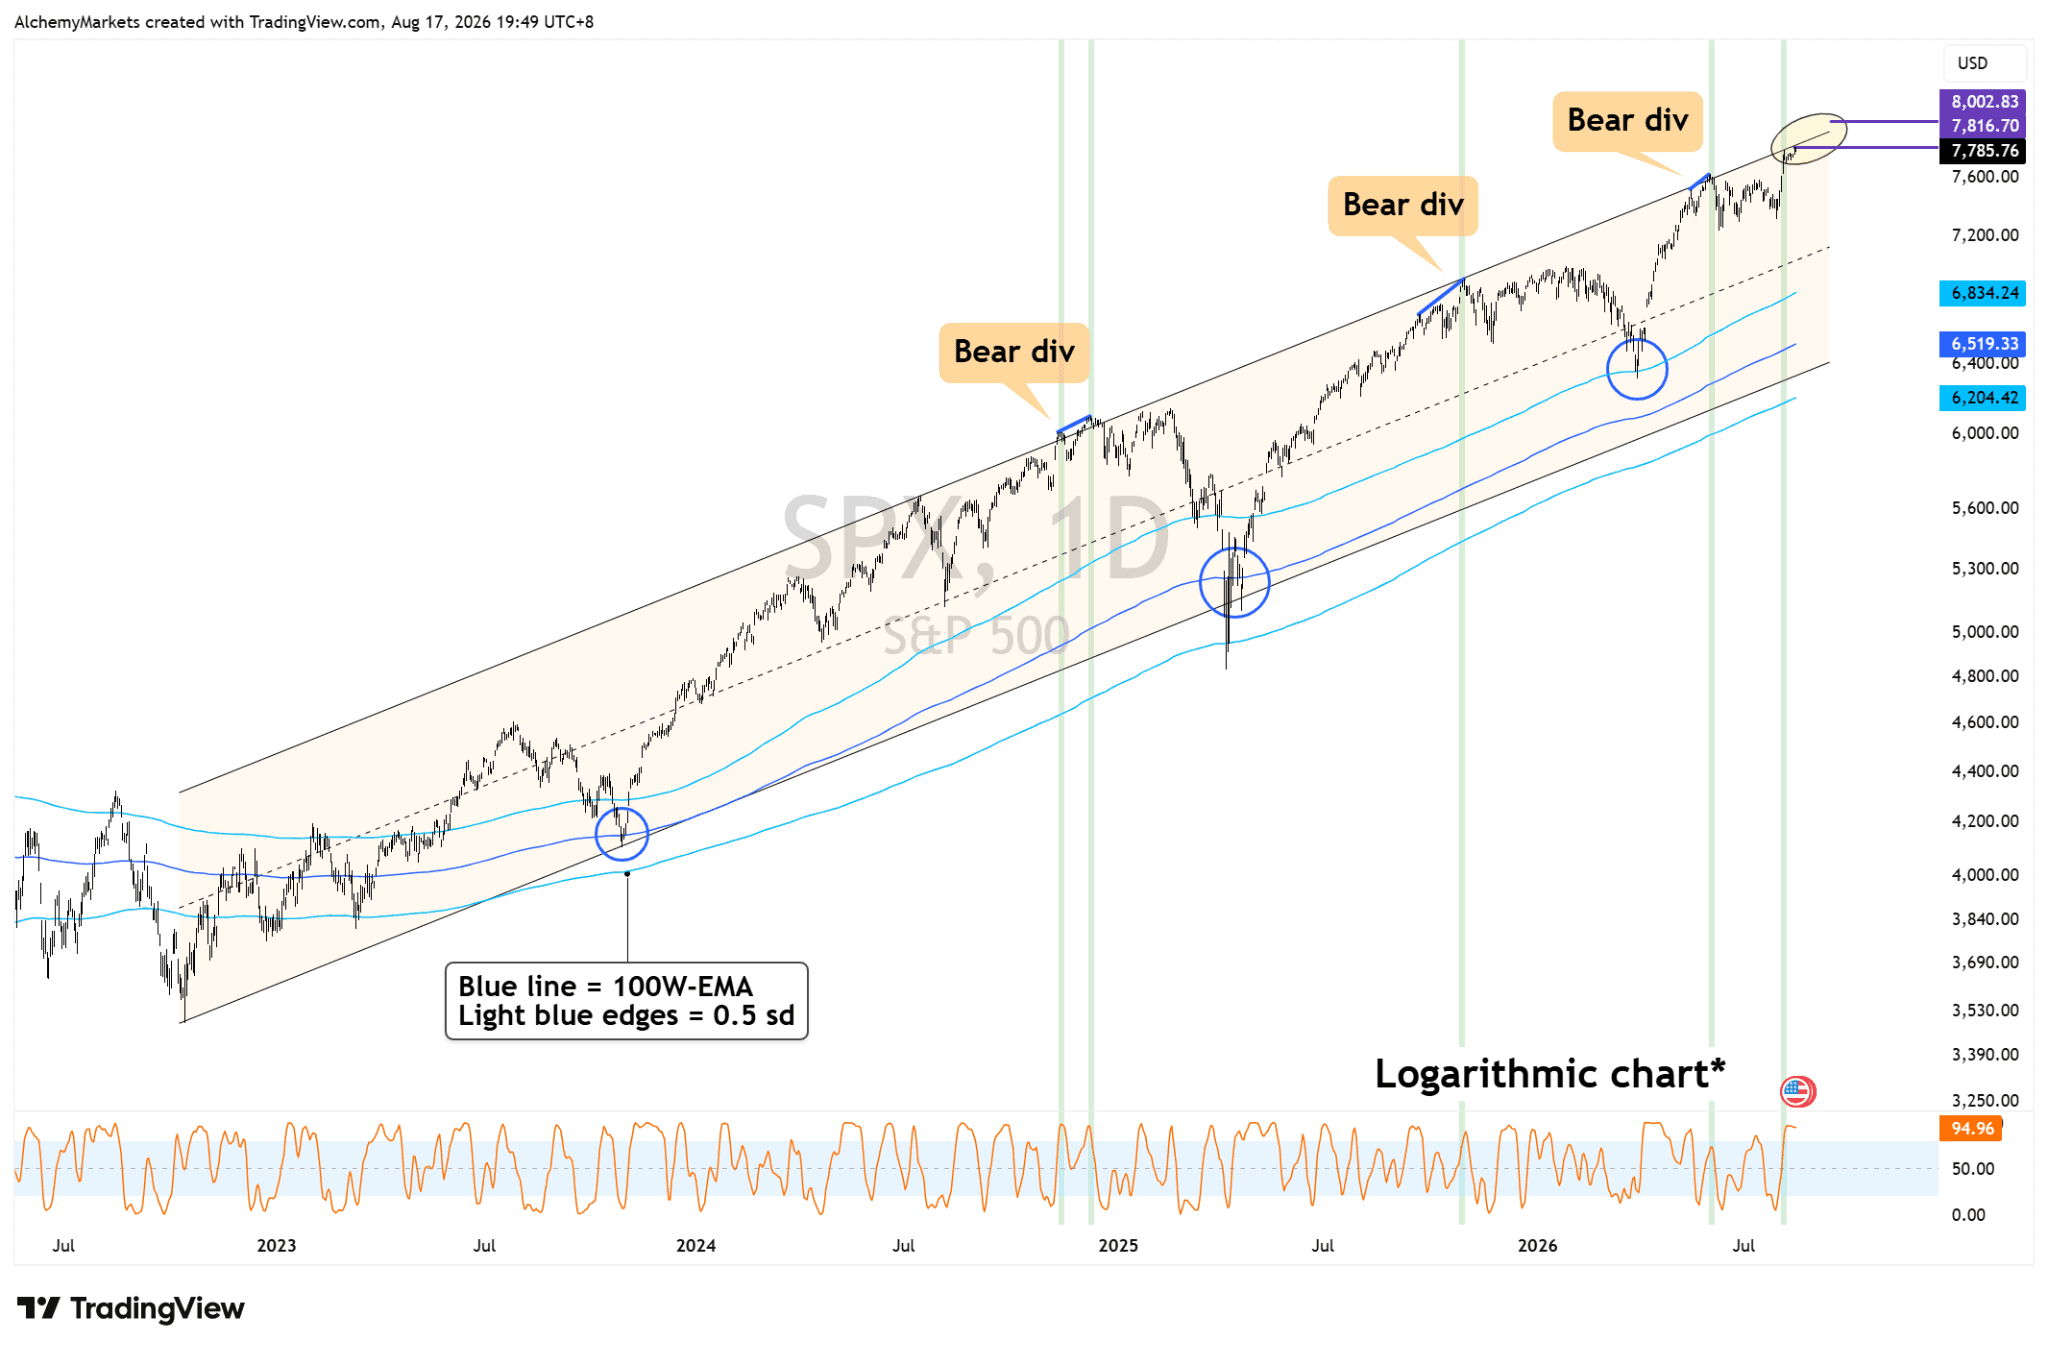
| Chart 4. S&P 500, daily logarithmic view with the longer-run 100-week EMA band. Price is pressing the top of the channel near the 7,800-8,000 area while daily Stoch RSI is already elevated. A higher price high with a lower momentum high would create a bearish-divergence setup; it is not confirmed yet. |
Semiconductors are the cleaner confirmation test
SMH is testing the 50%-61.8% fibonacci retracement zone of its recent decline, roughly 588-608 on the daily chart. Stoch RSI is also overbought, which ignites favourable conditions for bearish reversals.
The 100-day EMA band below has produced meaningful bounces before, but it was tested recently. That makes another immediate test less convincing as a fresh support event.
If SMH rejects the retracement zone and then loses the 100-day band, US equities would be losing one of the main leadership groups currently helping it look through the oil shock.
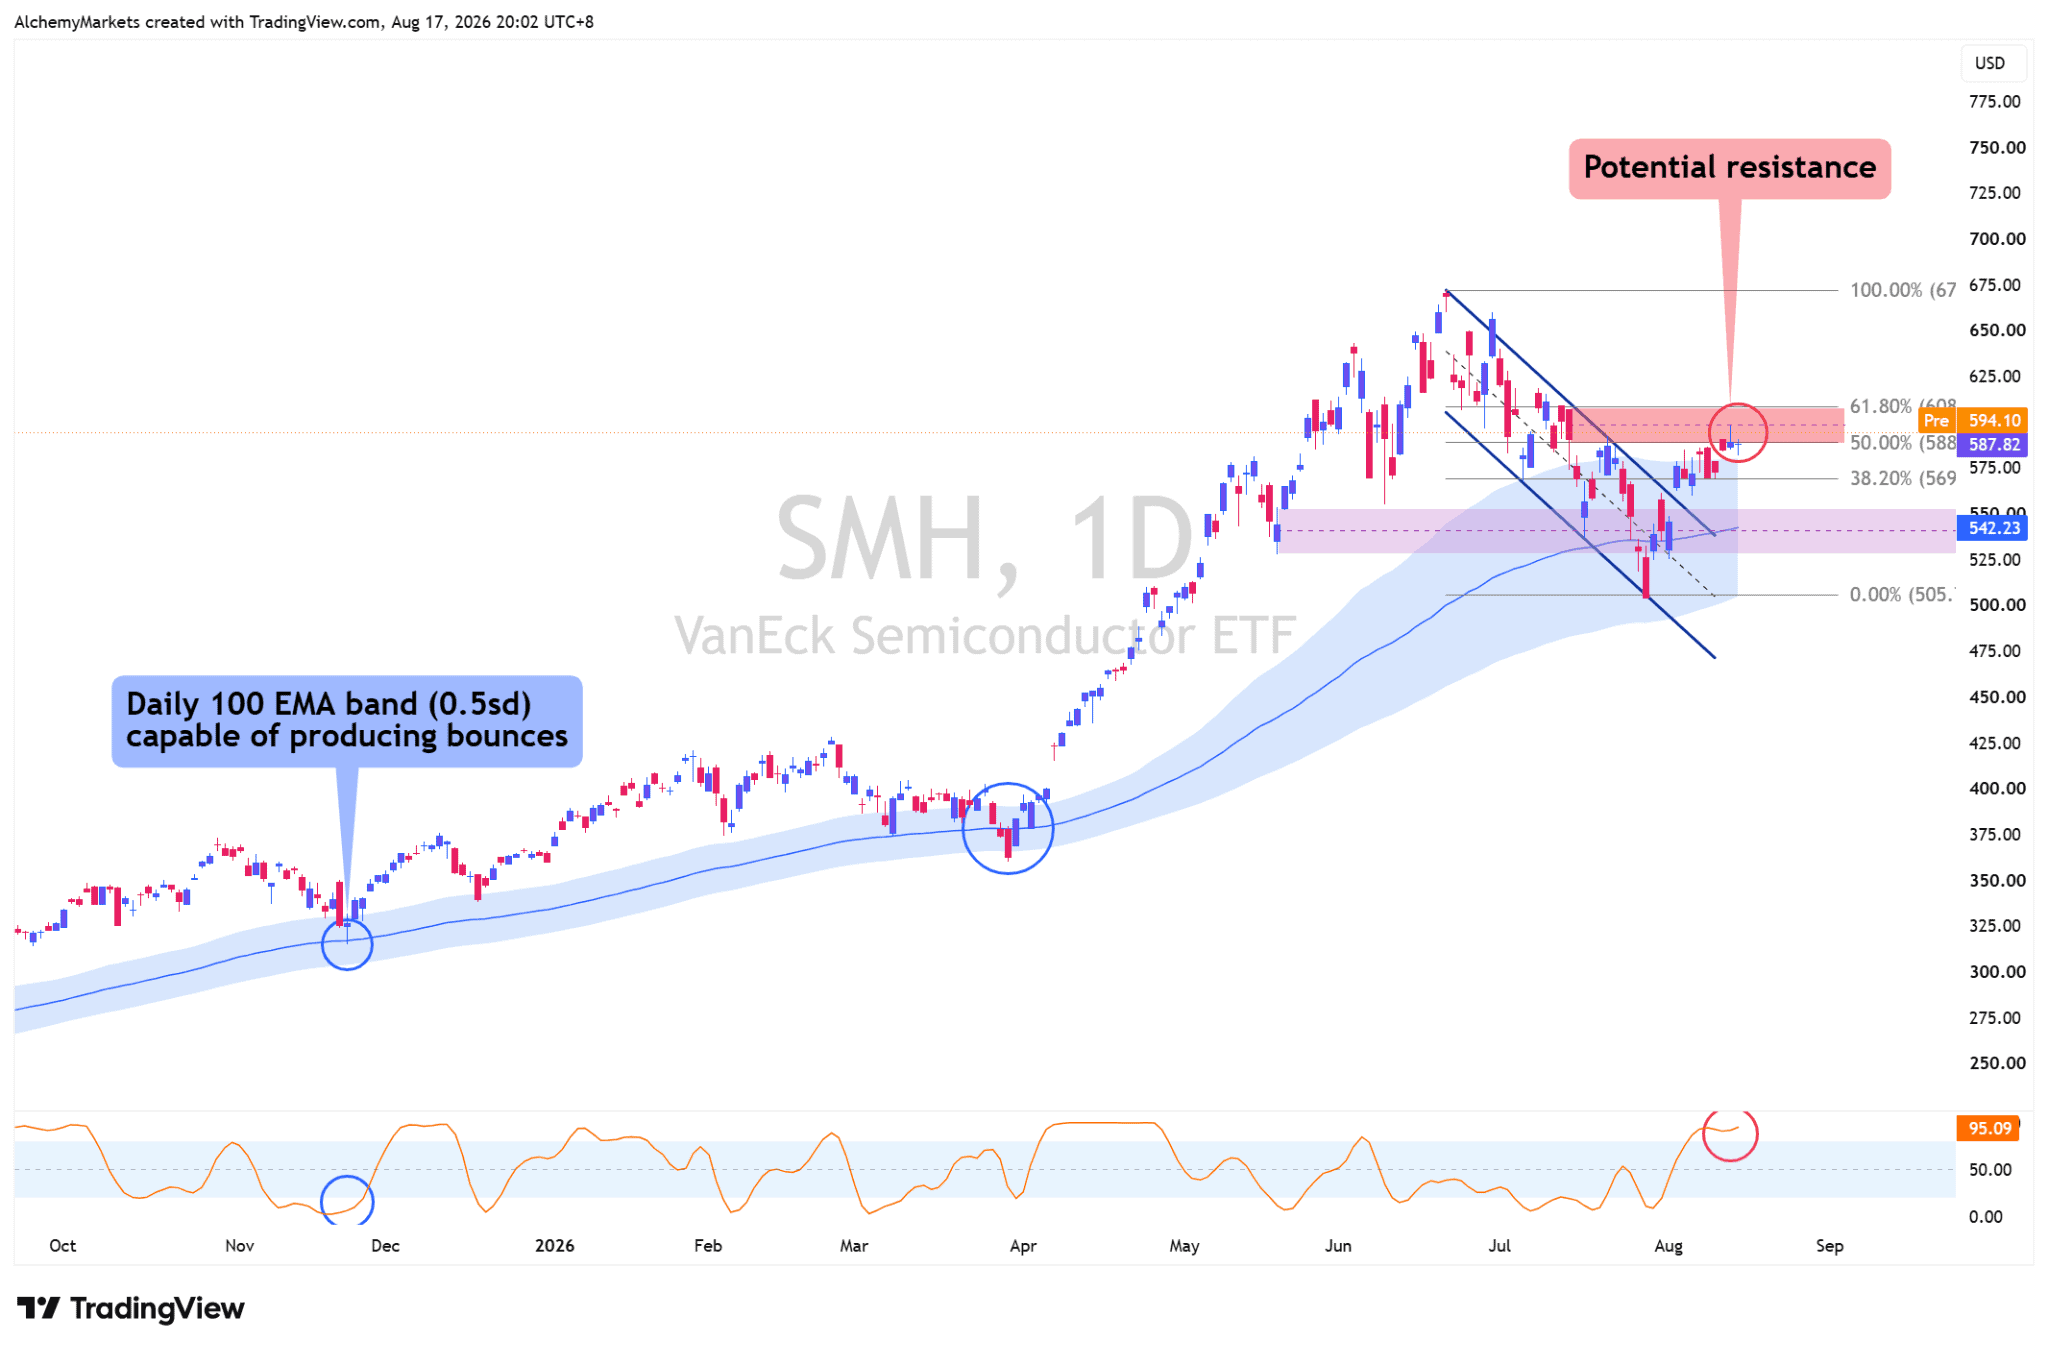
| Chart 5. VanEck Semiconductor ETF (SMH), daily. Price is testing the 50%-61.8% retracement zone around 588-608 with Stoch RSI overbought. The 100-day EMA band has produced prior bounces, but it was tested recently, so another immediate test would be less convincing as fresh support. |
What would change the view?
Oil rising by itself is not enough. The more important signal would be several markets beginning to agree with each other.
If those conditions begin to align: oil rises, crack widens, SPX rejects, SMH rejects… the story changes from a manageable geopolitical disruption into a cross-asset inflation, rates and earnings problem.
For now, stocks are still grinding higher on a fragile assumption: enough oil continues to flow, Fed pressure stays contained, and earnings remain strong enough to absorb the shock.
The physical evidence from Hormuz and the refinery system is starting to test how much longer that balance can hold.