


- Elliott Wave
- November 6, 2024
- 2 min read
Oil’s Slippery Slope: Dip Around the Corner? (Elliott Wave)
Executive Summary
- Crude oil chops sideways in potential triangle pattern
- Any rallies likely hold below $78.42 and lead to further declines
- Downside targets include $60-63
Huge Event Risk This Week
As the US election results start to trickle in, markets may get a little squirrely. The Fed is still to come with their rate announcement and subsequent conference call about the direction of the economy. Inflation expectations could play in future pricing of crude oil. Let’s look at the Elliott wave count for oil.
Crude Oil Elliott Wave Analysis
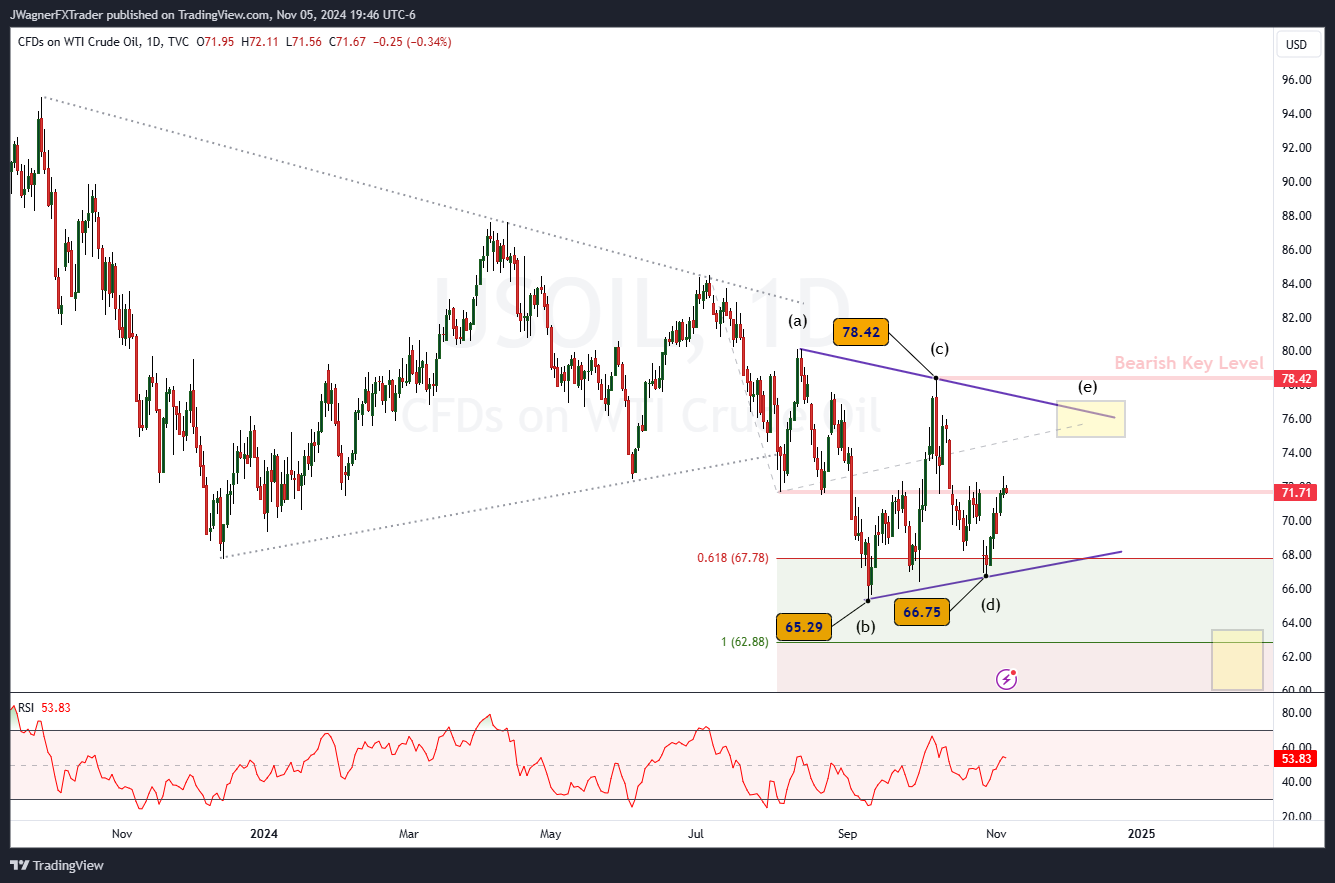
Since the August 5 swing low, crude oil has carved a series of alternating three wave trends. In Elliott wave terms, this suggests that either a triangle is developing or a diagonal, in this case, a falling wedge.
When you draw trend lines connecting the outer extremes, those trend lines converge. This is a clue that a symmetrical triangle may be in development. If so, then crude oil may rally slightly further to reach $75-77.
The triangle would be viewed as a bearish triangle so this rally appears to be the final wave of the pattern. If the rally proceeds above $78.42, then another pattern is at play.
Bottom Line
It appears that a symmetrical triangle is unfolding and crude oil is in the final waves of the pattern. The minimum waves are in place to satisfy the pattern, though a rally to $75-77 would also be considered normal.
The key level for the bearish view is the September high of $78.42.
If this pattern is at play, then a decline could stretch down to $60-63.
You might also be interested in:


