- Elliott Wave
- October 7, 2026
- 2 min read
Nasdaq Elliott Wave: Incomplete Impulse Or Bearish Island Gap?
Executive Summary
- Trend Bias: Wave iii of (iii) rally.
- Key Support Level: 30, 745.
- If correct, this bullish trend could carry up to 32,350 and possibly higher levels.
Since the Fed meeting in middle of September, Nasdaq has been running higher with minimal and temporary declines. Today’s decline is considered ‘normal’ within the larger pattern. However, the island top that developed needs to be watched closely for a competing bearish pattern.
Current Elliott Wave Analysis
Our Elliott wave analysis of the Nasdaq 100 (USTec) chart shows the rally from the July 2026 low is shaping an Elliott wave impulse pattern.
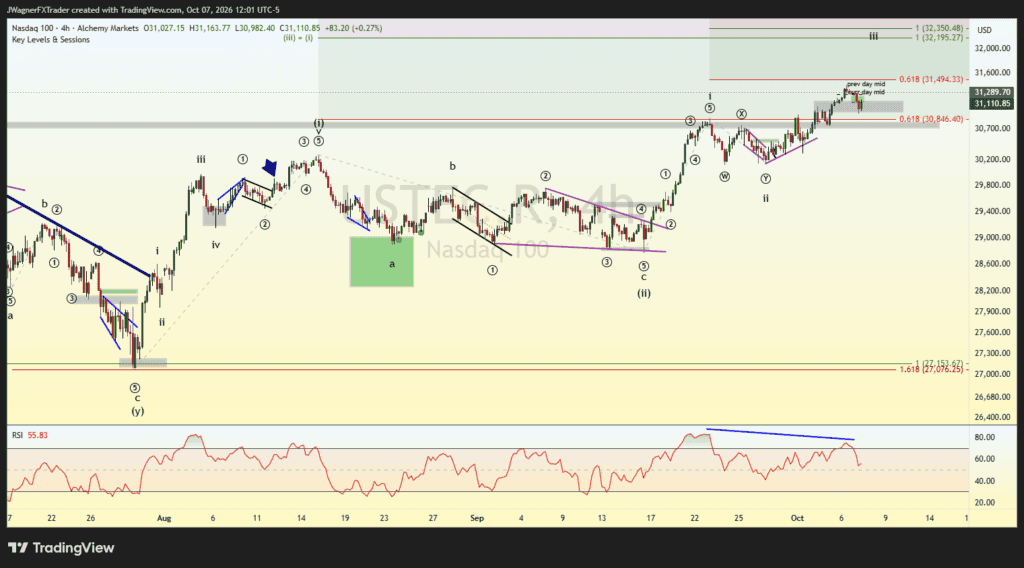
Impulses include 5-subwaves, in this case labeled (i)-(ii)-(iii)-(iv)-(v). It appears USTEC is in the middle of wave (iii).
If this model is correct, then USTEC may rally to 32,350 and possibly 34,500 where common wave relationships sit.
Wave iii of (iii) is the 100% Fibonacci extension of wave i of (iii) at 32,350.
Wave (iii) is the 161.8% Fibonacci extension of wave (i) at 34,500.
There is a bearish pattern that I’m keeping my eye on.
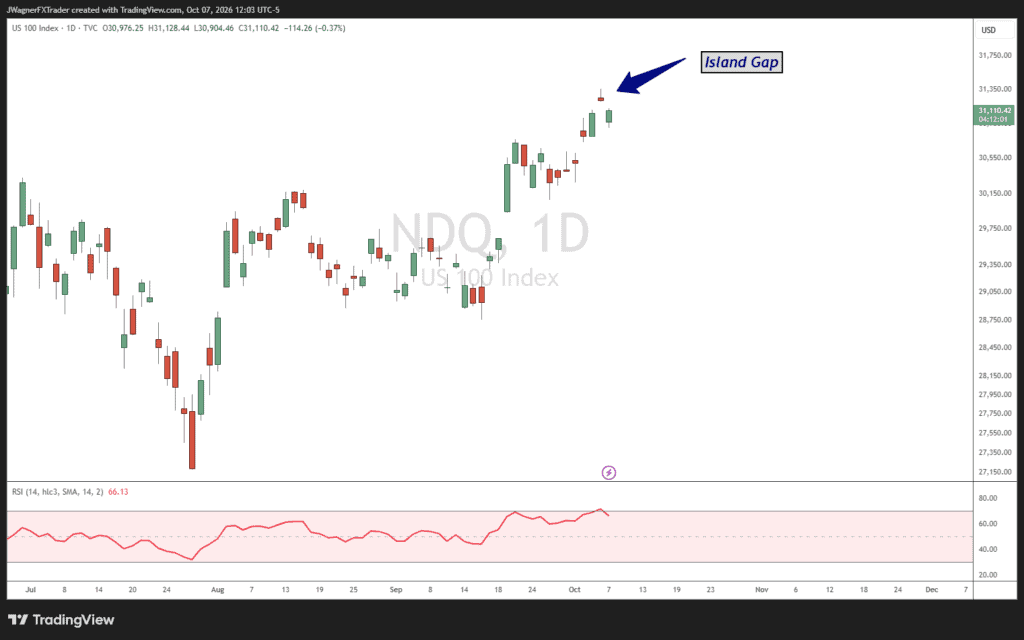
On the cash version of Nasdaq (NDQ), there is an island top pattern on the daily chart. This is a pattern that can appear at the end of strong trends. Prices gap higher to fool traders into thinking this trend is continuing higher. Then it gaps lower leaving behind an island that is not connected to the mainland.
For NDQ, prices gapped open on Tuesday and did not fill the gap. The next day, today, NDQ gapped lower casting away from the previous day leaving behind what looks like an island.
The Island Top pattern is not really common and is a bearish pattern. However, NDQ can rally to fill the downside gap. IF NDQ rallies to 31,225 to fill the gap, then the pattern would void its signal and suggest the bullish Elliott wave pattern noted above is on track.
If NDQ fails to fill the gap and if USTEC falls below horizontal support at 30,745, then it will set off a series of lower lows hinting at a bearish reversal.
Bottom Line
The structure of the rally from July appears to be incomplete and may push up to 32,350.
Failure to fill the downside gap in NDQ (31,225) and if USTEC breaks below 30,745 would suggest a bigger top is at hand followed by a large correction.