


Written by:


- Chart of the Day
- June 26, 2025
- 2 min read
BTC Nearing Breakout? Price Surges 10% Toward Resistance
After a quick dip into the $98K region, Bitcoin has made an amazing recovery of over 10% in just 4 days time. It also formed a clear bull flag on the higher timeframes — a sign and case for bullish continuation.
So, is it smooth sailing ahead from here? It’s certainly in the picture.
The fundamentals are aligning for a leg higher — war tensions are dying down (albeit, this can be shaky due to sudden developments), and U.S. rate cuts are on the table in September.
If we do push past $109,000, Bitcoin could be poised to create another all-time high — creating what may be, effectively, the final leg up before a blow-off top.
Bitcoin’s Major Resistance to Break: $109,097.40
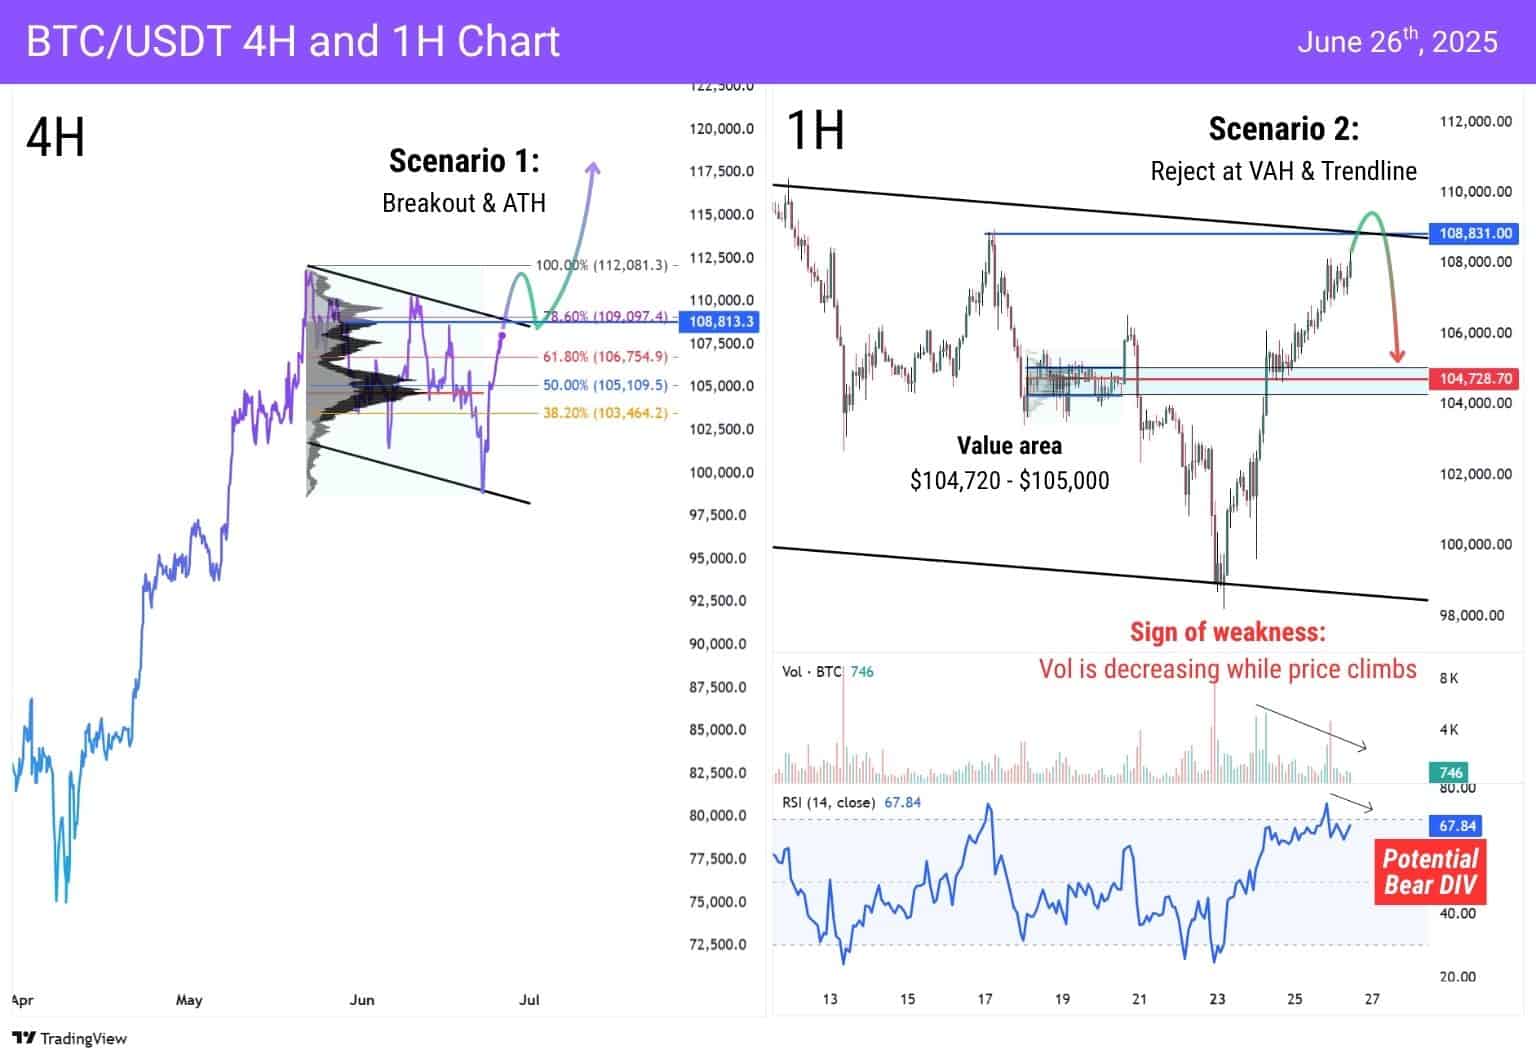
Drawing a bull flag connecting the highs and lows (Wicks) from May til June, Bitcoin appears to be a single percent (1%) move away from testing the upper trendline at approximately $108,800.
This level of resistance is significant as it aligns with two major technical levels:
- Value Area High from Swing High to Swing Low ($111,980 to $98,200) — $108,831.30
- 78.60% Fib Resistance from same swing — $109,097.40
Here are two scenarios to consider, but keep in mind, they are simplified overviews — and new catalysts may develop on the news front of things.
SCENARIO 1 (BULLISH BREAKOUT):
The most ideal scenario for crypto enthusiasts is that Bitcoin manages to overcome this level with strength — pushing way beyond $109,000 and then potentially, offering a rebuying opportunity on the retest.
This implies that despite major resistances and potential bearish divergences (volume and RSI), buyers were so bullish they invalidated the bearish scenario.
It’s then likely from here we’ll begin trailing into new All-Time-Highs on Bitcoin.
SCENARIO 2 (CONSOLIDATION):
The other scenario to watch for is a rejection of the $109,000 zone, then a potential pause at $105,000.
Supporting a rejection are signs of a weakening rise — volume is decreasing, and the RSI is potentially forming a bearish divergence.
The $104,720 to $105,000 zone is a prior consolidation range, making it a potential zone for a reversal. The edges of the zone, and its POC (Point of Control) at $104,728.70, all offer a potential reversal opportunity should a bullish candle be printed.
Should this range fail to hold, a drop to $103,000 could be on the cards.
You may also be interested in:


