- November 9, 2024
- 38 min read
Fibonacci Retracement – How To Trade It
What is Fibonacci Retracement?
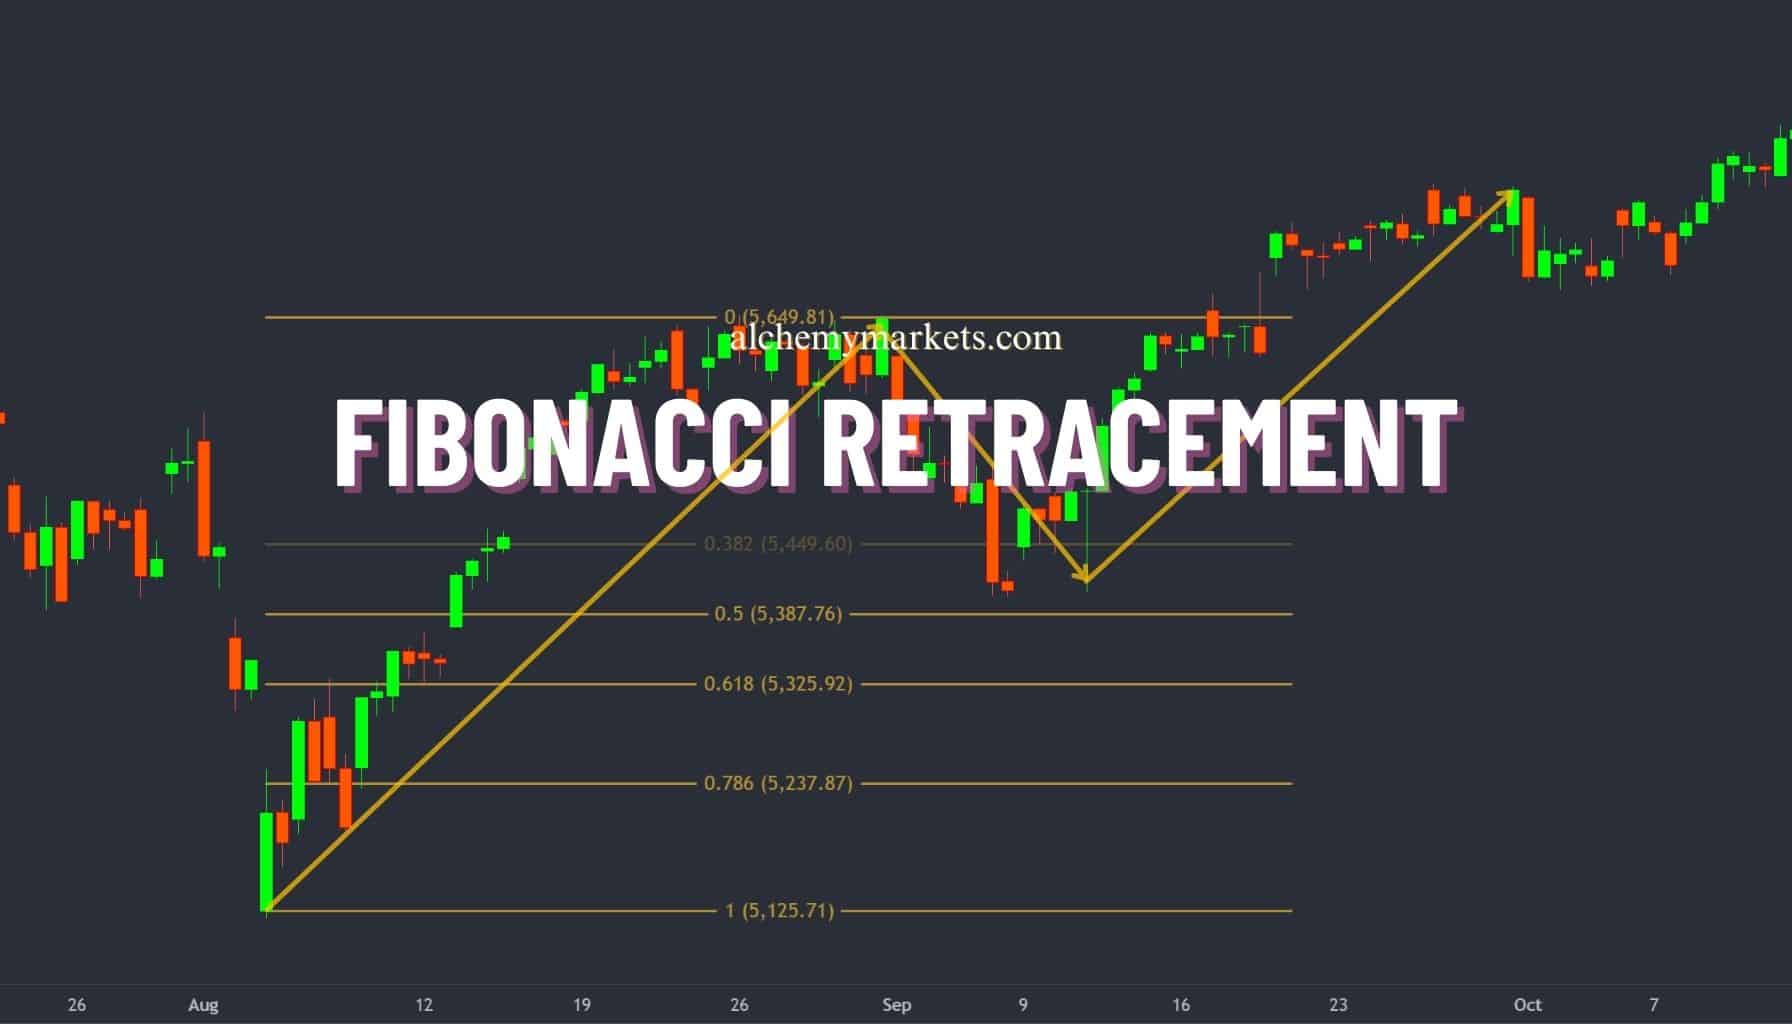
Fibonacci retracement is a tool used in technical analysis that draws horizontal lines on a price chart to help traders identify hidden levels of support and resistance.
These levels are based on the Fibonacci sequence, a mathematical series where each number is the sum of the two preceding numbers. The numbers in that sequence are known as Fibonacci numbers. Traders apply Fibonacci retracement levels to predict where a price may pause or reverse during a pullback, allowing them to make more informed decisions in trending markets.

The most common Fibonacci retracement levels are 23.6%, 38.2%, 50%, 61.8%, and 78.6%, which are plotted between two extreme points, typically the high and low of a previous price trend. These resulting retracement levels act as potential reversal points where the price might encounter resistance (within a downtrend) or support (within an uptrend), helping traders determine possible entry or exit points.
This tool is widely used across various asset classes like stocks, forex, commodities, and cryptocurrencies, making it a versatile and valuable tool for both novice and experienced traders.
A feature of the tool is that it can be applied on any chart time frame. However, the best time frame for Fibonacci retracement will be larger time frames like hours to monthly. Utilising the Fibonacci retracement on 1-minute charts can lead to a lot of false signals since the price differences in the underlying measurement are small. When using the Fibonacci retracement tool on a larger time frame, you can estimate potential reversal points within the larger trend.
How Do the Fibonacci Ratios and Fibonacci Sequence Work?

The Fibonacci retracement tool relies on specific ratios derived from the Fibonacci numbers. The Fibonacci sequence is a number pattern where each number is the sum of the two preceding numbers. This process of creating the next number is carried on indefinitely into the future creating a number sequence.
Discovered by Leonardo Fibonacci in the 12th century, the sequence begins as follows:
0, 1, 1, 2, 3, 5, 8, 13, 21, 34, 55, 89, 144…
To calculate the next number in the sequence, you simply add the two previous numbers together. For example:
- 1 + 1 = 2
- 2 + 3 = 5
- 3 + 5 = 8
As the sequence progresses, key Fibonacci ratios are derived by dividing certain numbers within the sequence. For example:
- Dividing a number within the sequence by the next higher number (e.g., 34 ÷ 55) results in 0.618, or 61.8%, also known as the golden ratio.
- Dividing a number in the sequence by the number two places higher (e.g., 34 ÷ 89) gives approximately 0.382, or 38.2%.
- Dividing a number in the sequence by the number three places higher (e.g., 34 ÷ 144) gives 0.236, or 23.6%.
These ratios—23.6%, 38.2% and 61.8%—are the basis of the Fibonacci retracement tool, which traders use to identify potential support and resistance levels on a price chart.
In practice, traders apply these ratios, and a couple of others we’ll discuss in a moment, to the distance between two extreme points, such as a swing high and a swing low, to determine where the price might reverse or stall. For example
- 61.8%, the golden ratio, is considered one of the most important levels and often signals a strong potential for price reaction.
The Fibonacci retracement tool plots horizontal lines across a price chart based on these ratios, acting as guideposts where price pauses, reversals, or consolidations frequently occur. While these levels do not guarantee specific price movements, they provide traders with strategic zones to watch for possible market reactions and plan their trading strategies.
What Are the Key Ratios in Fibonacci Retracement?

So far, we’ve discussed 23.6%, 38.2%, and 61.8% as key Fibonacci ratios. There are two more important ratios to consider for the Fibonacci retracement tool and that is the 50% and 78.6% levels.
Let’s break down the origin and significance of each ratio:
Key Fibonacci Ratios:
- 23.6%: This ratio is derived by dividing a number in the Fibonacci sequence by the number three places after it (e.g., 21 ÷ 89 ≈ 0.236). It marks a minimum retracement level and acts as an early warning level for a trend reversal. Traders often watch this level for minimal pullbacks.
- 38.2%: This ratio is calculated by dividing a number in the Fibonacci sequence by the number two places after it (e.g., 21 ÷ 55 ≈ 0.382). It signals a moderate pullback and is often regarded as a strong support or resistance level where prices may react.
- 50%: Although not derived as directly from the Fibonacci sequence as the other ratios, the 50% retracement level is widely used due to its historical significance in trading. This level represents a halfway point in a move and is often where market psychology considers the asset a value to resume the previous trend.
- 61.8%: Known as the golden ratio, this level is the most important in Fibonacci retracement analysis. It’s calculated by dividing a number in the Fibonacci sequence by the next higher number in the sequence (e.g., 34 ÷ 55 ≈ 0.618). Traders watch this level closely as it often marks a deep retracement where the price is likely to reverse.
- 78.6%: This level is derived from the square root of 61.8% (√0.618 ≈ 0.786). It represents a final line of defence for a trend, where the price may strongly reverse or break through, indicating a potential trend continuation.
These five ratios above are plotted on charts using the Fibonacci retracement tool. The trader will identify a swing low and swing high to provide the basis of the retracement. Once drawn, the resulting horizontal lines help traders identify hidden support and resistance levels. Armed with these levels, traders will study the price action to determine where prices are likely to stall, reverse, or consolidate, helping them enter and exit positions.
What Are the Common Retracement Levels?

The most common Fibonacci retracement levels used by traders are 38.2%, 50%, and 61.8%. Each of these retracement levels offers insights into where support or resistance might emerge, making them essential for traders who rely on technical analysis.
- 38.2% Retracement Level: This level is often seen as a moderate pullback within a trend. A moderate pullback implies two things. First, the prevailing trend is so strong, that price couldn’t muster a deep retracement. Or, secondly, the retracement is in its infancy and a deeper cut retracement may be on the horizon. Traders often watch this level closely, as it can act as a strong support or resistance point, signalling either a continuation of the trend or temporary consolidation.
- 50% Retracement Level: While not technically a Fibonacci ratio, the 50% retracement level is widely recognised in market analysis. It represents a critical halfway point of the previous price movement where value begins to emerge. Traders view this as a psychological level where the price could be getting close to reversing if the prevailing trend emerges. As a result, the 50% mark can offer a potential entry point for trades in the direction of the prevailing trend.
- 61.8% Retracement Level: Known as the golden ratio, the 61.8% retracement is perhaps the most significant of all. A retracement to this level is seen as a deep correction, yet the overall trend is still considered intact. It often acts as a decisive point where the price is likely to reverse if the trend is to continue. Many traders place a great deal of emphasis on this level, as it frequently signals a strong area of support or resistance.
These levels, particularly 38.2%, 50%, and 61.8%, are widely regarded as critical areas where price movements may shift direction or find support or resistance. The Fibonacci tool can be applied to both uptrends or downtrends as the ratios automatically adjust based on the swing high and swing low prices and trend used.
Traders who use Elliott Wave incorporate Fibonacci retracement levels into their analysis of the wave patterns. In fact, certain patterns exhibit a tendency to retrace at certain key levels noted above. Check out our Elliott wave post for greater detail on which levels to focus on.
Importance of Fibonacci Retracement in Technical Analysis

Fibonacci retracement helps traders pinpoint hidden levels of support and resistance within larger market trends. By drawing Fibonacci retracement levels from measuring the distance between swing highs and swing lows on a price chart, traders gain insights into where price action might encounter friction and what we can learn about the strength of the larger trend.
The 38.2%, 50%, and 61.8%retracement levels serve as critical markers for gauging how strong or weak a market trend is. For instance:
- A shallow retracement to 38.2% often signals that the trend is strong, as the price pulls back only slightly before continuing in the original direction.
- A retracement to 50% suggests a moderate correction, which could indicate uncertainty in the trend, giving traders a chance to reassess the market’s direction.
- A deeper retracement to 61.8% is a goldilocks of all levels as it is deep enough to shake out the trend traders and offers a great risk to reward ratio opportunity if the prevailing trend resumes.
By understanding how price behaves at these retracement levels, traders can evaluate the strength of the current trend and adapt their strategies accordingly. These levels not only help in identifying support and resistance but also provide valuable insights into potential trend reversals.
However, it’s important to note that Fibonacci retracement levels are not standalone indicators. While they offer a structured method for predicting potential price action, traders often combine them with other technical analysis tools.
Those tools could be styles of analysis like Elliott wave, patterns like flags, pennants, and wedges, or indicators such as moving averages and stochastics. This combination improves the accuracy of predictions and helps in creating more reliable trading strategies.
Calculating the Fibonacci Retracement levels
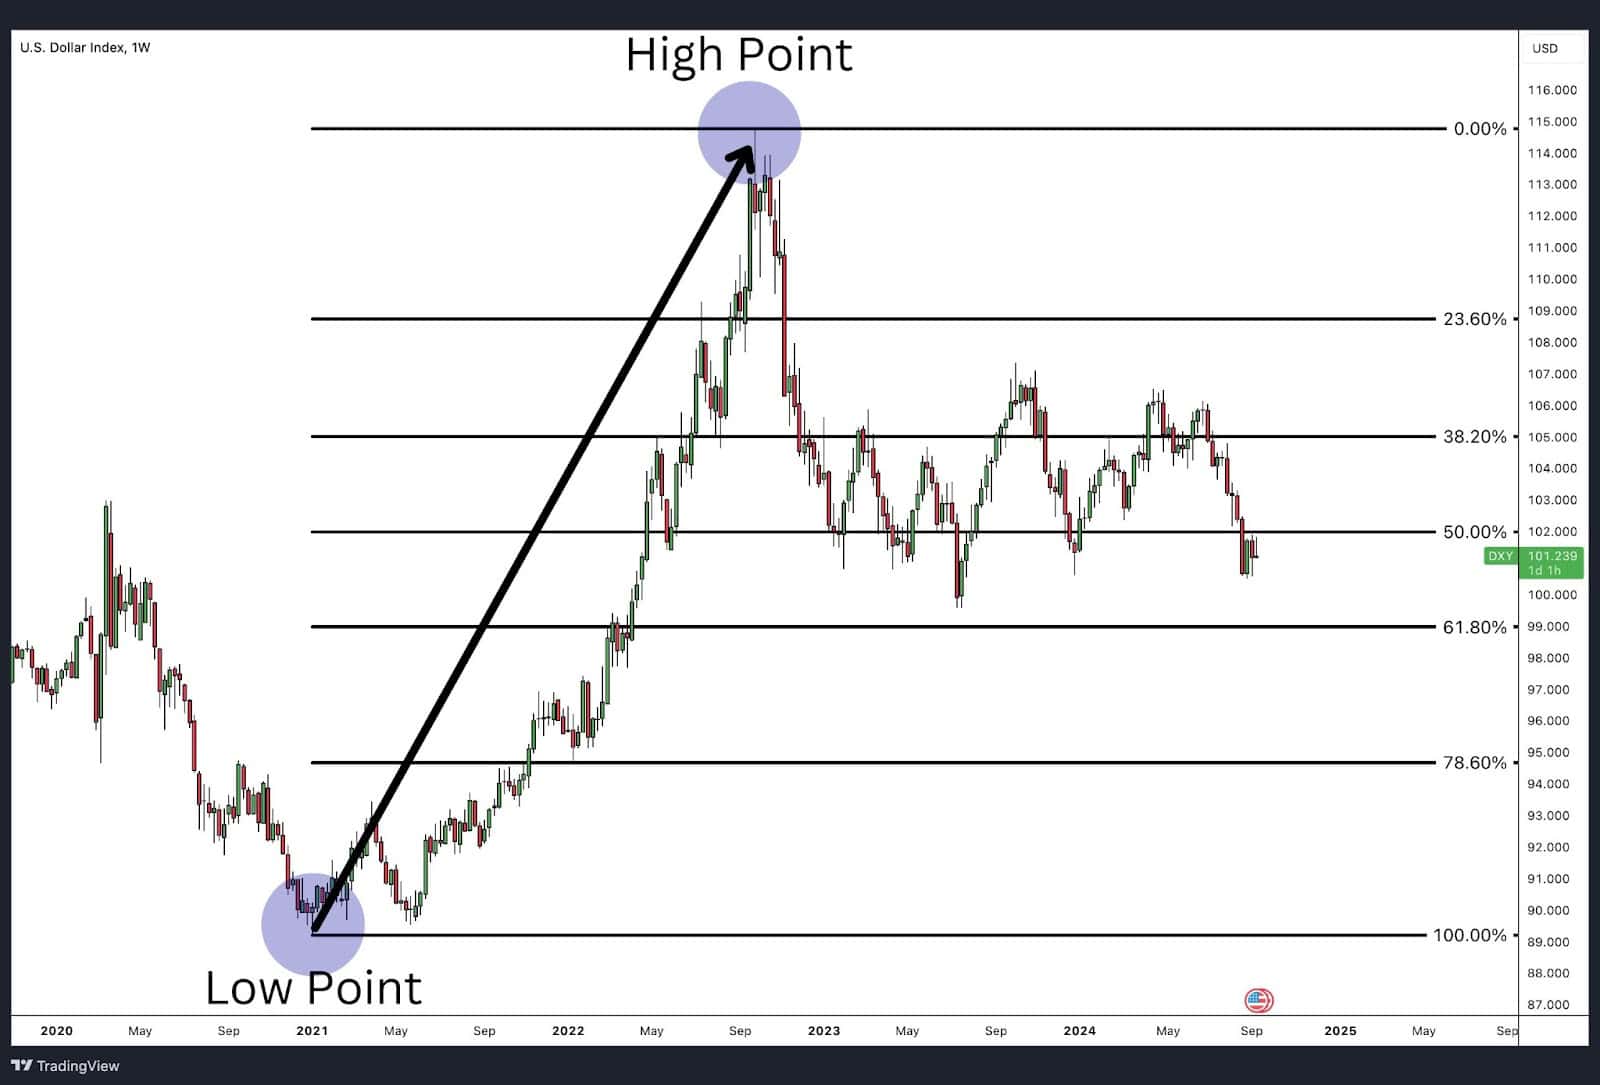
To calculate Fibonacci retracement levels, traders first identify two extreme points on a price chart—typically a swing high point and a swing low point. The difference between these two points is measured, and then the key Fibonacci ratios—23.6%, 38.2%, 50%, 61.8%, and 78.6%—are applied to this range. These percentages represent the retracement levels, which are then plotted as horizontal lines on the chart.
Fibonacci Retracement Formula
The Fibonacci retracement formula is used to calculate potential retracement levels between two extreme points (a high and a low) in a price move. The formula is:

For example, if the price moves from a low of $100 to a high of $200, and you want to calculate the 38.2% retracement level, the formula would be:

This level would be plotted as a potential support or resistance line on the price chart. The same process applies for other Fibonacci ratios like 23.6%, 50%, and 61.8%.
How Do You Draw a Fibonacci Retracement?
Drawing a Fibonacci retracement is a straightforward process in most charting platforms. Here’s how you can do it.

- Identify two extreme points: Select a significant swing high point and swing low point in the price movement. For an upward trend, the low point is the starting point, and for a downward trend, the high point is the start.
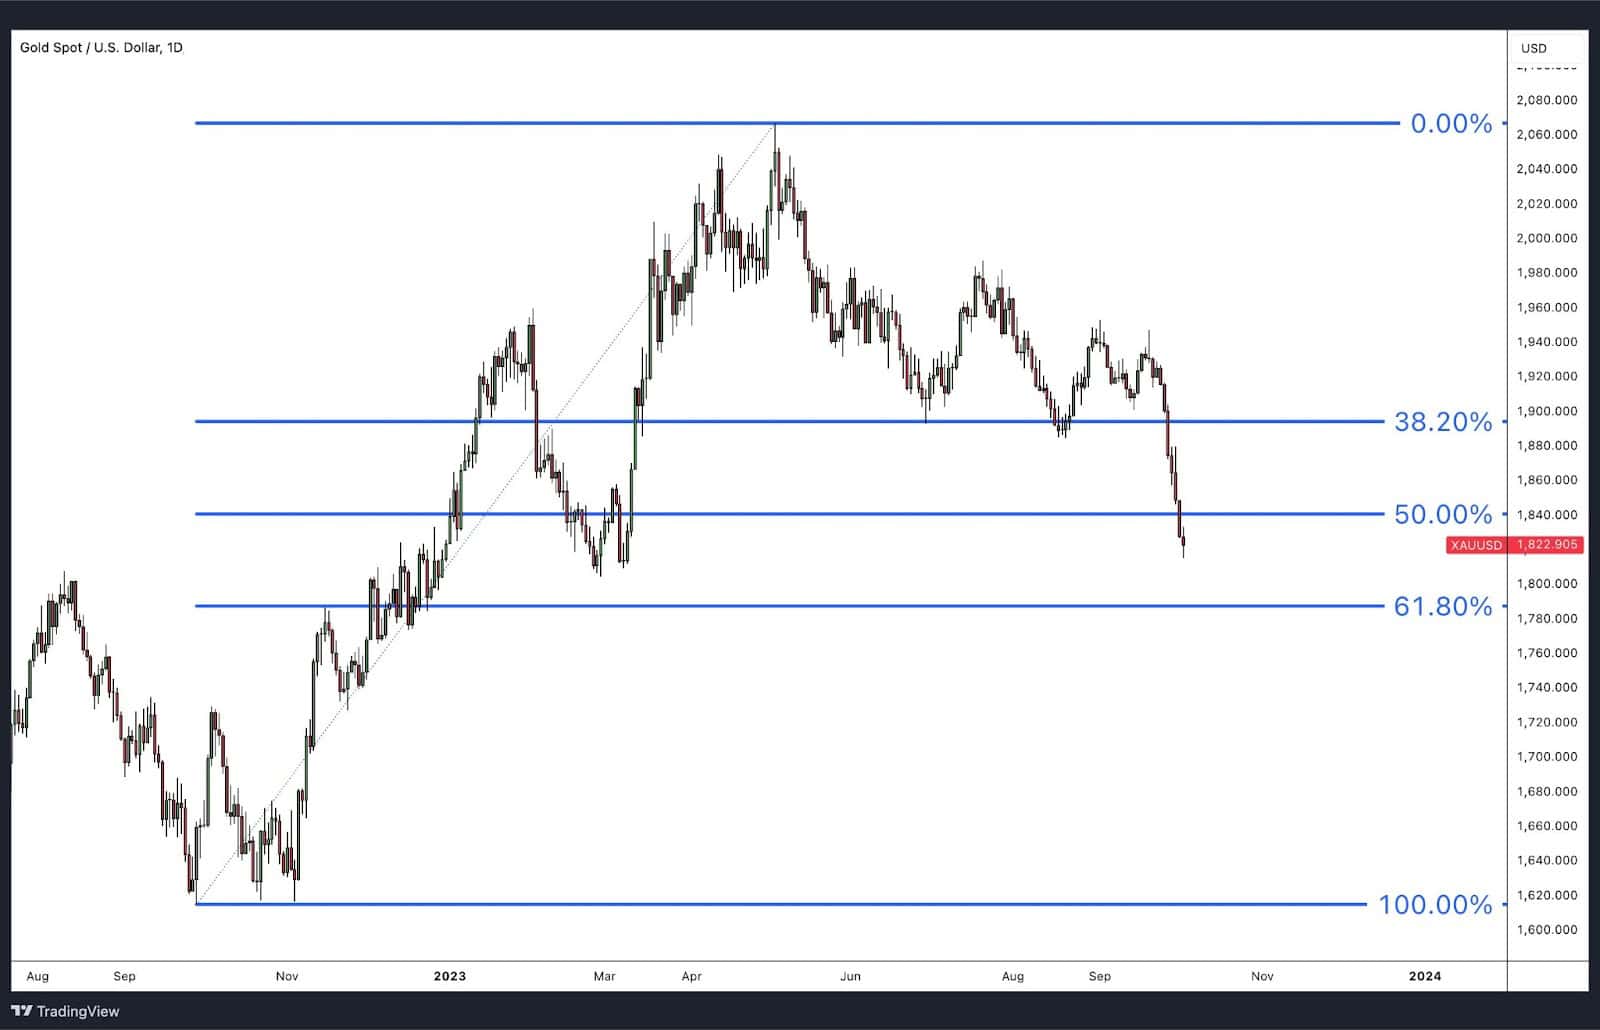
- Draw with the Fibonacci retracement tool: Using your trading platform or charting software, apply the Fibonacci retracement tool between these two points. The Fibonacci tools are generally two-click or three-click applications. The first click is at the leftmost point, then apply the second click to the point towards the right. In the example above, the low point would be the first click and the high point would be the second click.
- Activate Common Levels: The tool should automatically calculate and draw horizontal lines at common retracement levels (38.2%, 50%, and 61.8%). If those lines don’t appear, check your settings to make sure they are toggled on. Additionally, some traders like to have the 0% and 100% lines visible too. You can optionally add the 23.6% and 78.6% levels. It is suggested to toggle off any other lines the software may have added to reduce noise and confusion on the chart.
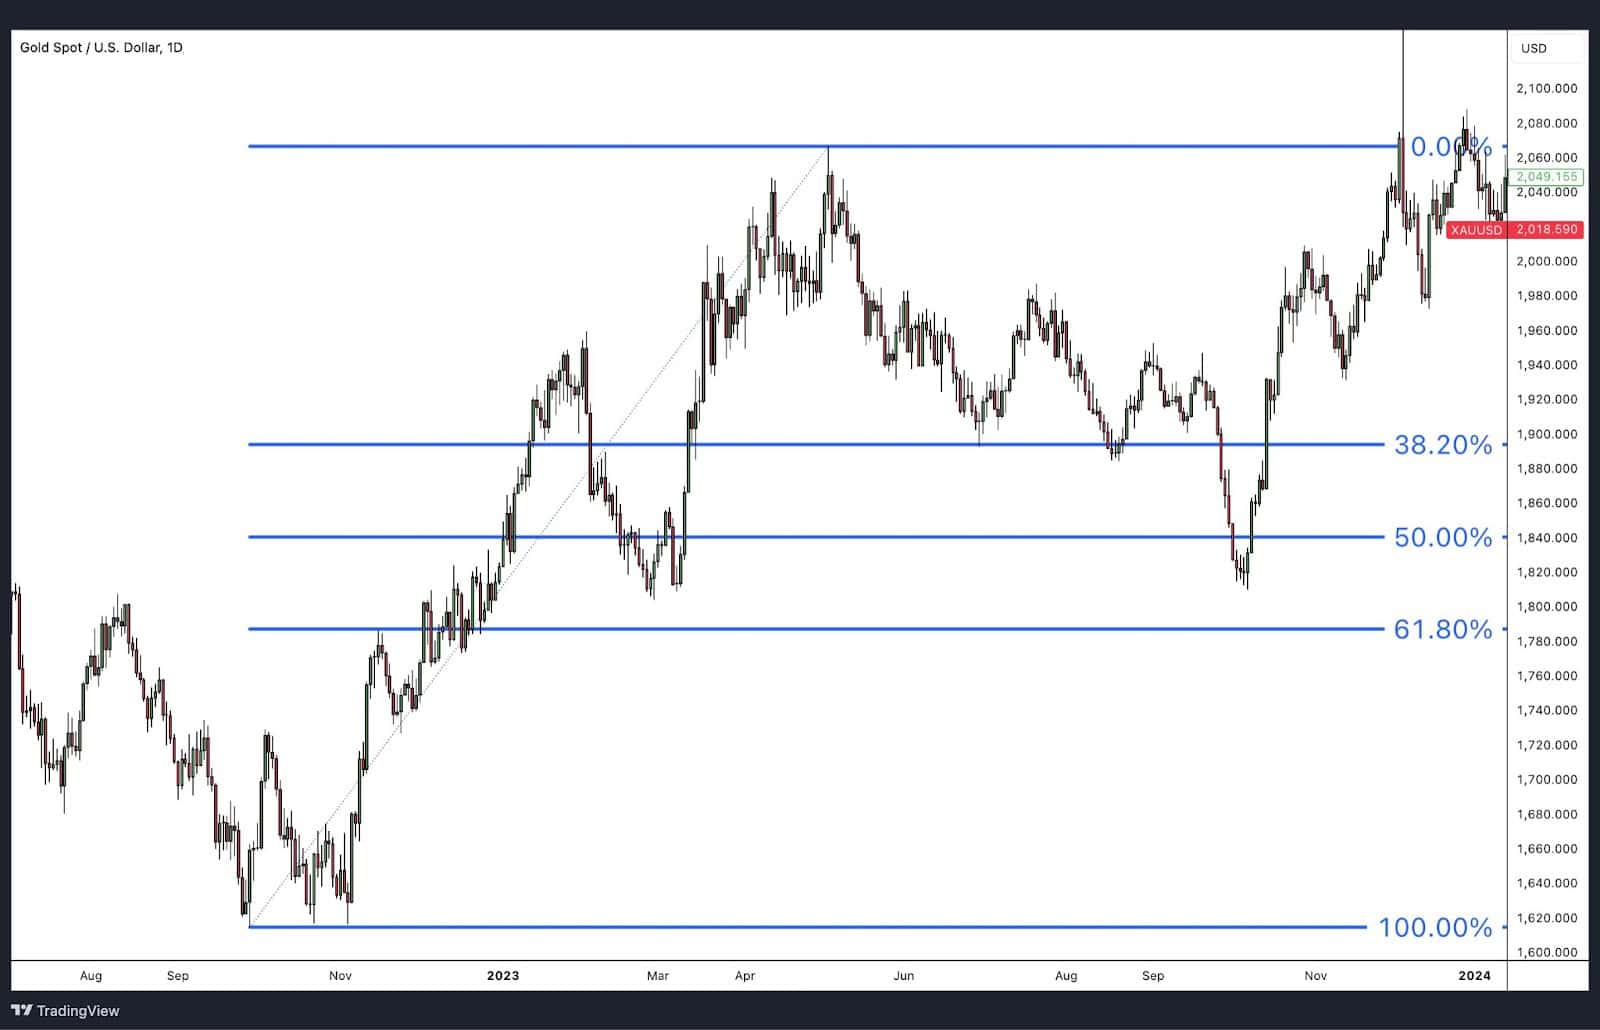
- Interpret the retracement levels: These levels highlight potential support and resistance levels where the price might pause, reverse, or consolidate. Anticipate a reversal by spotting a reversal candlestick pattern, reversal chart pattern, or oscillator reversal.
How Do You Apply Fibonacci Retracement Levels On a Chart?
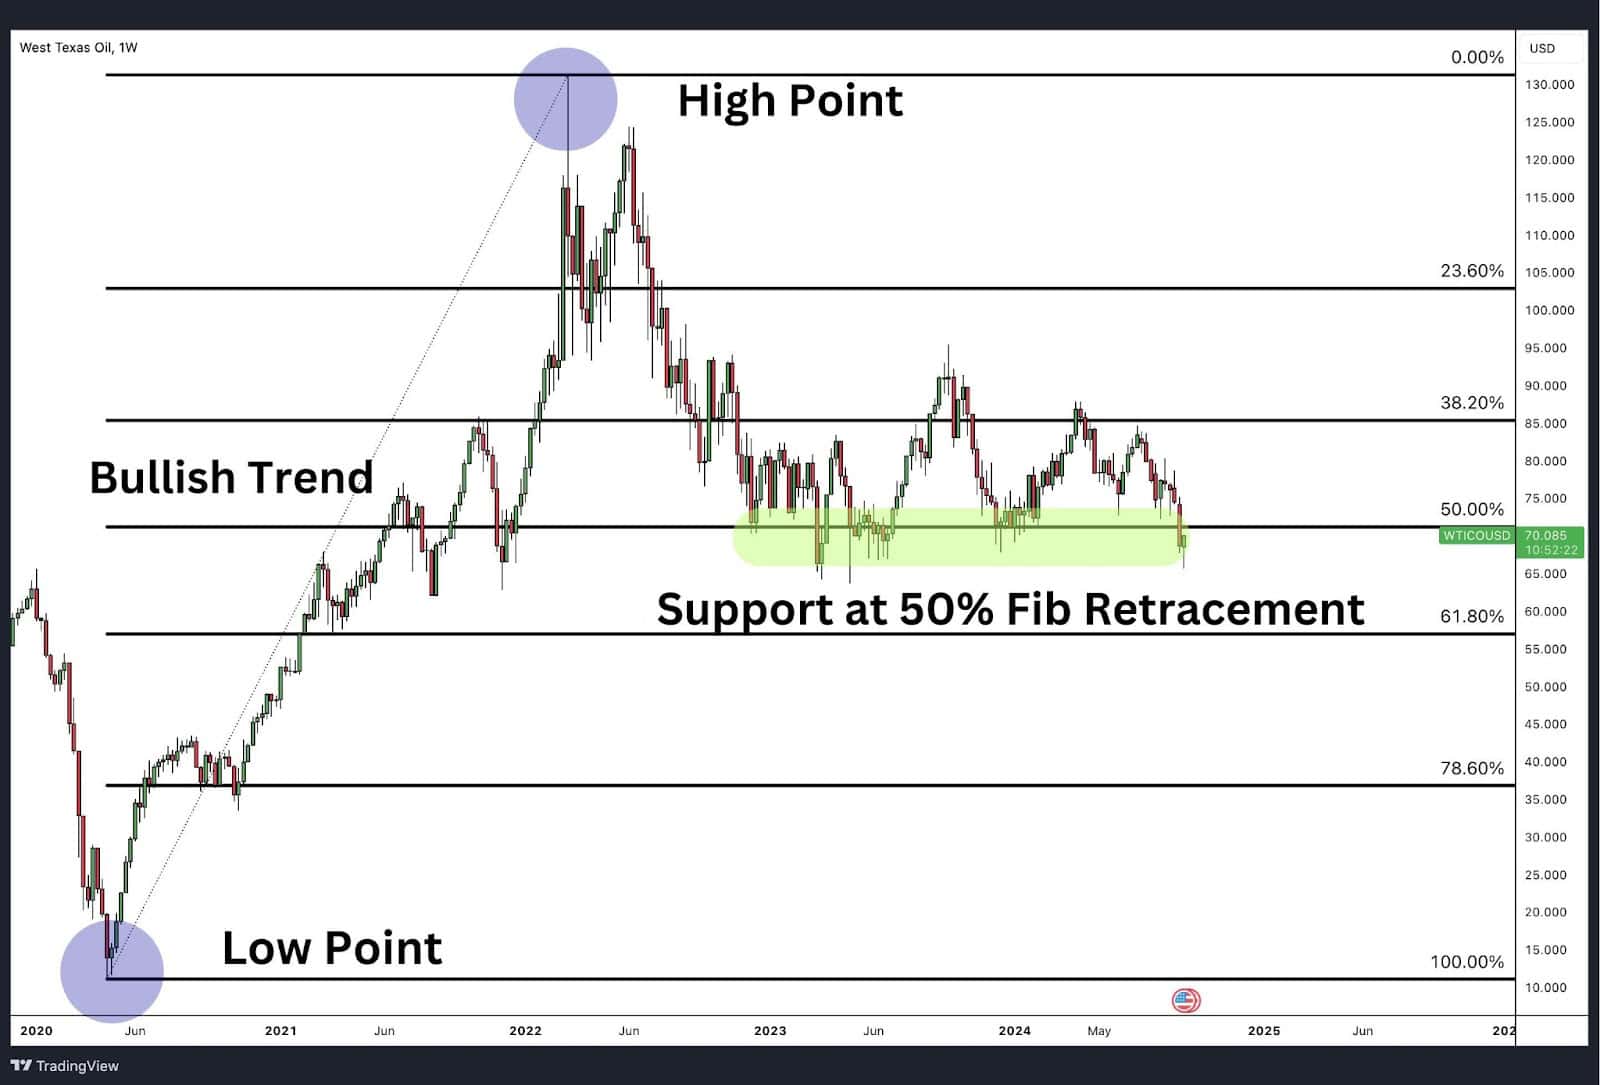
Once Fibonacci retracement levels are drawn on a chart, the horizontal lines represent zones where the price may pause, reverse, or break out. These levels—such as 38.2%, 50%, and 61.8%—are not guaranteed turning points, but they highlight areas where the market has historically shown support or resistance.
To determine whether these zones are likely to lead to a pause or reversal, traders should look for additional signals. For instance, patterns like candlestick formations (e.g., doji, engulfing patterns), or technical structures such as double bottoms or triple bottoms, can provide more confidence in whether the price will reverse or continue through the level. This helps traders avoid entering prematurely and confirms the strength of the retracement level.
In the context of Elliott Wave Theory, Fibonacci retracement levels play a crucial role in identifying where corrective waves may end. For example, Wave 2 in an impulsive wave structure often retraces between 50% and 61.8% of Wave 1, while Wave 4 typically retraces less—usually around 38.2%. This insight allows traders to align Fibonacci retracements with the larger wave structure, improving their timing and accuracy in predicting where the price might turn during a correction.
This version avoids repeating the earlier section, incorporates how retracement levels can be analysed with other indicators, and introduces their use in Elliott Wave Theory.
Fibonacci Retracement Examples
Fibonacci retracement levels are frequently used by traders to identify potential areas of support and resistance where price action may reverse or consolidate. Below are three real-world examples showcasing how Fibonacci retracement levels at 38.2%, 50%, and 61.8% play out in the markets.
1. NVIDIA Corporation (NVDA) – 38.2% Retracement Level
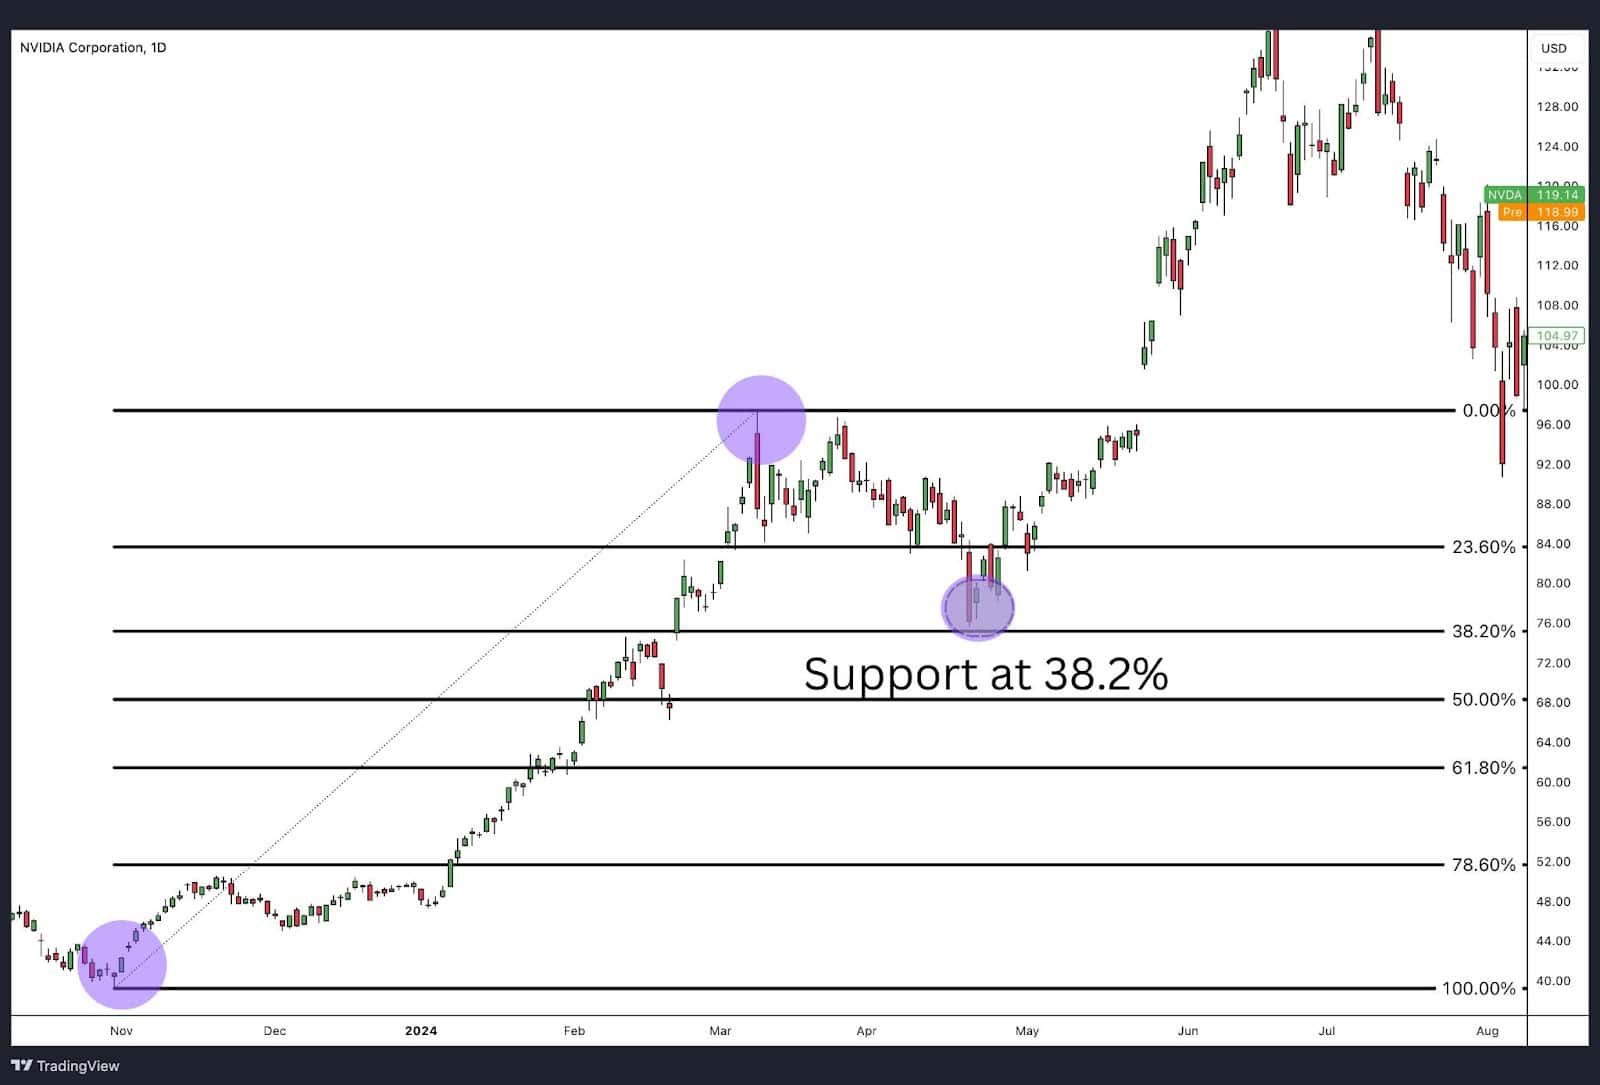
In the first example, we look at NVIDIA (NVDA), which experienced a price pullback after a significant upward trend. The 38.2% retracement level is typically seen as a shallow correction and often indicates that the trend is strong and likely to resume soon.
- Price Movement: NVDA’s price rose sharply, then began retracing to $75 at the 38.2% Fibonacci level. At this level, a bullish harami pattern formed, signalling potential reversal. Additionally, an inside bar developed, and the break above the high of the inside bar suggested the bullish trend may resume.
- Interpretation: The price met support at the 38.2% level, confirming this as a support area. This suggests the pullback was a temporary correction, and the overall trend remained intact.
- Conclusion: This shallow retracement level indicates a robust uptrend, where many technical traders see it as an opportunity to re-enter long positions.
2. USD/JPY – 50% Retracement Level

Our second example involves the USD/JPY currency pair. The 50% retracement level is widely used as a significant psychological marker where price tends to pause or reverse.
- Price Movement: The USD/JPY pair rose from 130.000 to a high of 145.000. After the rally, the price retraced and found support at the 50% Fibonacci level around 137.500
- Interpretation: This 50% level acted as a key support level for USD/JPY. Traders often use this level to determine if the trend will resume or break down further. In this case, the retracement provided a buying opportunity, with price bouncing off the level as a bullish engulfing candle formed at the 50% mark, confirming a potential trend reversal.
- Conclusion: The 50% retracement is often a neutral point where traders await further confirmation. In this scenario, the support held, giving traders the confidence to continue with the upward trend.
3. S&P 500 Index (SPX) – 61.8% Retracement Level
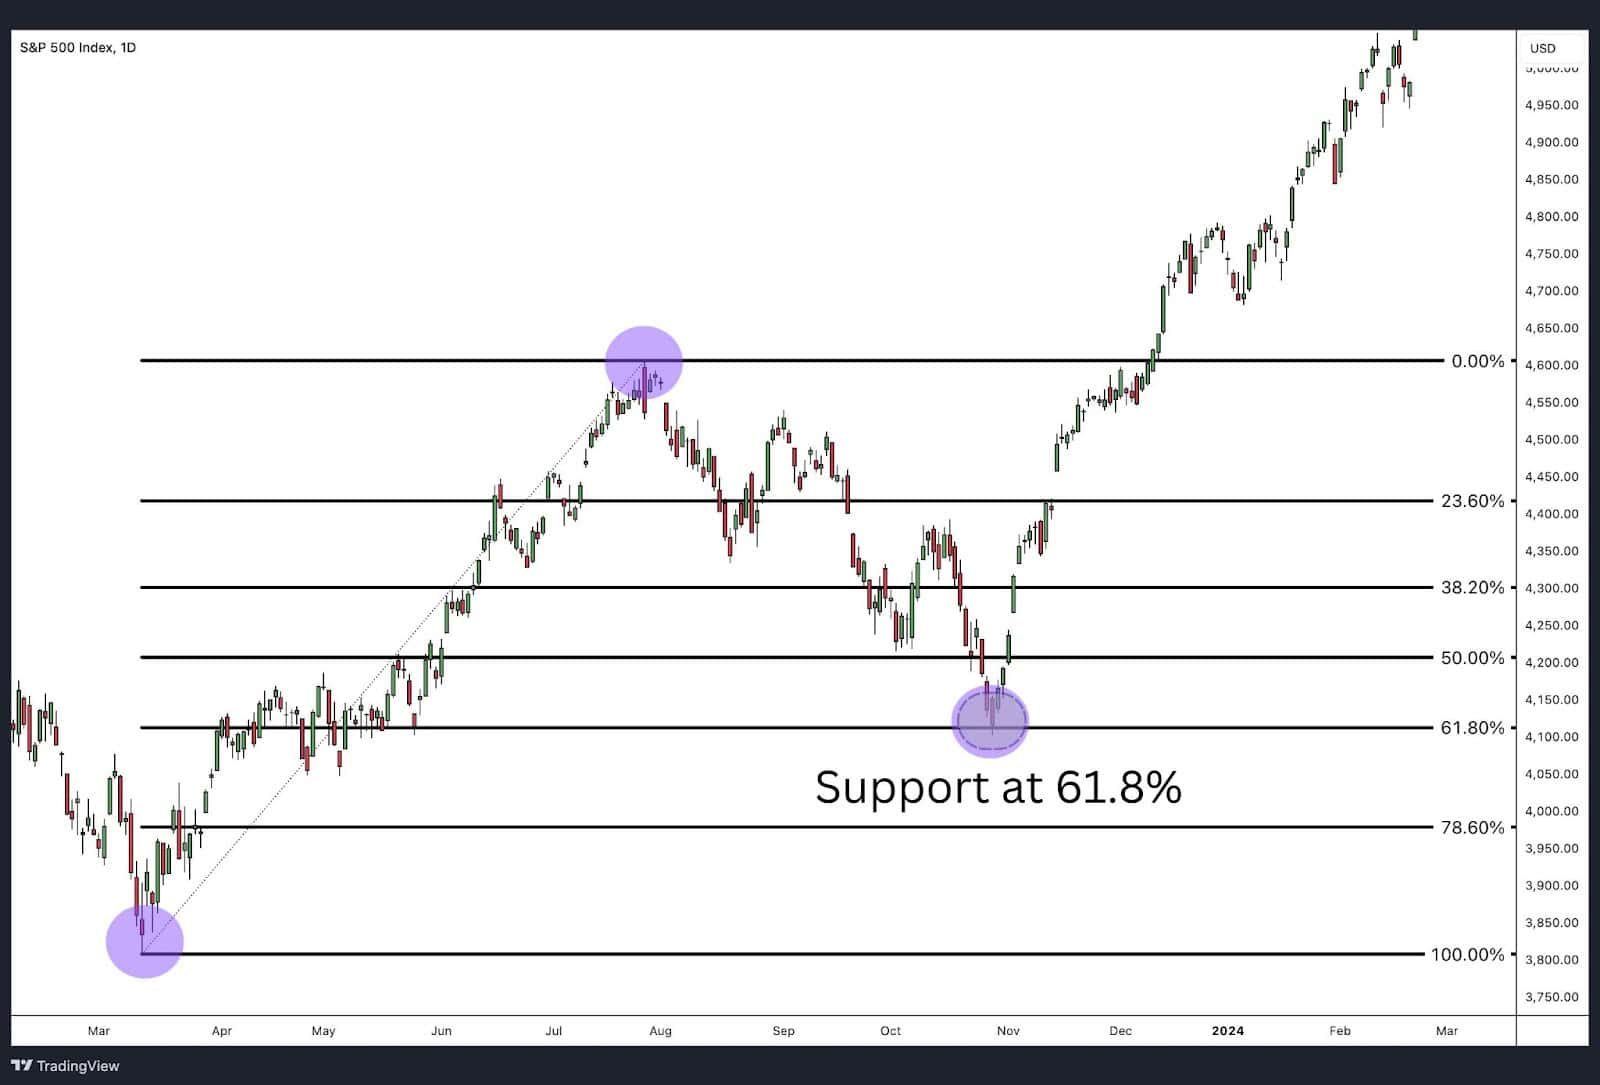
Lastly, we turn to the S&P 500 Index (SPX), which provides an example of the critical 61.8% retracement level, commonly referred to as the golden ratio. This level often signals deep corrections and is one of the most important in technical analysis.
- Price Movement: The SPX rallied from 3,800 to a high of 4,600 before experiencing a pullback. The price found strong support at the 61.8% retracement level near 4,100, where a piercing line candlestick pattern formed, suggesting a potential reversal and the resumption of the uptrend.
- Interpretation: The 61.8% level is often where the trend is truly tested. In this case, the price reversal at this level indicated a strong potential for a bullish reversal, as the S&P 500 index bounced significantly from this point.
- Conclusion: The 61.8% retracement level is viewed as a critical turning point. When prices hold at this level, it often signals the end of a correction and the resumption of the prior trend.
Fibonacci Retracement Strategies
Here are some of the most effective Fibonacci retracement strategies used in trading:
1. Trend Continuation Strategy
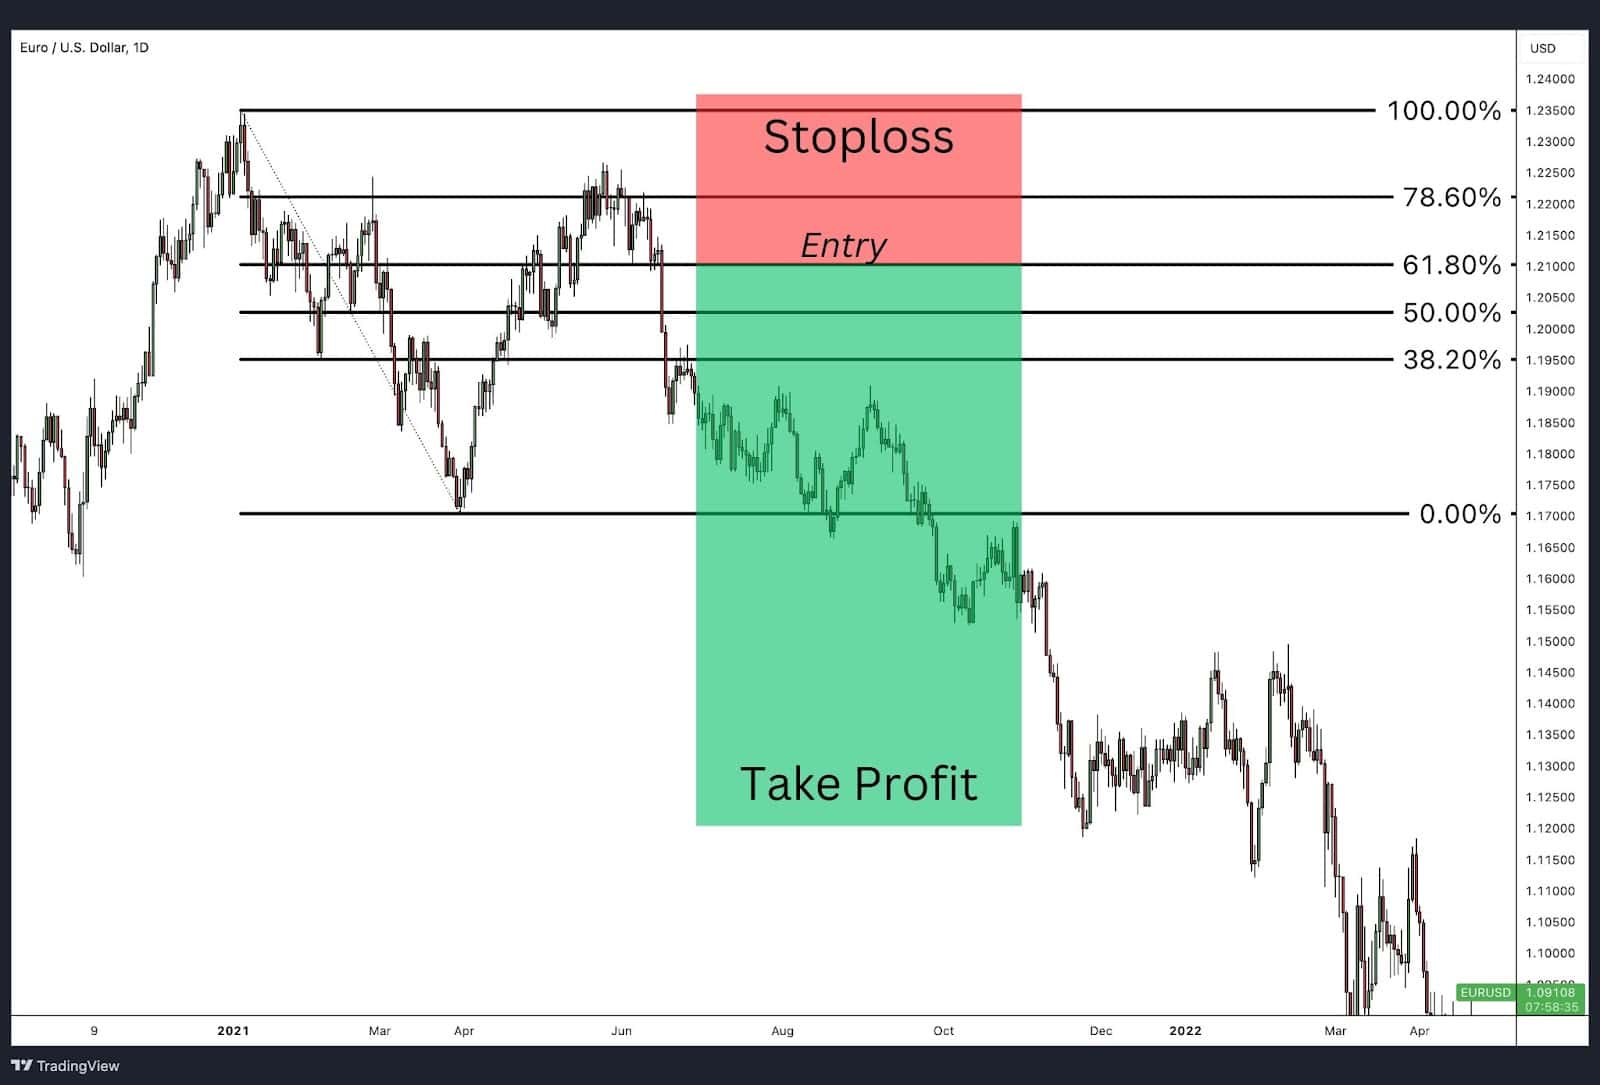
One of the most widely used strategies is to look for opportunities to enter a trade in the direction of the prevailing trend during the retracement phase. When the price retraces to a key Fibonacci level such as 61.8% in this example, traders anticipate that the near-term pullback is temporary and a pivot in the original trend may appear.
How It Works:
- In an uptrend, traders look for the price to retrace to one of these levels before entering a long position.
- In a downtrend, they wait for the price to retrace upwards to one of these levels before entering a short position.
For example, in the EUR/USD chart, the pair dropped from 1.23500 to 1.17000 and retraced back to the 61.8% Fibonacci level (around 1.21000). A trader could enter a short position here, anticipating the downtrend will resume.
Entry, Stop Loss, and Take Profit:
- Entry: Based on the 61.8% Fibonacci retracement level, which often acts as a strong resistance in a downtrend.
- Stop Loss: Placed just above the most recent high (if short) or below the most recent low (if long) to protect against a deeper retracement.
- Take Profit: The 1.272% Fibonacci extension can be used as the target for taking profit, as explained in our Fibonacci Extensions article. This strategy ensures that traders set realistic targets based on both the retracement and extension levels.
2. Combining Fibonacci with Other Indicators
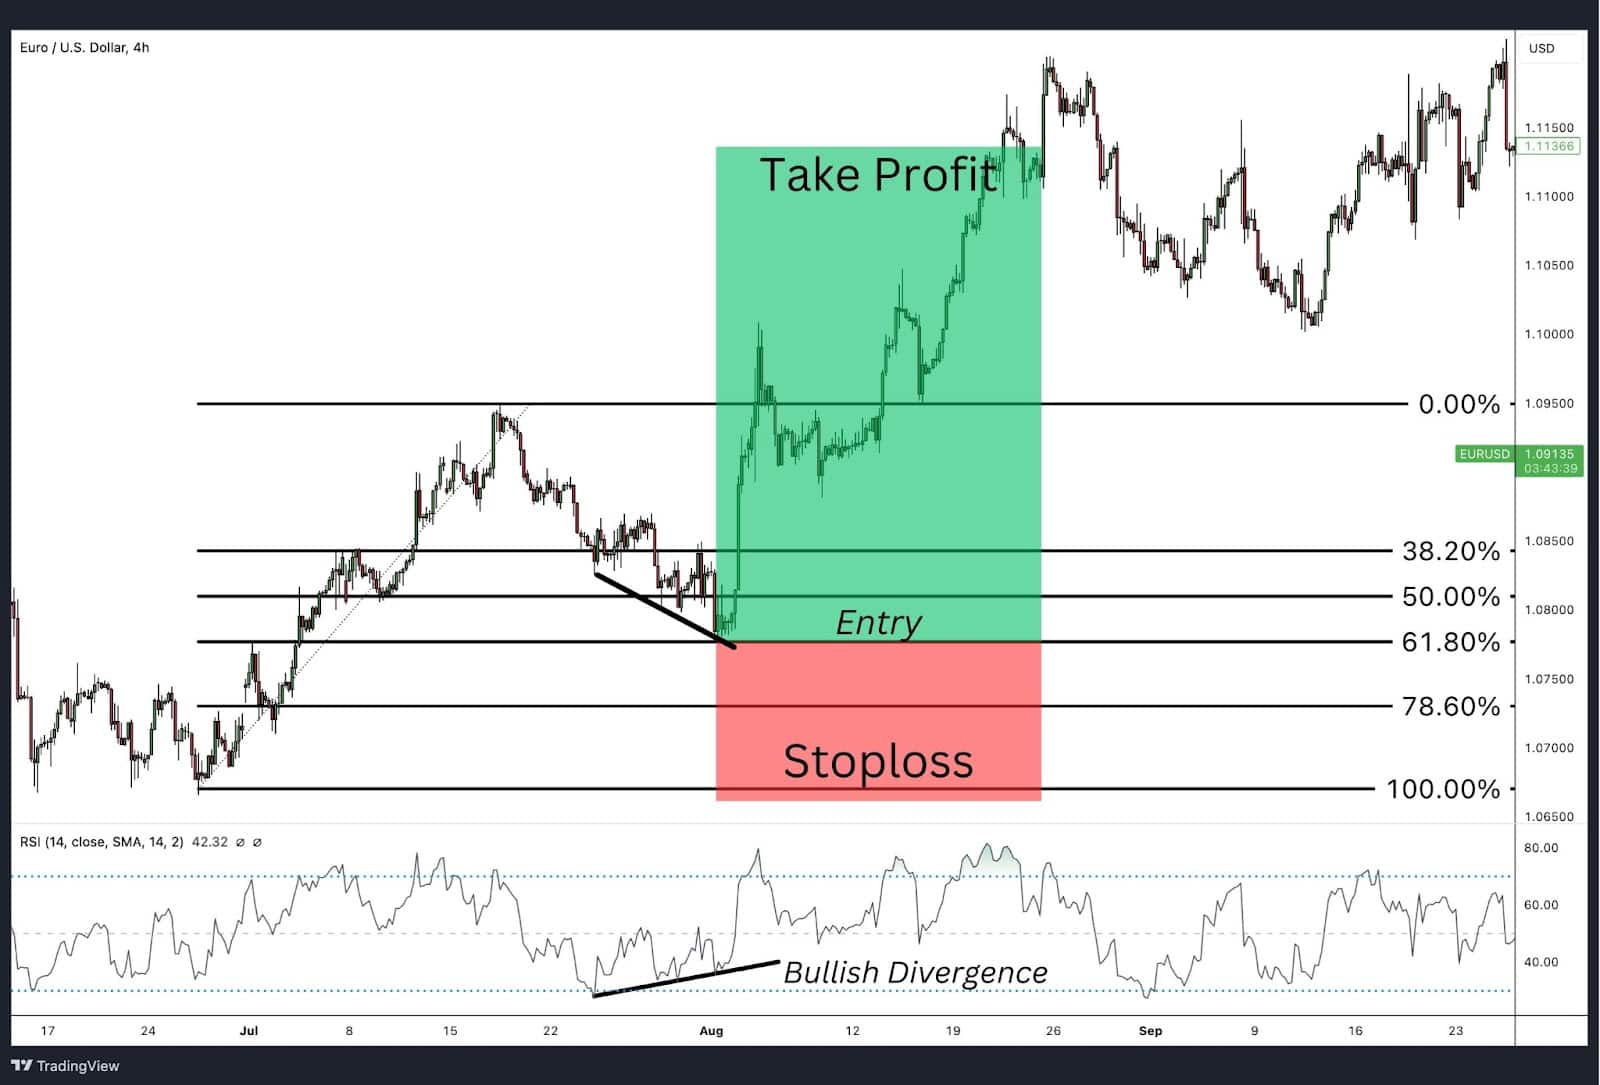
While Fibonacci retracement levels are powerful on their own, they are often combined with other technical analysis tools to improve accuracy. Traders frequently use Fibonacci retracement levels with indicators such as moving averages, RSI (Relative Strength Index), or trendlines to confirm potential reversals or continuations.
How it works:
Traders apply Fibonacci retracement levels and then look for confirmation from other indicators. For instance, if the price retraces to the 61.8% level and an RSI Bullish Divergence reading suggests that the sellers are losing strength, this can signal a strong buying opportunity. However, the discretion is up to the trader, as price can also bounce off the 50% retracement level, especially when supported by strong divergence.
Why it’s effective:
Combining Fibonacci with other indicators reduces false signals and provides more confidence in trading decisions, ensuring that traders have multiple confirmations before entering a trade.
Example:
In the EUR/USD chart, the price retraced to the 61.8% Fibonacci level. Simultaneously, a bullish divergence on the RSI formed, indicating that the sellers were losing momentum. This provided a clear buying signal, but traders could also look for a potential bounce from the 50% retracement level if there was strong divergence present as well.
3. Fibonacci and Support/Resistance Breakout Strategy

Combining Fibonacci retracement levels with key support and resistance zones provides traders with additional confirmation for potential trade setups. When a significant Fibonacci level aligns with a major support or resistance area, it increases the probability that the price will react at that level—either by bouncing off or breaking through.
In this example, we see how McDonald’s (MCD) retraced back into a resistance zone that perfectly aligned with the 78.6% Fibonacci retracement level. This confluence of factors—both the resistance level and the deep Fibonacci retracement—added more weight to the idea that the price might reject this area and continue downward. The price indeed respected this resistance, and traders could have looked to enter a short position as the price failed to break above the 78.6% level.
This strategy highlights the effectiveness of using both Fibonacci levels and support/resistance zones in tandem to identify high-probability trade setups. The alignment of these two factors gives traders more confidence that the market will respect these levels.
4. Using Fibonacci Retracements for Stop-Loss Placement

Traders often use Fibonacci retracement levels to place stop-loss orders effectively, minimising risk while maximising potential reward. By setting stop-losses just below (for long trades) or above (for short trades) key Fibonacci levels, traders protect themselves from sudden market reversals.
- How it works: After identifying the entry point using Fibonacci retracement, traders place their stop-loss just beyond the next Fibonacci level to manage risk. For example, if a trader enters at the 50% retracement level, they might place their stop-loss just below the 61.8% retracement level.
- Why it’s effective: Fibonacci-based stop-loss placement ensures that the trade has a logical risk-to-reward ratio while taking into account potential support or resistance at these key levels.
- Example: If a trader goes long at the 38.2% retracement level in an uptrend, they may place their stop-loss just below the 50% retracement to protect against a deeper pullback.
Fibonacci Retracement and Predicting Stock Prices
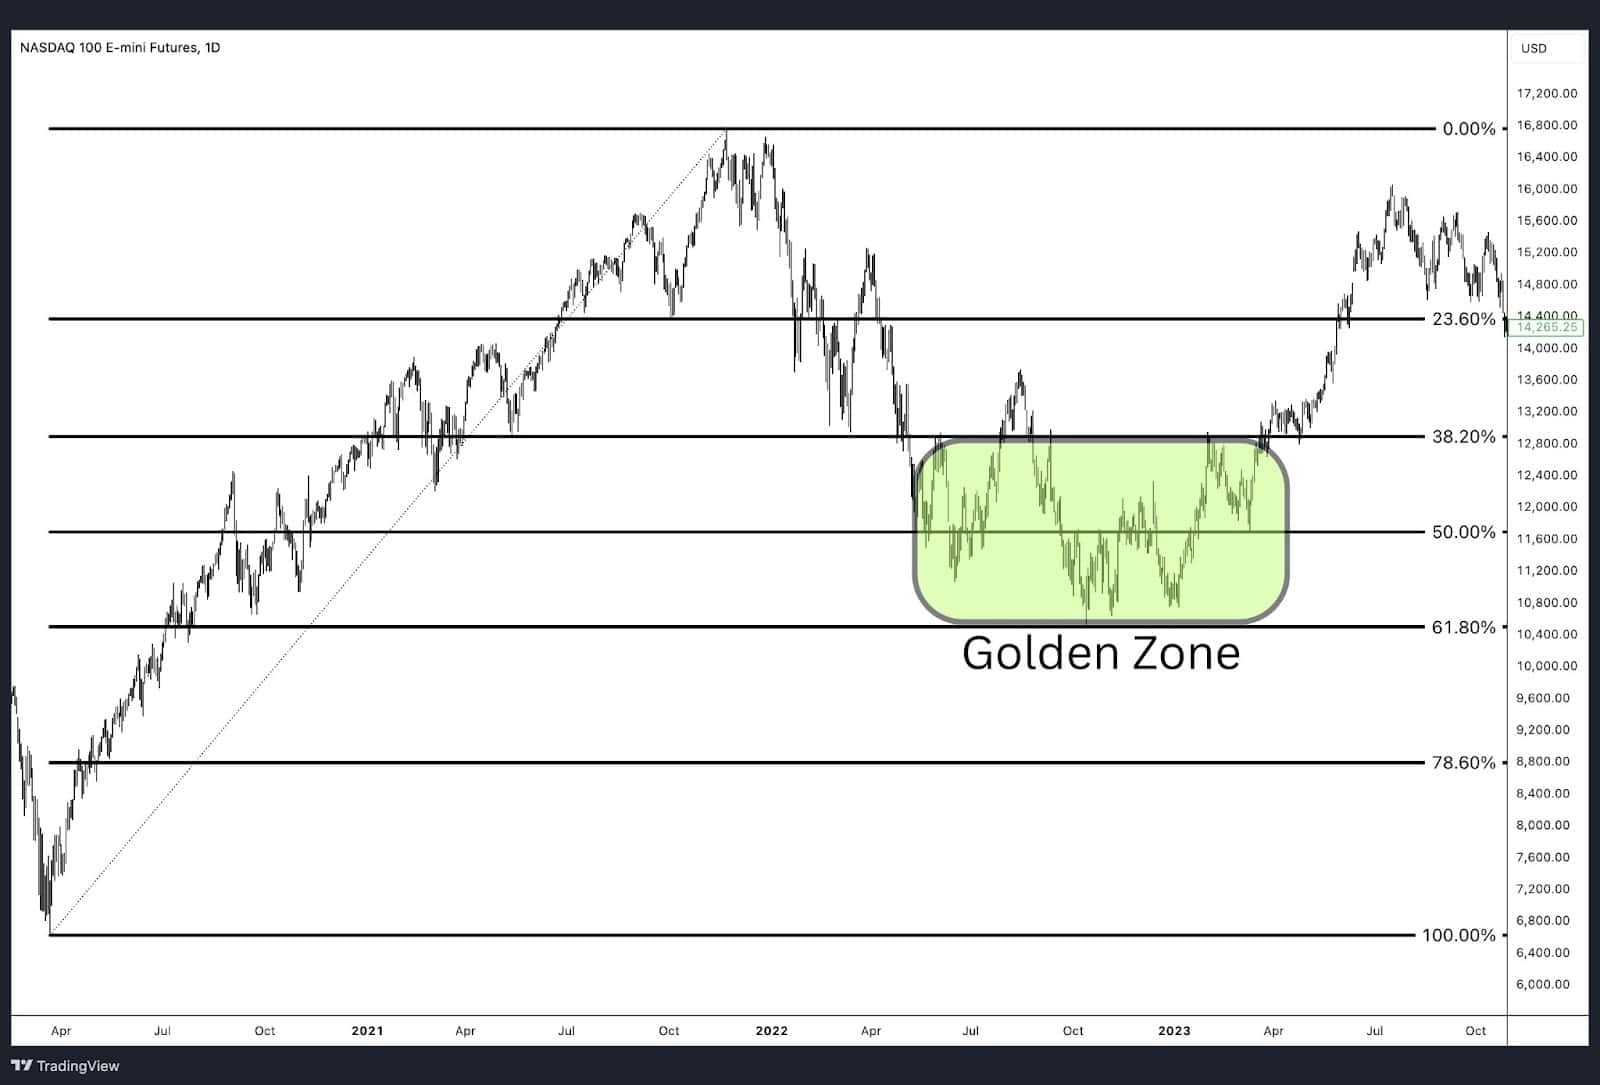
One particularly important area within Fibonacci retracement is known as the Golden Zone, which encompasses the price action between the 38.2% and 61.8% retracement levels. This range is significant because it’s where many traders expect the price to react and potentially reverse direction. When the price moves into this zone during a correction, it often represents a balanced pullback within the overall trend. Many traders watch this area closely, anticipating a potential bounce as the trend reasserts itself.
For example, in an uptrend, if the price retraces into the Golden Zone, there’s a good chance it may stabilise and begin moving higher again. Traders can use this zone by looking for signs of reversal, such as a break above resistance, reversal candlestick patterns (like a bullish engulfing), or momentum divergence, to confirm that the correction is likely ending and the original trend is resuming.
Fibonacci Moderate Retracements

Fibonacci moderate retracements refer to the retracement levels between 38.2% and 50%, where price action tends to correct without breaking the overall trend. These levels are viewed as “moderate” because they often indicate a healthy correction, rather than a full-blown reversal. When the price retraces to these levels, it typically signifies that the trend is still intact, but going through a temporary pause before continuing.
However, both partial retracements (healthy corrections) and full-blown reversals can pull back to these levels. The key difference is that during a partial retracement, the price will usually find support at these levels and resume moving in the direction of the original trend.
Key Points on Moderate Retracements:
- 38.2% retracement: A shallow pullback, often indicating that the trend is still strong and likely to continue with little interruption.
- 50% retracement: Although not a true Fibonacci level, it represents a common correction point and typically suggests indecision before the trend resumes.
To differentiate between a healthy correction and a full-blown reversal, traders should look for candlestick patterns that signal potential support or a trend continuation within the moderate retracement zone. Patterns such as bullish engulfing or hammer candlesticks provide confirmation that the price is simply correcting and not reversing.
Fibonacci Golden Retracements

Fibonacci golden retracements are focused on the 61.8% retracement level, also referred to as the golden ratio. This ratio, which appears throughout nature and geometry, plays a crucial role in technical analysis as it often represents a key level where price action may reverse or consolidate. In trading, the 61.8% retracement is seen as a critical area for spotting potential trend continuation after a significant pullback.
The Golden Zone
The Golden Zone is the area between the 50.0% and 61.8% Fibonacci retracement levels. This zone is significant because it captures the price range where the majority of healthy retracements occur. Price movements within this zone often suggest that the trend remains intact and may continue after the pullback, making it a valuable range for traders.
Why the 61.8% Golden Ratio Matters
The golden ratio is one of the more interesting numbers in mathematics. Earlier, we discussed how the 61.8% ratio is calculated using the Fibonacci number sequence. The 61.8% ratio is derived from an irrational number called phi. Phi is the only number that when added to 1 produces its inverse.
For example:
(PHI + 1) .618 + 1 = 1.618
(Inverse of PHI) 1/.618 = 1.618
Therefore, .618 and 1.618 are considered the golden ratio because each number is the inverse of the other. Not only is the golden ratio important to traders and chart reading, but the golden ratio is also found in the natural world within spirals of shells, proportions of the human body, and many more situations.
- The 61.8% retracement level is often viewed as the most critical of the Fibonacci levels, indicating where a deep correction is likely to reverse.
- This level holds psychological importance for many traders, as price frequently finds support or resistance at the golden ratio before resuming its trend.
How Traders Use the Golden Zone
- 50.0% to 61.8% zone: Traders closely watch this area because a price bounce or consolidation here suggests the broader trend is still strong.
- Reaction points: The Golden Zone is used to identify potential reversal or continuation points in both uptrends and downtrends.
This combination of the golden ratio and the Golden Zone gives traders insight into where price corrections might end, helping them better anticipate future market moves.
Why Does the Fibonacci Retracement Work?
Fibonacci retracement works due to a combination of mathematical theory and human psychology. The levels used in Fibonacci retracement are derived from the Fibonacci sequence, where the ratio between consecutive numbers forms key percentages like 38.2%, 50%, and 61.8%. These levels are applied to financial markets because they reflect patterns of order and symmetry that often appear in real-world systems, including stock prices.
Examples of Fibonacci in Natural and Financial Systems:
- Nature: Fibonacci patterns appear in nature, such as in the spirals of shells, the arrangement of leaves on a stem, and the branching of trees. These patterns create natural symmetry, which is visually pleasing and mathematically consistent. This inherent balance is mirrored in financial markets, where price movements often exhibit similar symmetry.
- Stock Markets: In financial markets, trends and retracements often follow Fibonacci levels. For instance, during a price pullback, prices tend to stabilise or reverse around the 61.8% retracement level, reflecting a similar balance seen in natural systems. Historically, prices often react at these levels due to their consistent appearance in prior market cycles.
On a deeper level, these retracement levels often reflect psychological barriers in the market. Traders, either consciously or subconsciously, tend to react around these levels. For example, when the price hits a 61.8% retracement, many traders expect a reversal due to past experiences or collective market behaviour. This creates self-fulfilling prophecies, as the belief in these levels often leads to increased buying or selling pressure around them, reinforcing their significance.
Psychological Influence and Decision-Making
From a psychological standpoint, fear and greed play significant roles in how traders interact with Fibonacci retracement levels. When the market approaches one of these retracement levels, traders often hesitate due to fear of potential losses or greed for further gains. This emotional influence leads to key decision-making moments, with many traders using Fibonacci levels as logical checkpoints for entering or exiting trades.
Additionally, the structure of Fibonacci retracement gives traders a more orderly view of price movements, helping them rationalise where the price might stabilise or reverse. This structured, almost scientific approach helps reduce the uncertainty that comes with chaotic market behaviour.
In summary, Fibonacci retracement works because it blends natural mathematical patterns with human psychology, making it a popular tool in technical analysis for predicting potential price changes. This combination of natural symmetry and market psychology is why these retracement levels often act as key support or resistance points
Advantages of Using Fibonacci Retracement Levels
Fibonacci retracement levels offer several benefits to traders by providing key insights into potential price movements during market corrections. Here are some of the main advantages:
- Works in Multiple Markets: Fibonacci retracement can be applied across various financial markets, including stocks, commodities, forex, and crypto. This makes it a versatile tool for both short-term traders and long-term investors.
- Helps Identify Critical Levels: The tool helps traders highlight important levels where price movements could slow down, reverse, or consolidate. These levels help traders make more informed decisions about entry and exit points.
- Psychological Significance: As these retracement levels are widely used, many traders tend to follow them, creating a sort of self-fulfilling prophecy where price reacts around these levels, further validating their usefulness.
Disadvantages of Using Fibonacci Retracement Levels
Despite its popularity, Fibonacci retracement has some limitations, and traders should be aware of potential drawbacks when relying on it:
- No Guarantee of Accuracy: Fibonacci retracement levels are not always accurate predictors of future price movements. Price doesn’t always respect these levels, and relying on them without considering other factors like market sentiment or external events can lead to inaccurate predictions.
- Subjectivity in Application: The effectiveness of Fibonacci retracement depends on correctly identifying the high and low points of a trend. Different traders may draw Fibonacci levels from slightly different points, leading to varied interpretations and results.
- Requires Complementary Tools: On its own, Fibonacci retracement may not provide enough information to make sound trading decisions.
In conclusion, while Fibonacci retracement levels are valuable for identifying potential price reactions, they should not be used in isolation. Traders should combine them with other tools and maintain awareness of broader market factors to improve their decision-making.
Fibonacci Retracements with Elliott Wave Principle

The Elliott Wave Principle is a technical analysis method that suggests market movements follow natural patterns, consisting of five impulse waves (trending in the direction of the market) and three corrective waves (moving against the market’s direction). Within this framework, Fibonacci retracement levels are crucial for predicting how far a price will retrace during corrective waves.
In Elliott Wave Theory, the market experiences two main corrective phases during an impulse trend—Wave 2 and Wave 4. These corrections are where Fibonacci retracement levels are often applied to predict how far each wave might pull back before the trend resumes.
Wave 2: Deep Correction

Wave 2 typically represents a deep correction in the early stages of a trend. It often retraces anywhere from 50% to 78.6% of Wave 1’s movement, although in some cases, it can retrace up to 99%, as long as it doesn’t breach the origin of Wave 1.
The common Fibonacci retracement levels for Wave 2 are:
- 50%
- 61.8% (golden ratio)
- 78.6%
Since Wave 2 occurs early in the trend, it’s considered a weak trend. At this stage, traders are still uncertain about the market direction, which is why the retracement tends to be deeper, reflecting the weaker conviction.
Wave 4: Shallow Correction
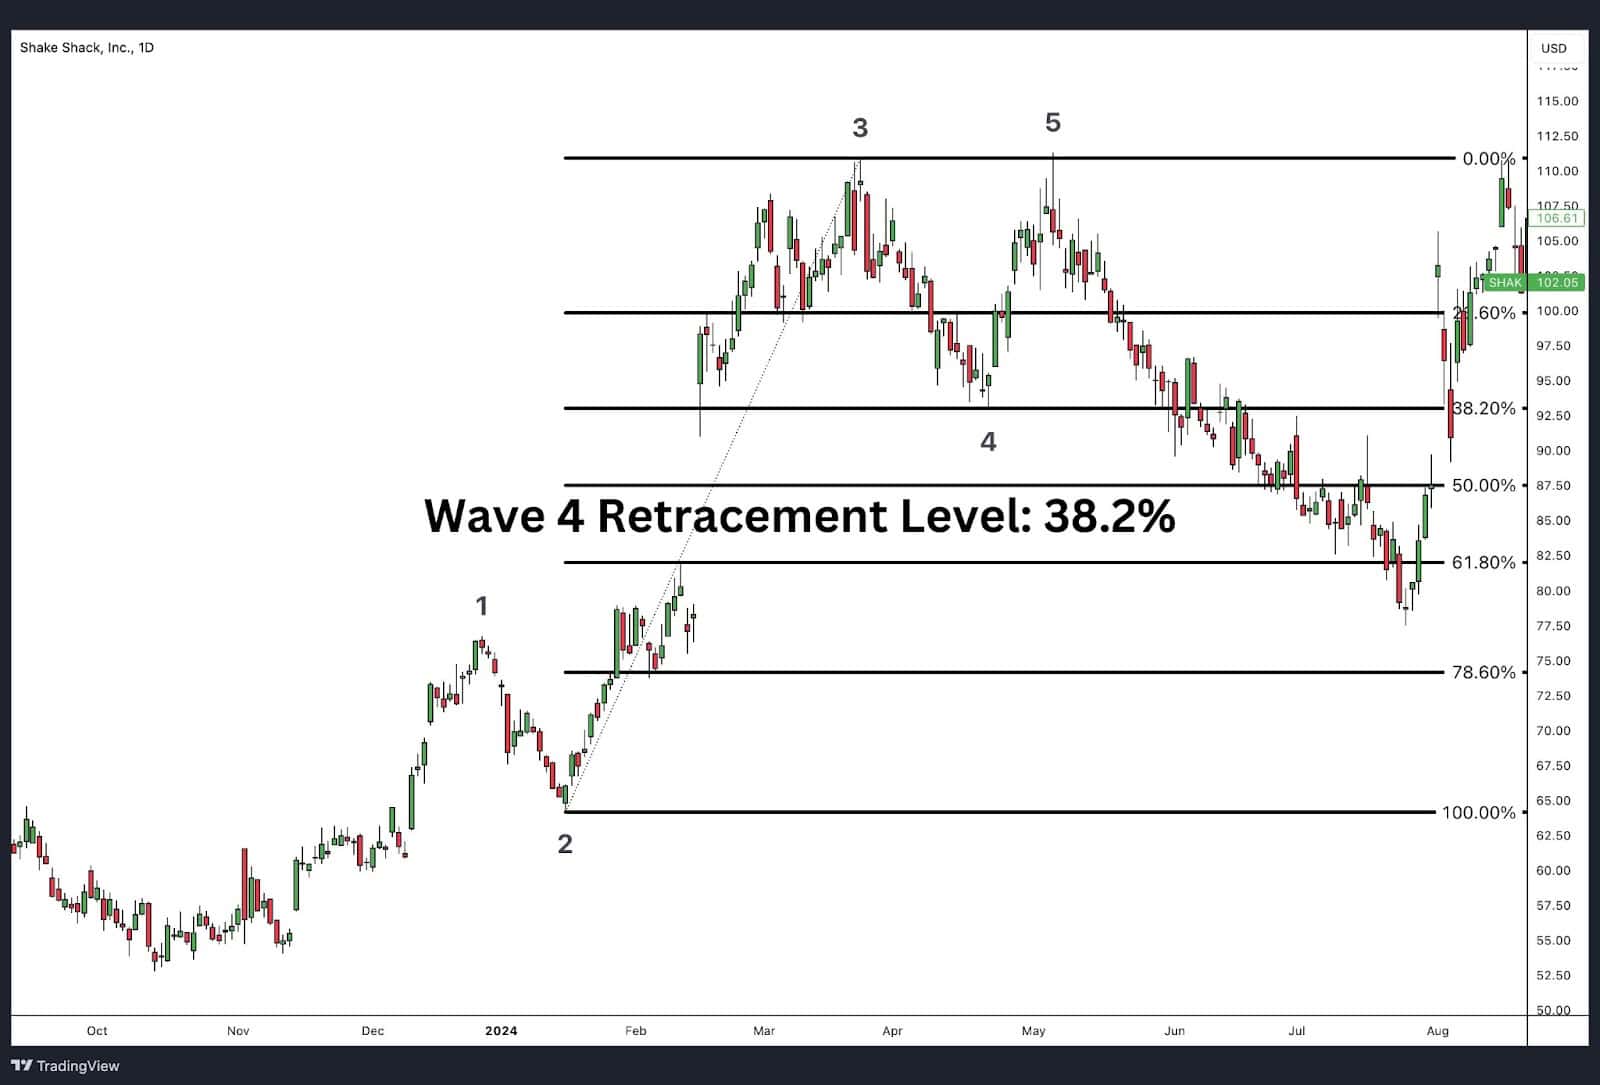
Wave 4 occurs after wave 3 has completed, meaning the trend is now more mature and established. As a result, wave 4 typically corrects less of a percentage than wave 2, often retracing 38.2% of wave 3. This is considered a shallow correction.
The common Fibonacci retracement levels for wave 4 are:
- 38.2%
- Wave 4 can occasionally retraces deeper, but it must not overlap the price territory of Wave 1.
At this point, the trend is strong and well-established, so the retracement in Wave 4 tends to be more moderate. Since traders are more confident in the ongoing trend, the percentage price correction tends to be shallower when compared to wave 2.
Fibonacci Retracement Levels in Elliott Wave
Wave 2 deep corrections typically align with Fibonacci retracements like 50%, 61.8%, or 78.6%. On the other hand, wave 4 shallow corrections often respect the 38.2% retracement and, in some cases, can retrace slightly more, but it must not enter wave 1’s territory.
Fibonacci Retracements with Dow theory
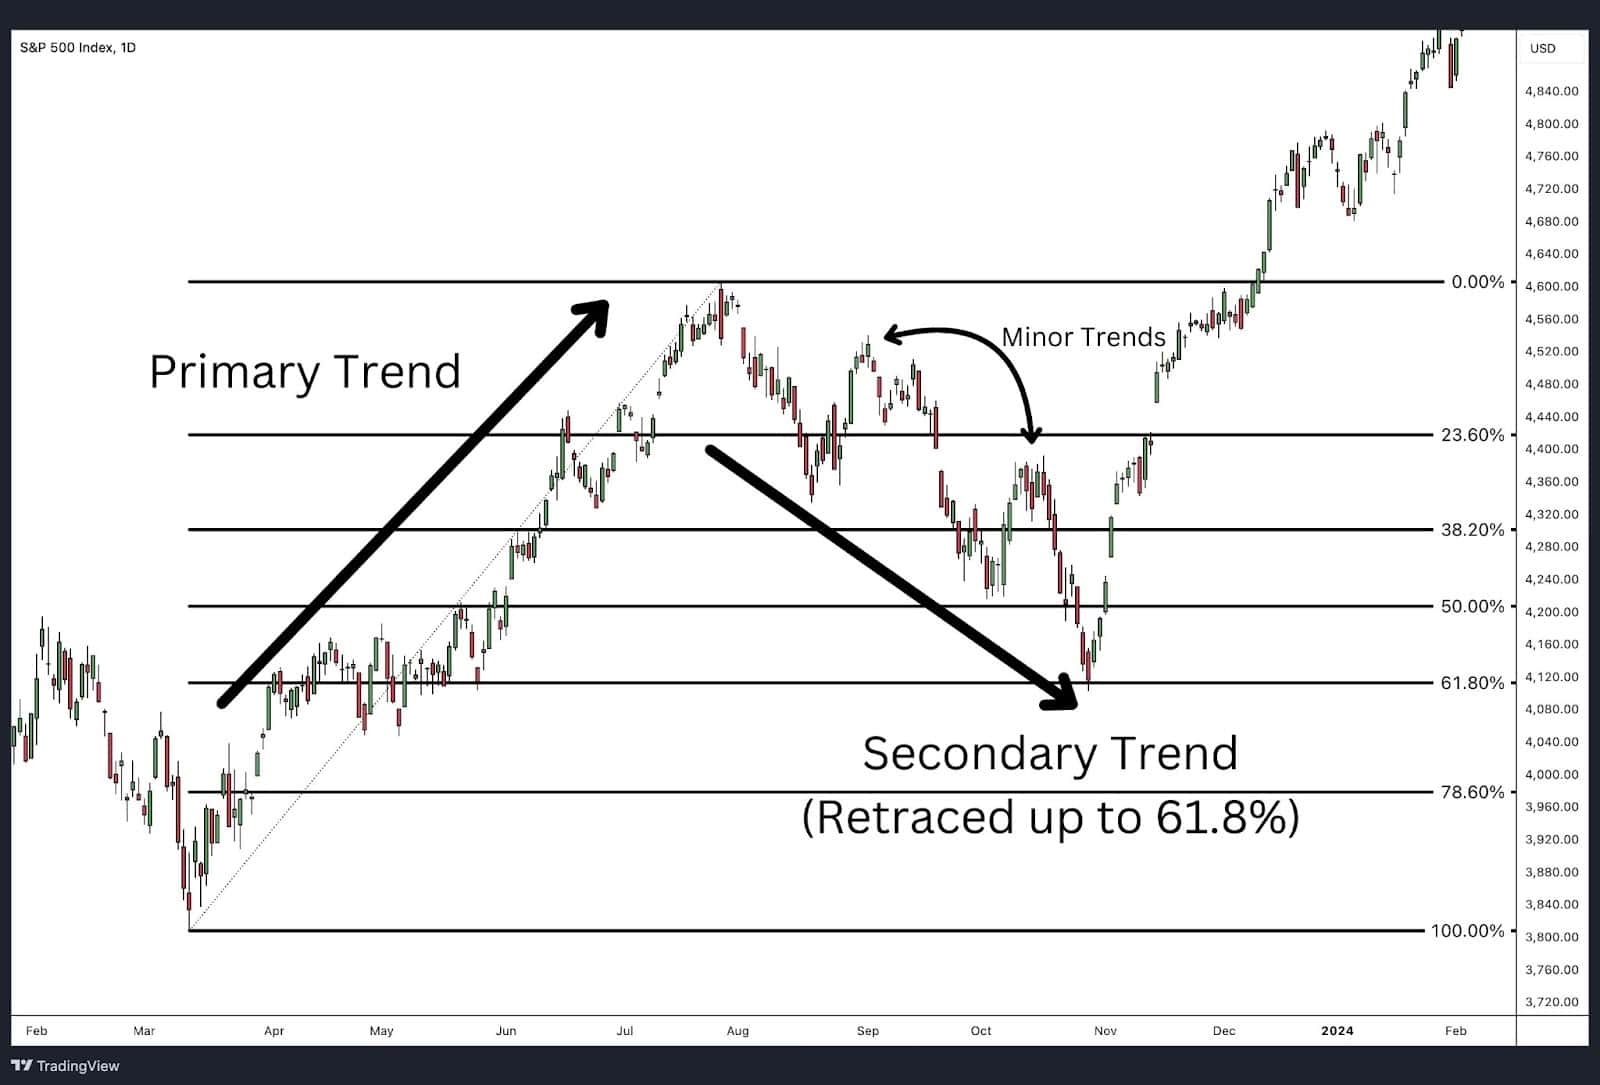
Both Fibonacci retracements and Dow Theory are widely respected tools in technical analysis, each offering unique insights into market behaviour. When combined, these tools can provide a powerful framework for understanding trends, corrections, and potential price movements.
Dow Theory Overview
Dow Theory is based on the principles laid out by Charles Dow, the founder of the Wall Street Journal and co-creator of the Dow Jones Industrial Average. According to Dow Theory, markets move in three primary phases:
- Primary trend: A long-term trend, either upward (bull market) or downward (bear market).
- Secondary trend: A correction or pullback within the primary trend. This is often where Fibonacci retracements come into play.
- Minor trend: Short-term fluctuations within the secondary trend, generally lasting from days to weeks.
How Fibonacci Retracements Align with Dow Theory
Dow Theory asserts that market corrections—secondary trends—are natural and necessary pauses within the overall primary trend. These corrections can retrace a portion of the prior movement before the major trend resumes. This is where Fibonacci retracement levels help identify how deep the secondary trend may go.
Traders often use Fibonacci retracement levels, such as 38.2%, 50%, and 61.8%, to estimate how much of the primary trend will be retraced during the secondary trend.
For instance:
- In an upward primary trend, after a significant rally, the market may enter a secondary trend (pullback), often retracing to a Fibonacci level like 38.2% or 50%. This retracement provides traders with insights into when the market might resume its upward trajectory.
- In a downward primary trend, a corrective bounce may also retrace to a Fibonacci level, helping traders spot where the price might start falling again.
3 Key Applications of Fibonacci Retracements in Dow Theory
There are 3 key uses of the Fibonacci retracement tool within Dow Theory.
- Identifying Secondary Trends: According to Dow Theory, corrections in the primary trend are expected. Fibonacci retracement levels help predict where these corrections may end, offering traders potential entry points into the primary trend.
- Measuring Market Strength: If a secondary trend retraces deeply, close to the 61.8% Fibonacci level, it might signal a more substantial correction and a temporary weakening of the primary trend. A shallower retracement, around 38.2%, may suggest a strong primary trend with only minor interruptions.
- Using Confirmation: Dow Theory emphasises confirmation between indices. If multiple indices (e.g., DJIA and DJTA) retrace to similar Fibonacci levels, it reinforces the idea that the market correction may be nearing completion.
How Can Fibonacci Retracements Be Combined With Other Indicators?
Fibonacci retracements can be combined with various technical indicators to improve the accuracy of predictions and trading decisions. By pairing Fibonacci levels with other tools, traders can gain deeper insights into market conditions.
- Moving Averages: Use Fibonacci retracements to identify potential reversal points, and confirm trend direction with moving averages (e.g., 50-day or 200-day).
- MACD: Check momentum by combining Fibonacci levels with the MACD to see if momentum is aligning with a retracement level.
- RSI (Relative Strength Index): Use Fibonacci retracement levels with RSI to confirm overbought or oversold conditions, enhancing reversal predictions.
- Bollinger Bands: Fibonacci levels can work with Bollinger Bands to spot potential reversals when price touches both a Fibonacci level and the outer band.
This combination allows for a more nuanced approach, helping traders validate signals and make more informed decisions
Fibonacci Retracements with Bollinger Bands
Combining Fibonacci retracements with Bollinger Bands® offers traders a powerful method to analyse price movements and identify potential trend reversals or continuations. Both tools are widely used in technical analysis, but they measure different aspects of market behaviour. When used together, they can provide more precise insights into support and resistance levels, volatility, and trend strength.
How Fibonacci Retracements Complement Bollinger Bands
- Identifying Reversals: When a price retraces to a Fibonacci level (such as 38.2%, 50%, or 61.8%) and simultaneously approaches or touches a Bollinger Band, it provides a stronger signal that the price might reverse or bounce.
- Confirming Volatility: Bollinger Bands expand during volatile periods and contract during consolidation phases. When a price retraces to a Fibonacci level during a Bollinger Band contraction, it often signals an upcoming breakout in the direction of the retracement.
- Dynamic vs. Static Levels: Fibonacci retracement levels are static, meaning they stay fixed once plotted. In contrast, Bollinger Bands are dynamic, adjusting with price volatility. Combining the two gives traders both fixed retracement points and flexible volatility zones, offering more context for interpreting price movements.
Key Strategies Using Fibonacci Retracements with Bollinger Bands
- Confluence of Signals:
- If a stock is retracing to a key Fibonacci level like 61.8% while also hitting the lower Bollinger Band, it suggests the price might find support and potentially reverse upward.
- Breakout Predictions:
- When a retracement occurs during a Bollinger Band squeeze (when the bands contract), it could signal an imminent breakout. A retracement to the 61.8% level, for example, can suggest the price will break out in the direction of the original trend once the consolidation ends.
- Trend Continuation and Exhaustion:
- If the price is trending within the bands, it indicates that the trend is likely to continue.
Example of Use
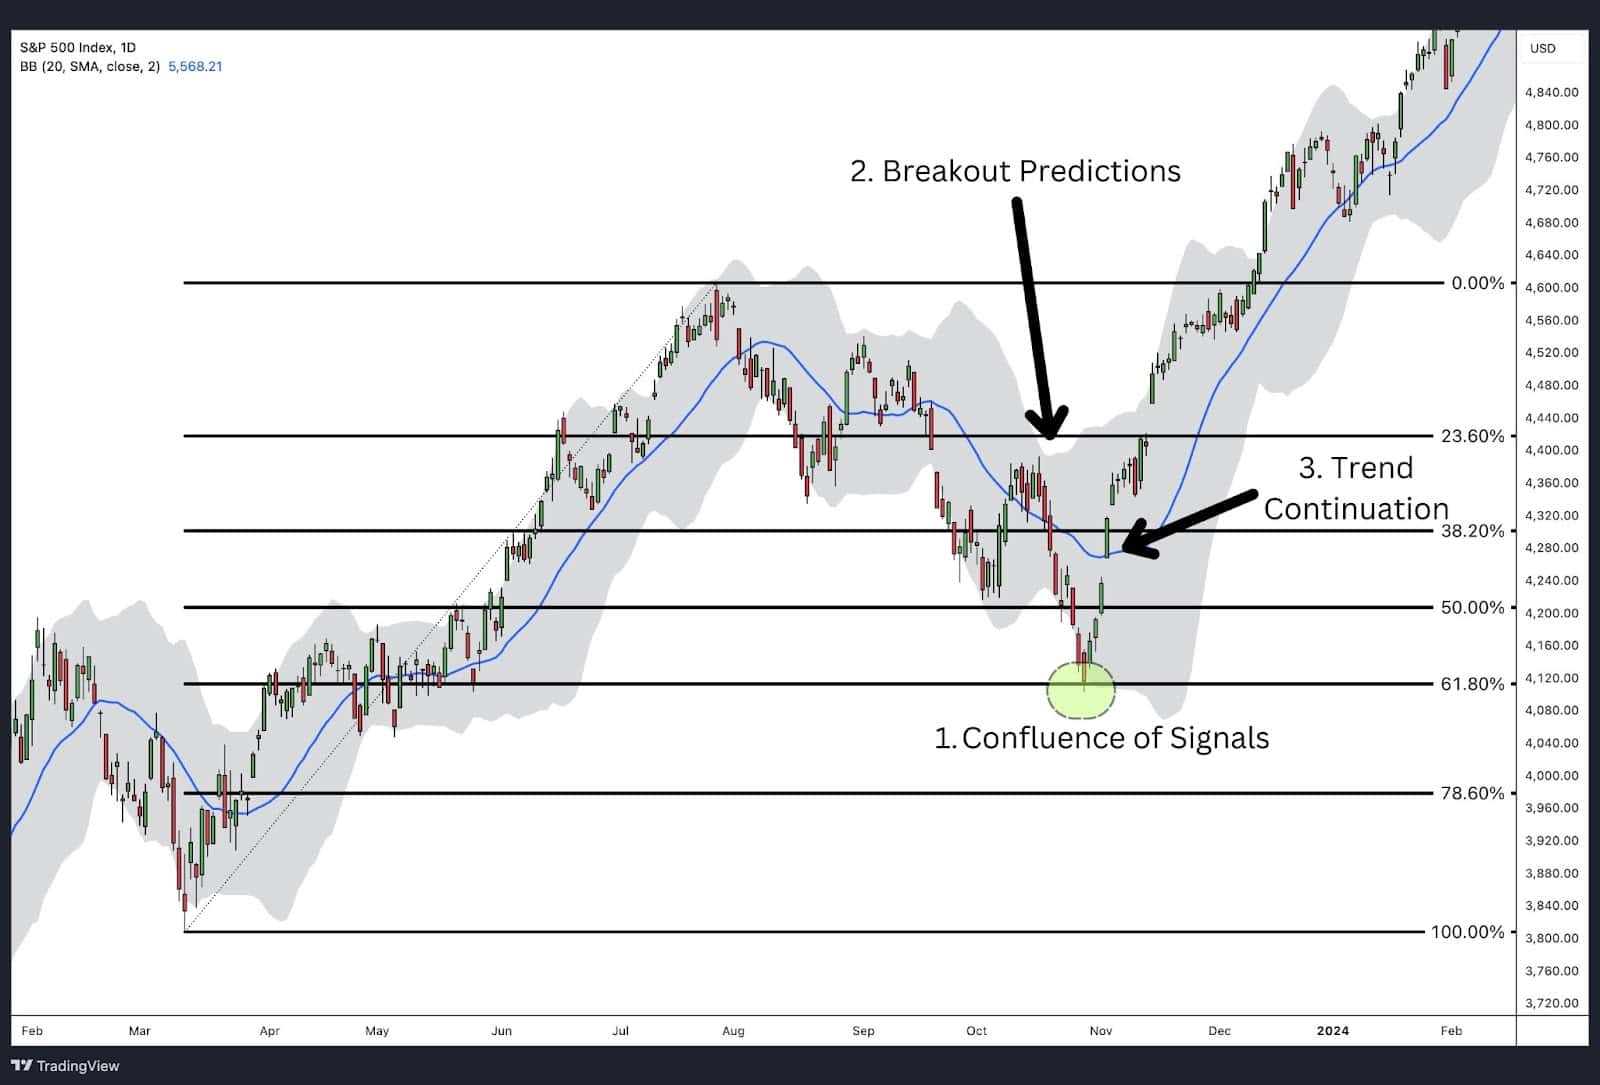
In an upward trend, if the price pulls back to the 61.8% Fibonacci retracement level and is close to touching the lower Bollinger Band, this confluence of indicators could be seen as a strong signal for a bullish reversal. Traders might anticipate that the retracement is nearing its end and that the trend will soon resume upward.
Fibonacci Retracements With MACD
Combining Fibonacci retracement levels with the MACD (Moving Average Convergence Divergence) indicator creates a robust tool for understanding market corrections, trend strength, and potential reversals. While Fibonacci retracement levels identify key price zones where the market might reverse or stall, the MACD helps confirm the market’s momentum, showing whether the trend is gaining or losing strength.
How Fibonacci Retracements Work with MACD
When used together, Fibonacci retracements and MACD help traders identify both potential retracement levels and the underlying momentum that may support or contradict those retracements.
- Confirming Retracement Reversals:
- When the price retraces to a key Fibonacci level (such as 38.2%, 50%, or 61.8%), traders look to the MACD to confirm whether the momentum supports a reversal.
- For example, if the price pulls back to the 61.8% retracement level within an uptrend and the MACD shows a bullish crossover (MACD line crossing above the signal line), it suggests that momentum is building for the price to bounce and continue its bullish trend.
- Identifying Trend Weakness:
- Conversely, if the price is retracing to a Fibonacci level but the MACD shows a bullish divergence (price making lower lows while MACD makes lower highs), it signals weakening momentum. This might suggest that the price will fail to break through that level, indicating a potential reversal.
- Spotting Trend Continuation:
- When the price retraces to a Fibonacci level and the MACD histogram shows increasing bars, this signals that the momentum is picking up, suggesting a continuation of the overall trend after the retracement completes.
Key Strategies for Using Fibonacci Retracements with MACD
- Bullish Reversal: If the price retraces to the 38.2% to 61.8% Fibonacci level and the MACD line crosses above the signal line, this is a strong sign that the pullback is complete, and the price may continue its upward movement.
- Bearish Reversal: In a downtrend, when the price retraces to a 38.2% or 50% level, if the MACD is showing a bearish crossover (MACD line crossing below the signal line), this signals that the retracement may fail, and the price is likely to fall again.
Example
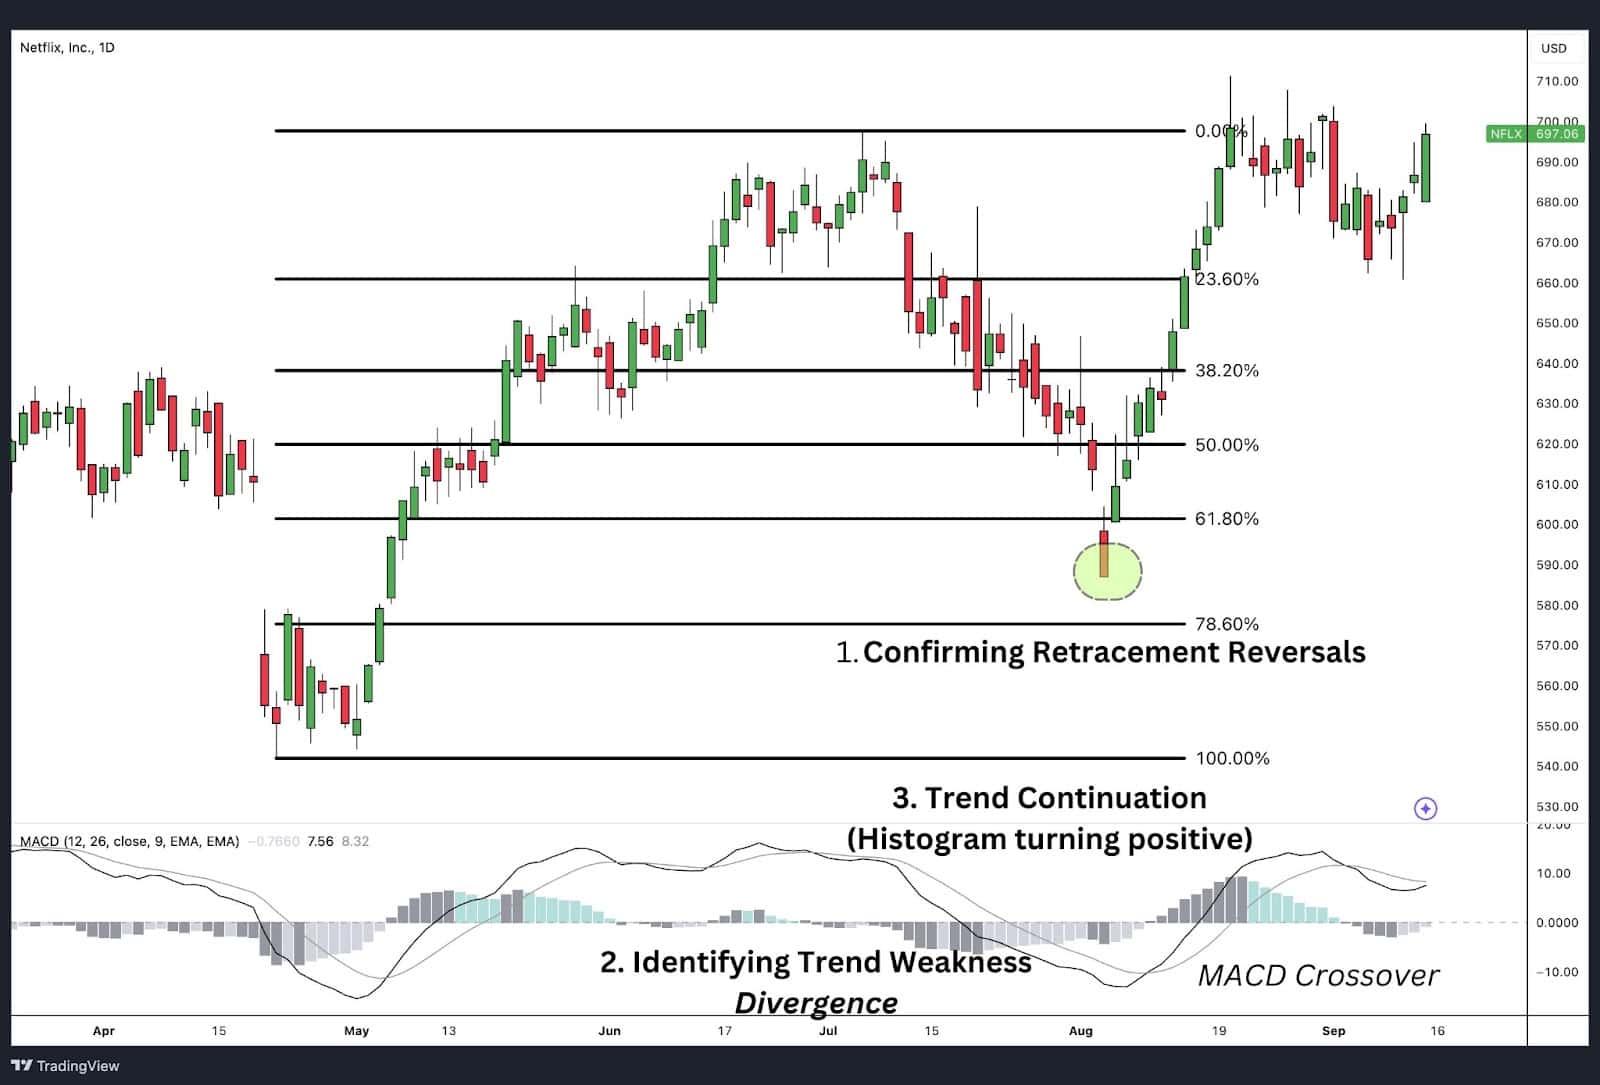
In the example above, Netflix was in an uptrend and began to retrace. As the price approaches the 61.8% Fibonacci retracement level, the MACD line begins to cross above the signal line, and the MACD histogram starts showing positive bars. This confluence of indicators suggests that the retracement is likely to end, and the upward trend may resume.
Fibonacci Retracements vs. Fibonacci Extensions
Fibonacci retracements and Fibonacci extensions (sometimes also known as Fibonacci Expansion) are both tools used in technical analysis, but they serve different purposes in analysing price movements. Here’s a breakdown of their key differences:
Fibonacci Retracements

Fibonacci retracement levels are used to identify potential areas where the price might retrace or correct within a larger trend. They help traders determine where a price pullback may end before resuming the original trend.
Traders use Fibonacci retracement levels during corrections or pullbacks to gauge potential support or resistance levels within a trend. For example, in an uptrend, when the price retraces to the 61.8% level, it might be seen as a potential point for a reversal back into the trend.
Fibonacci Extensions

Fibonacci extensions are used to project future price levels beyond the current price, helping traders identify where the price might move after a trend resumes. This is often applied to set profit targets.
Fibonacci extensions are typically used after the retracement phase has ended to estimate how far the price might go in the direction of the trend. For example, after a price breaks out from a retracement to the 61.8% level, a trader might use Fibonacci extensions like 161.8% to set price targets for future movement.
Key Differences
- Purpose:
- Fibonacci retracements are used to find potential pullback areas within a trend.
- Fibonacci extensions project future price targets beyond the current range.
- Market Phases:
- Retracements are applied during corrective phases.
- Extensions are applied when the market is continuing the trend beyond a previous high or low.
- Use Case:
- Retracements are about identifying corrections within a trend.
- Extensions help traders set profit targets after the correction.
Fibonacci Retracements vs Moving Average
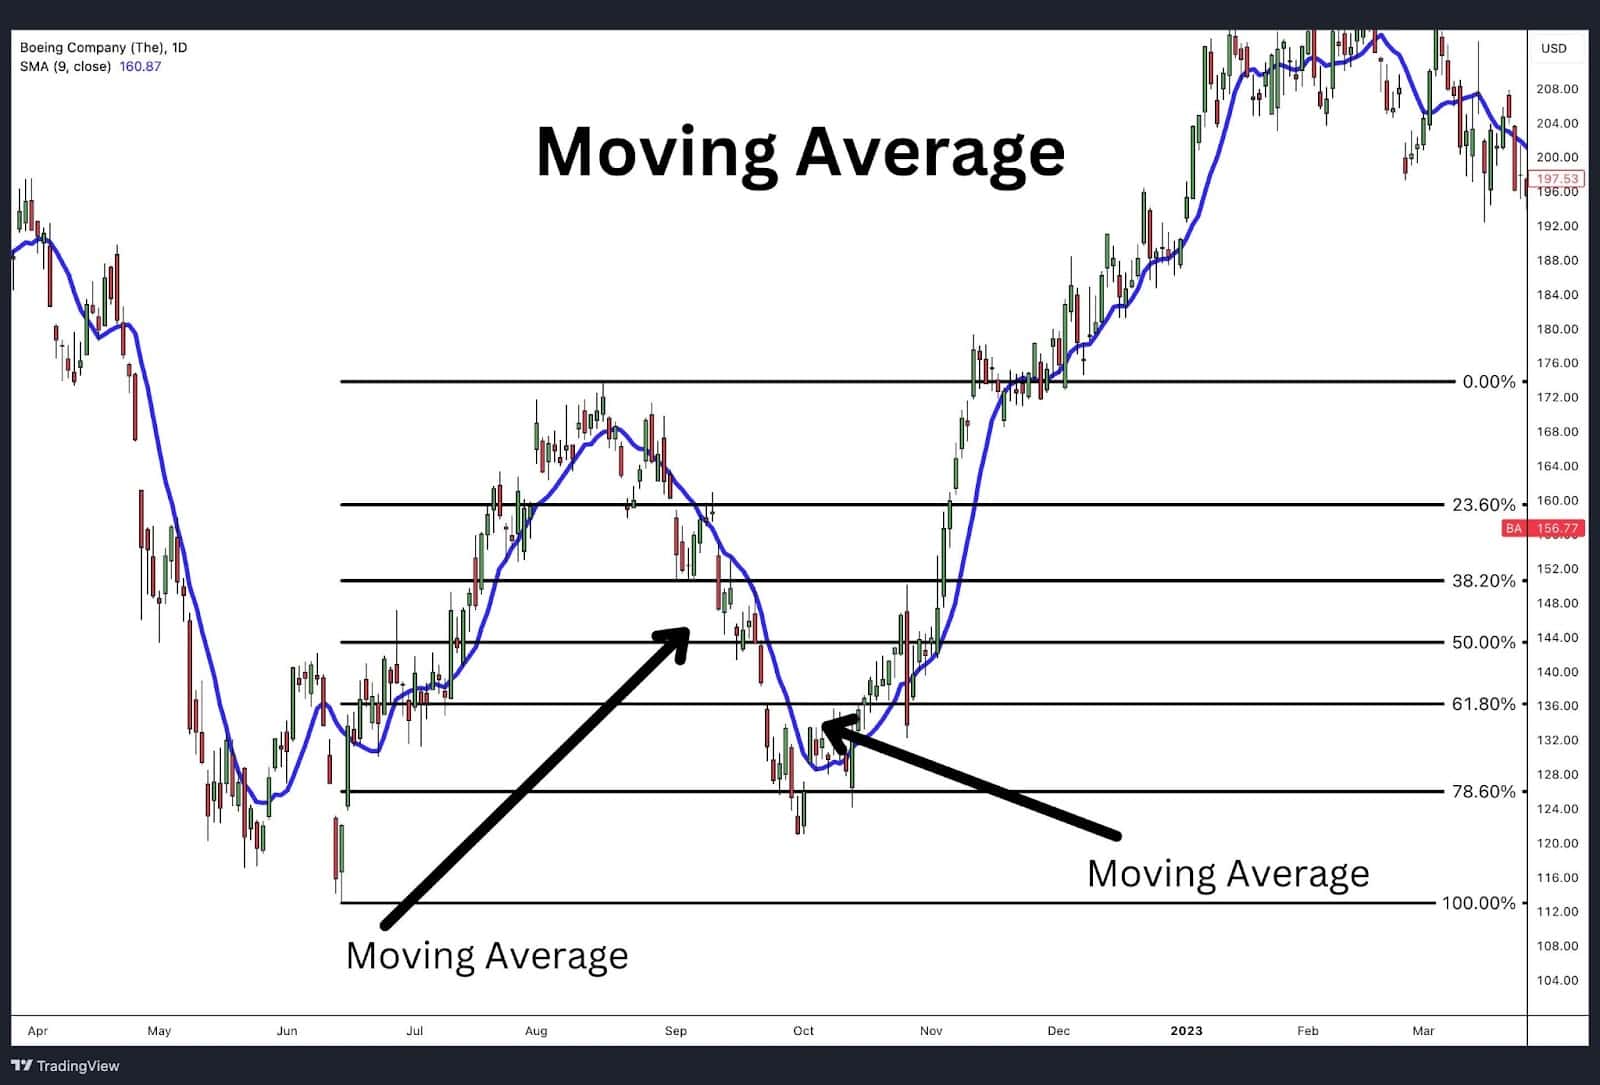
A moving average is a technical indicator that smooths out price data to identify the overall trend by calculating the average price over a set number of periods (e.g., 9-day, 50-day or 200-day averages). Exponential Moving Averages (EMA) give more weight to recent data, while Simple Moving Averages (SMA) treat all data points equally.
Key Differences:
- Static vs. Dynamic: Fibonacci retracement levels are static, while moving averages are dynamic, adjusting continuously as new price data comes in.
- Purpose: Moving averages are multi-use and are used to confirm trend direction, momentum, and support/resistance levels while Fibonacci retracements help pinpoint correction levels within a trend.
- Calculation: Moving averages are based on a price’s average over a time period, while Fibonacci retracement levels are fixed percentages of a price range.
How They Work Together:
Traders often use both tools in combination: for example, they may wait for a price retracement to a Fibonacci level and then check how it behaves near a key moving average, providing stronger confirmation for trend continuations or reversals.
What Are The Common Mistakes Traders Make When Using Fibonacci Retracement?
When using Fibonacci retracement levels, traders often make mistakes that can lead to poor decision-making. Here are some common pitfalls to watch out for:
- Forcing Fibonacci Levels: Traders may apply Fibonacci retracement to arbitrary price points instead of identifying valid swing highs and lows.
- Ignoring Market Context: Using Fibonacci levels without considering broader market factors, like trends or volatility, can lead to false signals.
- Over-reliance: Relying solely on Fibonacci retracements without confirming signals with other indicators like RSIor MACD or other candlestick patterns like hammer, shooting star, and pin bars.
- Neglecting Multiple Timeframes: Traders may only apply Fibonacci retracements on one timeframe, missing out on stronger signals across multiple timeframes.
- Not Combining with Trend Confirmation: Applying Fibonacci retracements during sideways or range-bound markets can result in ineffective signals if the broader trend is unclear.
FAQ
When is the best time to use the Fibonacci retracement?
Fibonacci retracement is most effective during trending markets when you’re looking to identify potential levels for a pullback or reversal during corrections.
What is the origin of the Fibonacci retracement?
The Fibonacci retracement is a derivative of the Fibonacci sequence which has roots in ancient Indian mathematics. The sequence was popularised in the west by Leonardo Fibonacci, an Italian mathematician, in the 13th century when he introduced it to Europe through his book Liber Abaci. This sequence’s mathematical ratios are now widely used in financial markets to predict potential price levels during market trends.
Which are the most popular Fibonacci retracement levels?
The most commonly used Fibonacci retracement levels are 38.2%, 50%, and 61.8%, with 61.8% being particularly important.
What is the best time interval in trading stocks for a Fibonacci sequence?
There’s no fixed time interval for applying Fibonacci retracements. Traders typically apply them to any significant highs and lows on charts, whether using daily, weekly, or even intraday timeframes. However, the tool is best applied to a 5-minute chart time frame or higher so there is enough distance between the high and low used in the measurement.
What is the significance of 1.618 in the Fibonacci sequence?
The number 1.618 is known as the golden ratio whose inverse is .618. The 61.8% ratio is found in nature as well as the financial markets to project areas of potential market reactions.
What are the “alert zones” in Fibonacci retracements?
“Alert zones” refer to the 38.2% to 61.8% retracement levels where the price is most likely to reverse or consolidate.
Does Fibonacci retracement work for day trading?
Yes, Fibonacci retracements can be effective for day trading when applied to timeframes like 5-minute or 15-minute charts to predict pullbacks in intraday trends. However, the tool is less effective on less than 5-minute chart timeframes.
What is the best Fibonacci retracement setting?
The standard settings with levels at 23.6%, 38.2%, 50%, 61.8%, and 78.6% are the most commonly used and widely trusted by traders.
Is Fibonacci retracement a leading indicator or a lagging indicator?
Fibonacci retracement is considered a leading indicator because it helps predict future price levels based on past market movements.


