


Written by:

Reviewed by:

- February 12, 2025
- 28 min read
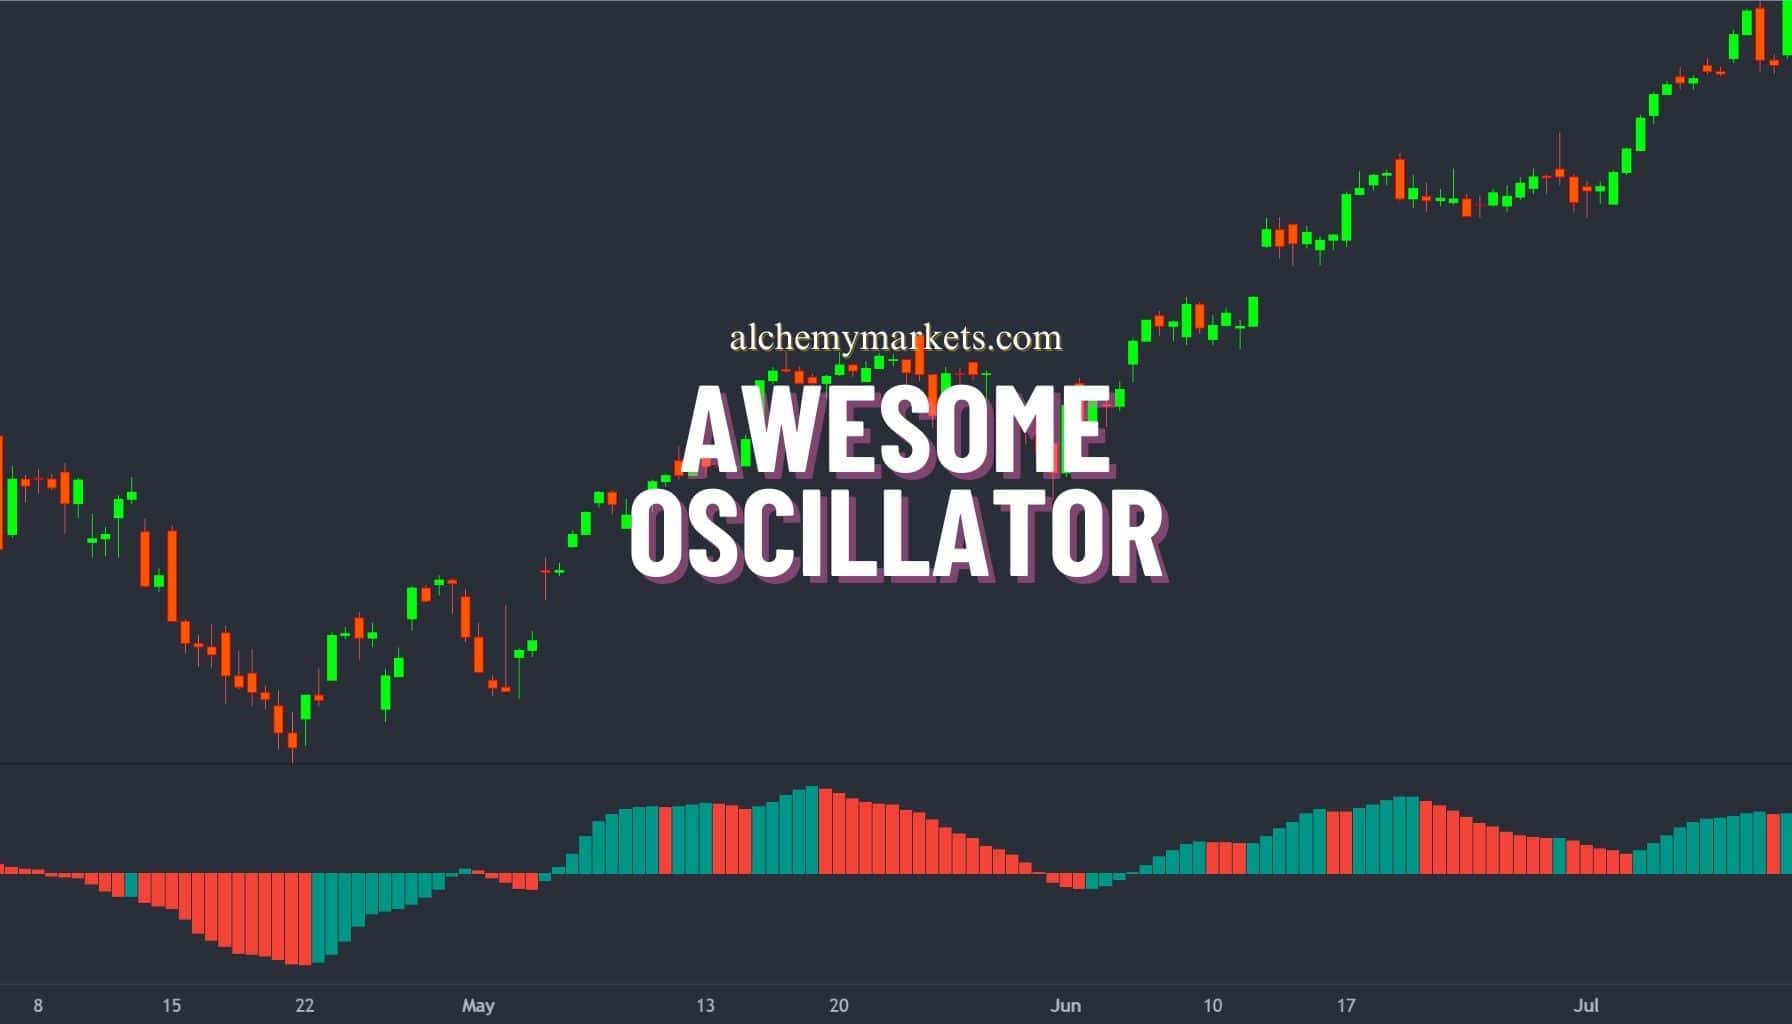
Awesome Oscillator – A Comprehensive Trader’s Guide
What is the Awesome Oscillator?
The awesome oscillator (AO) is a market momentum indicator developed by Bill Williams that helps traders measure market momentum and identify potential trend reversals. This technical indicator does this by comparing the difference between a 5-period simple moving average (SMA) and a 34-period SMA, both plotted over the midpoints of price candles, not closing prices. The indicator is used both for directional analysis and for generating trading signals.
Understanding the Awesome Oscillator
When it comes to understanding the awesome oscillator, perhaps the most important thing to note is the fact that the SMAs are plotted over the middle point of price candles, and not closing prices.
The significance of this is that the indicator helps avoid putting too much emphasis on how prices end at the close of a session, especially when there’s last-minute volatility or manipulation. By using the average of the high and low price for the candle, the awesome oscillator gives a more balanced view of price movement throughout the whole period.
This approach also smooths out momentum readings by factoring in both the high and low extremes, rather than just focusing on where price ends. As a result, the awesome oscillator provides a clearer reflection of overall market sentiment and is better at capturing broader trends and shifts in momentum and helping traders build trading signals.
How Does the Awesome Oscillator Indicator Work?
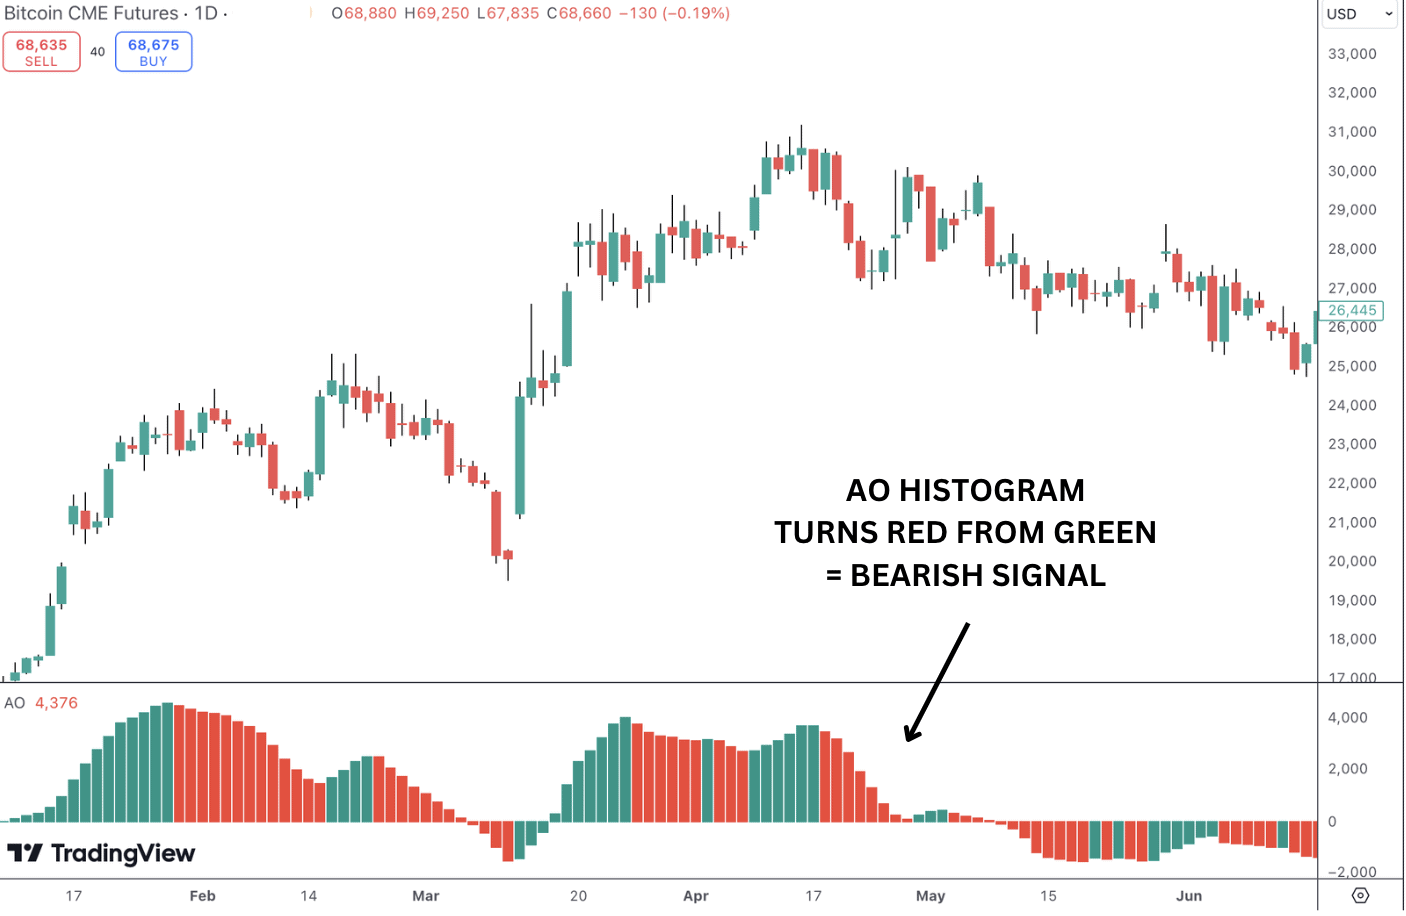
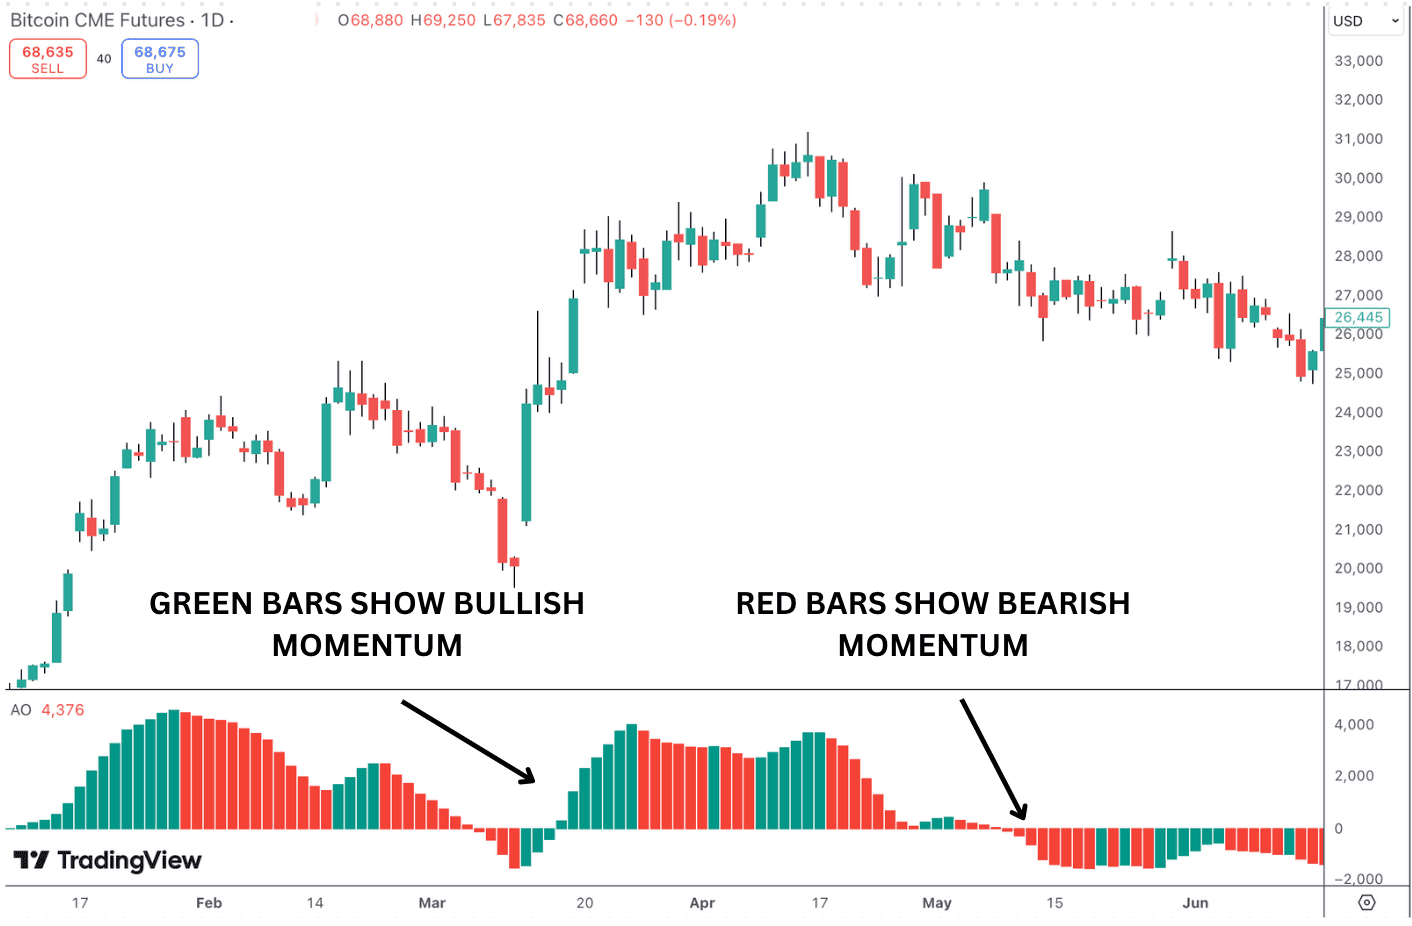
The indicator is displayed as a histogram that oscillates above and below a zero line. When the histogram is above zero, it indicates bullish momentum, while values below zero show bearish momentum. Changes in the histogram’s color (from red to green or vice versa) are known as line peaks.
A line peak (or change in color) indicates shifts in momentum, which can help traders identify bullish and bearish trends as well as potential buy or sell signals. A ‘green bar’ signifies positive momentum and is an important signal for traders. After a series of bullish momentum, the green bars reduce and turn to red. A bullish line peak is when the histogram bars are above the zero line and a previous bar is green and the subsequent and current bar turns red. This suggests that the bullish sentiment is weakening and could be turning bearish.
Conversely, a ‘red bar’ signals bearish sentiment. After a series of red bars, the momentum eventually slows and the bars turn green. A bearish line peak is when histogram is below the zero line, the previous bar is red while the subsequent and current bar turns green. This suggests the bearish momentum is weakening and could be turning bullish.
Key signals from the awesome oscillator strategy include:
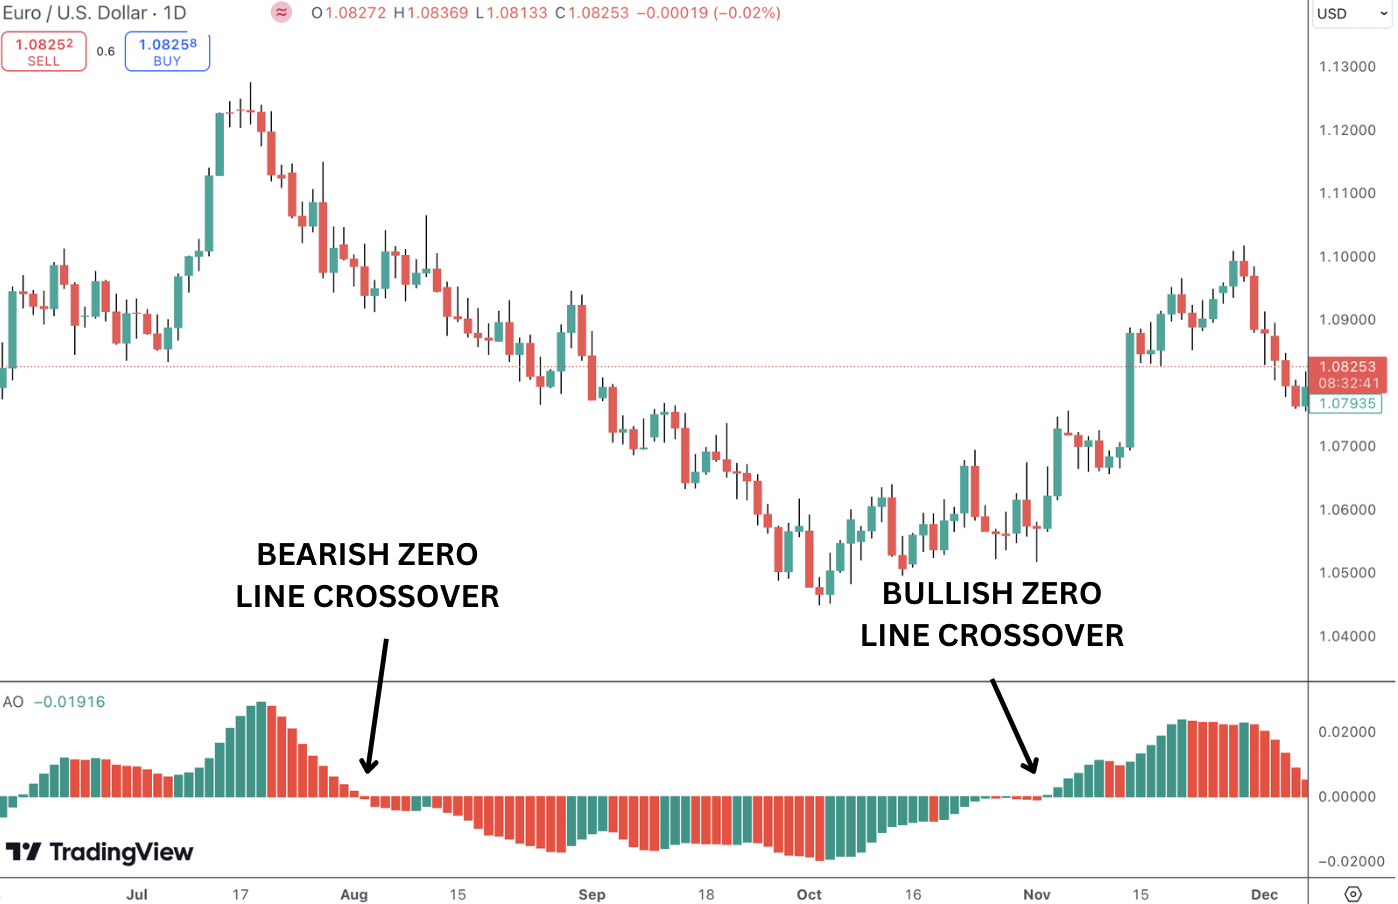
- Zero Line Crossover: When the awesome oscillator crosses above the zero line, it suggests bullish momentum, while a cross below suggests bearish momentum. In the EURUSD example below, you can see how the price trends follow the AO crossovers.
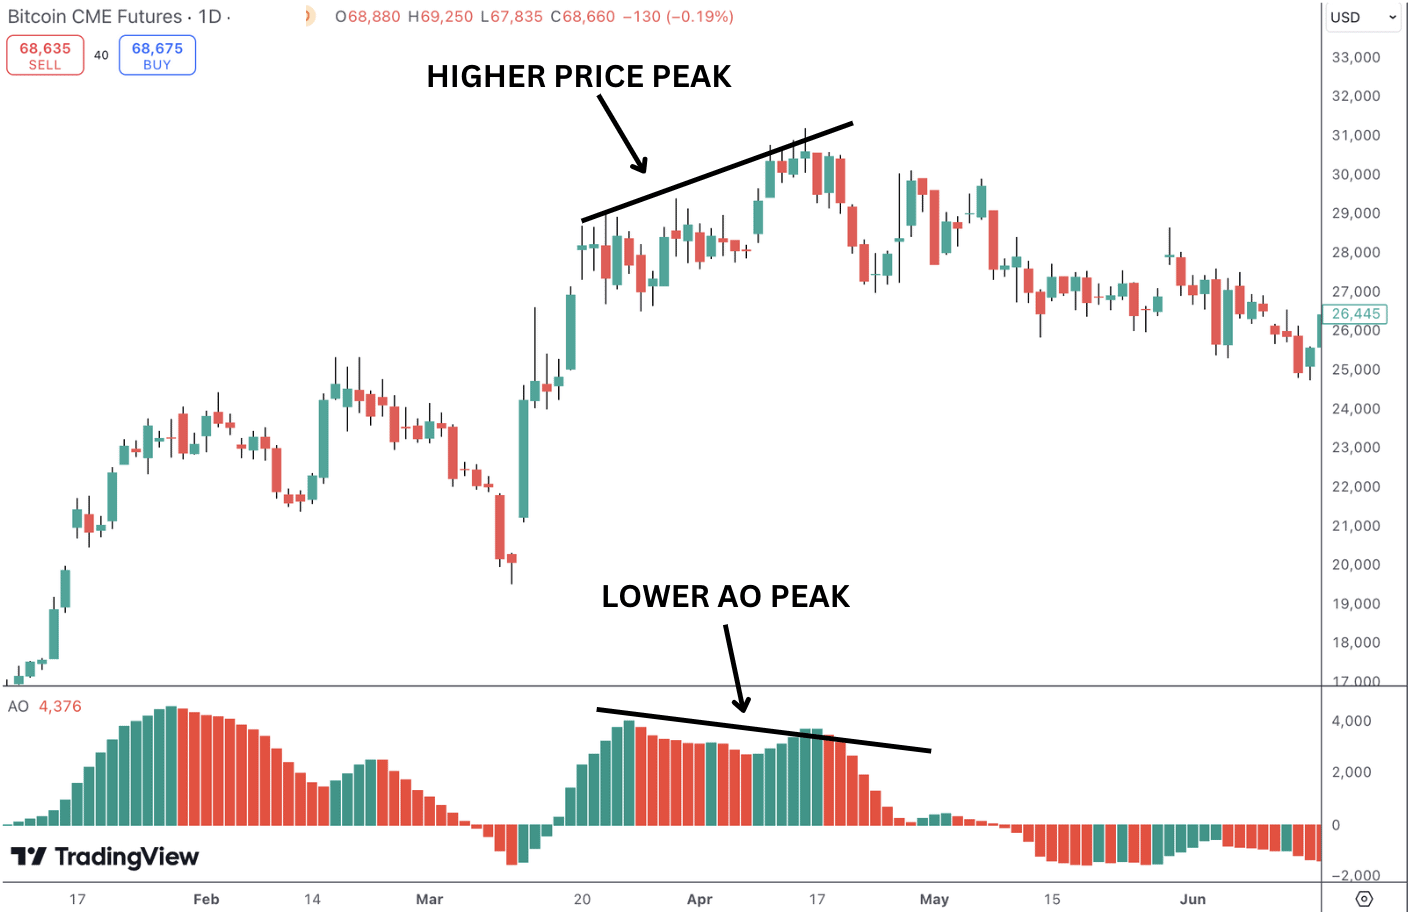
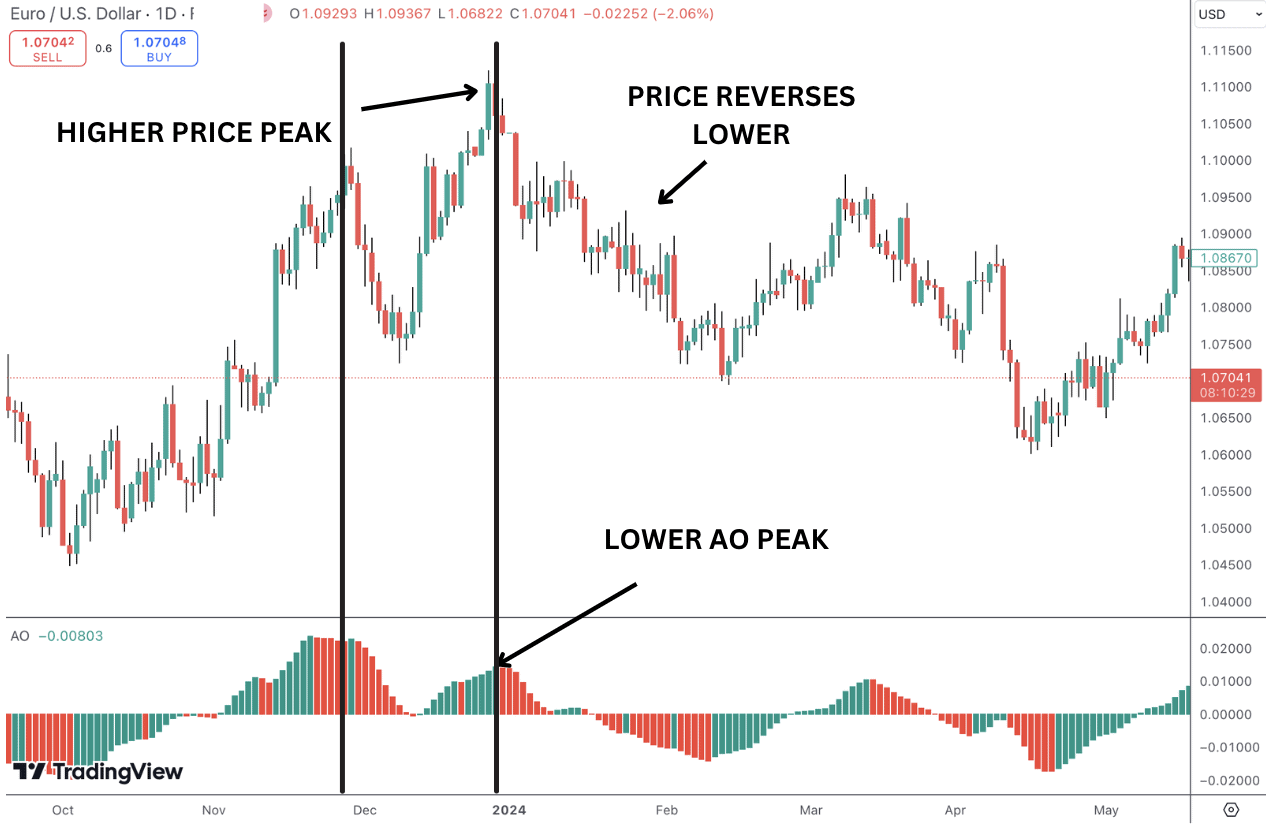
- Twin Peaks: Bullish or bearish signals can be identified by peaks on the histogram, where a second peak is higher (bullish) or lower (bearish) than the first. Below, we have an example of a bearish twin peak set up giving us a sell signal. This is essentially the same premise as divergence except we are focusing on two specific indicator points whereas general divergence can include more. In the Bitcoin illustration below, a bearish twin peaks pattern is spotted.
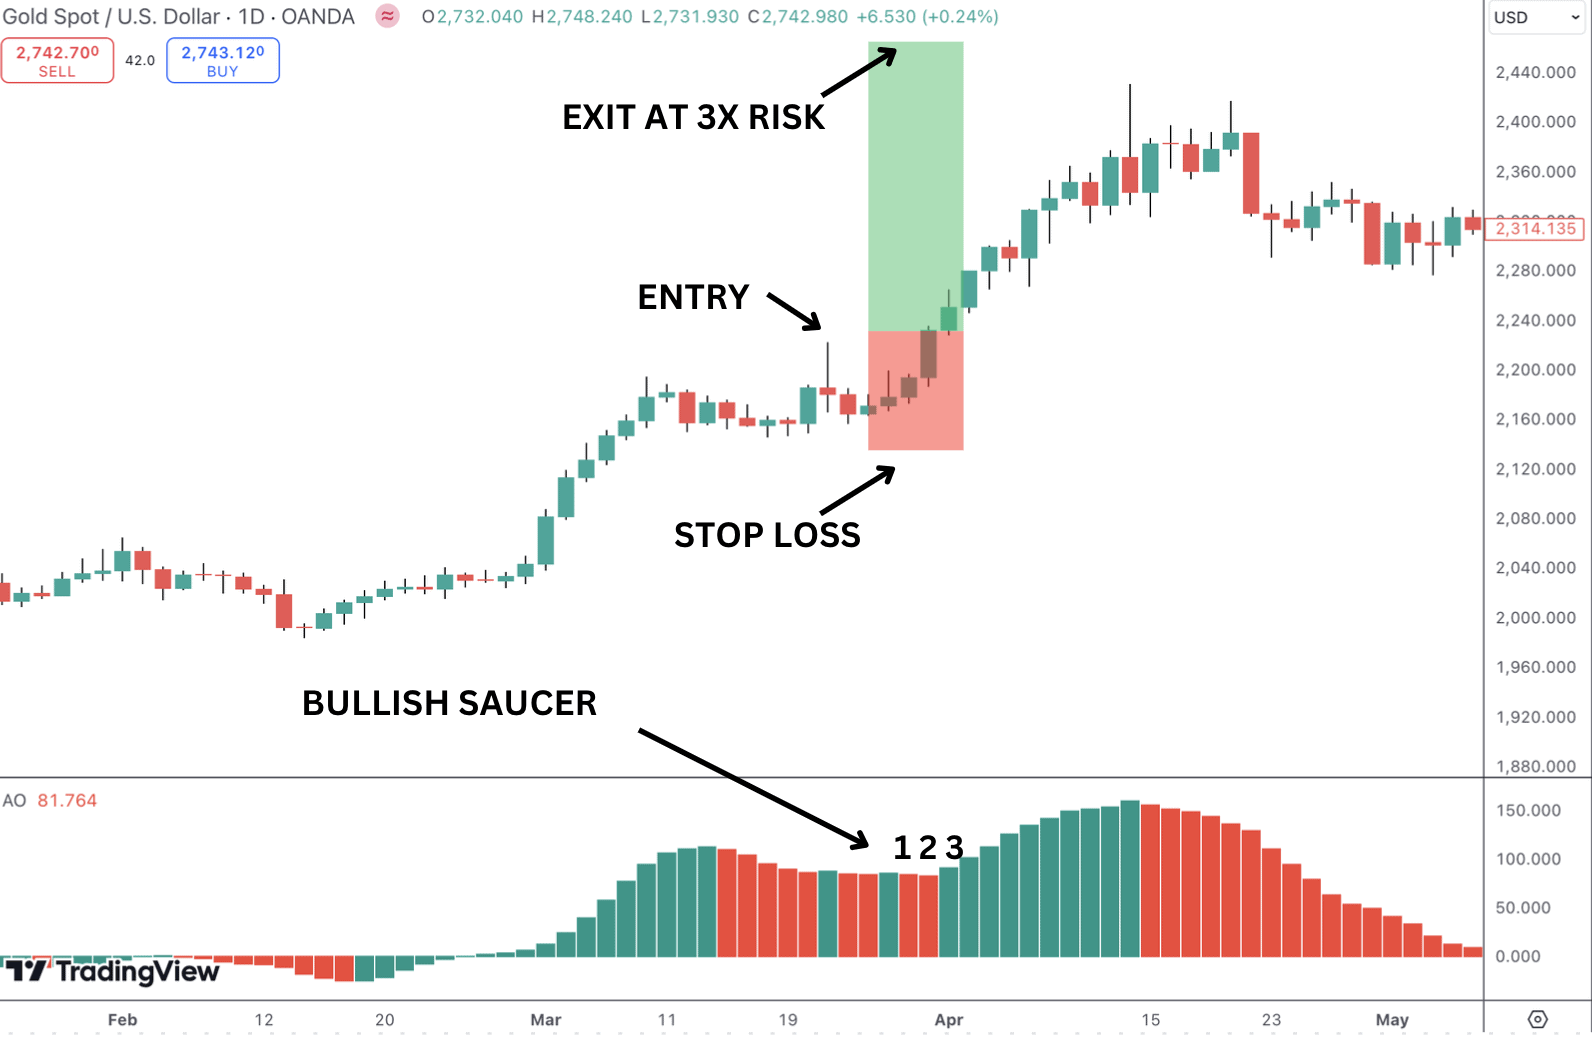
- Saucer: This signal occurs when the histogram changes from red to green (bullish saucer) ahead of a bullish zero line crossover or green to red (bearish saucer), ahead of a bearish zero line crossover, signaling a possible momentum shift. Below we have an example of a bearish saucer set up, giving us a bearish signal.
Overall, the awesome oscillator is used to confirm trends and provide early warnings of potential reversals which traders can use as a trading signal or in managing open trades.
Importance of Awesome Oscillator Indicator
The awesome oscillator is an effective tool for traders because it helps gauge market momentum and spot potential trend changes. It compares short-term and long-term momentum, making it easier to confirm if a trend is strong or starting to lose steam. The awesome oscillator also gives simple, clear signals such as the zero line crossover and twin peaks, which can help traders time their entries and exits better.
Another key benefit of the awesome oscillator is that it works in different market conditions, whether prices are trending or range-bound. However, it’s worth noting that in sideways markets, the indicator tends to be less useful as we see with some other indicators such as moving averages.
By using the midpoint of candles, instead of just the closing price, it gives a more balanced picture of price movement without getting thrown off by short-term volatility. Overall, the awesome oscillator is a great way to simplify momentum analysis and identify trend shifts and can be used to develop an awesome oscillator trading strategy to capture market trends.
Understanding the Zero Line
The zero line in the awesome oscillator is a key reference point that helps traders determine shifts in market momentum and is most commonly used for generating trading signals. Here’s how it works:
- When the awesome oscillator crosses above the zero line, it indicates that short-term momentum (represented by the 5-period simple moving average) is stronger than long-term momentum (represented by the 34-period SMA). This suggests that buying pressure is increasing, which could signal the start of an uptrend.
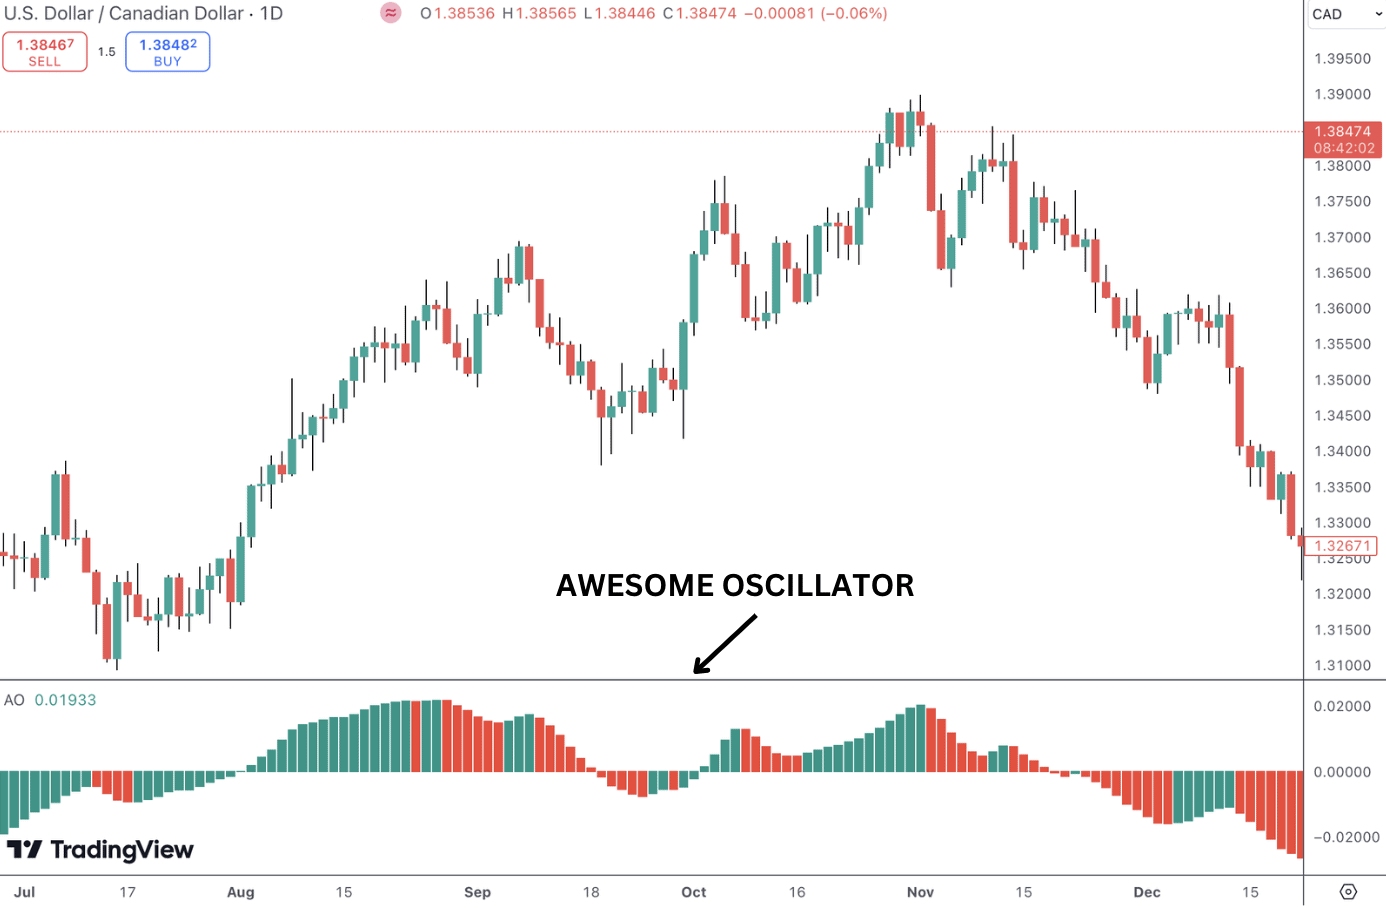
- Conversely, when the awesome oscillator crosses below the zero line, it shows that short-term momentum has weakened compared to long-term momentum, indicating growing selling pressure and potentially signaling the start of a downtrend. In the image below, notice how price reacts around each of the marked zero line crossovers in oil.
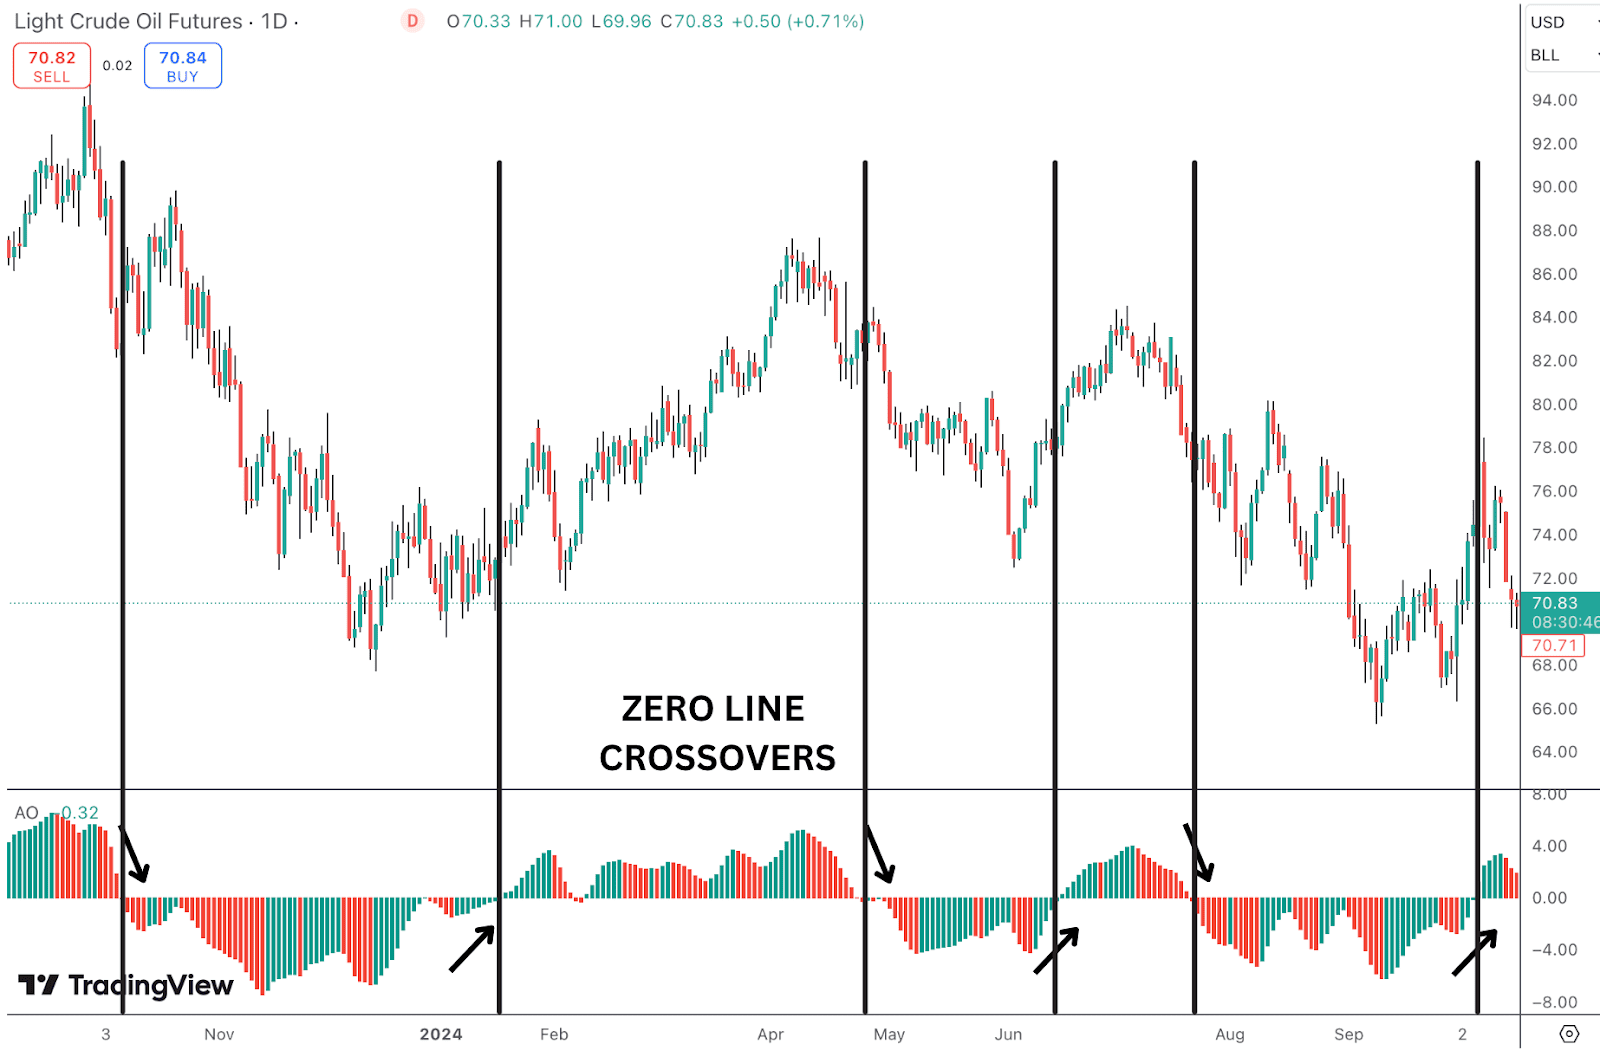
Essentially, the zero line acts as the dividing point between bullish and bearish momentum, marking the mid-point of the range over the lookback period. Crossovers above or below this line often provide early warnings of trend changes. For traders, paying attention to these zero line crossovers can be helpful for identifying when market momentum is shifting, allowing for better timing in entering or exiting trades.
With this in mind, it is also important to understand “side zero”. Side zero is when the histogram bars are close to and hovering around the zero line. This means the spread between the short-term and medium term averages are small and that there may be little momentum in the market.
Side zero can appear when the market is going through a consolidation period or lacking strong directional movement. Side zero may also signal a market in transition. Therefore, it is best to wait for AO histogram bars to grow significantly away from the zero line before interpreting the signal it is providing.
There is a more nuanced situation called “bars zero”. Bars zero appears when the histogram is exactly at zero. This means the 5-period moving average of median prices is the same as the 34-period moving average of median prices. This is quite rare and suggests that there is no momentum in the market.
Depending on the trend of the histogram bars going into bars zero, it’s possible that bars zero represents a transitionary market. For example, if the histogram is a strong red, then becomes bars zero, then that suggests momentum is changing from a downtrend to an uptrend.
How to Calculate Awesome Oscillator
The awesome oscillator calculation is essentially the difference between the 34-period SMA and 5-period SMA . The indicator calculates these readings and plots them on the chart for you automatically you don’t need to run the formulas yourself. However, if you’re interested in the math, below is the awesome oscillator formula.
Awesome Oscillator Formula
The awesome oscillator formula is:
Awesome oscillator = 105 (5-period SMA) – 100 (34-period SMA) = 5.
How to Read the Awesome Oscillator
The awesome oscillator measures momentum and generates trading signals by comparing short-term and long-term momentum. There are three main patterns traders follow when reading the oscillator.
Zero Line Crossovers
To read it, start with the zero line crossovers: if the AO crosses above the zero line, it suggests momentum is picking up, signaling a possible buy opportunity. If it crosses below, momentum is weakening, which could be a sell signal.
Twin Peaks Pattern
Next, traders can look out for twin peaks—two peaks either below or above the zero line can indicate a reversal is coming, depending on whether the second peak is higher or lower.
Saucer Pattern
Another pattern to follow is the saucer. If the awesome oscillator is above the zero line and shifts from red to green, it could be a sign to buy; if it’s below the zero line and flips from green to red, it might be a signal to sell. A bearish saucer is characterized by two consecutive green bars below the zero line, where the second green bar is lower than the first, followed by a red bar. This is not to be confused with a zero line crossover which is essentially where the histogram shifts from being above the neutral line to below or from below the neutral line to above.
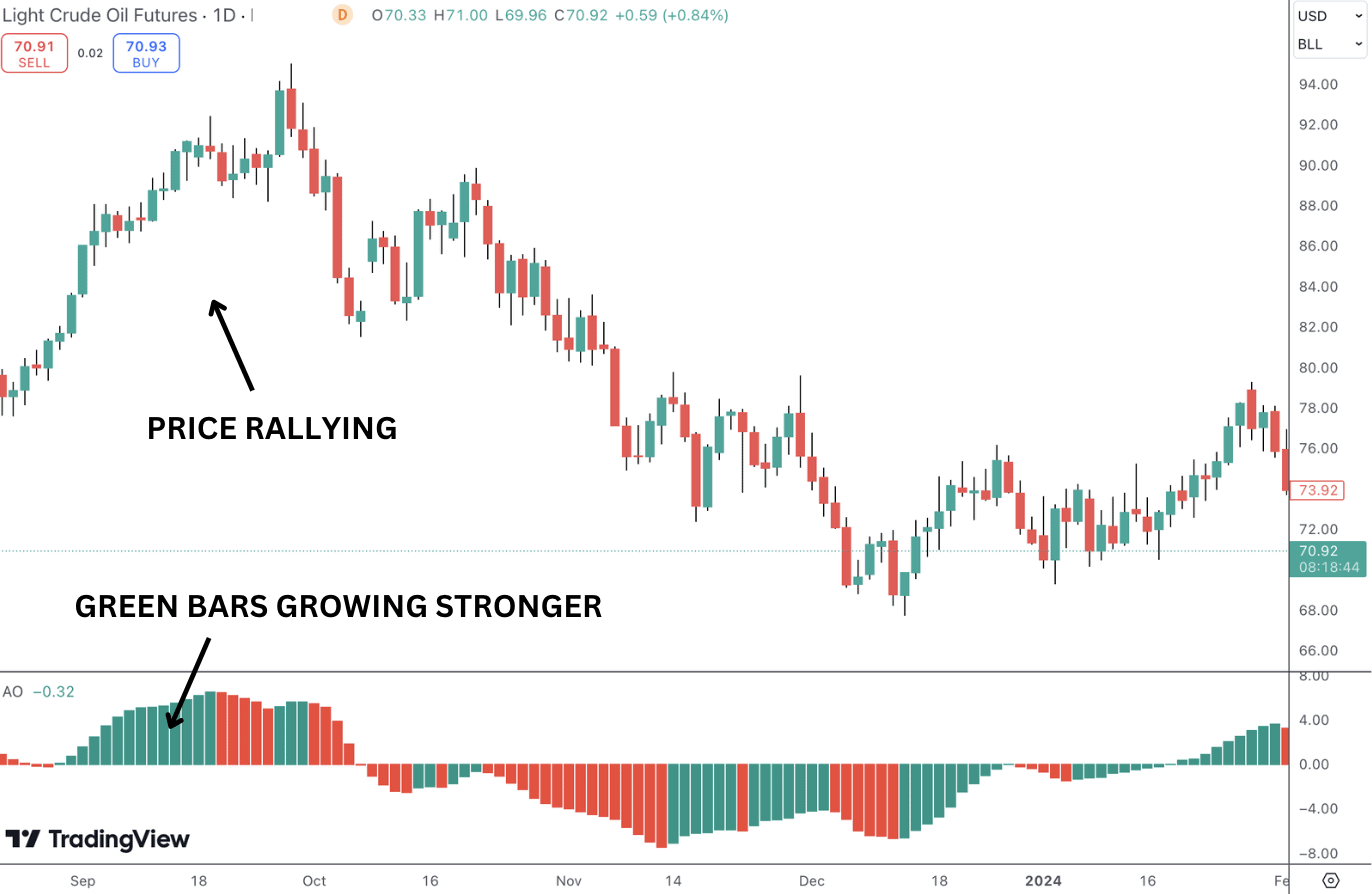
Finally, traders should pay attention to the size of the histogram bars—bigger green bars mean strong bullish momentum, while deeper red bars show stronger bearish momentum. All these signals can help traders understand market momentum and make smarter trading moves. Below, we have an example of the bard getting bigger during a bull trend.
How the Awesome Oscillator Measures Market Momentum
The awesome oscillator measures market momentum by comparing the short-term and long-term simple moving averages using the median price over a specified period. The indicator measures the difference between a 5-period simple moving average (SMA) and a 34-period SMA, both based on the median price point of each candle (the average of the high and low prices).
When the 5-period SMA is above the 34-period SMA, it shows that short-term momentum is stronger than long-term momentum, indicating bullish momentum. Conversely, when the 5-period SMA is below the 34-period SMA, it signals bearish momentum, meaning that short-term momentum is weakening compared to the long-term trend. Indicator readings can be used and buy and sell signals or as a directional guide to inform your outlook.
Awesome Oscillator Examples
In this section, we will examine in detail a number of different ways you can use the AO indicator to analyze price moves and generate trade ideas. As an introduction, let’s briefly look at two examples of the indicator at work. Later on we discuss how the indicator can be combined with other indicators to create more advanced trading strategies.
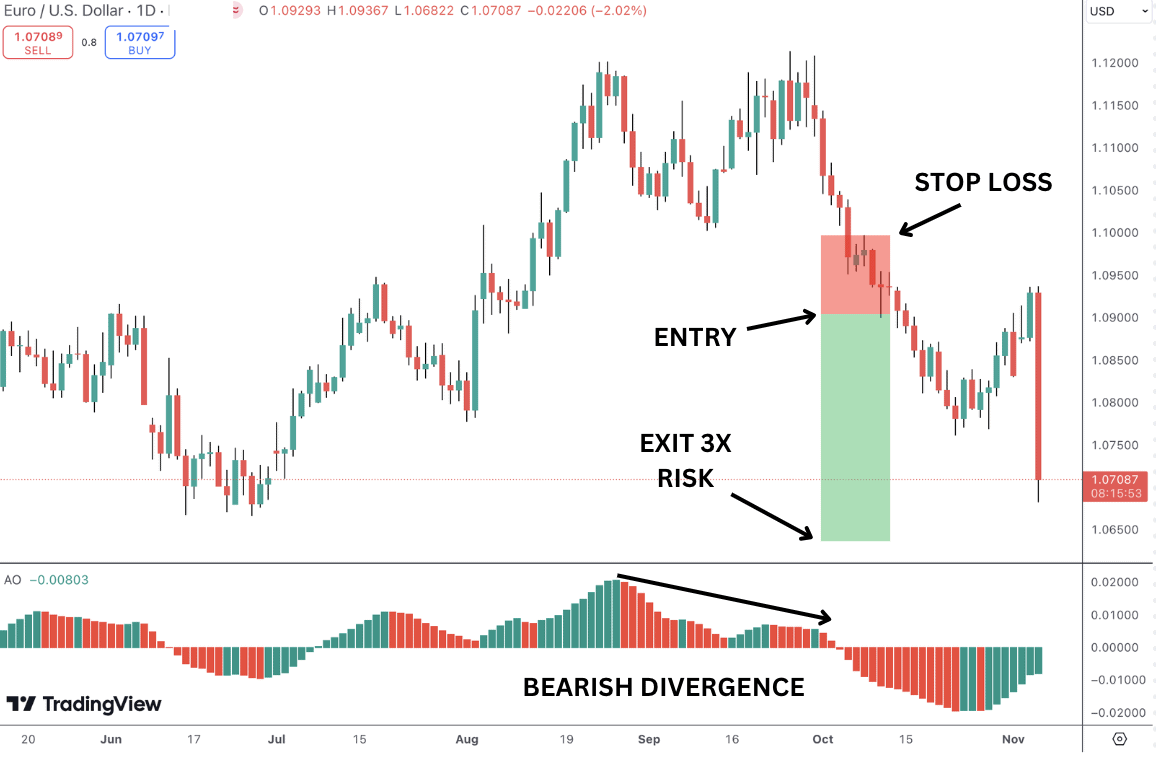
First up we have the price chart for EURUSD displaying bearish divergence on the AO indicator. As a result, EURUSD prices turned lower creating a potential selling opportunity.
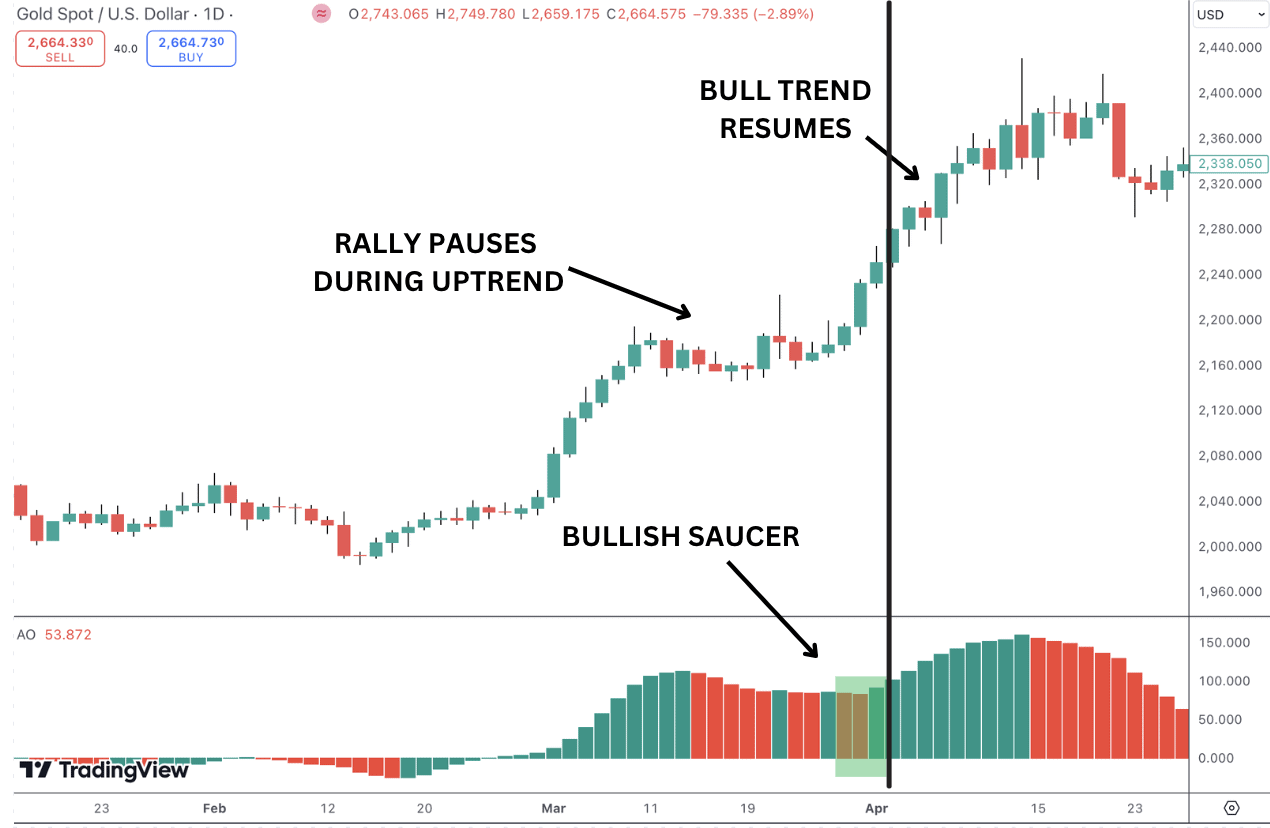
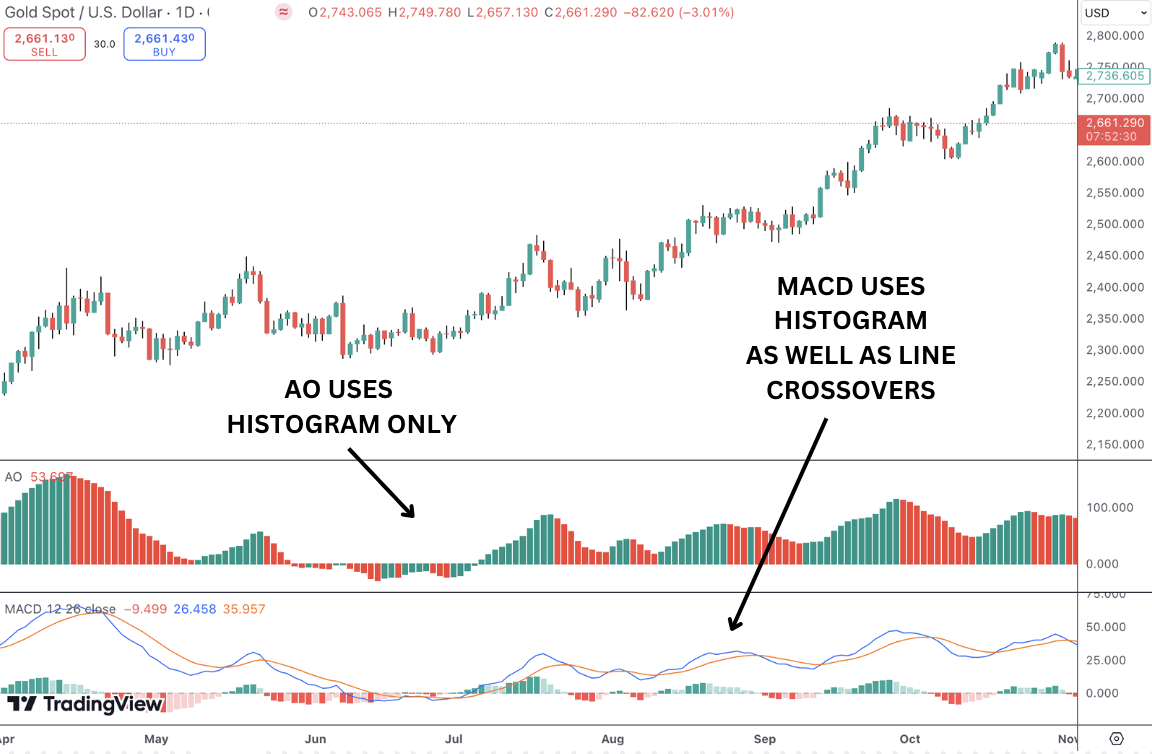
Next we can see an example of a bullish saucer forming on the gold daily price chart. This highlights a period of renewed momentum during a bullish trend in gold.
Awesome Oscillator Trading Strategies
So far we’ve looked at the different information the indicator conveys regarding price and trend. It’s now time to think about how we can trade these different indicator signals. As always, our focus is on solid risk management and good risk:reward practices.. Read on below to see how you can generate trading signals based on the indicator by itself but also in combination with other technical indicators.
Identifying Trends
The zero line crossover strategy is one of the best ways to identify trends using the awesome oscillator. Let’s take a look at how you can do this. The steps are as follows:
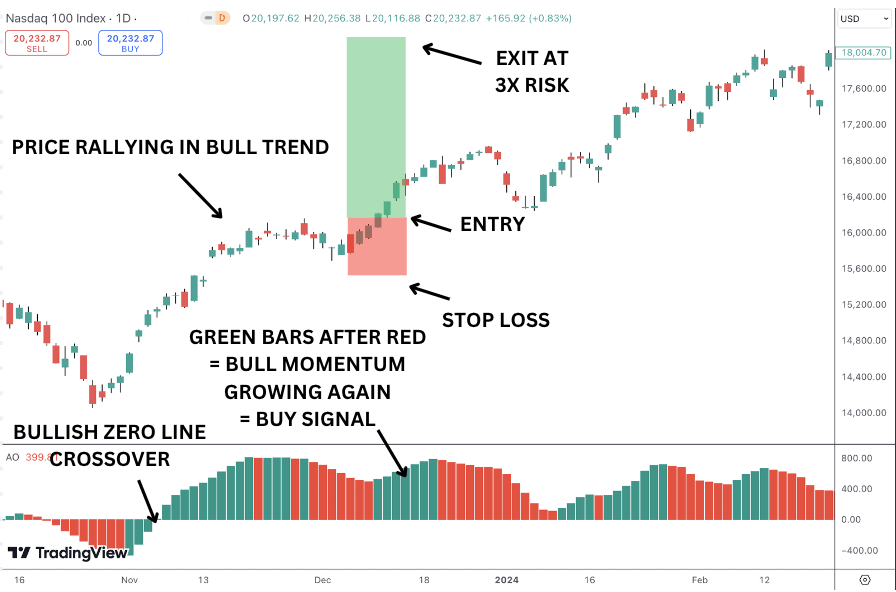
- Bullish Zero Line Crossover: The indicator histogram crosses above the zero line. This signals that short-term momentum (5-period SMA) is now stronger than long-term momentum (34-period SMA), suggesting the beginning of a possible uptrend. More aggressive traders can use this as an initial entry point.
- Increasing Green Bars: As the histogram continues to grow with green bars, it indicates that bullish momentum is gaining strength, confirming the bull trend. The larger the green bars, the stronger the uptrend.
- Consolidation & Trend Resumption: If the momentum indicator remains above the zero line and the green bars continue to grow, this confirms the uptrend is strong. Traders can monitor the AO indicator for a period where momentum wanes, reflected by consecutive red bars. As the AO indicator prints green bars again, this can then be used as a fresh entry for a resumption of the bull trend.
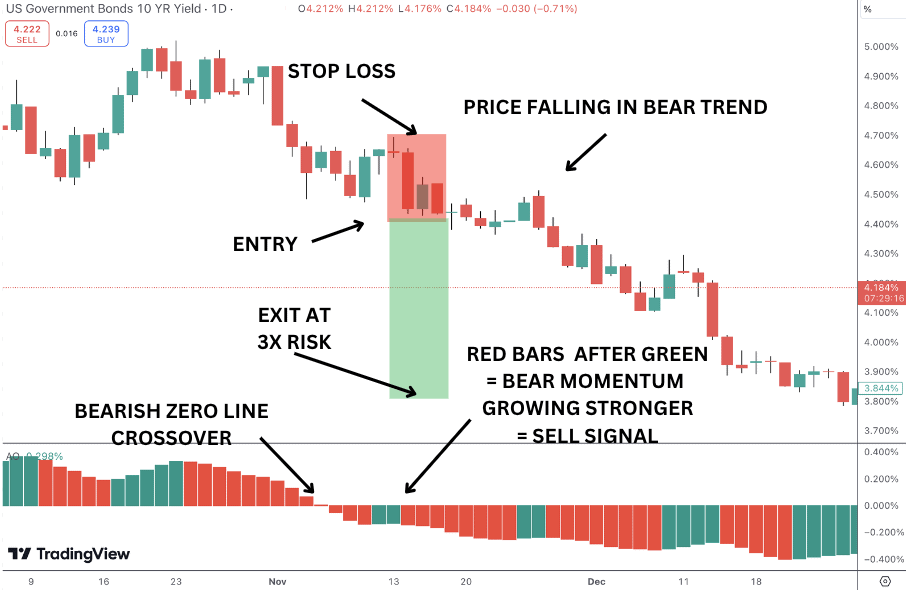
- Bearish Zero Line Crossover: The indicator histogram crosses below the zero line, signaling that short-term momentum has weakened compared to long-term momentum. This can indicate the start of a downtrend, serving as a sell signal.
- Increasing Red Bars: As red bars appear and increase in size, it shows that bearish momentum is strengthening. This confirms that the downtrend is gaining traction.
- Consolidation & Trend Resumption: The longer the AO indicator stays below the zero line with increasing red bars, the stronger the downtrend. Traders can remain in a short position while bearish momentum persists looking to capitalize on downward price movements. Traders can also monitor AO for periods where selling momentum wanes, reflected by consecutive green bars. As the AO indicator prints red bars again, this can be used as a fresh entry point for a resumption of the trend.
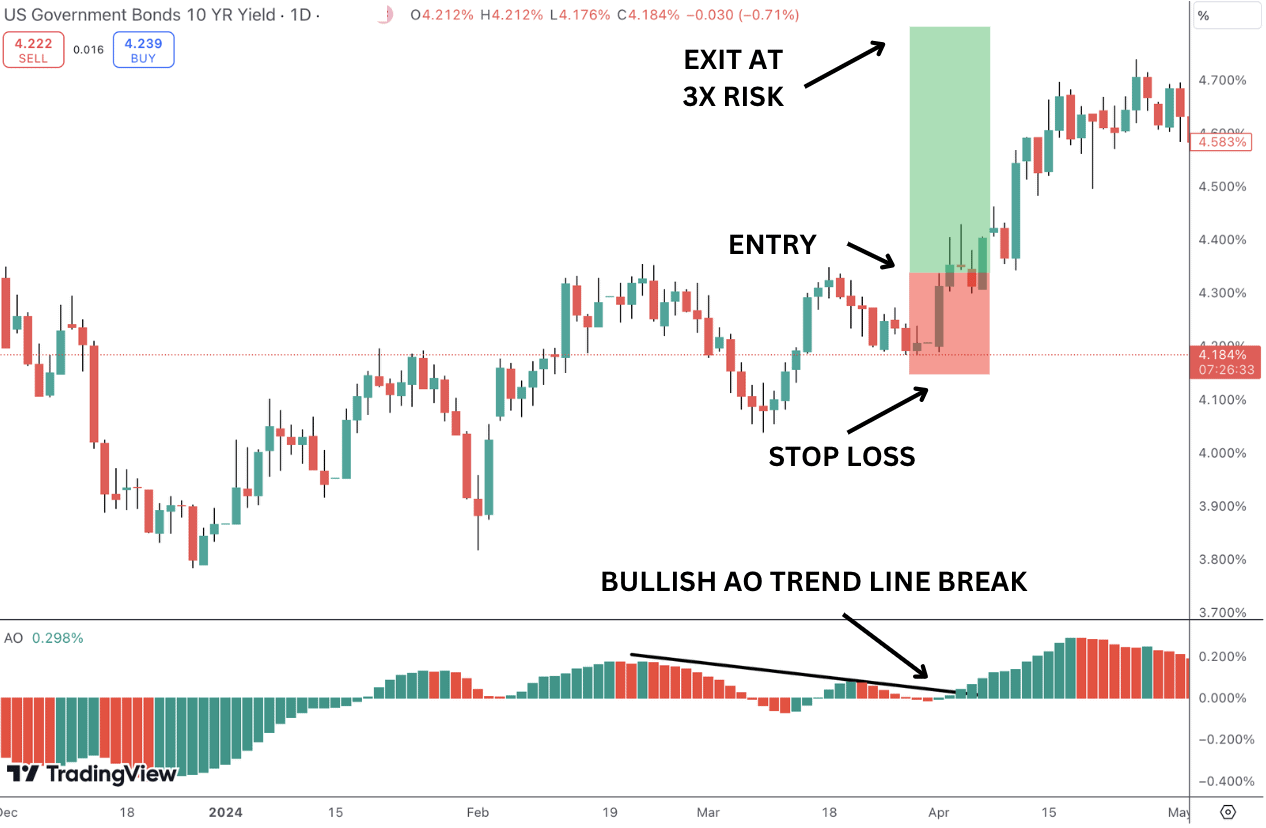
AO Trendline Cross
The trend line cross method is a technique where traders use a trendline drawn across the highs or lows of the momentum indicator histogram to help spot potential momentum shifts or trend reversals. Here’s how it works:
- Identify the Trendline: Draw a trendline connecting the peaks (for a downtrend) or troughs (for an uptrend) of the AO indicator histogram. This trendline will represent the current direction of momentum.
- Wait for the Crossover: Watch for the awesome oscillator’s histogram to cross the trendline. If the histogram breaks above a trendline drawn along the peaks during a downtrend, this may signal a shift toward bullish momentum. Alternatively, if the histogram breaks below a trendline drawn along the troughs during an uptrend, this could signal bearish momentum.
- Confirm the Break: After the trendline cross occurs, observe the next few bars of the indicator to confirm the momentum shift. If the histogram continues to move in the direction of the break, it strengthens the signal that a trend change or momentum shift is happening and traders can position to capture the coming price movements.
Identifying Reversal Points
To identify reversal points with the awesome oscillator, traders look for key signals that indicate shifts in momentum, suggesting the current trend may be losing strength and a reversal is likely. Below, let’s take a look at some of the main ways to spot potential reversal points using the AO
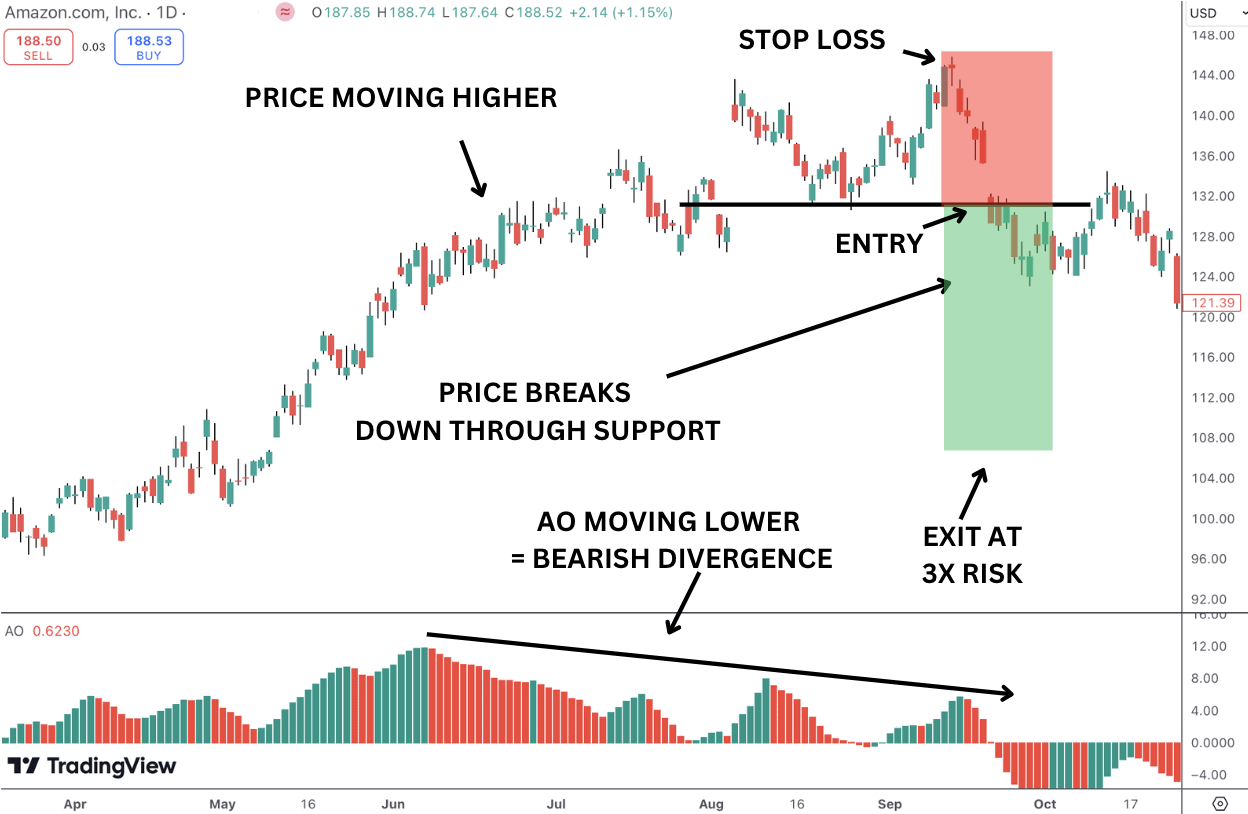
Identifying Divergences
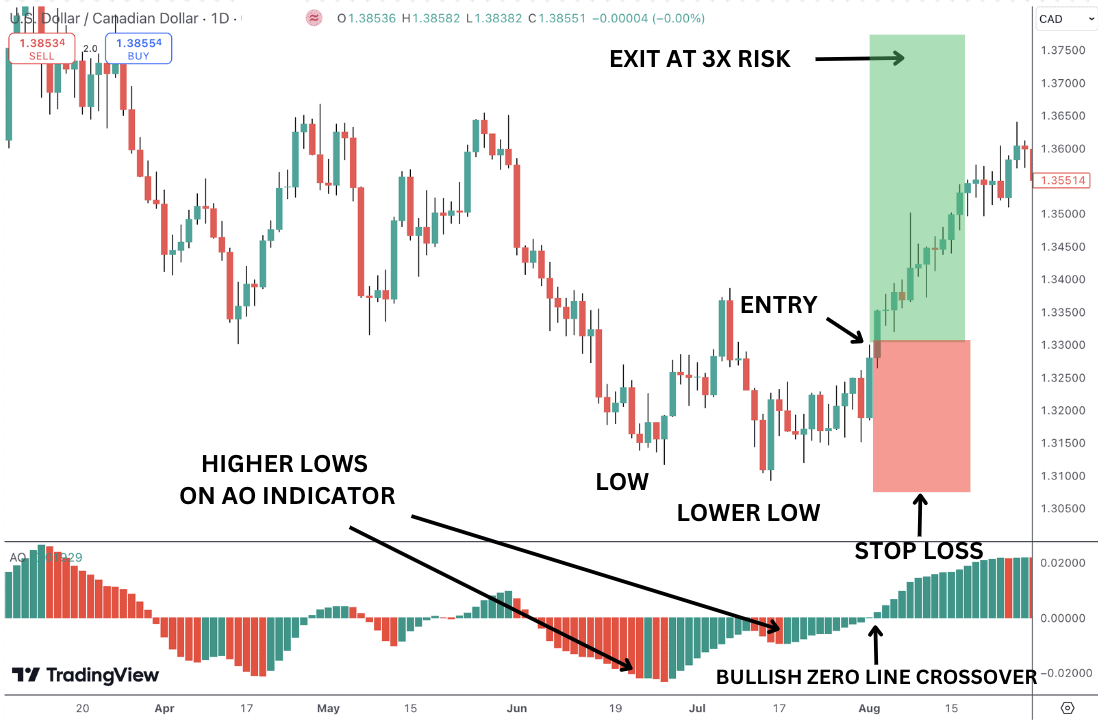
- Bullish Divergence: If the price is making lower lows, but the AO is making higher lows, this indicates that bearish momentum is weakening, signaling a possible bullish reversal. Traders can enter a long position due to bullish divergence as price breaks resistance.
- Bearish Divergence: If the price is making higher highs, but the AO is making lower highs, it suggests that bullish momentum is fading, pointing to a potential bearish reversal. Traders can enter short on a break of support.
Zero Line Crossover
- Bullish Reversal: When the AO indicator crosses above the zero line, it signals that short-term momentum is gaining strength compared to long-term momentum, indicating a potential bullish reversal. Traders can use this as a buy signal.
- Bearish Reversal: When the AO crosses below the zero line, it suggests short-term momentum is weakening, signaling a potential bearish reversal. Traders can use this as a sell signal.
Twin Peaks Strategy
- Bullish Twin Peaks: A bullish reversal signal occurs when there are two peaks below the zero line. The second peak must be higher (less negative) than the first, showing that bearish momentum is weakening. Traders can then enter long on a bullish zero line crossover.
- Bearish Twin Peaks: A bearish reversal signal happens when there are two peaks above the zero line, with the second peak being lower than the first. This shows that bullish momentum is weakening, and a bearish market could follow. Traders can enter short on a bearish zero line crossover.
Saucer Strategy
- Bullish Saucer: Look for the AO histogram to be above the zero line, indicating an uptrend. Find three consecutive bars where the middle bar is lower than the first, but the third bar rises again, surpassing the middle bar. This formation suggests that momentum is building up again after a slight pullback, which can be a signal to go long or add to an existing bullish position.
- Bearish Saucer: Confirm that the AO histogram is below the zero line, indicating a downtrend. Look for three consecutive bars where the middle bar is higher than the first, but the third bar drops again, falling below the level of the middle bar.
This formation often suggests that a small recovery or pause in momentum is over and that bearish pressure is resuming. Traders use this as a signal to go short or reinforce existing bearish positions.
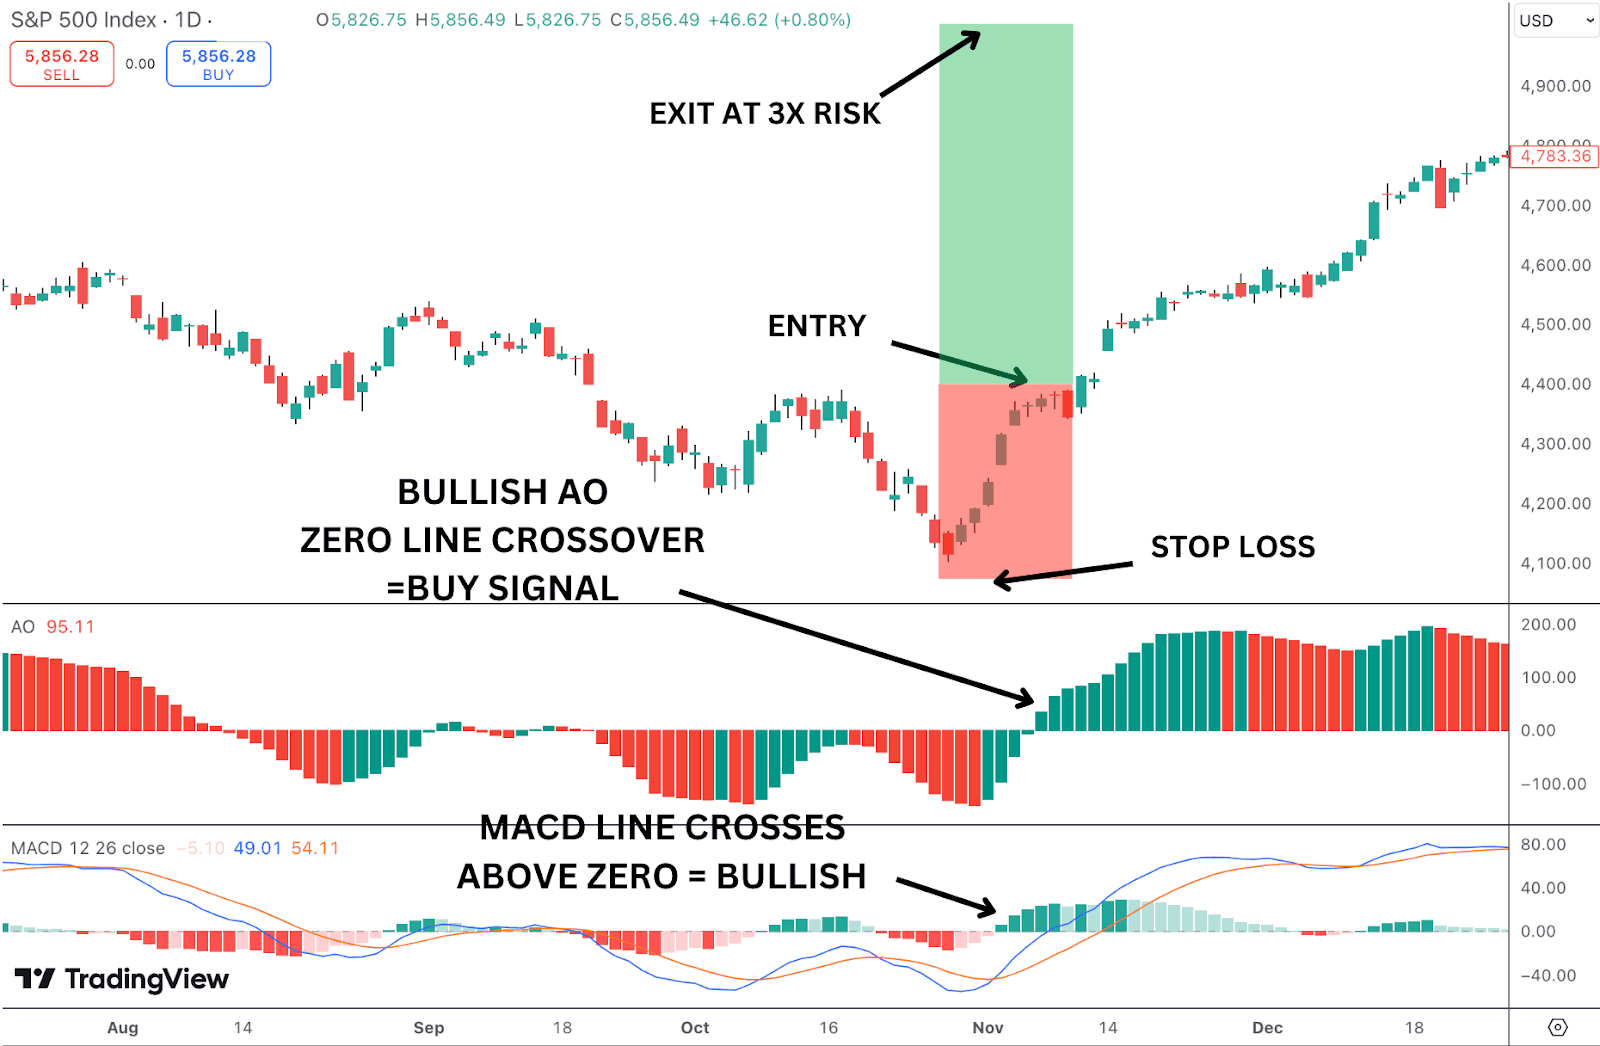
Awesome Oscillator with MACD
The AO indicator and MACD both measure momentum but in slightly different ways. The AO compares short-term and long-term averages of the median price, while the MACD compares two exponential moving averages (typically the 12- and 26-period EMAs) of the closing price.
When both indicators show a crossover in the same direction (e.g., both crossing above zero), it provides stronger confirmation of a trend’s momentum. For instance, if the AO crosses above the zero line and the MACD line crosses above the signal line, it strengthens the signal for a bullish trend.
The AO can help confirm MACD signals. For example, if the MACD gives a buy signal by crossing the signal line, but the AO is still below the zero line, this could mean the upward momentum isn’t strong yet, and the MACD signal may be premature.
- Bullish Setup: The MACD crosses above the zero line, indicating increasing bullish momentum.
- Shortly after, the AO crosses above the zero line, confirming that the uptrend is strengthening and we have a bullish market.
- With both indicators in alignment, trader’s could use this as a strong buy signal.
Awesome Oscillator with EMA
- Bullish Entry: Look for price to be above the EMA and for the AO to cross above the zero line. This combination indicates that both the trend and momentum are in sync, signaling a potential buying opportunity.
- Bearish Entry: When price is below the EMA and the AO crosses below the zero line, it signals a bearish trend with strong momentum, which could be a good opportunity to go short and capitalize on a bearish market.
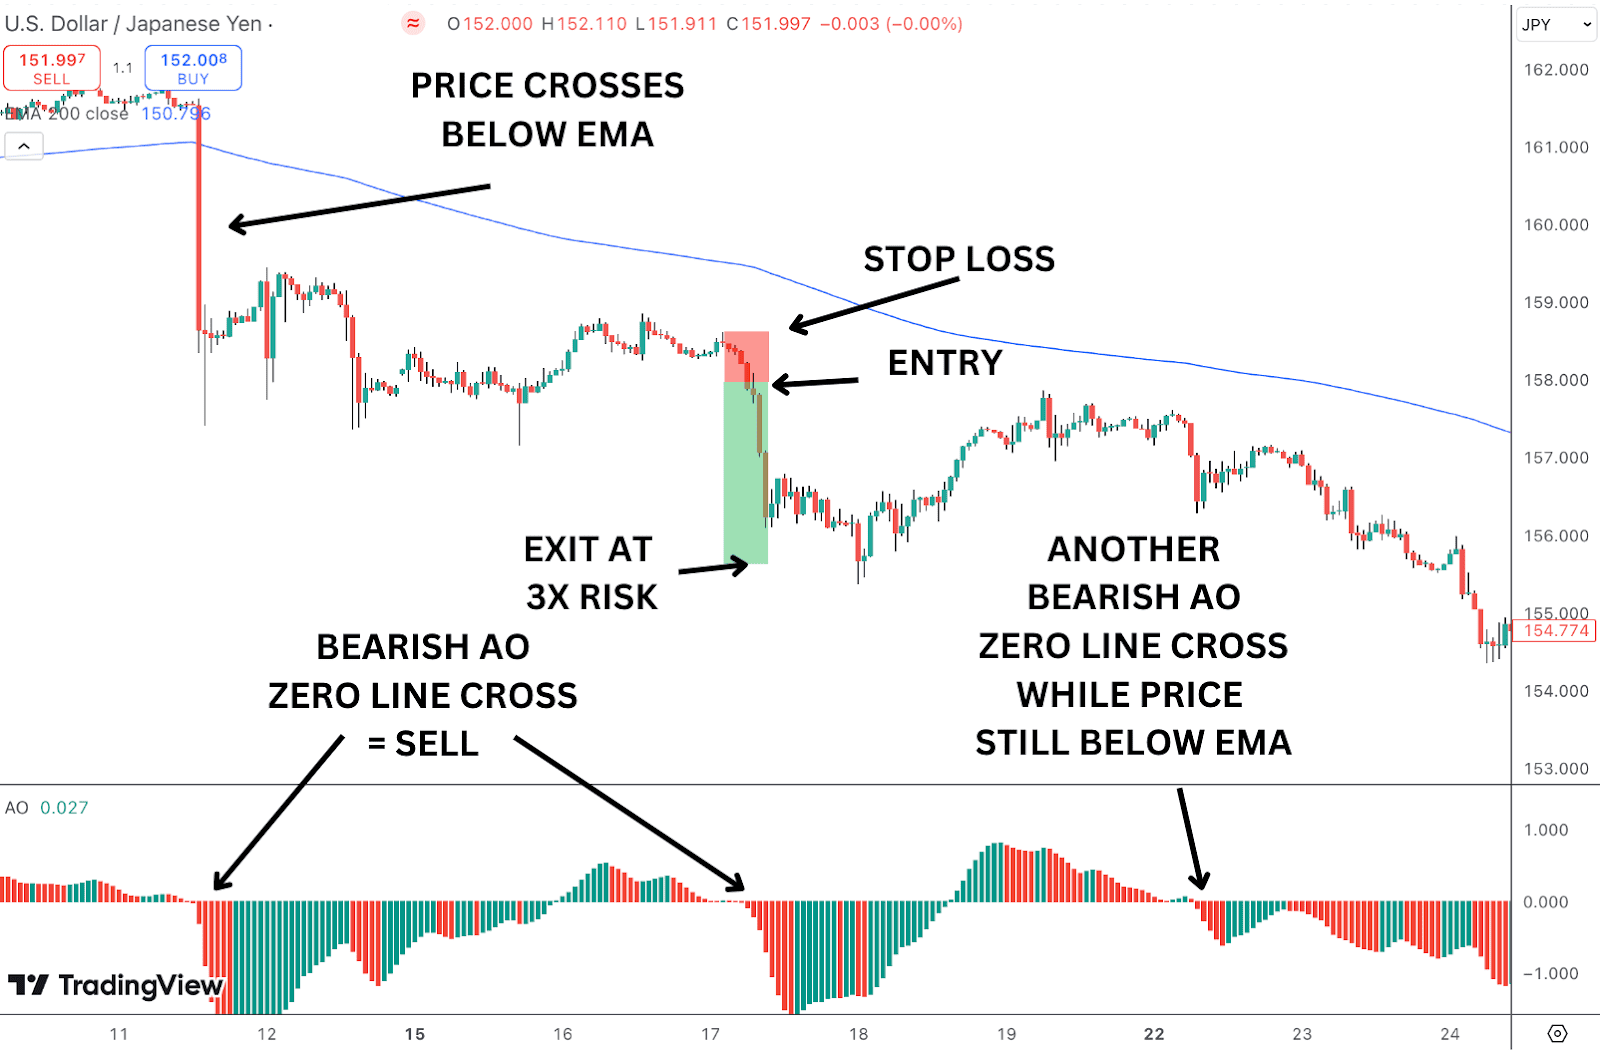
- Exiting Trades: If the AO indicator begins to reverse (e.g., crossing below the zero line in an uptrend or crossing above in a downtrend) while price is still near the EMA, this could indicate a weakening trend and a possible exit point. Simple moving averages can also be used alongside or instead of EMAs.
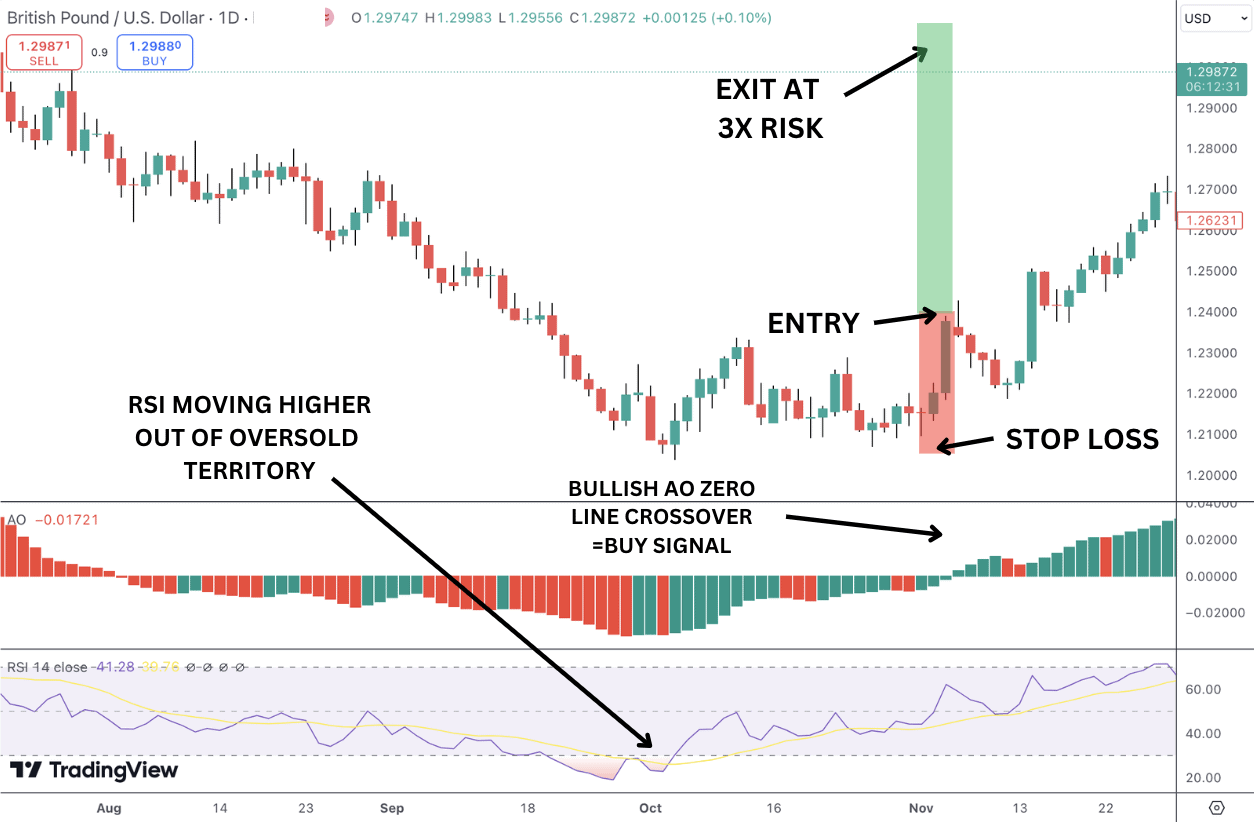
Awesome Oscillator with RSI
The AO indicator measures momentum by comparing the short-term and long-term averages of the market, while the RSI measures the speed and change of price movements to identify overbought or oversold conditions. As such, the two indicators compliment each other nicely and when both indicators align, they can give a strong trading signal:
- Bullish Setup: If the AO crosses above the zero line (indicating bullish momentum) and the RSI is rising from oversold levels (e.g., below 30), it suggests that the market is gaining momentum after being oversold—this can be a strong buy signal.
- Bearish Setup: If the AO crosses below the zero line (indicating bearish momentum) and the RSI is falling from overbought levels (e.g., above 70), it signals that bearish momentum is picking up after the market was overbought—this can be a strong sell signal.
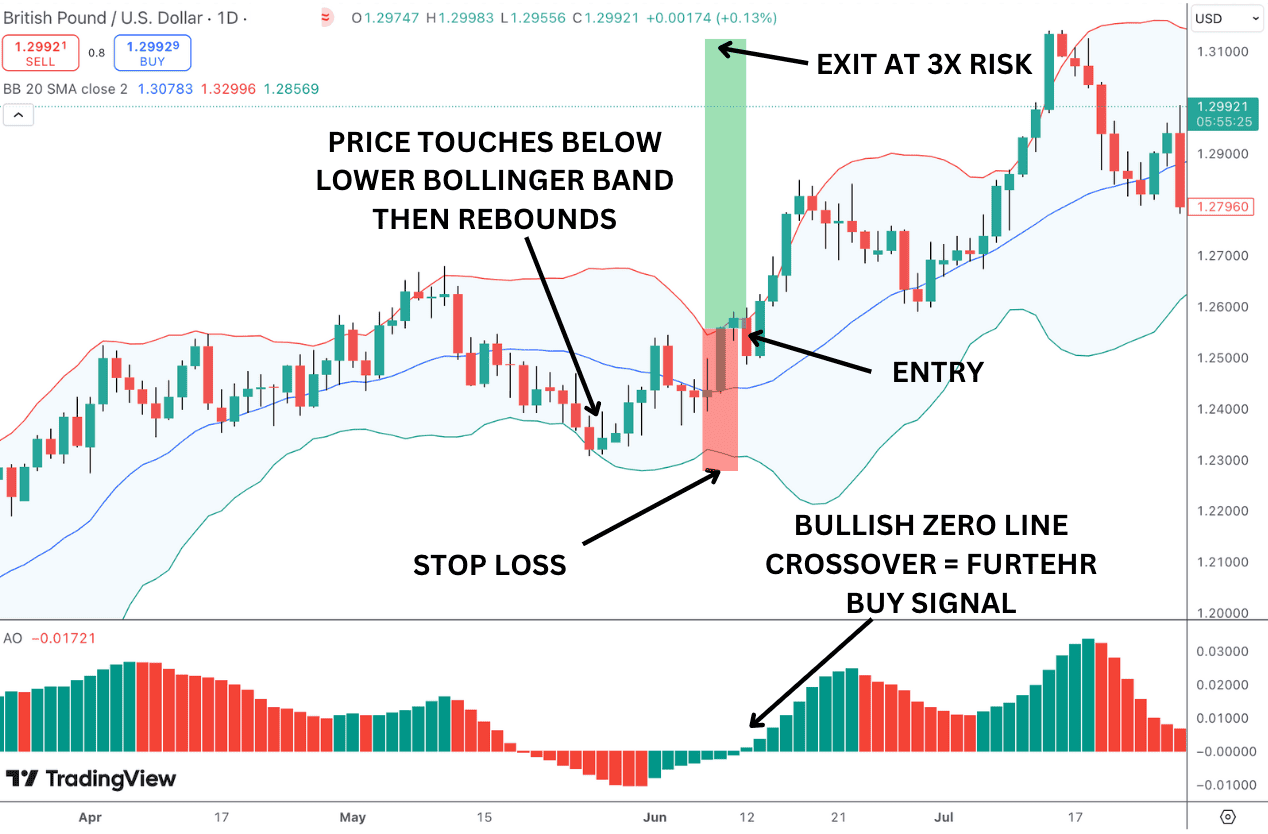
Awesome Oscillator with Bollinger Bands®
- Bullish Entry: Look for price to touch or break below the lower Bollinger Band while the AO is below the zero line and starting to rise. A bullish saucer can be used as an initial bull signal. When the awesome oscillator crosses above the zero line, it confirms a bullish momentum shift, giving traders a signal to go long.
- Bearish Entry: If price touches or breaks above the upper Bollinger Band and the awesome oscillator is above the zero line but starts to fall, creating a bearish saucer. This signals weakening bullish momentum. When the AO crosses below the zero line, it confirms a bearish momentum shift, giving us a sell signal to go short.
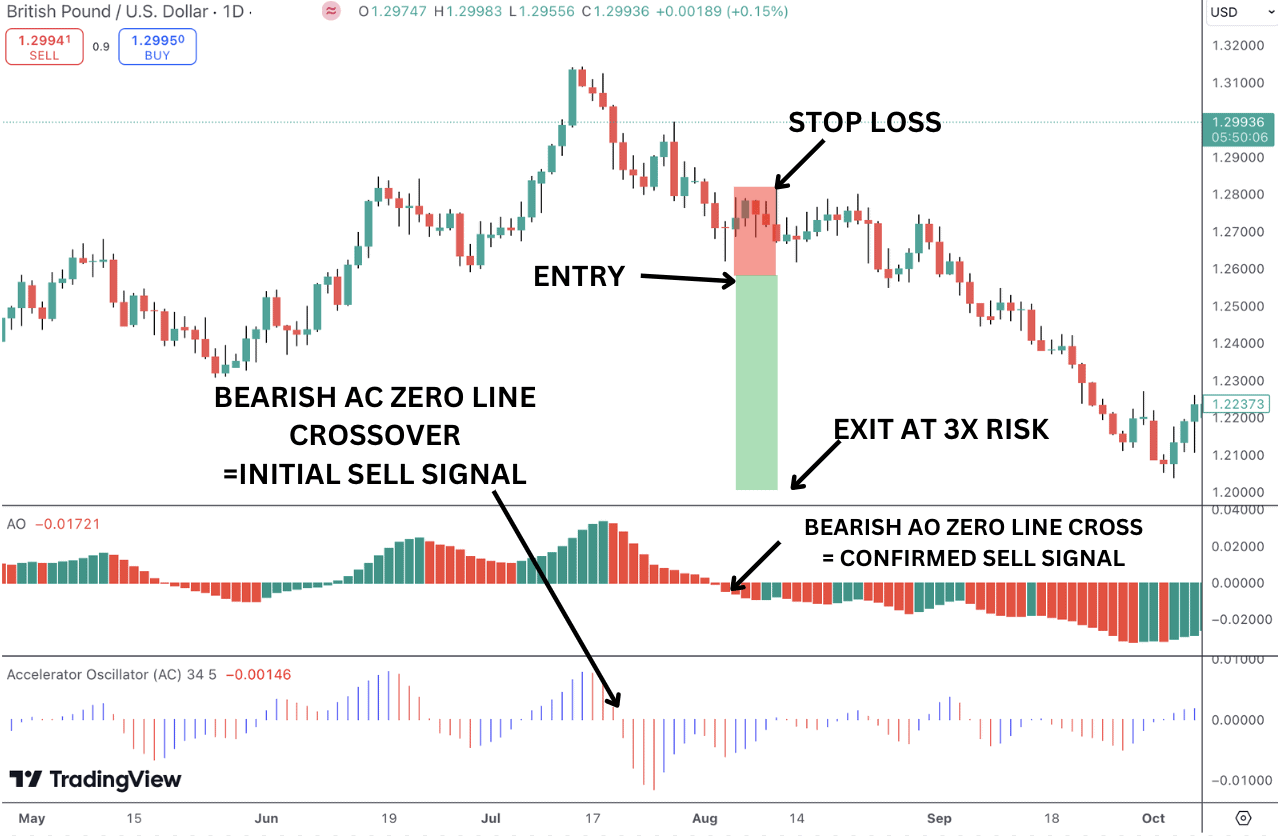
Awesome Oscillator with Accelerator Oscillator
Combining both the awesome oscillator and the accelerator oscillator (AC) is a great approach for improving your ability to spot momentum shifts and potential trend reversals. Interesting fact, both indicators are designed by Bill Williams. As with the awesome oscillator, the AC focuses on momentum also, so using them together provides more nuanced insights into market conditions.
- Bullish Entry: When the awesome oscillator crosses above the zero line and the AC is above its zero line, it confirms that bullish momentum is both present and accelerating. This is a strong buy signal.
- Bearish Entry: When the awesome oscillator crosses below the zero line and the AC is below its zero line, it indicates that bearish momentum is present and gaining speed, making it a good time to consider a sell signal. We can see a bearish example in GBPUSD below.
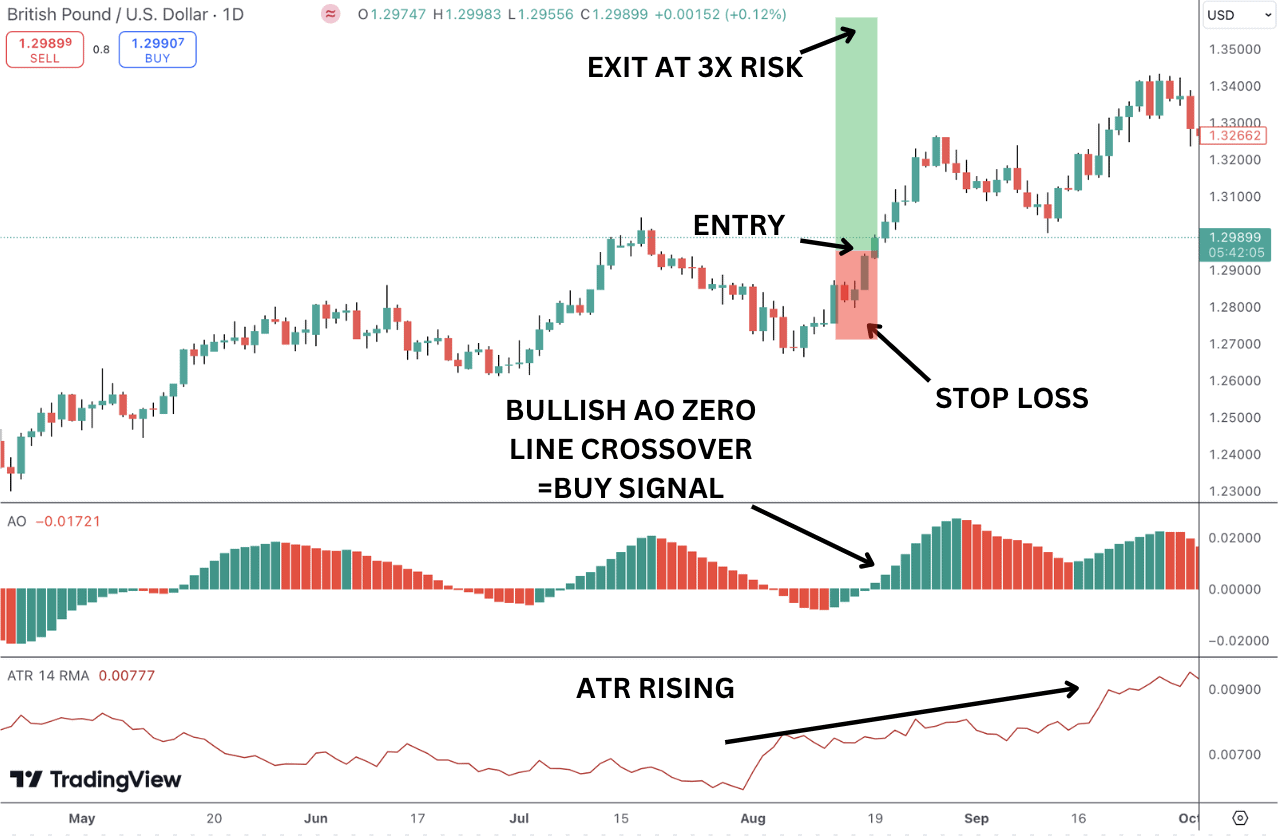
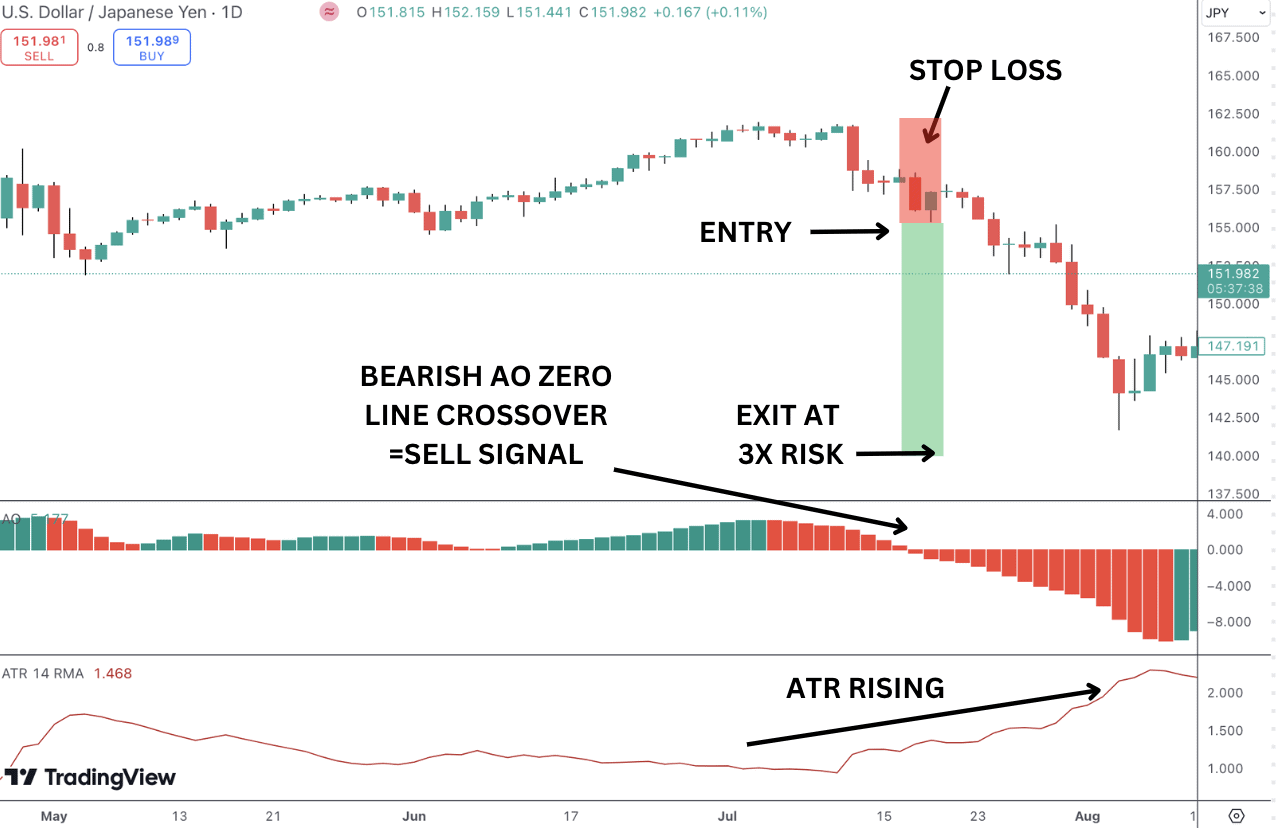
Awesome Oscillator with Average True Range (ATR)
Given that the awesome oscillator provides insights into momentum in the market, combining it with the average true range (ATR) indicator can help further strengthen a trader’s view of price action through adding in volatility analysis.
The ATR measures market volatility by averaging the range of price movements over a specified period, typically 14 periods. Higher ATR values suggest increased volatility, while lower ATR values indicate a calm or sideways market.
- Bullish Setup: If the awesome oscillator crosses above the zero line, signaling increasing bullish momentum, and the ATR is rising, it suggests that the trend is gaining strength with increasing volatility. This combination signals a potential opportunity to enter a long trade with a strong price move. We can see a bullish example in GBPUSD below.
- Bearish Setup: If the awesome oscillator crosses below the zero line, indicating increasing bearish momentum, and the ATR is rising, it confirms that the downtrend is strong, backed by increasing volatility, providing a good opportunity for a short trade. The USDJPY chart provides a good illustration of this below.
Awesome Oscillator as a Divergence indicator
One of the most effective ways to use the awesome oscillator is to find tradable divergence in the market. The beauty of this technique is that because it is a more advanced way of using the indicator it can help traders find better entry points to market than traders who are noy using these technical analysis methods.
Bullish Divergence: When price is making lower lows, but the awesome oscillator is making higher lows. This suggests that bearish momentum is weakening and price is vulnerable to a reversal higher, alerting us to look for buying opportunities such as a bullish zero line crossover.
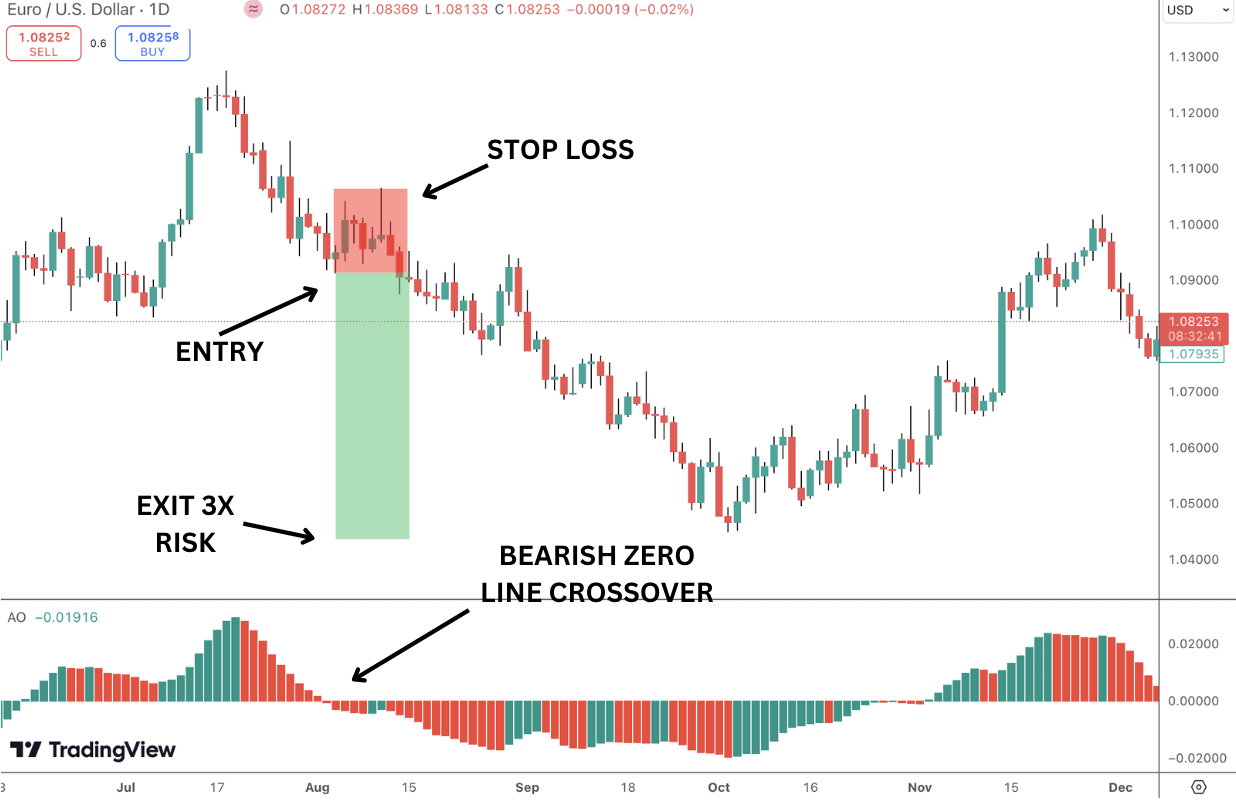
Bearish Divergence: When price is making higher highs, but the awesome oscillator is making lower highs. This indicates that bullish momentum is fading and price is vulnerable to a move lower, alerting us to look for selling opportunities such as a bearish zero line crossover. We can see an example of selling a zero line crossover after bearish divergence in the EURUSD illustration below.
Awesome Oscillator Scalping strategy
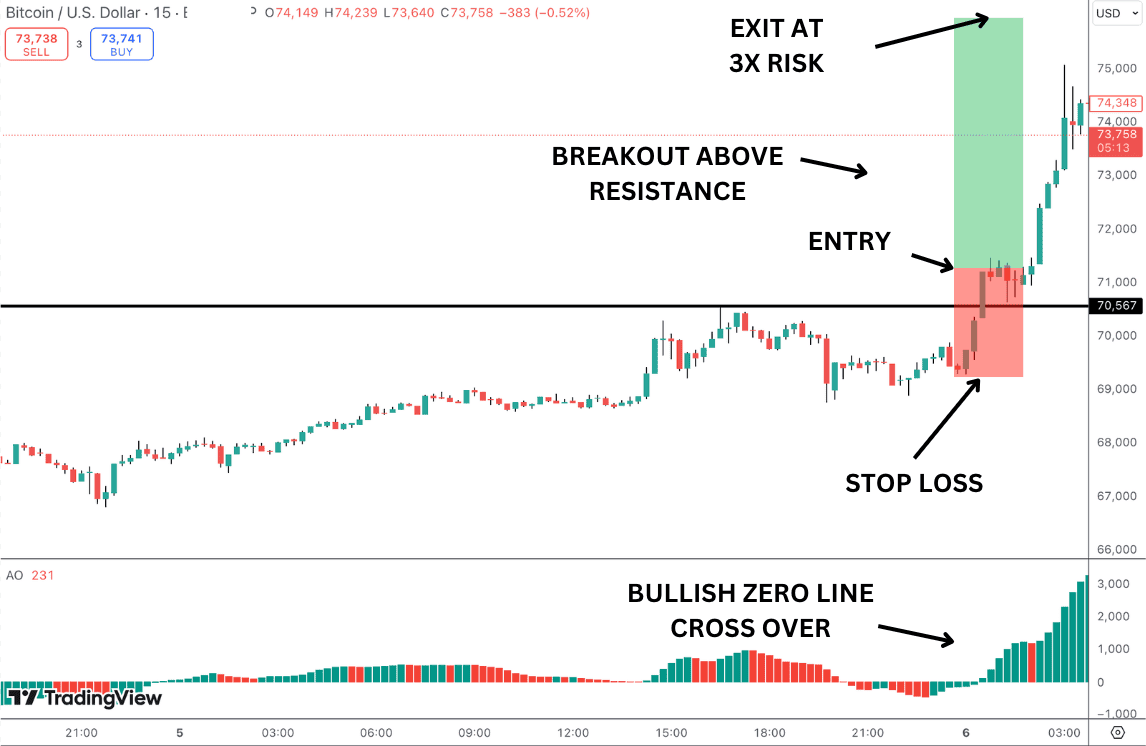
Using the awesome oscillator to scalp is an effective way to capitalize on short-term momentum shifts in the market. Whether on the higher time-frames or lower time frames, the methods for using the indicator are the same. When scalping, however, traders are trading brief price shifts on the lower time frames. In the Bitcoin example below we can see a bullish zero line crossover as price breaks out above resistance on the M15 chart. Traders can execute this in the same way they would bullish zero line crossover on the higher time frames.
Advantages of The Awesome Oscillator
- Simple Momentum Analysis: The AO offers a straightforward way to analyze market momentum by showing the difference between two moving averages (5-period and 34-period), making it easy to identify shifts in bullish or bearish momentum.
- Effective Trend Reversals: The AO is useful for spotting trend reversals through zero-line crosses and divergences, helping traders anticipate market changes and time their entries or exits.
- Visual Clarity: With its simple histogram design, using green and red bars, the AO visually represents momentum changes clearly, making it easy to spot growing or weakening trends at a glance.
Disadvantages of The Awesome Oscillator
- Lagging Indicator: Since the awesome oscillator is based on moving averages, it tends to lag behind price movements, which can result in delayed signals, especially in fast-moving markets.
- Limited in Range-Bound Markets: The awesome oscillator works best in trending markets. In choppy or range-bound conditions, it can generate false signals, making it harder to differentiate between real and fake momentum shifts.
- No Overbought/Oversold Signals: Unlike other oscillators like the RSI or Stochastic, the awesome oscillator doesn’t provide clear overbought or oversold levels, which limits its ability to assess potential reversal zones in extreme market conditions.
Practical Applications of the Awesome Oscillator
The Awesome Oscillator is a versatile tool that can be applied in various ways to enhance trading strategies. Here are some practical applications of the Awesome Oscillator:
- Trend Confirmation: One of the primary uses of the Awesome Oscillator is to confirm trends through the zero line crossover. When the AO crosses above the zero line, it signals that short-term momentum is stronger than long-term momentum, indicating a bullish trend. Conversely, a crossover below the zero line suggests a bearish trend, as short-term momentum weakens compared to long-term momentum.
- Momentum Analysis: The AO is an excellent tool to measure market momentum. By analyzing the histogram bars, traders can gauge the strength of the current trend. A rising histogram indicates increasing bullish momentum, while a falling histogram suggests decreasing momentum. This helps traders understand the underlying market dynamics and make informed decisions.
- Divergence Analysis: Divergences between the price action and the AO can be powerful signals of potential reversals. A bullish divergence occurs when the price makes a new low, but the AO makes a higher low, indicating that bearish momentum is weakening and a reversal to the upside may be imminent. Similarly, a bearish divergence happens when the price makes a new high, but the AO makes a lower high, signaling that bullish momentum is fading and a potential downside reversal is on the horizon.
- Scalping: For traders who prefer short-term trading strategies, the AO can be used for scalping by identifying brief momentum shifts. Patterns like the bullish saucer, where the histogram shifts from red to green above the zero line, can signal a short-term buying opportunity. Conversely, a bearish saucer pattern, where the histogram shifts from green to red below the zero line, can indicate a short-term selling opportunity. These patterns help scalpers capitalize on quick price movements.
What Indicators Work Best with the Awesome Oscillator?
The truth is, there is no single particular indicator that works best with the awesome oscillator. From the MACD to simple moving averages, there are many indicators which are typically combined with it and can work very well, which we have explored in this guide. The best advice is to spend time exploring different indicator combinations and see which works best for you. Ultimately, focusing on solid trade management and risk management protocols should be the core of any trading strategy you employ.
Awesome Oscillator vs MACD
One of the most popular indicators to combine with the awesome oscillator is the Moving Average Convergence Divergence (MACD). Both indicators measure momentum, but they do so in slightly different ways, and using them together can provide more comprehensive insights:
- Awesome Oscillator for Trend Confirmation: The awesome oscillator helps identify shifts in market momentum, such as when it crosses above or below the zero line, signalling bullish or bearish sentiment.
- MACD for Timing: The MACD can confirm those signals and provide additional insights into the strength of the trend, especially when used with its signal line or by identifying MACD divergences. It also gives clearer entries with its histogram and crossovers. As such, it is typically a more nuanced tool for timing entries and exits in line with the trend information given by the AO.
By combining the awesome oscillator with the MACD, traders can get a stronger confirmation of trend shifts or continuations and avoid false signals that either indicator might give when used alone. This combination works particularly well in trending markets, helping with both momentum confirmation and timing of entries and exits.
Awesome Oscillator vs Stochastic Oscillator
While both the Awesome and Stochastic oscillators appear as separate indicators in a window pane outside of the price chart, they have some differences to be aware of.
First, the AO is an unbounded indicator. The histogram readings can go extremely high or extremely low. Stochastic, on the other hand, is a bounded indicator with a maximum value of 100 and minimum value of 0.
Also, the AO has just one output reading…the value of the histogram bar. The stochastic oscillator has two output lines on the chart. Therefore, how you read the indicators will also be different. In AO, you’ll look for patterns like twin peaks, saucer, and zero line cross overs. In Stochastic, signals come when the stochastic %K line crosses the %D line depending on its location between 0 and 100.
FAQ
What are the best Awesome Oscillator settings?
The default settings of the awesome oscillator are generally considered the best for most traders. These settings use:
- 5-period Simple Moving Average (SMA) for short-term momentum.
- 34-period Simple Moving Average (SMA) for long-term momentum.
How reliable is the Awesome Oscillator?
The awesome oscillator can be a reliable tool for measuring momentum and spotting potential trend reversals, especially in trending markets. However, because it’s a lagging indicator, it may give delayed signals, causing traders to enter or exit trades after significant price moves. It can also generate false signals in choppy markets, so it’s wise to use it alongside other indicators like the MACD or RSI for better accuracy.
Is Awesome Oscillator a leading or lagging indicator?
The awesome oscillator is considered a lagging indicator. It is based on moving averages, specifically the difference between a 5-period and a 34-period simple moving average of the midpoint of each candle. Because it relies on historical price data, the AO reacts to price movements rather than predicting them. This means that while it can provide valuable insights into momentum and potential trend reversals, it may give signals after significant price changes have already occurred.
What is the origins of Awesome Oscillator
The indicator was developed by Bill Williams, a well-known trader, in the 1990s. Williams aimed to create an indicator that could provide a clear visual representation of market momentum and help traders identify potential trend reversals and continuations.
What common mistakes should traders avoid when using the Awesome Oscillator?
- First, it’s crucial not to ignore the overall market context; the awesome oscillator indicator is more reliable in trending markets than in choppy conditions, so always consider the broader trend before relying on its signals.
- Second, while zero line crosses are important, focusing solely on them can lead to missed opportunities or false signals. It’s essential to combine awesome oscillator indicator signals with other indicators for more reliable trade decisions.
- Lastly, many traders neglect proper risk management, getting caught up in potential trades without setting stop-loss orders or clear profit targets, which can jeopardize their capital. By avoiding these pitfalls, traders can enjoy more effective, awesome oscillator trading.
How is the Awesome Oscillator calculated using charts and candlesticks?
The awesome oscillator is calculated by subtracting the 34-period simple moving average (SMA) from the 5-period SMA. The big difference from a standard calculation is awesome oscillator uses the median price points (the high plus low price divided by 2) of each candle rather than just the closing price.


