


Written by:

Reviewed by:

- January 30, 2026
- 28 min read
Supply and Demand Trading Guide
If you have ever watched price react strongly at certain areas and reverse, you have already seen supply and demand in action. These reactions happen when price reaches areas where strong buying or selling orders were placed in the past.
Supply and demand trading focuses on finding these important areas on the chart and waiting for price to return to them before looking for entries. Instead of placing trades in random areas and relying only on price action, the supply and demand approach gives traders clearer and safer areas where price is more likely to react.
In this guide, you will learn how supply and demand zones work, how to mark them correctly on a chart, and how to use them to enter trades with better structure, clearer risk control, and higher quality trade setups.
What is Supply and Demand Trading?
Let’s break down supply and demand and understand where it comes from:
What Are Supply and Demand Zones?
Supply and demand zones are areas where price moved away with strong momentum. This signals a clear imbalance between buyers and sellers, where one side clearly outperforms the other. These areas often reflect strong interest from traders at those prices, increasing the likelihood of a reaction if price returns.
In simple terms, demand zones act as support, while supply zones act as resistance, within a price range. What is often missed is what happens before that move. Price usually whipsaws in a controlled manner. In other words, it consolidates.
This is not because nothing is happening, but because active positioning is taking place. Larger participants build exposure gradually, as entering too quickly would push prices too far and worsen their average entry.
Once enough positioning is complete, even a small imbalance can drive a sharp move away from the consolidation area. That area then becomes a supply or demand zone, representing unfinished business.
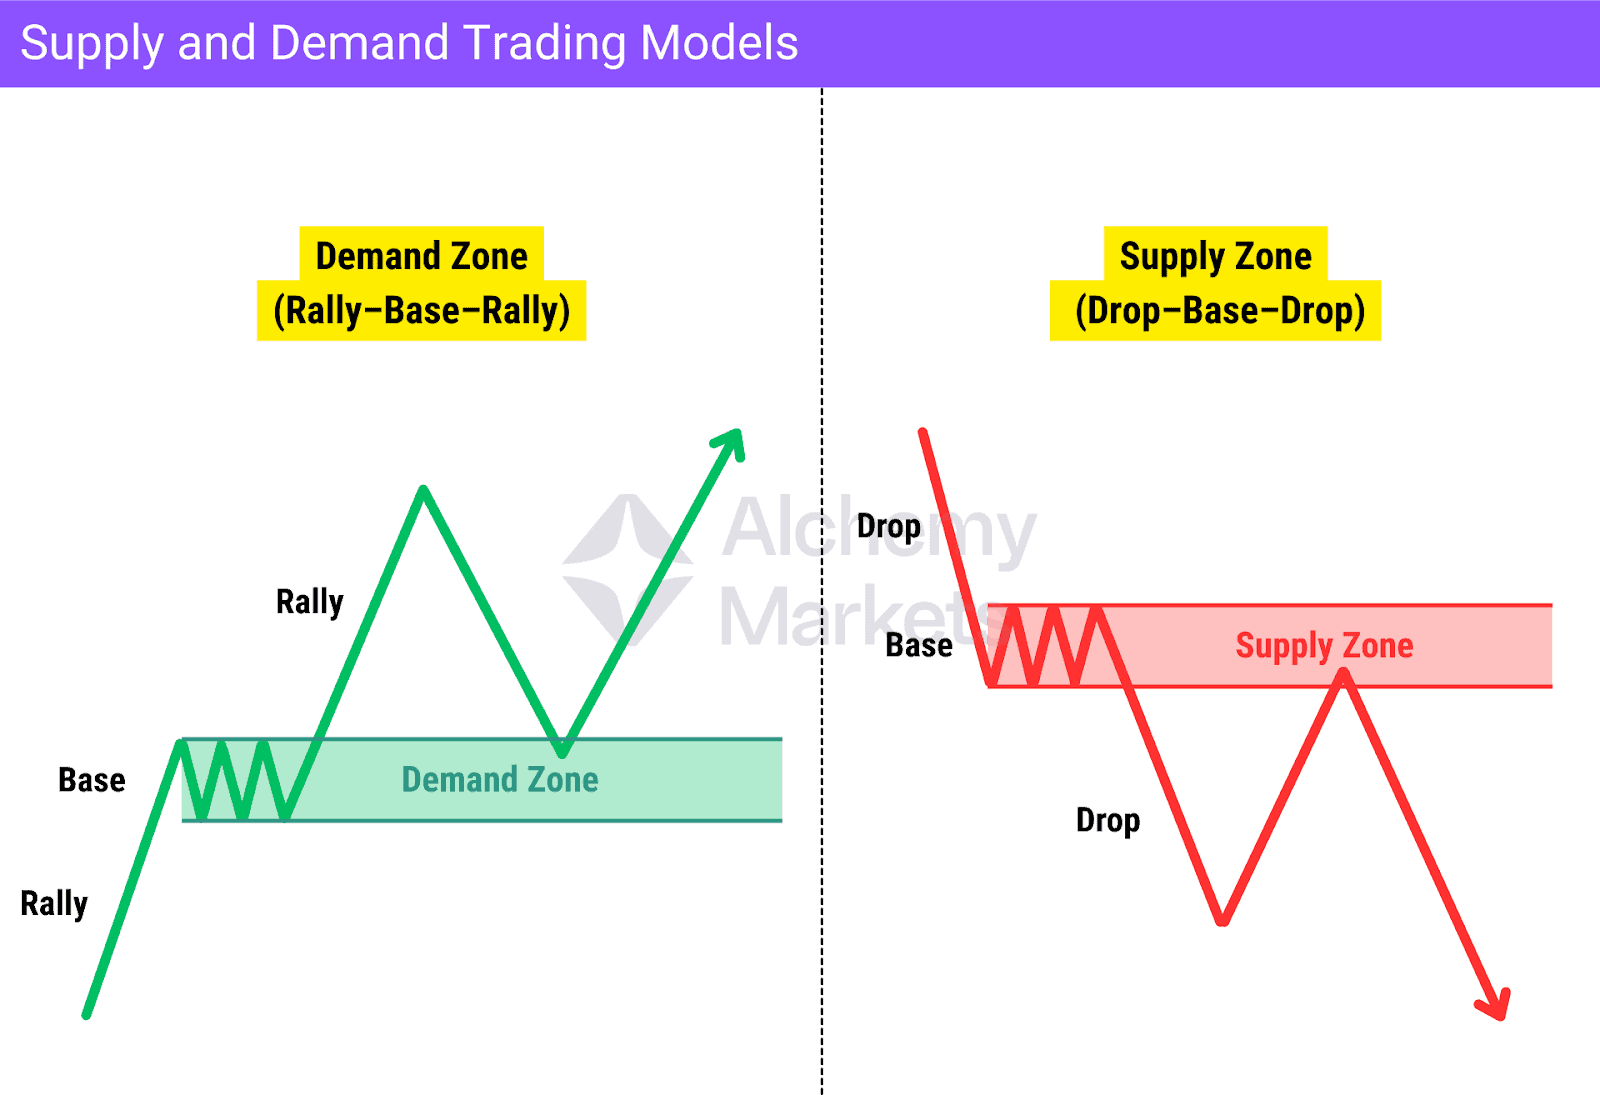
This is where the Rally–Base–Rally and Drop–Base–Drop structures come in:
- In a Rally–Base–Rally, the base forms a demand zone (support), where buyers absorb selling before price continues higher.
- In a Drop–Base–Drop, the base forms a supply zone (resistance), where sellers absorb buying before price continues lower.
When price returns to these zones, traders who missed entries, scaled in partially, or are defending prior positions are more likely to act. This is why these zones matter. They are not just technical levels, but areas shaped by positioning, memory, and trader psychology.
The Role of Accumulation and Distribution
Accumulation and distribution, described in early market theories such as Dow Theory and Wyckoff, explain why supply and demand zones exist in the first place. These phases occur when large market participants build or reduce positions before a major price move.
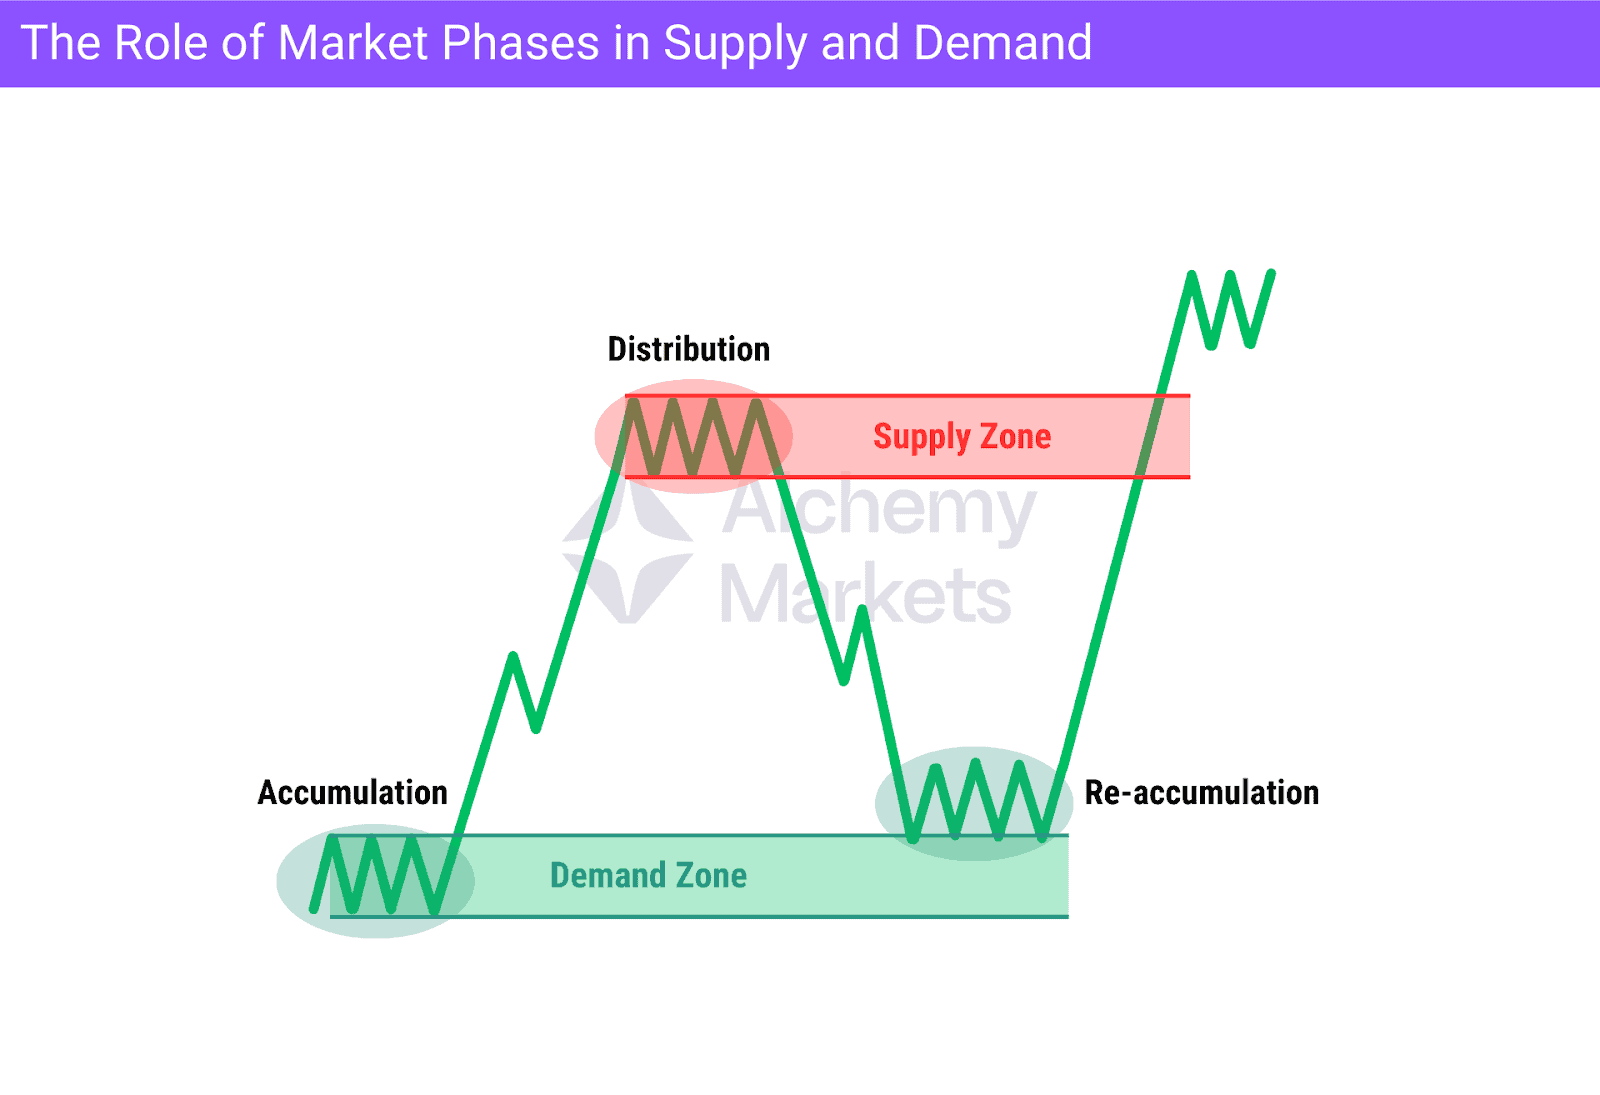
Accumulation happens when buyers enter the market at lower prices while price remains relatively stable. Once enough buying pressure is built, price leaves the area with strength, creating a demand zone.
Distribution works the same way but in reverse. Sellers gradually exit positions near higher prices. When selling pressure becomes dominant, price breaks lower, leaving behind a supply zone.
Redistribution and Reaccumulation
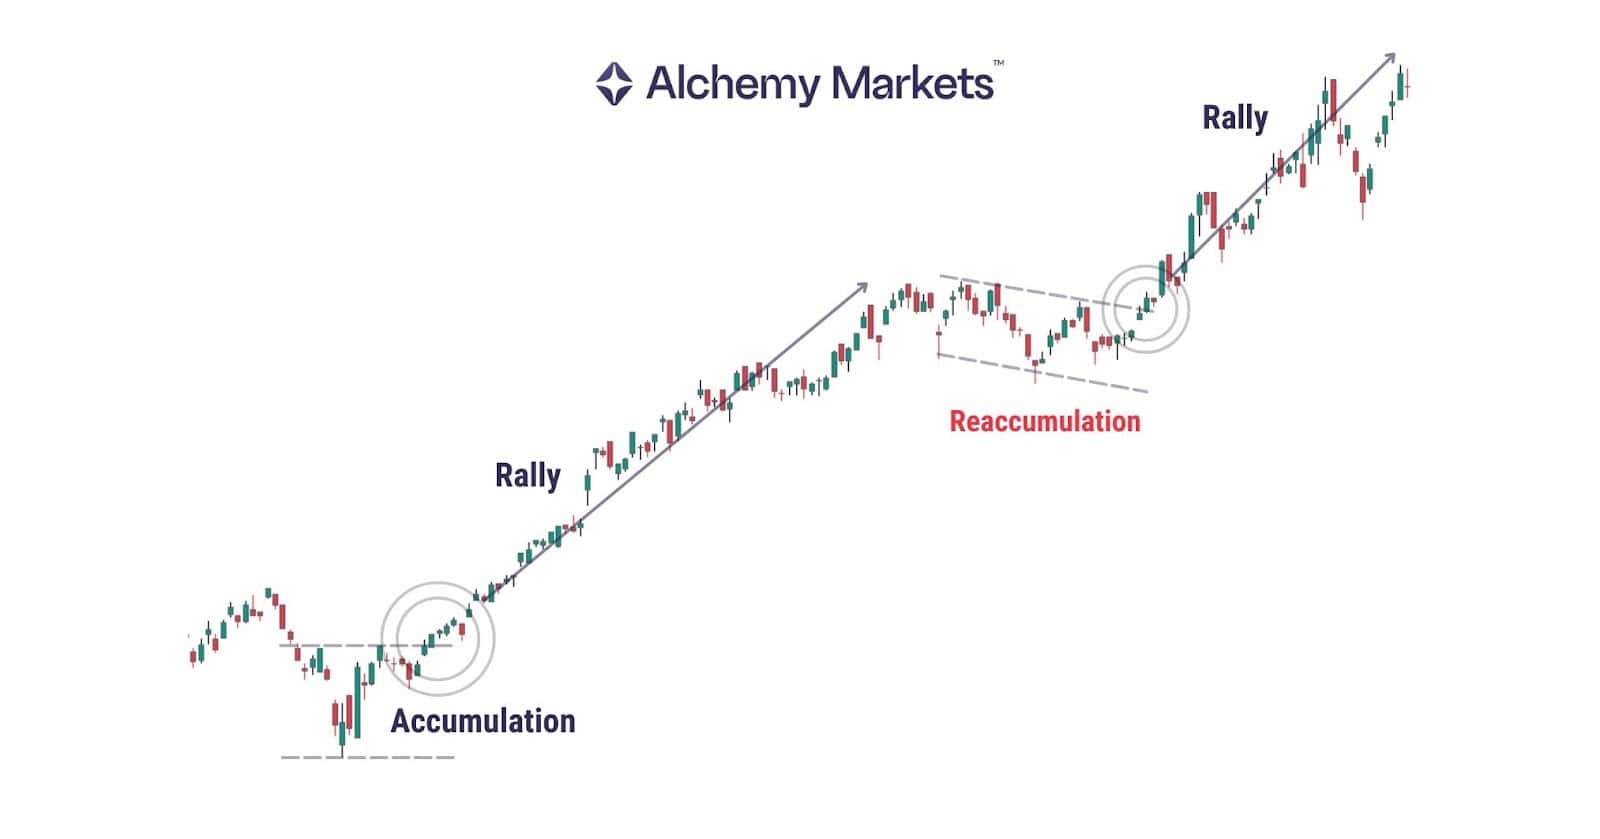
Markets rarely move in a straight line. After a strong move, price often pauses or consolidates before continuing in the same direction.
Reaccumulation occurs during an uptrend when price consolidates before pushing higher again. These zones show that demand is still present and that the trend may continue.
Redistribution appears during downtrends. Price pauses after a drop, creating the illusion of stability, while selling pressure quietly builds for the next downward move.
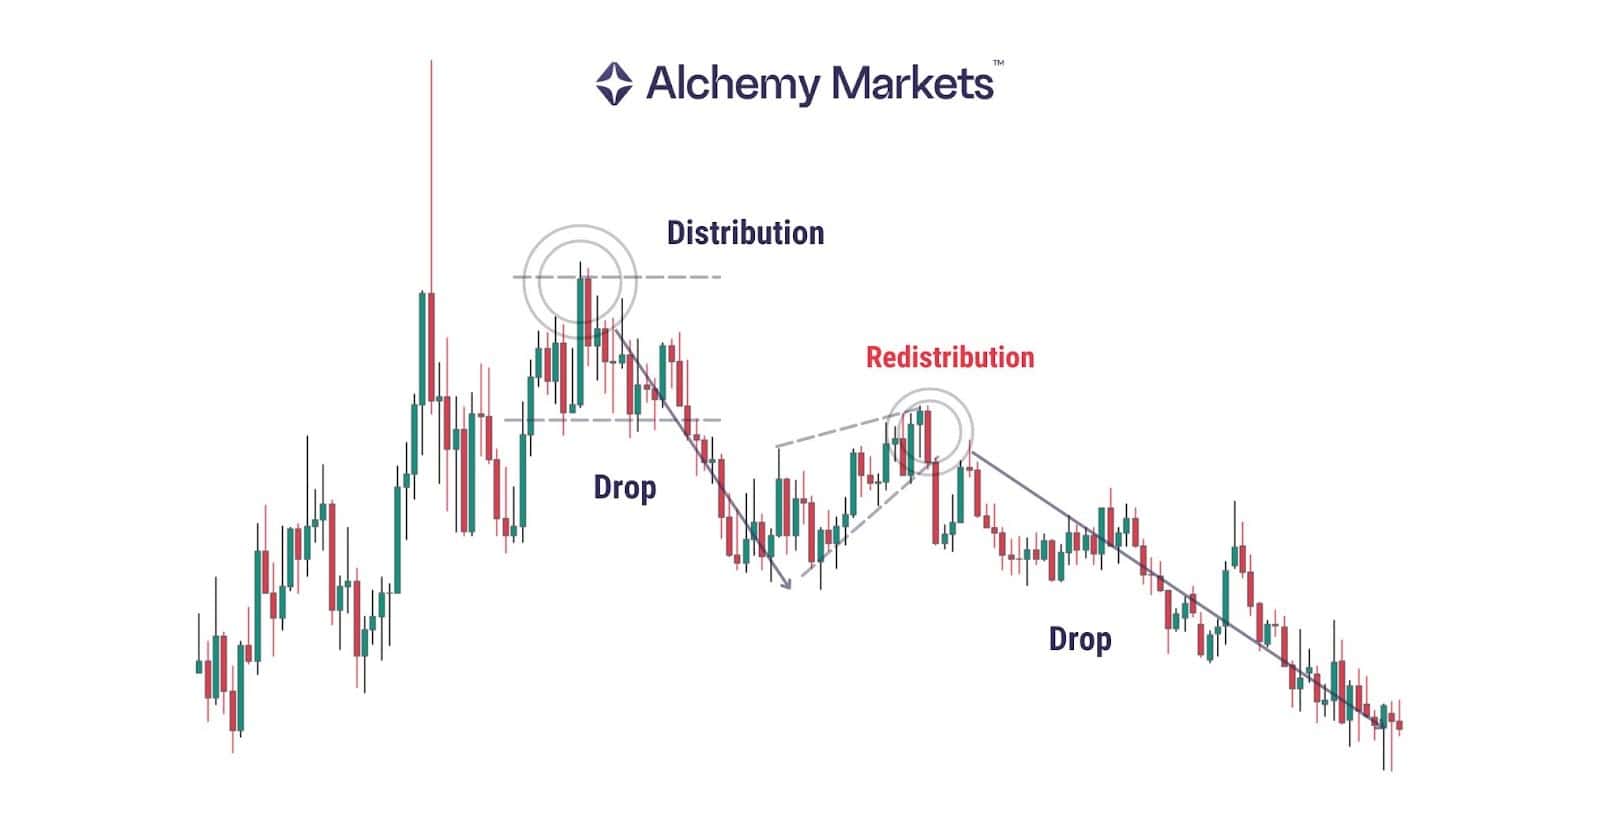
Understanding these phases helps traders avoid mistaking consolidations for reversals.
Laws of Supply
The law of supply describes the aggregate behaviour of sellers in a market.
As price rises, more traders are willing to sell. Higher prices encourage selling, meaning supply increases as previously unavailable contracts enter the market. When selling pressure outweighs buying interest, the market can move into a state of oversupply, reducing scarcity and pushing value lower.
Then, as prices fall, fewer traders are willing to sell at increasingly lower levels. At this point, supply decreases, selling pressure dries up, and conditions begin to favour demand.
Laws of Demand
The law of demand describes the aggregate behaviour of buyers in a market.
As price falls, more traders are willing to buy. Lower prices appear more attractive, perceived value improves, and demand increases as buyers step in. When buyers are able to absorb available selling pressure, the market enters a state of strong demand.
Then, as prices rise, the opposite occurs. Buying becomes less attractive at higher levels, demand decreases, and buying pressure weakens, allowing sellers to regain control.
4 Types of Supply and Demand Zones Every Trader Should Know
Not all supply and demand zones are equal. Some form aggressively and trigger immediate reactions, while others develop more gradually and require confirmation.
Understanding the different types of zones helps traders assess quality, probability, and risk before entering trades.
Aggressive Demand Zones
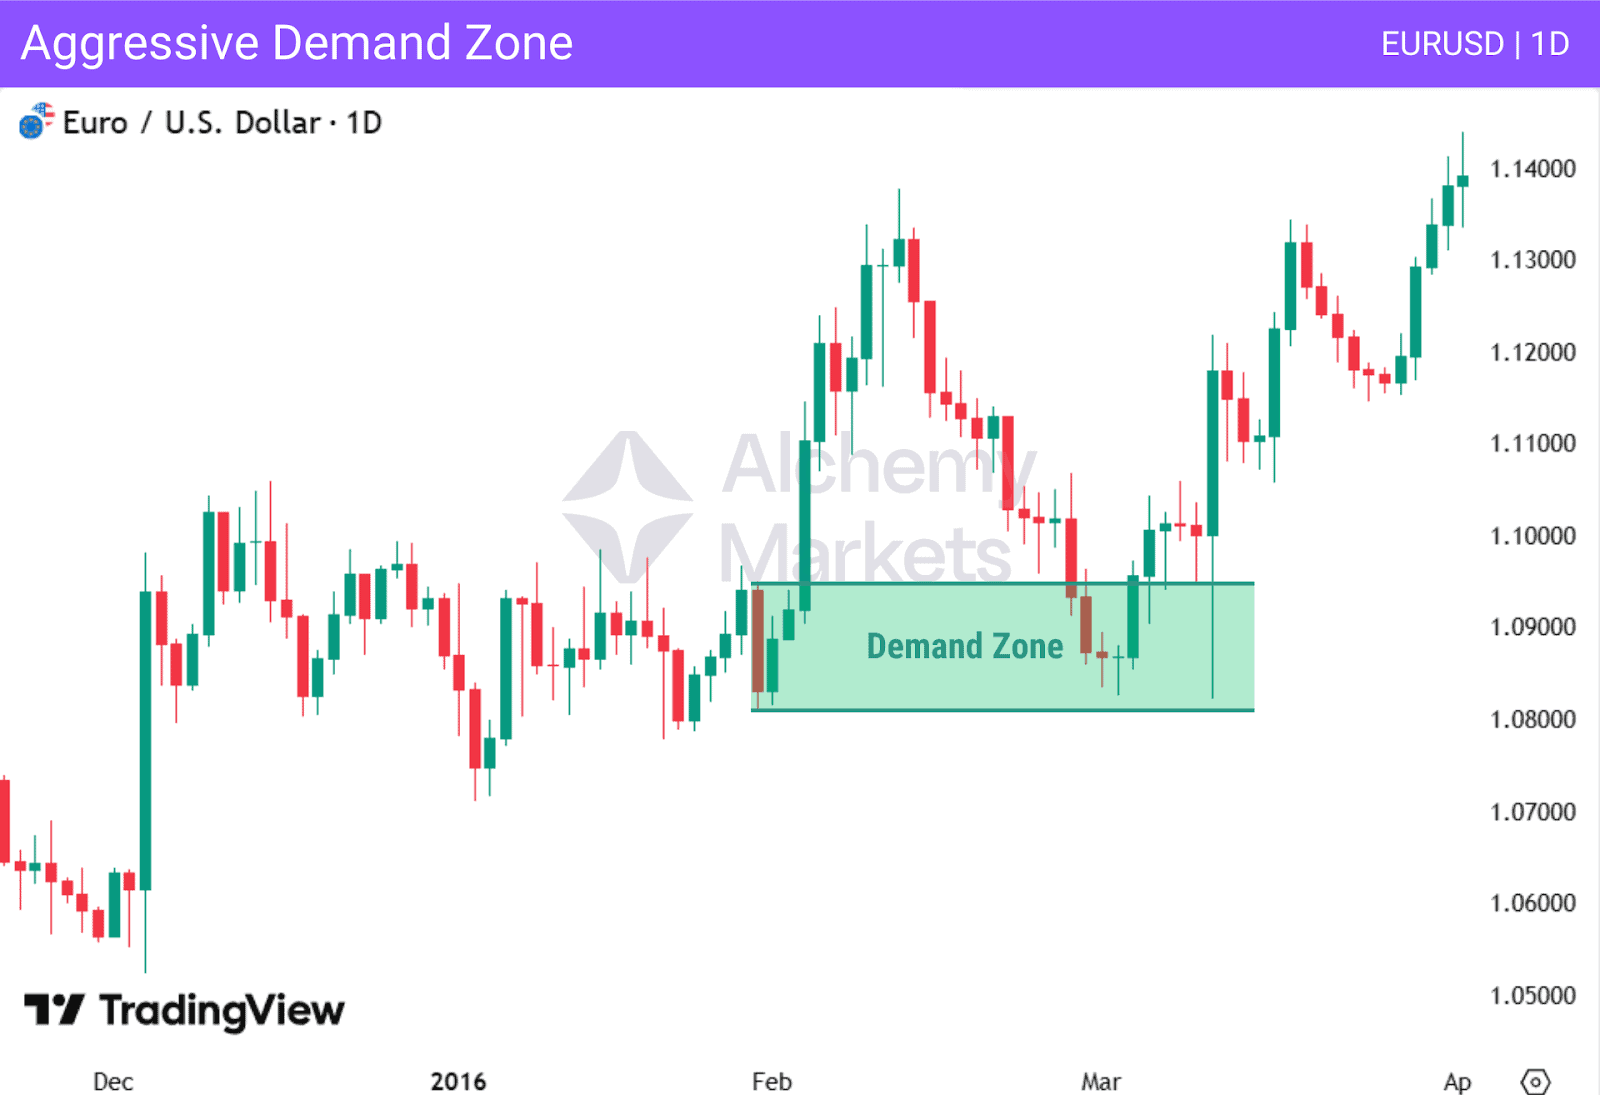
Aggressive demand zones form after sharp upward price moves, often following only a brief consolidation. They reflect strong buying pressure entering the market quickly and overwhelming sellers.
When price revisits these zones, reactions tend to be fast, but pullbacks are usually shallow.
As a result, traders often use limit entries with slightly wider stops, trading precision for momentum. These zones work best when the broader trend and market structure are already supportive.
Aggressive Supply Zones
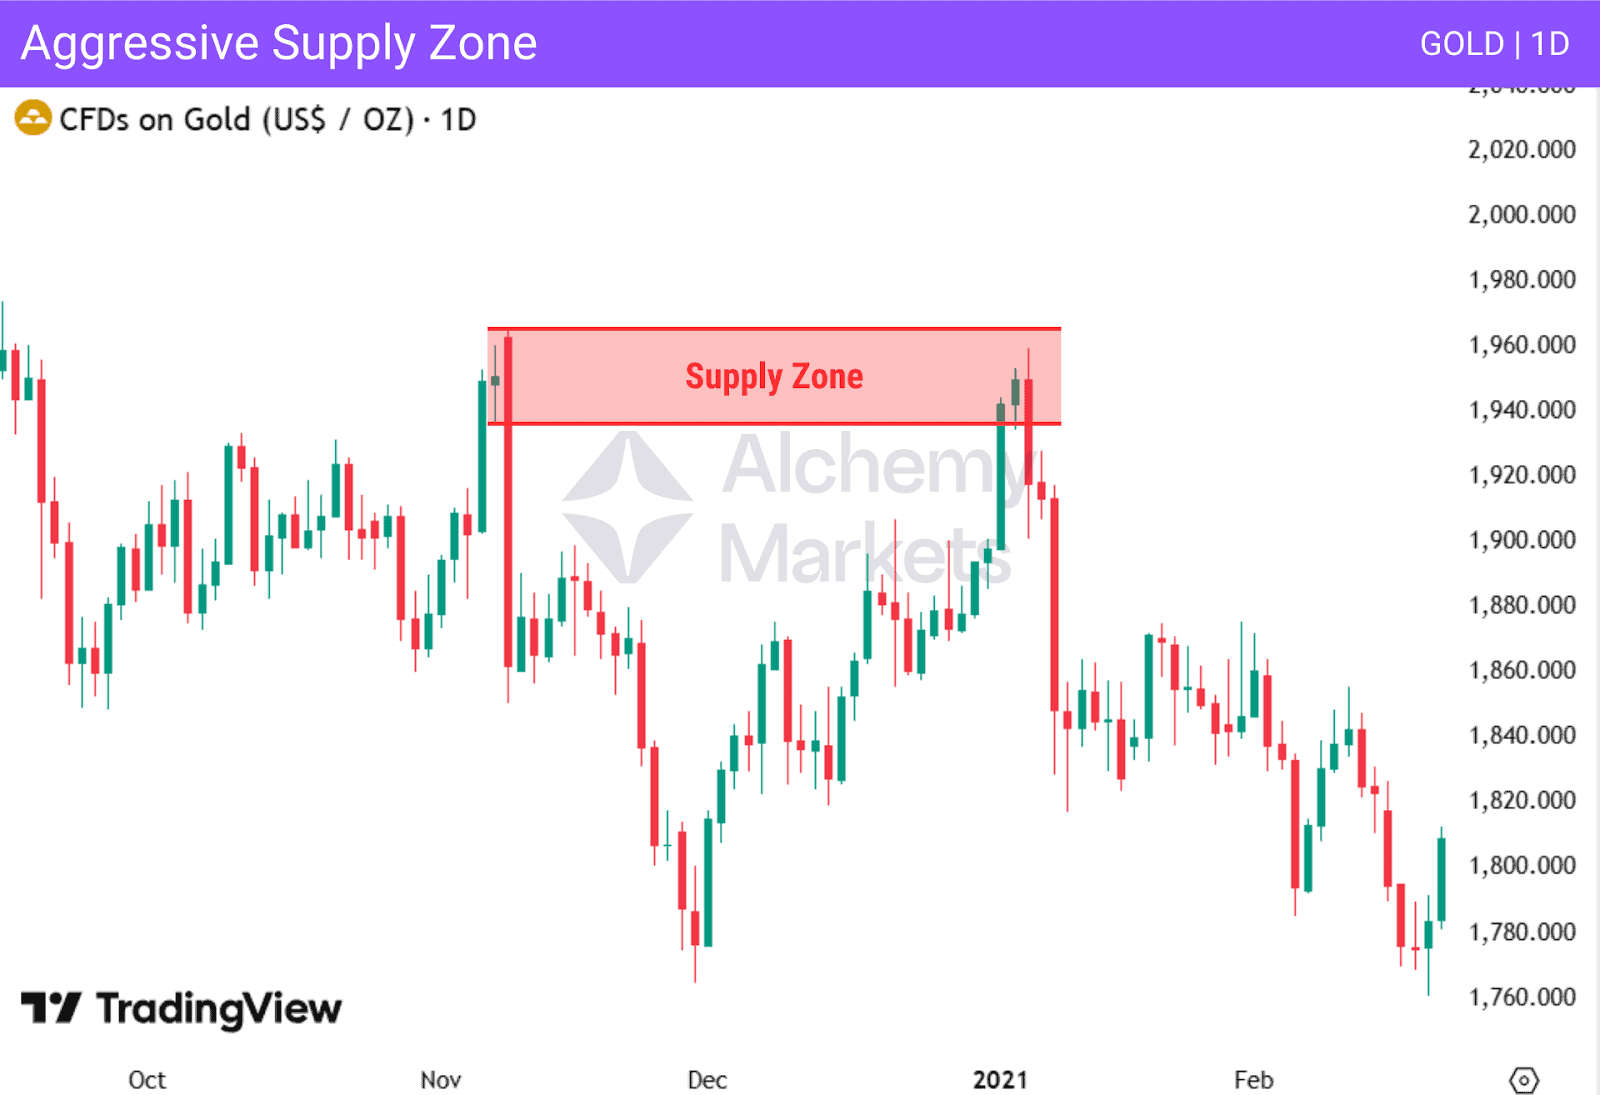
Aggressive supply zones form after rapid bearish price moves, where selling pressure overwhelms buyers with little hesitation. They often appear during strong downtrends or after failed bullish attempts.
When price revisits these zones, selling can return quickly, leading to sharp reversals.
Because they form fast, traders typically look for confirmation before committing, especially when price is pulling back against the dominant trend.
Strong High / Low Zones
Strong high and low zones form at major turning points in the market. These areas mark the origin of large price moves that lead to a clear shift in market structure, such as a trend reversal or a decisive continuation leg.
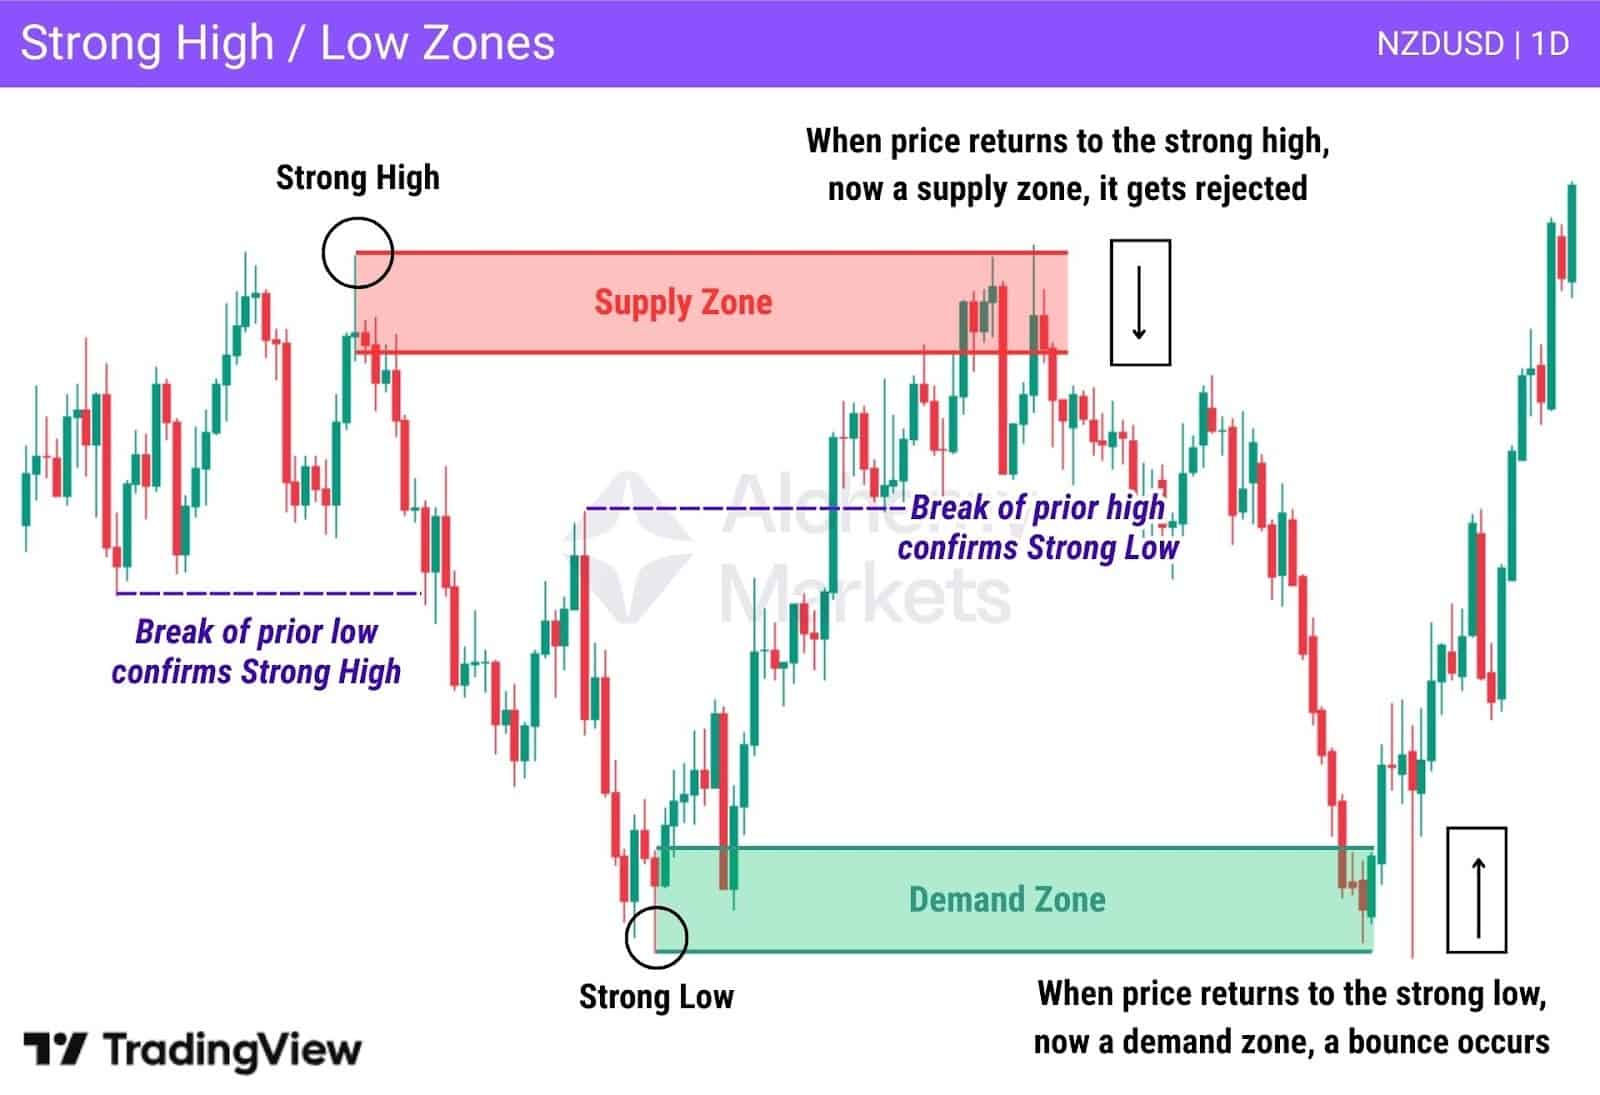
A strong high zone forms where selling pressure decisively took control, breaking prior structure and pushing price lower with follow-through.
A strong low zone forms where demand overpowered selling, driving price higher and establishing a new directional move. These zones are defined not just by rejection, but by the strength and continuation of the move that followed.
Because they are tied to structural change rather than short-term momentum, strong high and low zones tend to remain relevant longer than aggressive zones. When price revisits them, they often attract significant buying or selling interest.
Many traders prioritise strong high and low zones because they frequently align with key price levels, broader market structure, and areas where meaningful positioning previously occurred.
Fresh vs. Tested Zones
Supply and demand zones can be fresh or tested. Just like how it sounds, it’s either a completely un-revisited zone (Fresh), or has already served its function as a support or resistance once (Tested).
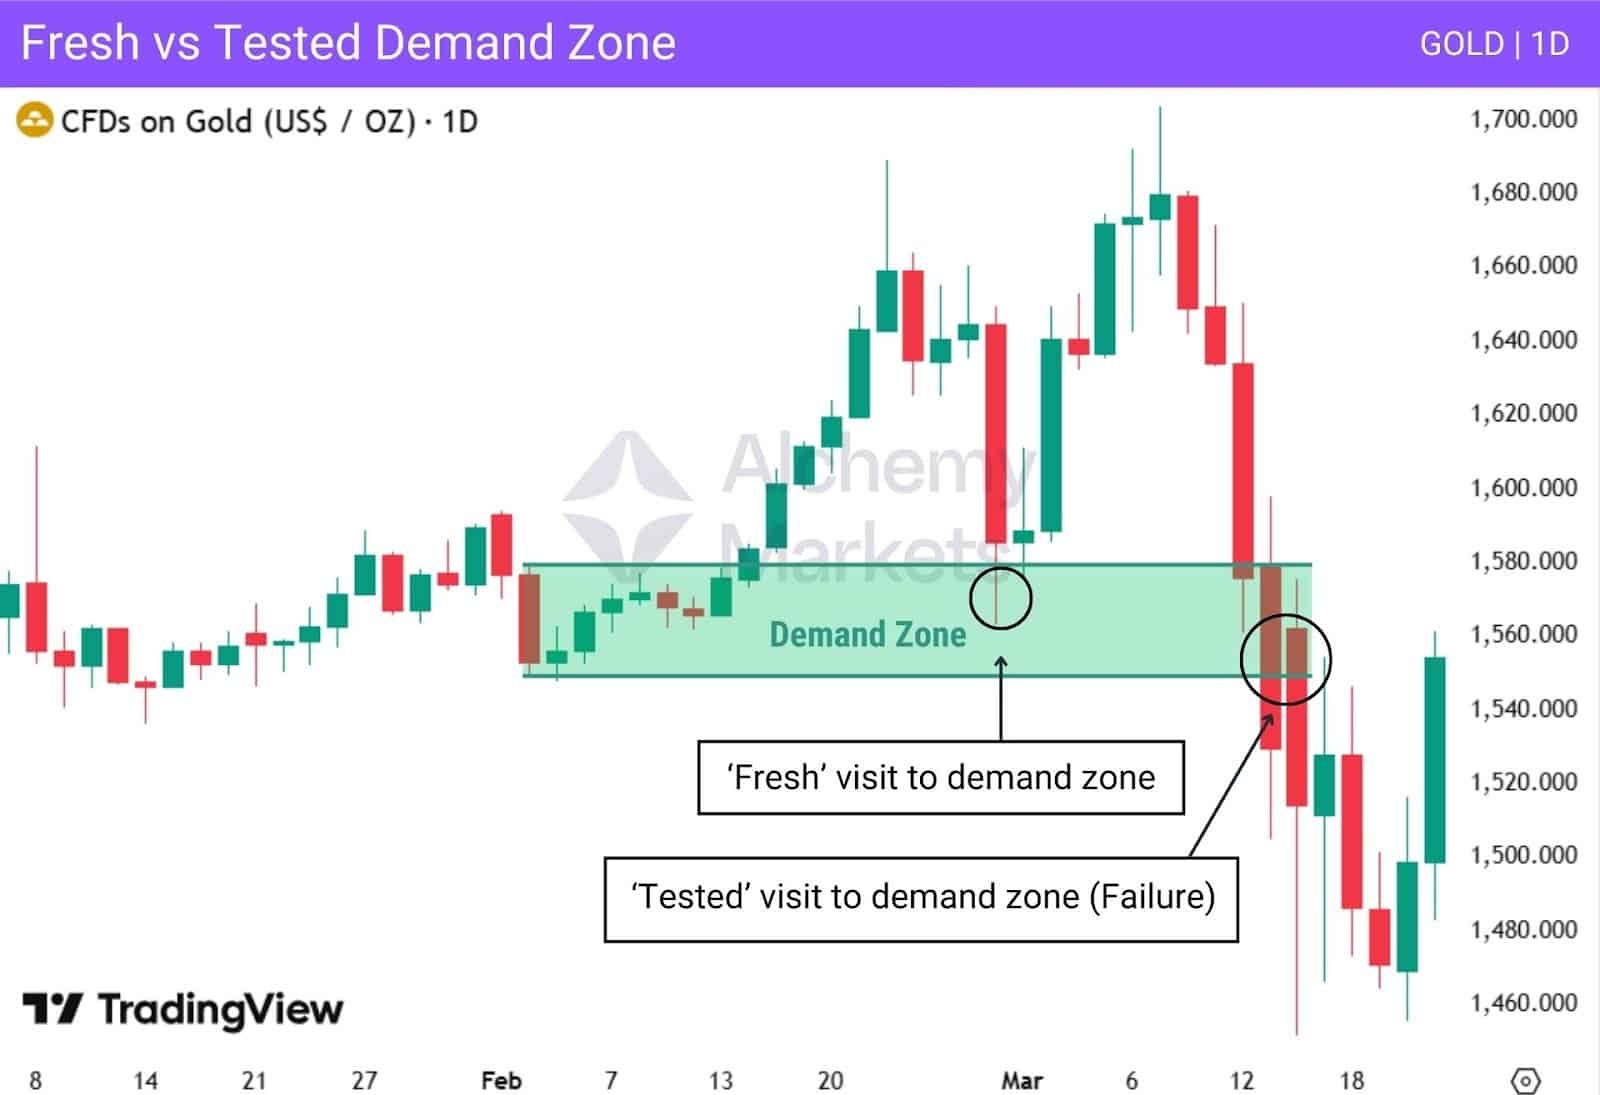
A fresh zone is one that price has not yet revisited since its formation.
These zones are often considered higher probability because the original orders that caused the move may still be resting there. They tend to produce faster and larger reactions when visited — notice that this is the case in the ‘Fresh’ visit in the example above.
A tested zone, on the other hand, has already been revisited by price at least once.
While it can still be tradable, each subsequent test typically reduces its strength as orders get filled. Traders must be more selective with tested zones, paying close attention to price behaviour and trading volume when price returns — notice in the example above, the ‘Tested’ visit led to a failure to hold as support.
In summation, fresh zones offer a better win rate, but tested zones can still produce good trades when supported by other confluences; such as higher-timeframe alignment, clear trend direction, strong price rejection, or confirmation from volume.
How to Identify Supply and Demand Zones
Traders can identify supply and demand zones by spotting areas where price made a significant pivot. Even if consolidation isn’t obvious on your current timeframe, dropping to a lower timeframe will often reveal where price paused before the move.
Pattern for Detecting Supply and Demand Zones
Most supply and demand zones follow a simple structure: an accumulation or distribution base followed by an impulse move.
The base represents a short consolidation where price pauses before moving decisively:
- In demand zones, price consolidates briefly and then breaks higher with strong momentum.
- In supply zones, price pauses before breaking lower.
Bases usually consist of one or several small-bodied candles, rather than a single candle. This phase reflects order placement and absorption. The impulse move that follows shows which side gained control.
How to Draw Demand Zones
Drawing demand zones consistently requires a systematic approach. Begin by identifying a strong bullish move where price leaves an area quickly and with minimal overlap between candles. This move should clearly show buying pressure.
Note this approach is also how Smart Money Concepts (SMC), a newschool framework to trading, marks out their supply and demand zones, which they call Order Blocks.
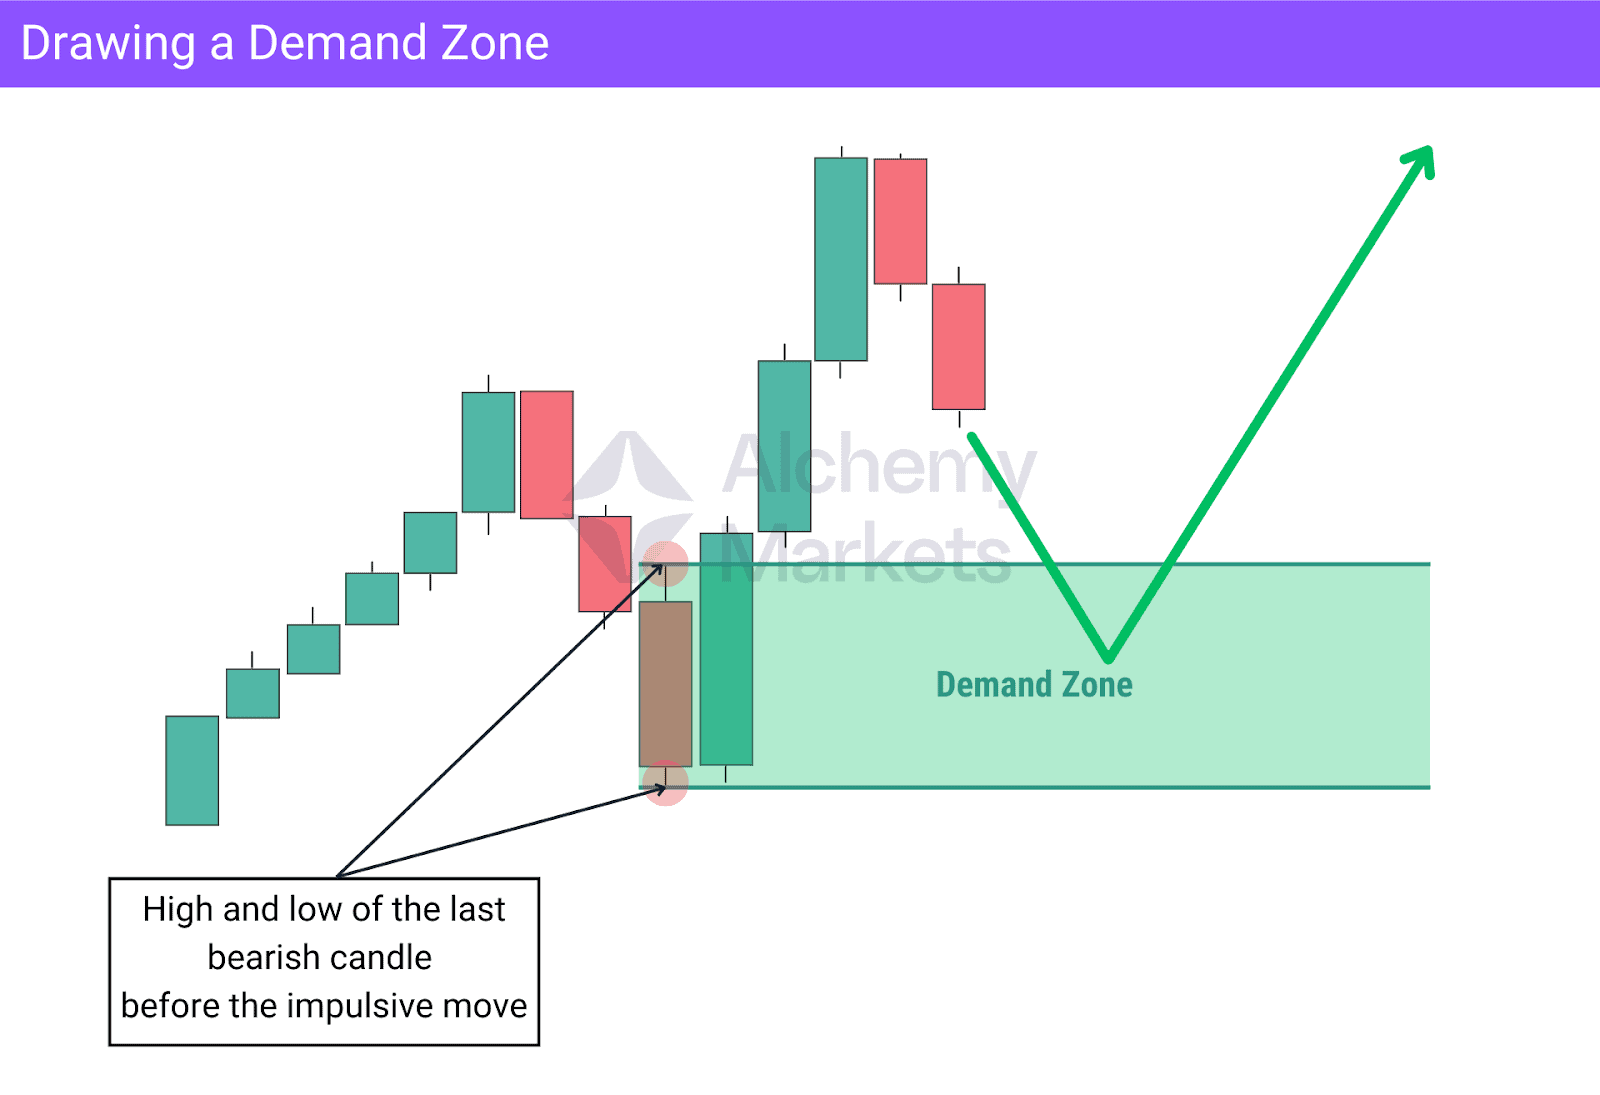
Next, locate the base just before the rally. This is usually a small consolidation and may include the last bearish candle before the price moved higher. The demand zone is drawn by covering the entire base, from the lowest wick to the highest wick within that consolidation.
Demand zones act as areas where price may return and react due to renewed buying interest. When price revisits the zone, traders often wait for confirmation such as strong bullish momentum or supportive market structure before entering.
How to Draw Supply Zones
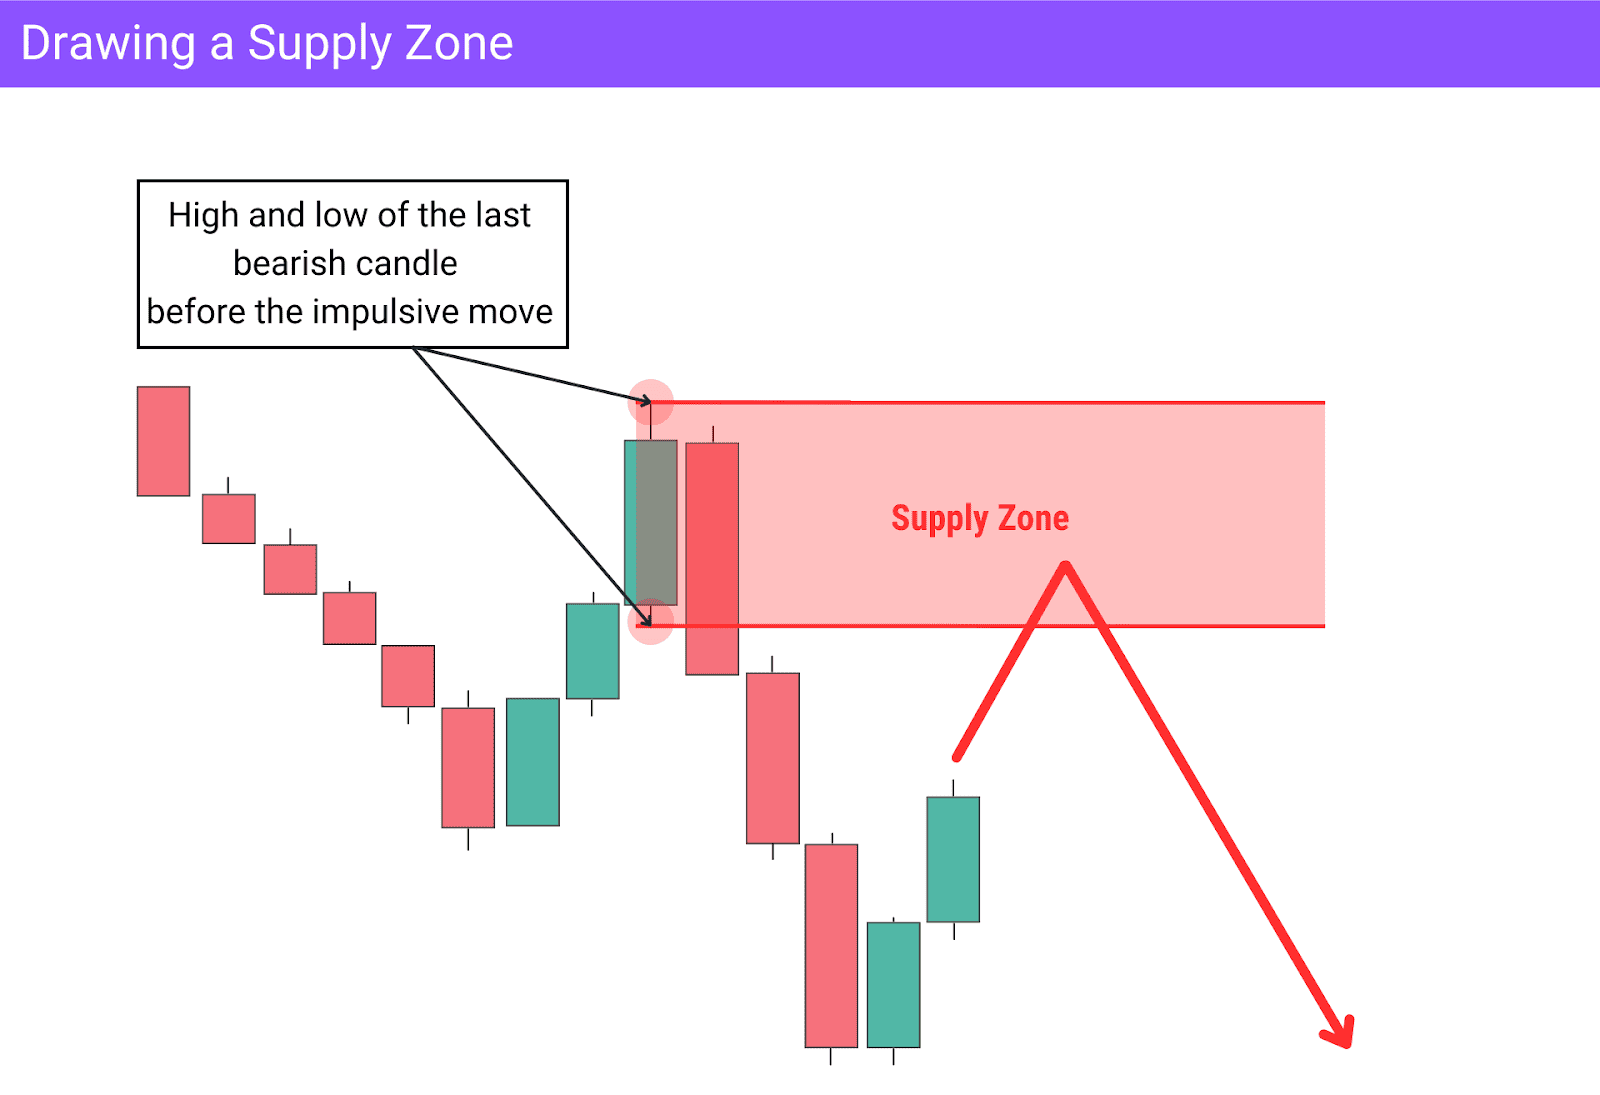
Supply zones follow the same logic in the opposite direction. Start by identifying a sharp bearish move where price breaks lower with clear selling pressure, rather than a gradual decline.
Then locate the base just before the drop. This is typically a brief consolidation that may include the last bullish candle before price fell. The supply zone is drawn by covering the full range of that base.
Supply zones highlight areas where selling pressure previously dominated. When price revisits these zones, traders watch for hesitation, rejection, or signs of weakness, especially when the zone aligns with resistance, market structure, and the broader trend.
How Does the Supply and Demand Trading Work?
Supply and demand trading works by identifying areas on the chart where price is likely to react. This serves primarily as a guide for where to look for trade entries, and secondarily as a place for exits.
These zones act as decision points where price may pause, reverse, or break through depending on market conditions and order flow.
Most supply and demand traders plan their trades around three core elements:
- Entry location near a supply (short) or demand zone (long)
- Risk control using defined stop placement beyond the zone, typically above the previous high or
below the previous low - Profit targets based on opposing supply or demand zones, market structure, or prior highs and lows
- Confirmation using price action or tools such as candlesticks or indicators
This structured approach allows traders to enter trades with clarity, manage risk objectively, and avoid emotional decision-making.
Supply and Demand in Forex
In all of financial markets, Forex holds the largest liquidity pool. This makes supply and demand zones more significant in FX trading.
Price movements in forex are heavily influenced by institutions such as, central banks, hedge funds and other large market participants, all of whom operate using order-based logic rather than retail indicators.
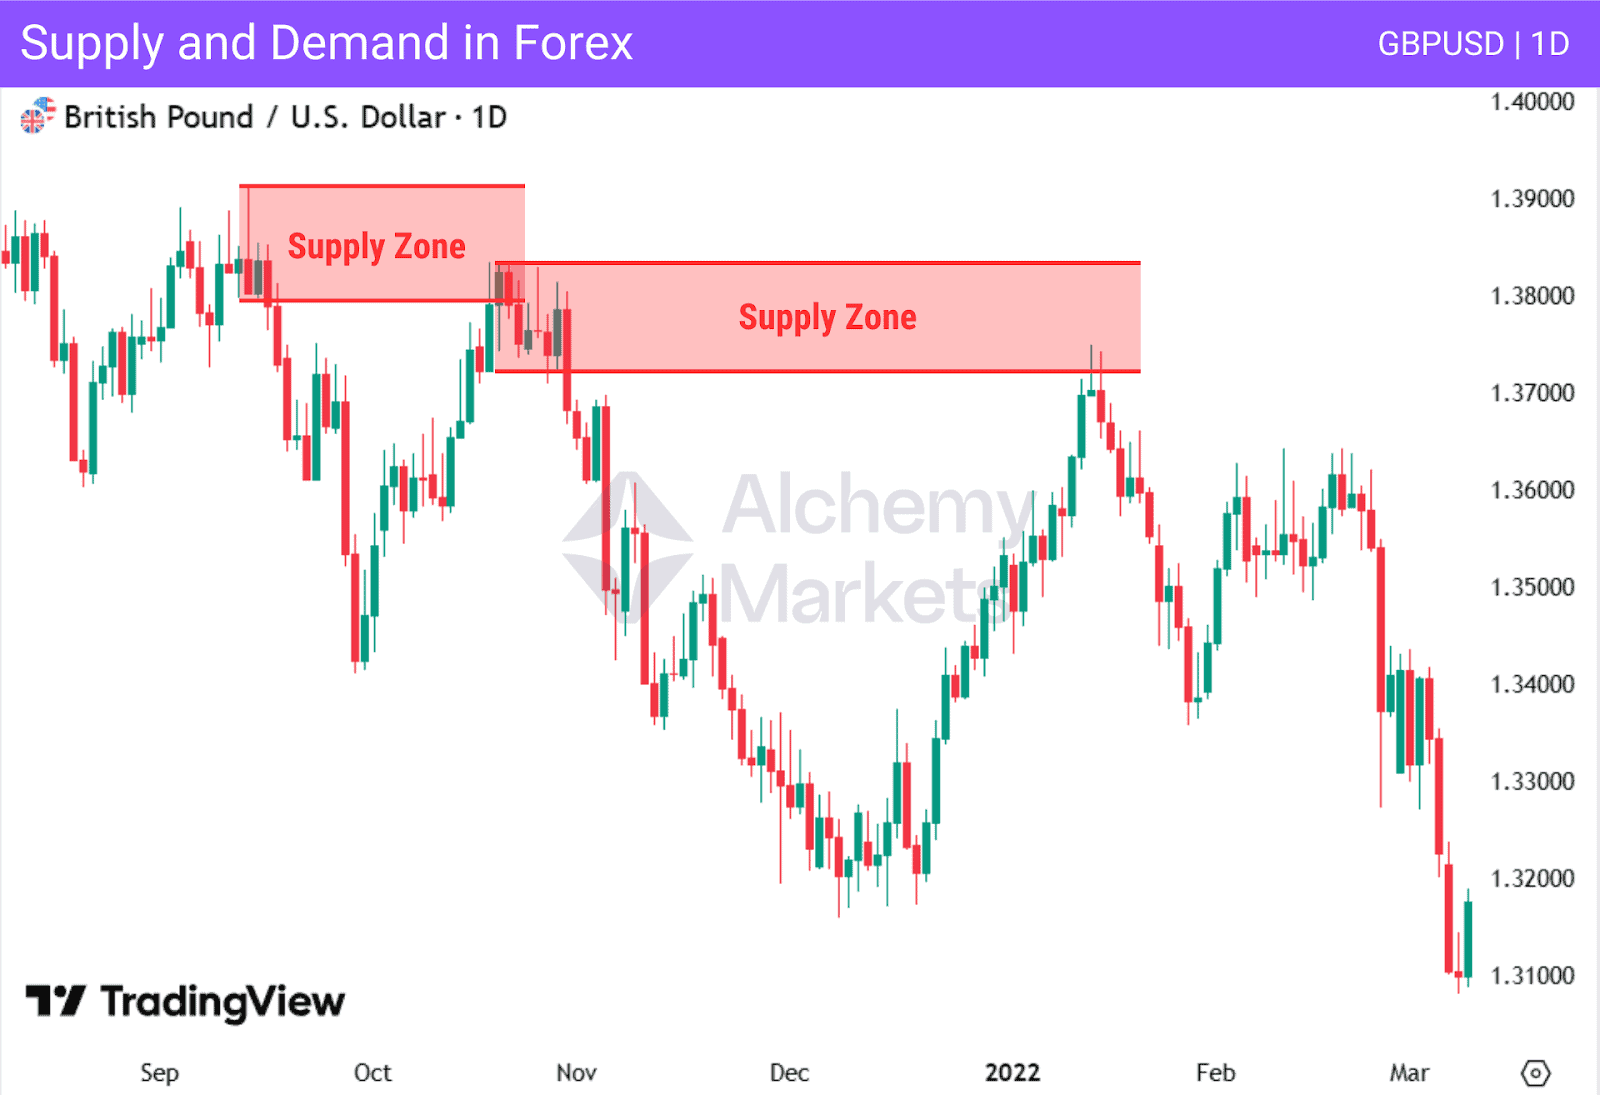
Compared to the stock market, gaps are less frequent in Forex, making supply and demand zones easier to map without adjusting for overnight price jumps.
The most important factor in FX, however, are interest rates. Any kind of announcements about inflation and interest rate decisions will guide FX pair movements, and therefore it’s important to be news sensitive.
Supply and Demand in Crypto
Supply and demand trading also plays a major role in crypto markets, and offers an even “smoother” experience than Forex trading, as crypto markets trade 24/7.
The key note however, is that price behaviour can be more volatile and emotionally driven in Crypto. This means that even though it is traded 24/7, which makes market gaps near non-existent in Crypto, the market is prone to highly impulsive moves. These moves are so imbalanced that it frequently creates Fair Value Gap patterns, which behave similarly to a common market gap.
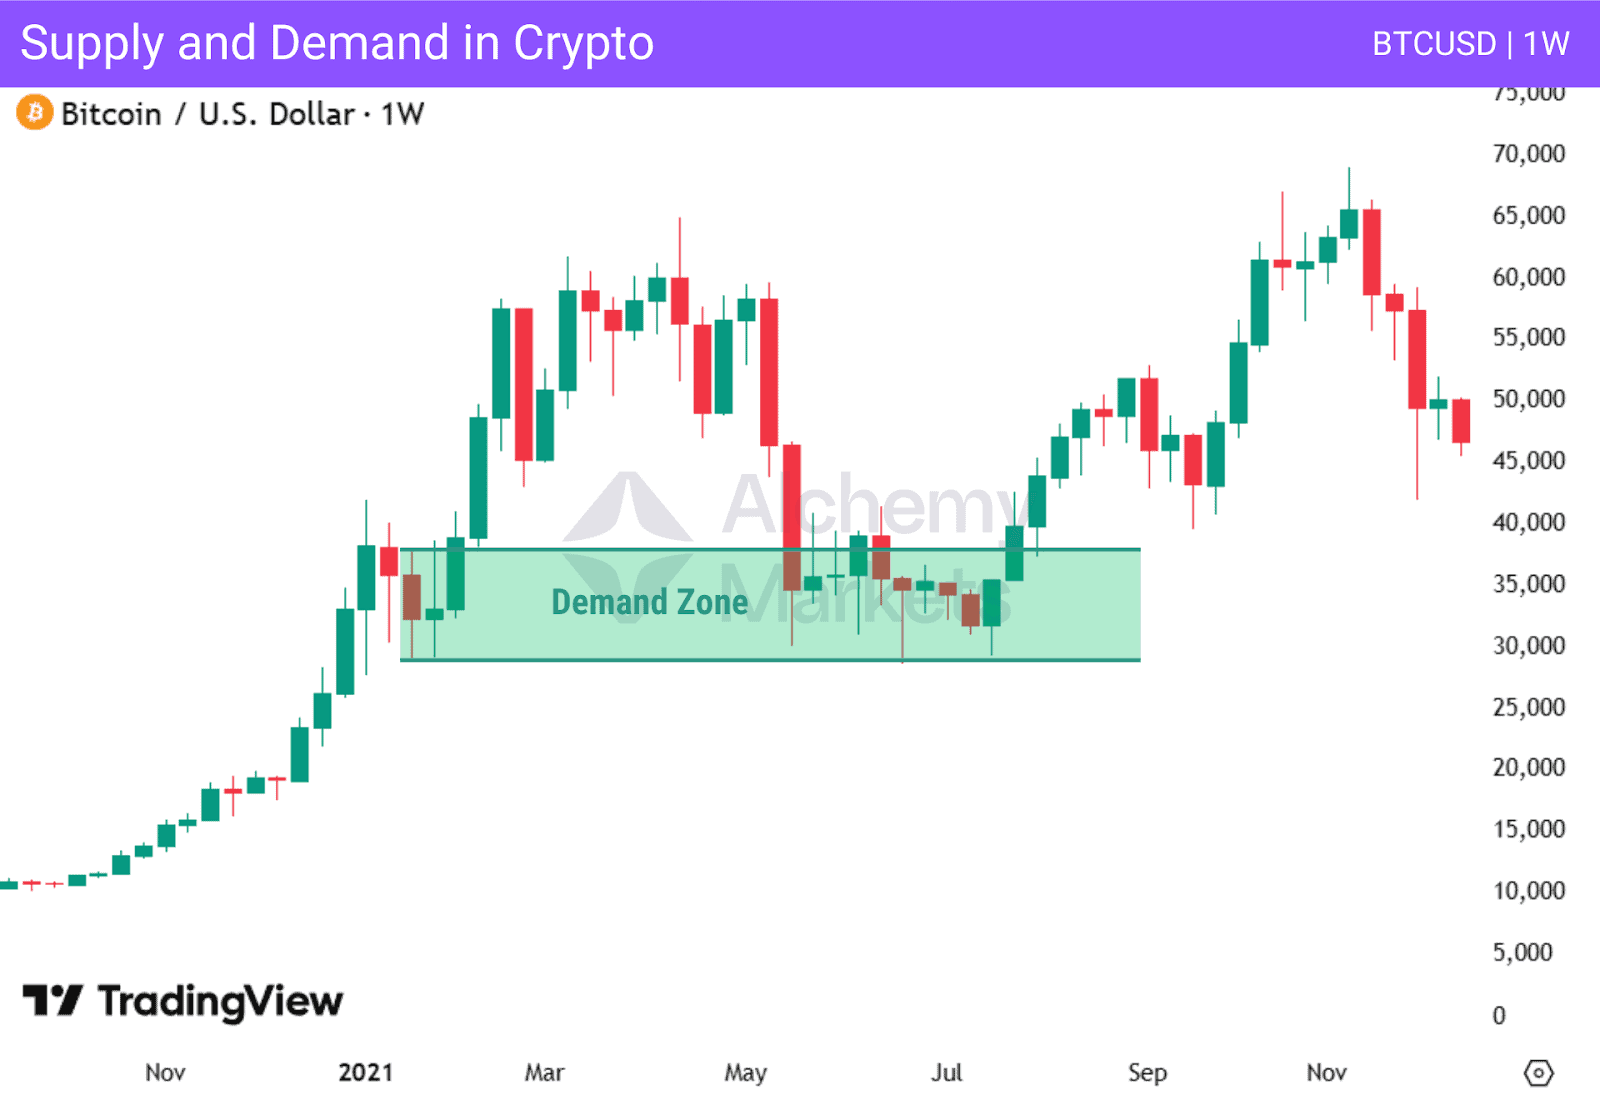
Because crypto markets can simultaneously be more choppy, and impulsive in one direction, traders must be more selective with their marked supply & demand zones.
Fresh zones, strong momentum departures, and high volume areas tend to be more reliable than weak or heavily tested zones.
Risk management becomes even more critical in crypto. Wide price swings can quickly shoot beyond a zone, only to quickly reverse; Crypto markets are more prone to fakeouts, or false breakouts.
So with that in mind, traders are advised to use wider stops, and less risk to adjust for the inherent volatility of this asset class.
What Is the Theory Behind Supply and Demand Zones?
Supply and demand zones operate using the same logic that determines prices in the real world.
Think about a simple example: eggs at a local market.

If too many sellers bring eggs to the market, supply exceeds demand. Sellers keep lowering prices to compete for buyers, and the market trades below its normal balance point. That balance point is also called market equilibrium, where buying and selling activity are roughly equal, signalling that it’s a ‘fair price’.
The opposite is also true. When eggs are scarce, demand exceeds supply. Buyers compete to buy first, forcing prices to rise even higher, due to a shortage of items. Eventually that price gets too high and demand sizzles, supply returns, and price moves back toward equilibrium.
Financial markets behave the same way. When a stock, crypto, FX pair, or commodity moves away from equilibrium too quickly, it creates a breaking point — an area where demand clearly outweighs supply, or supply overwhelms demand, forcing price to move fast.
When price returns to these zones, the market is checking whether supply and demand can balance out again, or whether one side will take control and push price away once more.
What Is the Importance of Supply and Demand in Trading?
At equilibrium, the equilibrium quantity of orders can be absorbed without causing price to move aggressively. When that balance breaks, price is forced to move.
Supply and demand provides a logical framework for understanding price action without relying on excessive indicators. It explains why price reacts at certain price levels and why some moves fail while others accelerate.
By focusing on supply and demand, traders can:
- Identify high probability zones rather than guessing entries
- Align with smart money rather than chasing retail-driven moves
- Improve timing by waiting for price revisits
- Reduce overtrading by focusing only on key areas
Supply and demand trading also integrates well with other approaches, including trendlines, support and resistance levels, and even Smart Money Concepts.
This flexibility makes it suitable for different trading styles and timeframes.
Supply and Demand Trading Example
Now let’s look at a practical example of a demand zone and understand the price dynamics behind it.
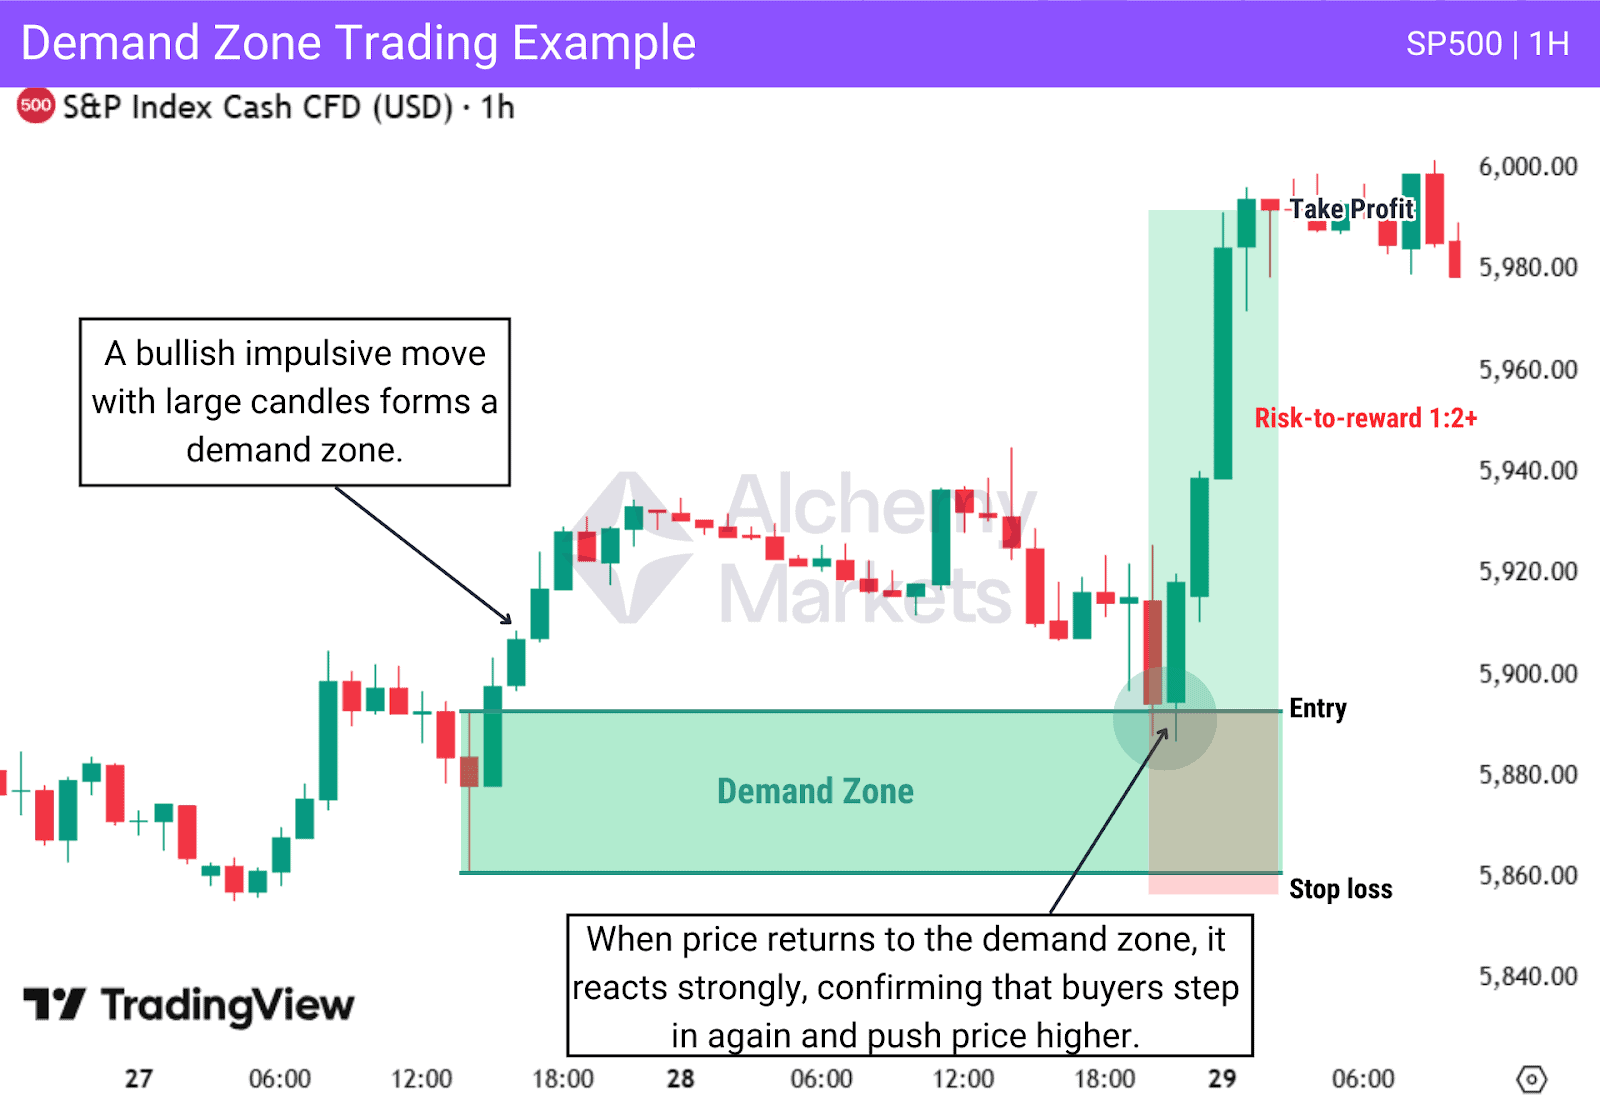
Price first pauses briefly before rising with large bullish candles. This impulsive move signals strong buyer control and defines the origin of the move as a clear demand zone, formed by the last bearish candle before the rally.
Because large market participants typically build positions over time rather than entering all at once, not all buy orders are filled during the initial move. Some buy orders remain resting within the demand zone. When price retraces back into this area, those remaining orders are executed, producing a strong bullish reaction.
This retracement into the demand zone creates a good opportunity for traders to enter on the retest, align with institutional buying interest, and ride the continuation of the original bullish movement, as illustrated on this chart.
Supply and Demand Trading Strategies
Supply and demand zones can be used across a wide range of trading strategies. In this section, we will see how combining supply and demand with different strategies works, and how to use them to identify high-probability setups and confirm entries.
Trading Reversals
Reversal trading focuses on identifying moments where a trend loses momentum and begins to shift direction. When combined with supply and demand, this strategy helps traders pinpoint high-probability reversal areas after extended price moves.
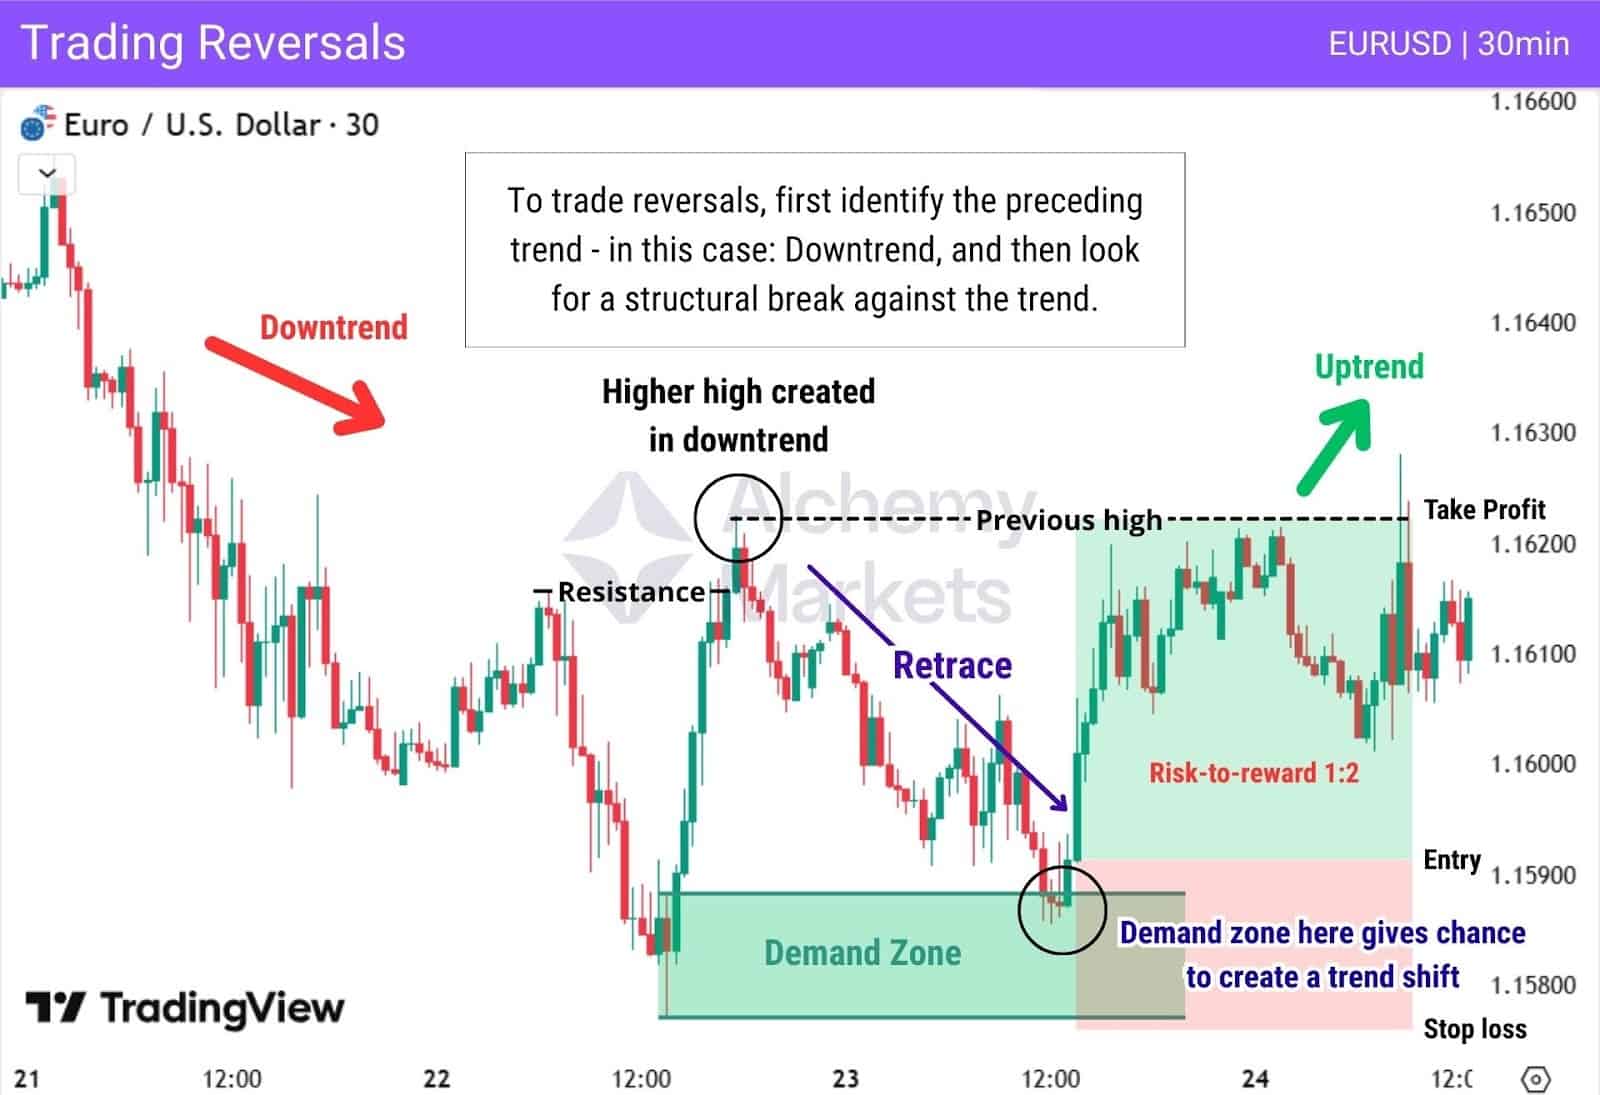
In this example, price is in a bearish trend, then breaks a resistance level with large bullish candles, signalling a potential market reversal and forming a demand zone. Price later retraces into the demand zone and reacts by forming a bullish candle, signalling rejection.
The entry is taken after this bullish reaction, with the target set at the previous high and the stop loss placed below the demand zone.
Trading Breakouts
Combining breakouts with supply and demand means trading zone flips. When supply breaks and turns into demand, or demand breaks and turns into supply, it can offer strong setups aligned with the prevailing trend.
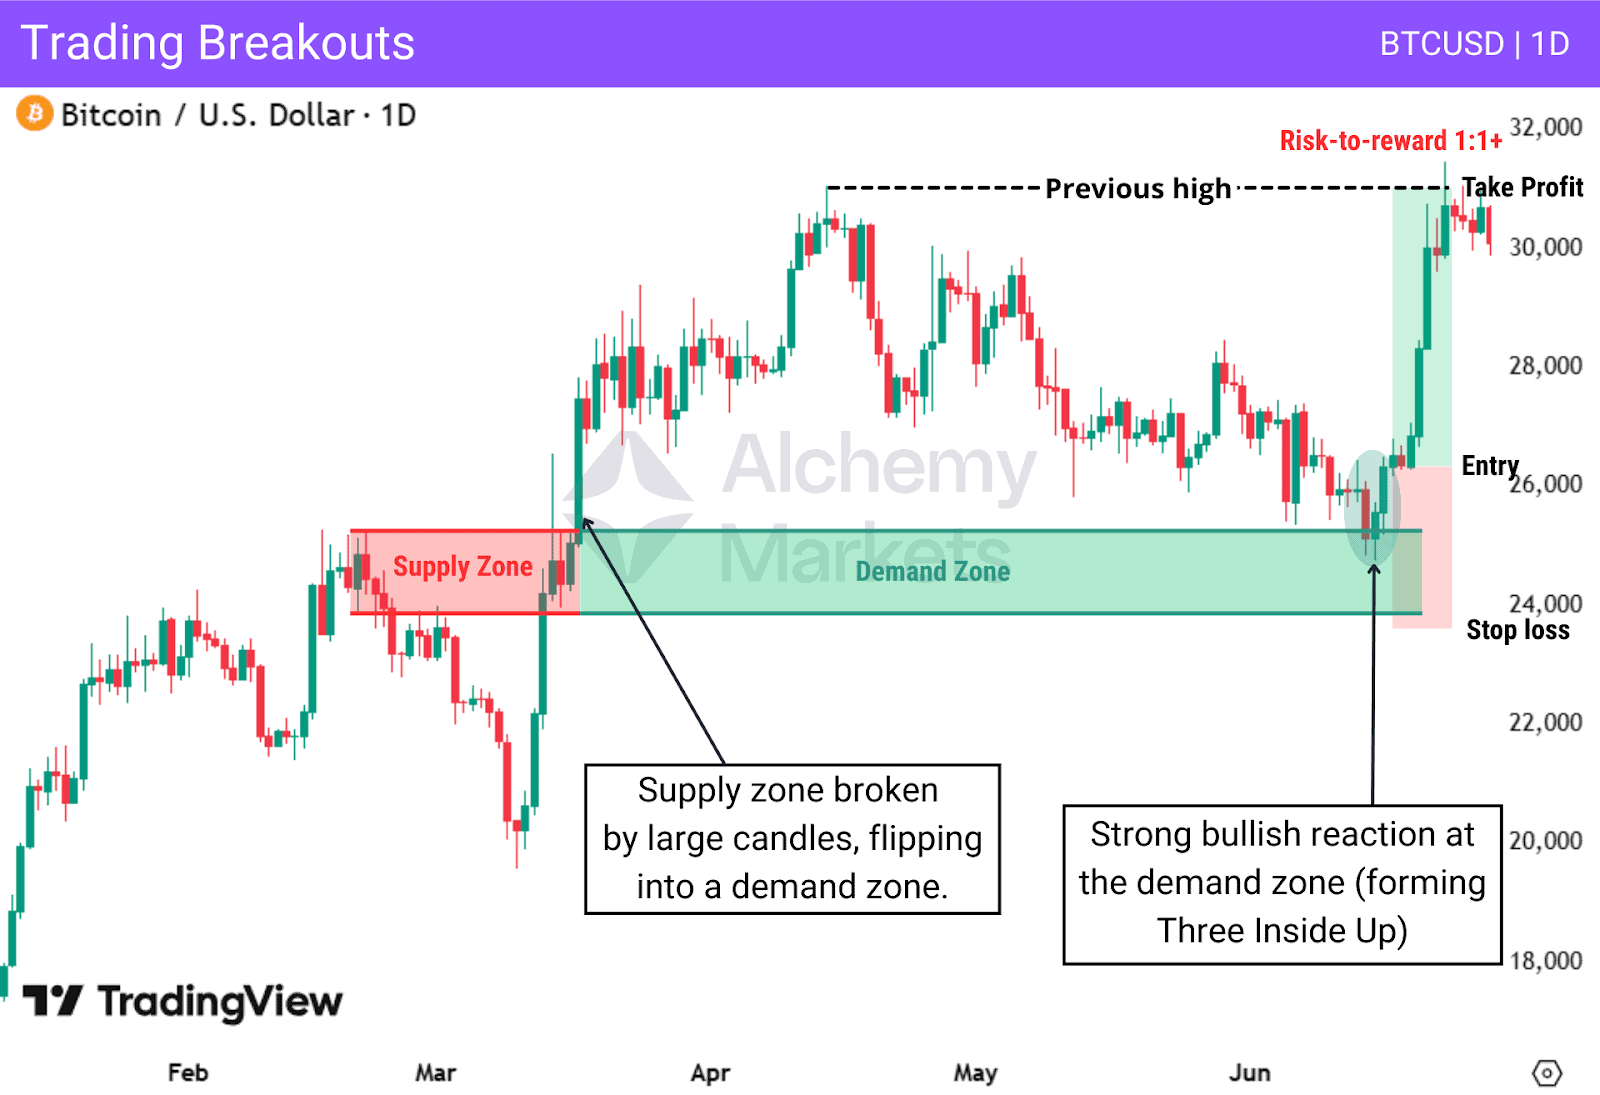
On this Bitcoin daily chart, price breaks above the supply zone with large bullish candles, causing the zone to flip into demand.
The entry is taken on the pullback into the demand zone after a clear bullish reaction (Three Inside Up), with the target set at the previous high and the stop loss placed below the demand zone.
Trend Continuation
Supply and demand zones can work very well with trend continuation. They often act as areas that mark the end of a retracement, where price is ready to continue in the prevailing trend.
In an uptrend, price moves higher and may form demand zones that offer buying opportunities after pullbacks.
In a downtrend, price frequently creates supply zones that provide sell opportunities after pullbacks, allowing traders to stay aligned with the bearish direction.
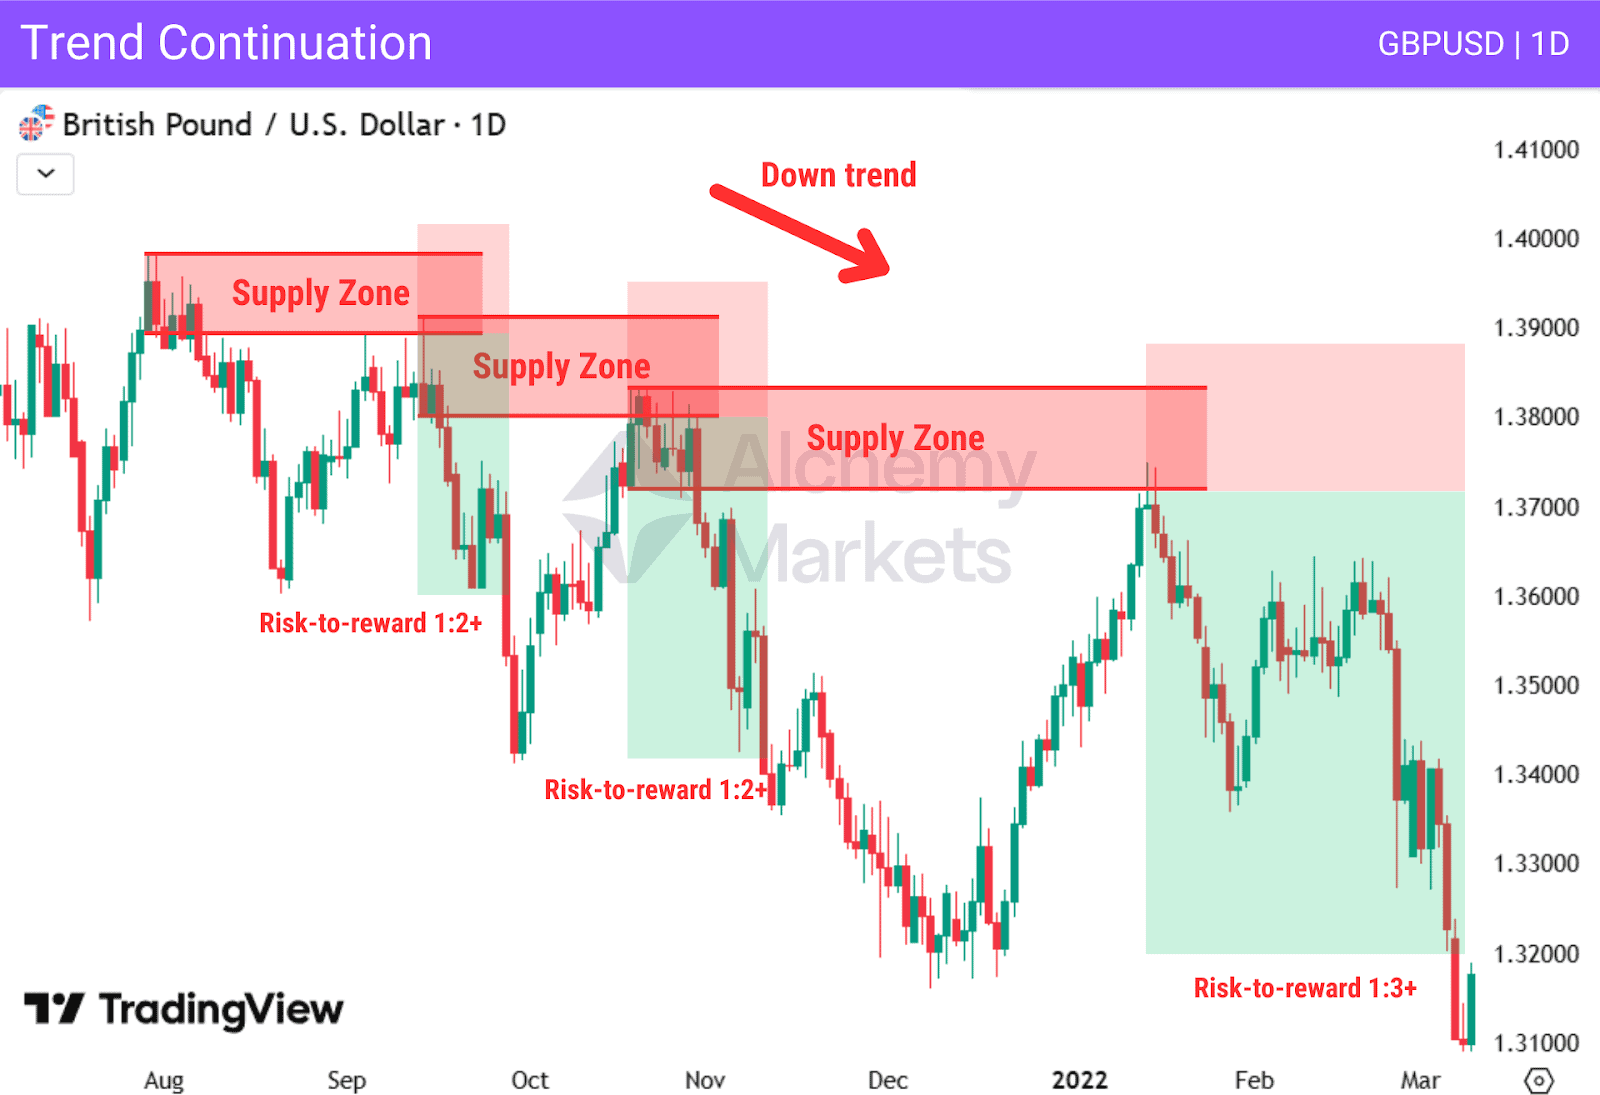
On this GBP/USD daily chart, price remains in a clear downtrend and repeatedly retraces into newly formed supply zones.
Each pullback into supply offers a high-probability sell opportunity in line with the bearish trend.
Entries are taken at the supply zones, with stop losses placed above them and targets set at new lows, enabling traders to capture favourable risk-to-reward continuation setups.
Range Trading
In range trading, price moves sideways between a supply and a demand zone, because buyers and sellers broadly agree on value. Ranges reflect periods of market equilibrium, where neither side has enough pressure to take control.
During a range, price often fluctuates around an equilibrium price (also known as market clearing price), where buying and selling interest is balanced and breakouts lack follow-through.
Once either supply or demand is broken, the ranging phase is no longer valid, as price may transition into a trending phase driven by renewed imbalance.
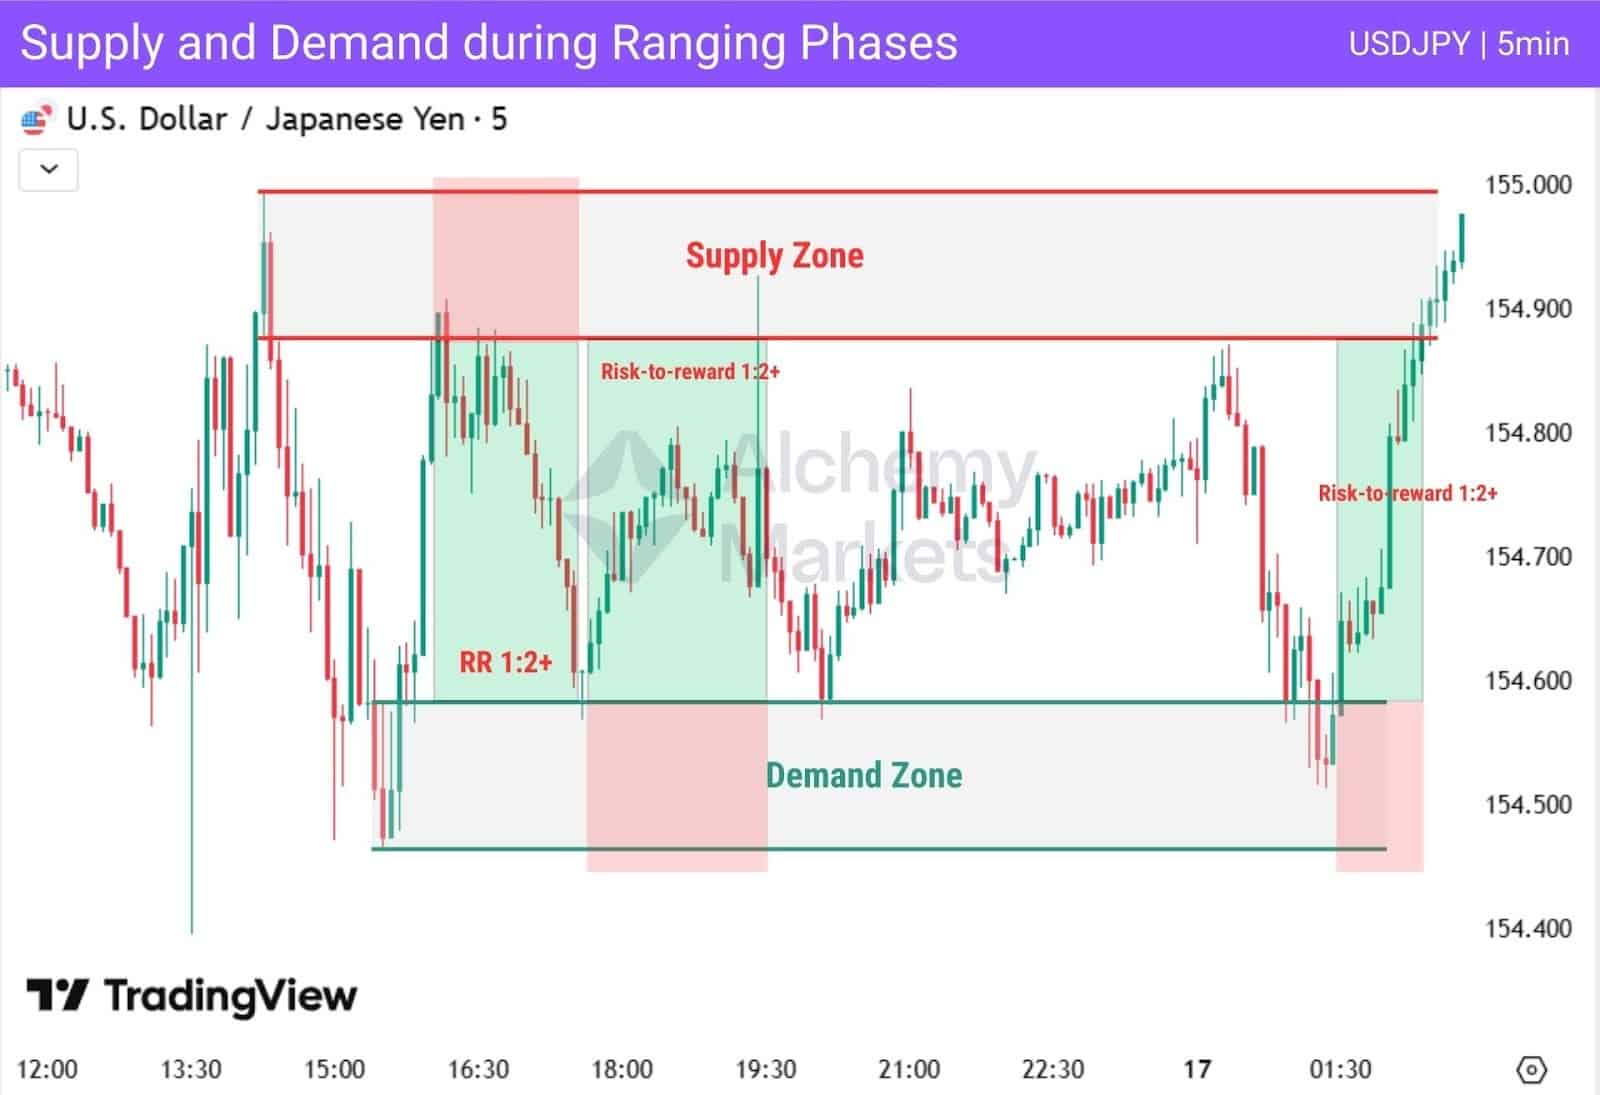
This chart shows a ranging phase where price repeatedly reacts at both supply and demand zones. Buy setups are taken at demand, targeting the next supply zone, while sell setups are taken at supply, targeting the next demand zone.
Price Action Strategy
Price action plays a key role in supply and demand trading. It helps identify the formation of supply and demand zones, measure their strength, and confirm trade entries.
For example, a demand zone formed after large impulsive candles and followed by price action confirmation often has a higher probability of holding.
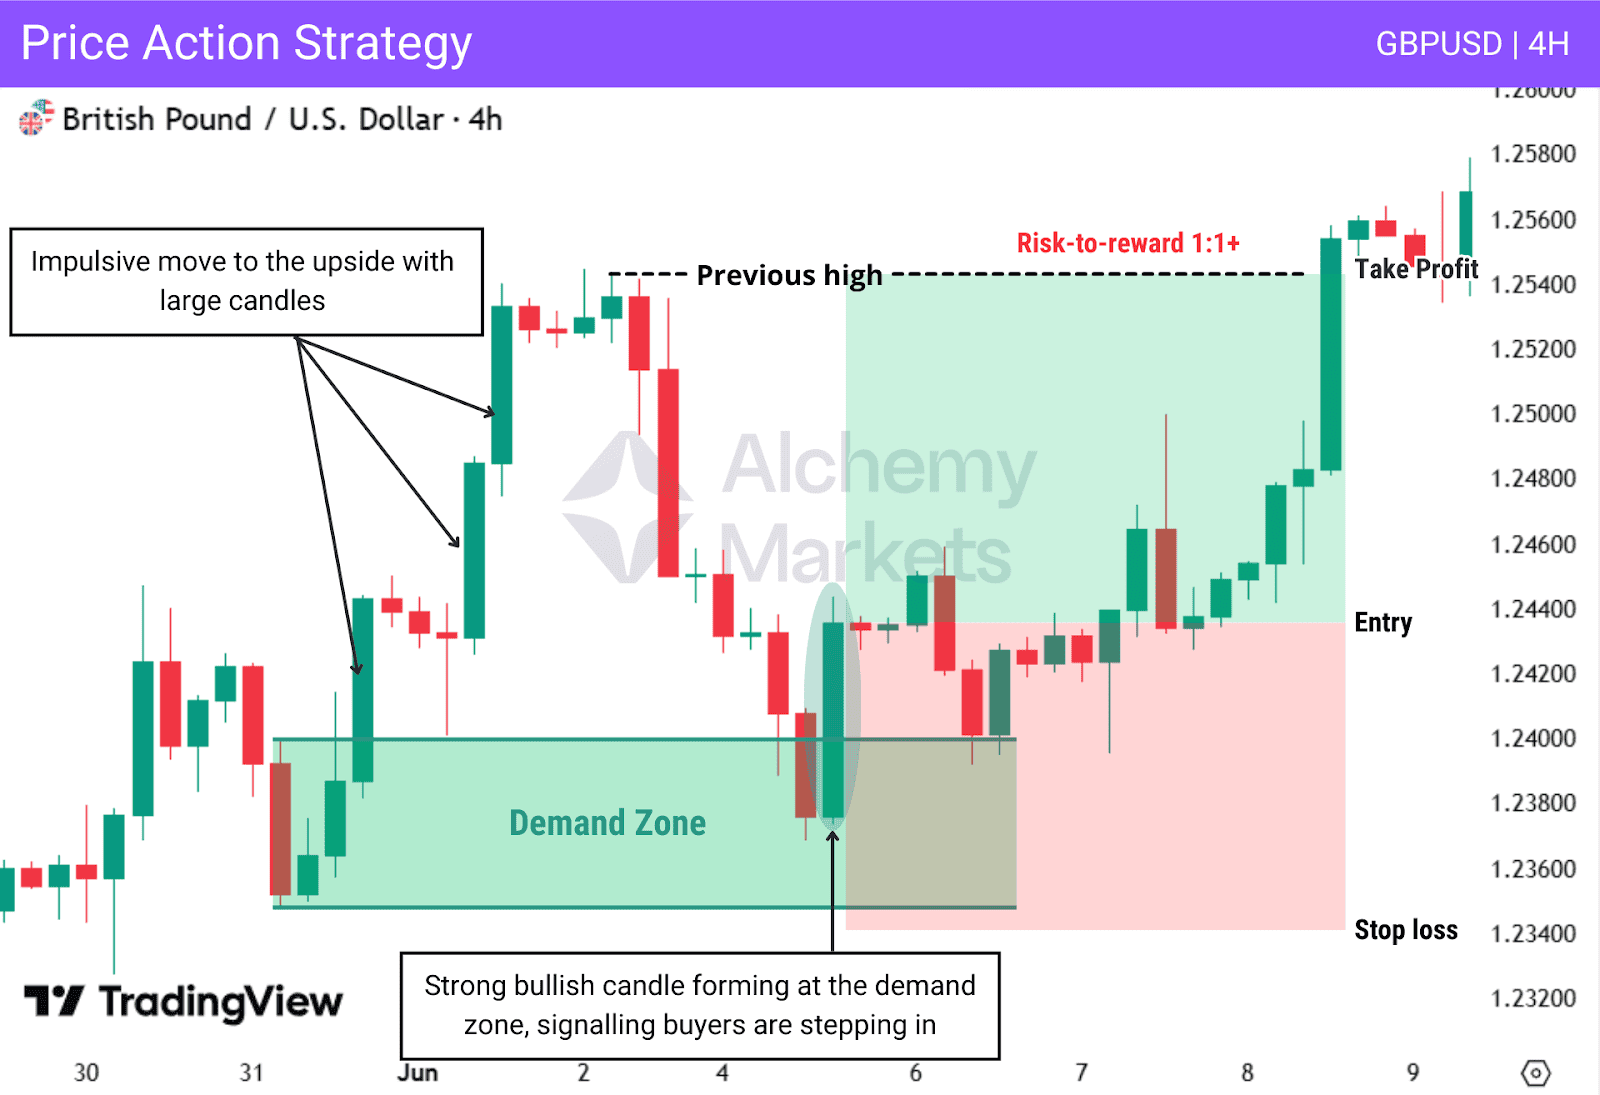
In this example, price forms large impulsive candles to the upside, signalling strong buying interest and leaving a clear demand zone. When price later returns to the demand zone, a strong bullish candle appears, indicating renewed buying pressure.
The entry is taken after this bullish reaction, with the stop loss placed below the demand zone and the target set at the previous high.
Volume Analysis
Volume analysis adds an extra layer of confirmation to supply and demand trading. While price shows direction, volume helps reveal the strength behind it and whether buying or selling pressure is supported by strong participation. It can also help confirm trade entries.
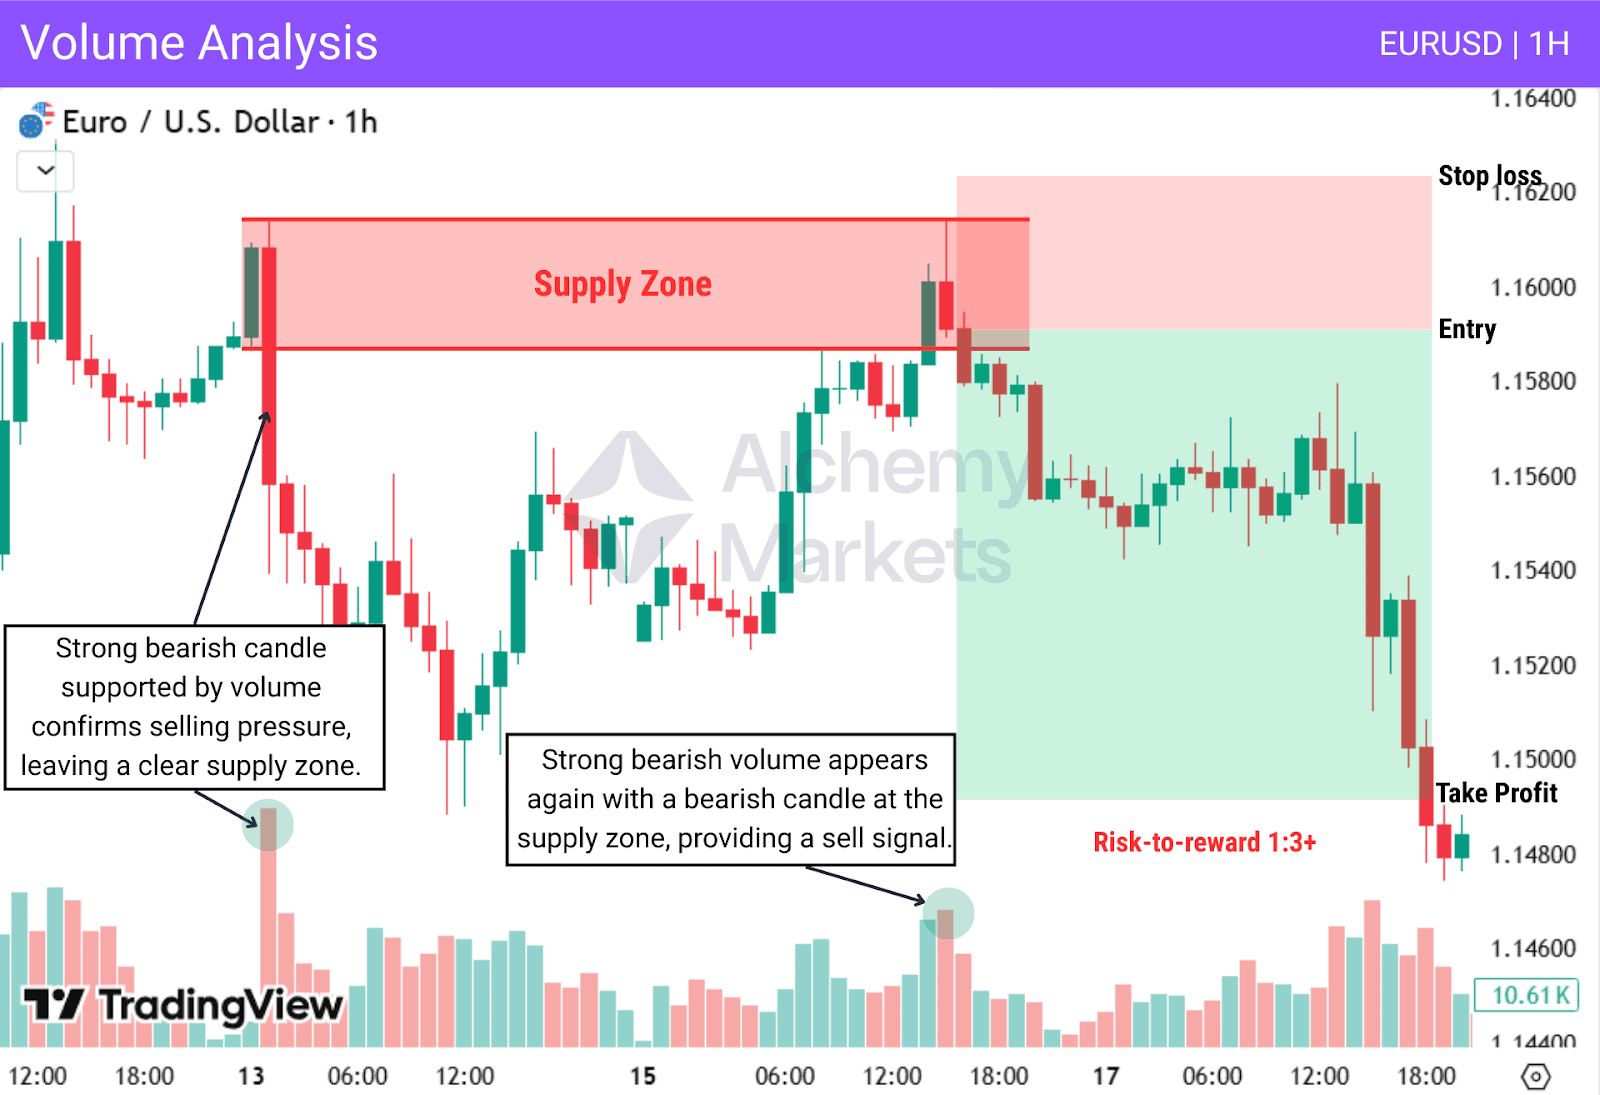
On this chart, price moves with strong volume, signalling selling pressure and leaving a clear supply zone. When price later retraces into the zone, it reacts with a bearish candle supported by strong bearish volume, indicating that selling pressure is resuming and providing a clear selling opportunity.
Multi-Timeframe Analysis
Multi-timeframe analysis helps traders use supply and demand more effectively by identifying trends and key areas on higher timeframes, such as supply and demand zones, and using lower timeframes for confirmation and precise entries.
This combination not only helps find high-probability setups, but also improves risk-to-reward ratios by allowing more precise entries and tighter stop losses on lower timeframes, while targeting higher-timeframe levels.
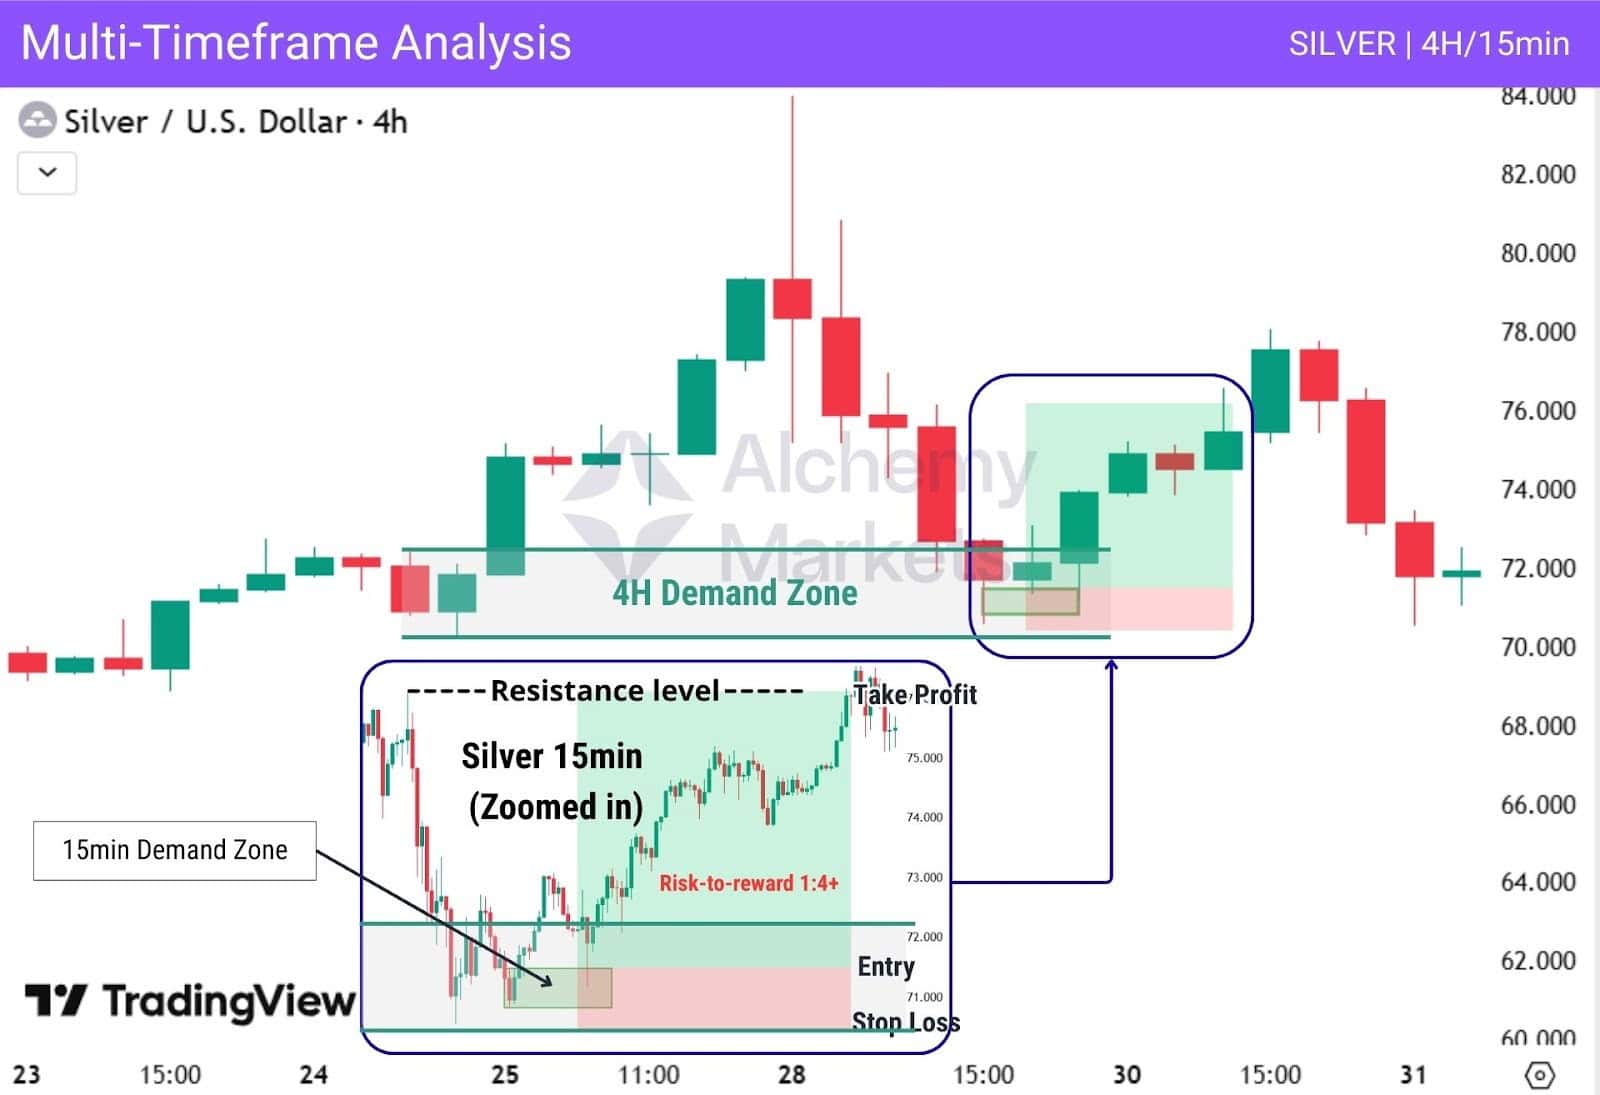
This chart shows a clear bullish trend and a well-defined demand zone on the 4-hour timeframe, setting the bullish context and the area of interest for a potential trade.
When we zoom into the 15-minute timeframe, this gives us an opportunity to trade using a smaller demand zone which is formed during a consolidation within the 4H zone.
The stop loss is placed below the 15-minute demand zone, with the target set at the first resistance level on the 15-minute timeframe, providing a 1:4 risk-to-reward ratio.
Note: For setups that involve multi-timeframe analysis, traders may also target higher-timeframe levels or use a trailing take-profit approach, taking partial profits each time price reaches a level to take advantage of the full move.”
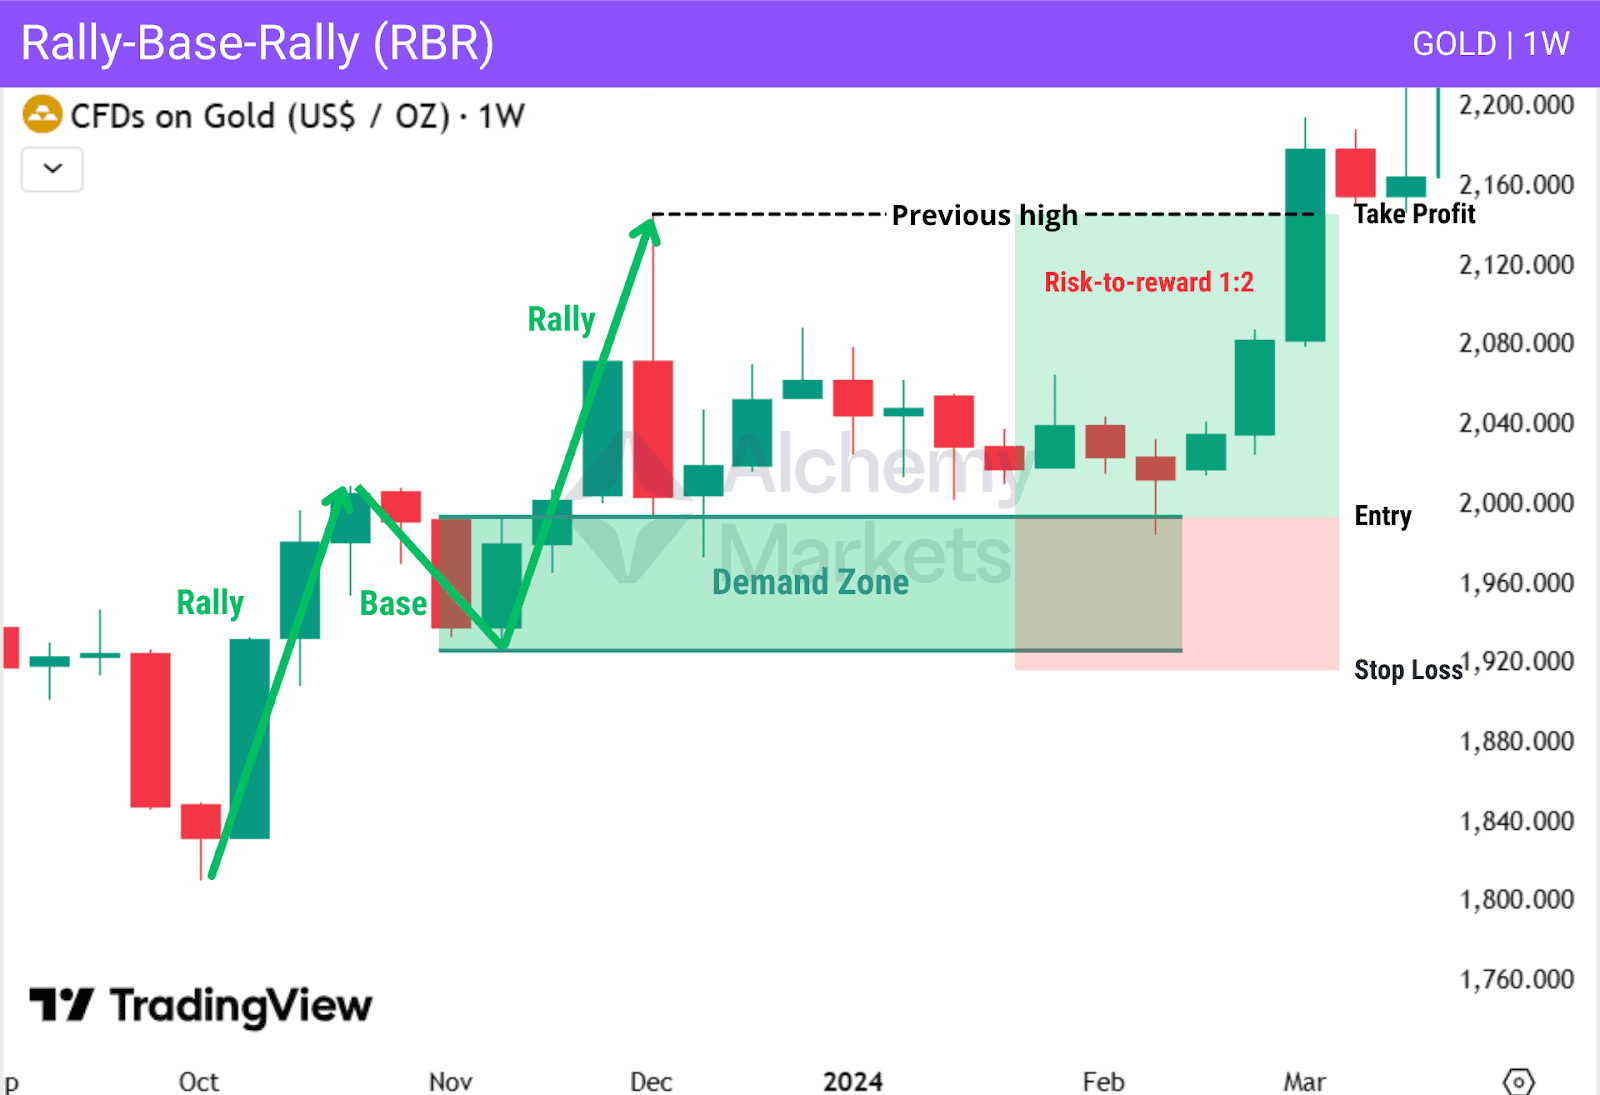
Rally-Base-Rally (RBR)
A Rally-Base-Rally (RBR) pattern is a bullish continuation structure that forms when price moves strongly higher, pauses briefly, and then continues upward. This pause creates a base where a demand zone is formed before the next rally.
The base represents a short consolidation where buying pressure remains in control. When price revisits this demand zone, it often reacts positively, offering a high-probability continuation setup.
RBR patterns work best within established uptrends, with entries taken near the demand zone, stop losses placed below it, and profit targets set at higher resistance levels.
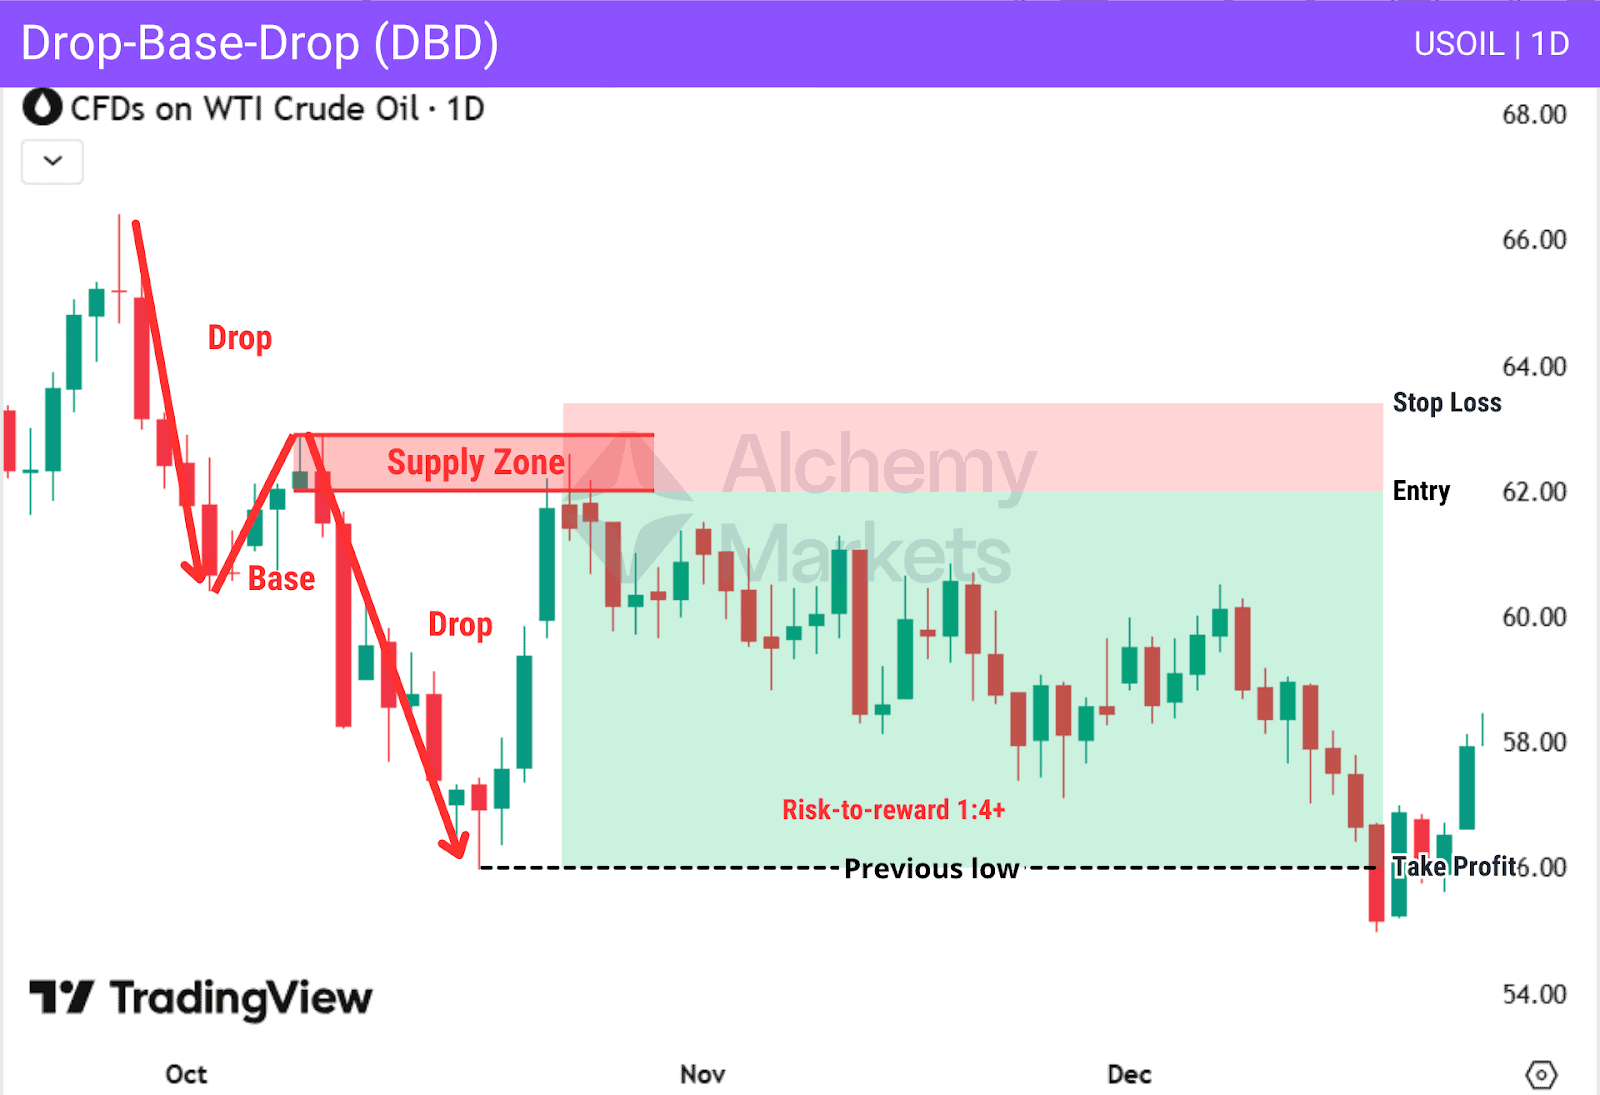
Drop-Base-Drop (DBD)
A Drop-Base-Drop (DBD) pattern is the bearish counterpart to Rally-Base-Rally and represents strong selling pressure. Price drops sharply, pauses briefly in a consolidation phase, and then continues lower, forming a clear supply zone at the base.
The base marks an area where sellers regained control after a short pause. When price revisits this supply zone, it often reacts bearishly, offering a high-probability continuation setup. DBD patterns are most effective within established downtrends, with entries taken near the supply zone, stop losses placed above it, and profit targets set at lower price levels.
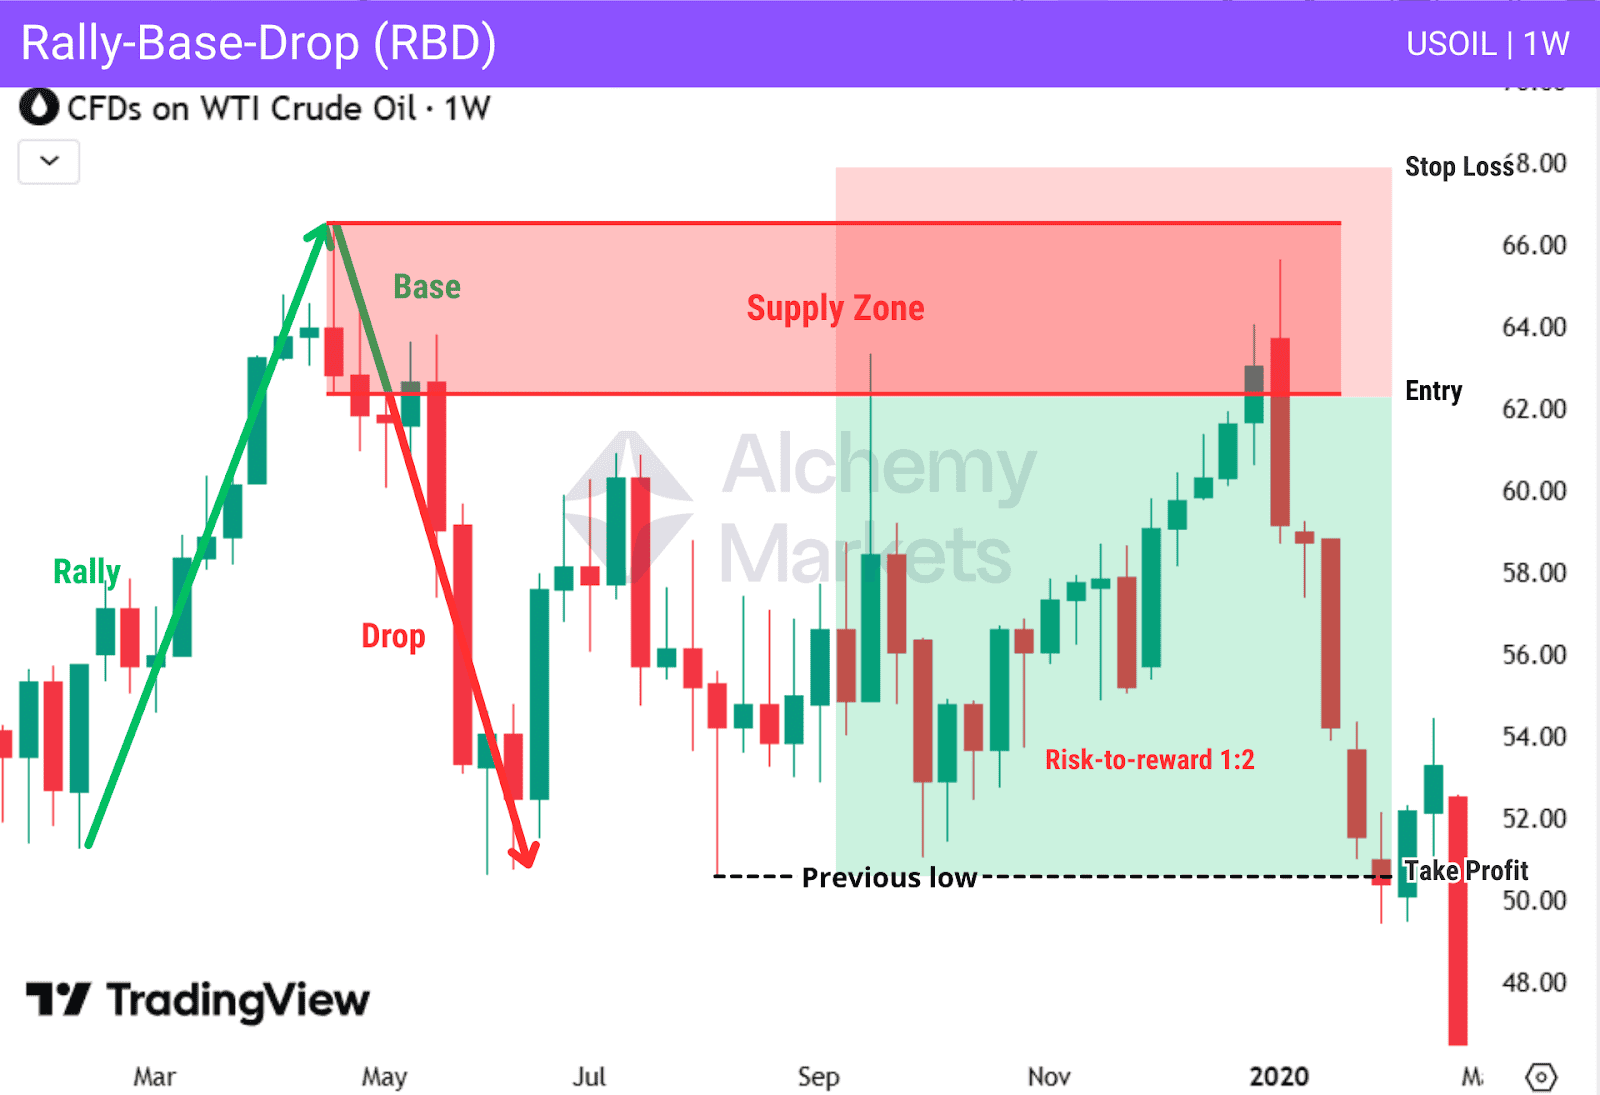
Rally-Base-Drop (RBD)
A Rally-Base-Drop (RBD) pattern represents a bearish structure where price rallies, pauses briefly in a consolidation phase, and then drops sharply. This sequence forms a supply zone at the base, showing that selling pressure has taken control.
RBD zones often appear near resistance levels or after corrective moves within a broader downtrend. When price revisits this supply zone, it frequently reacts bearishly, offering a high-probability setup for trend continuation or reversal trades. Entries are typically taken near the supply zone, with risk managed above it and targets set toward the previous low.
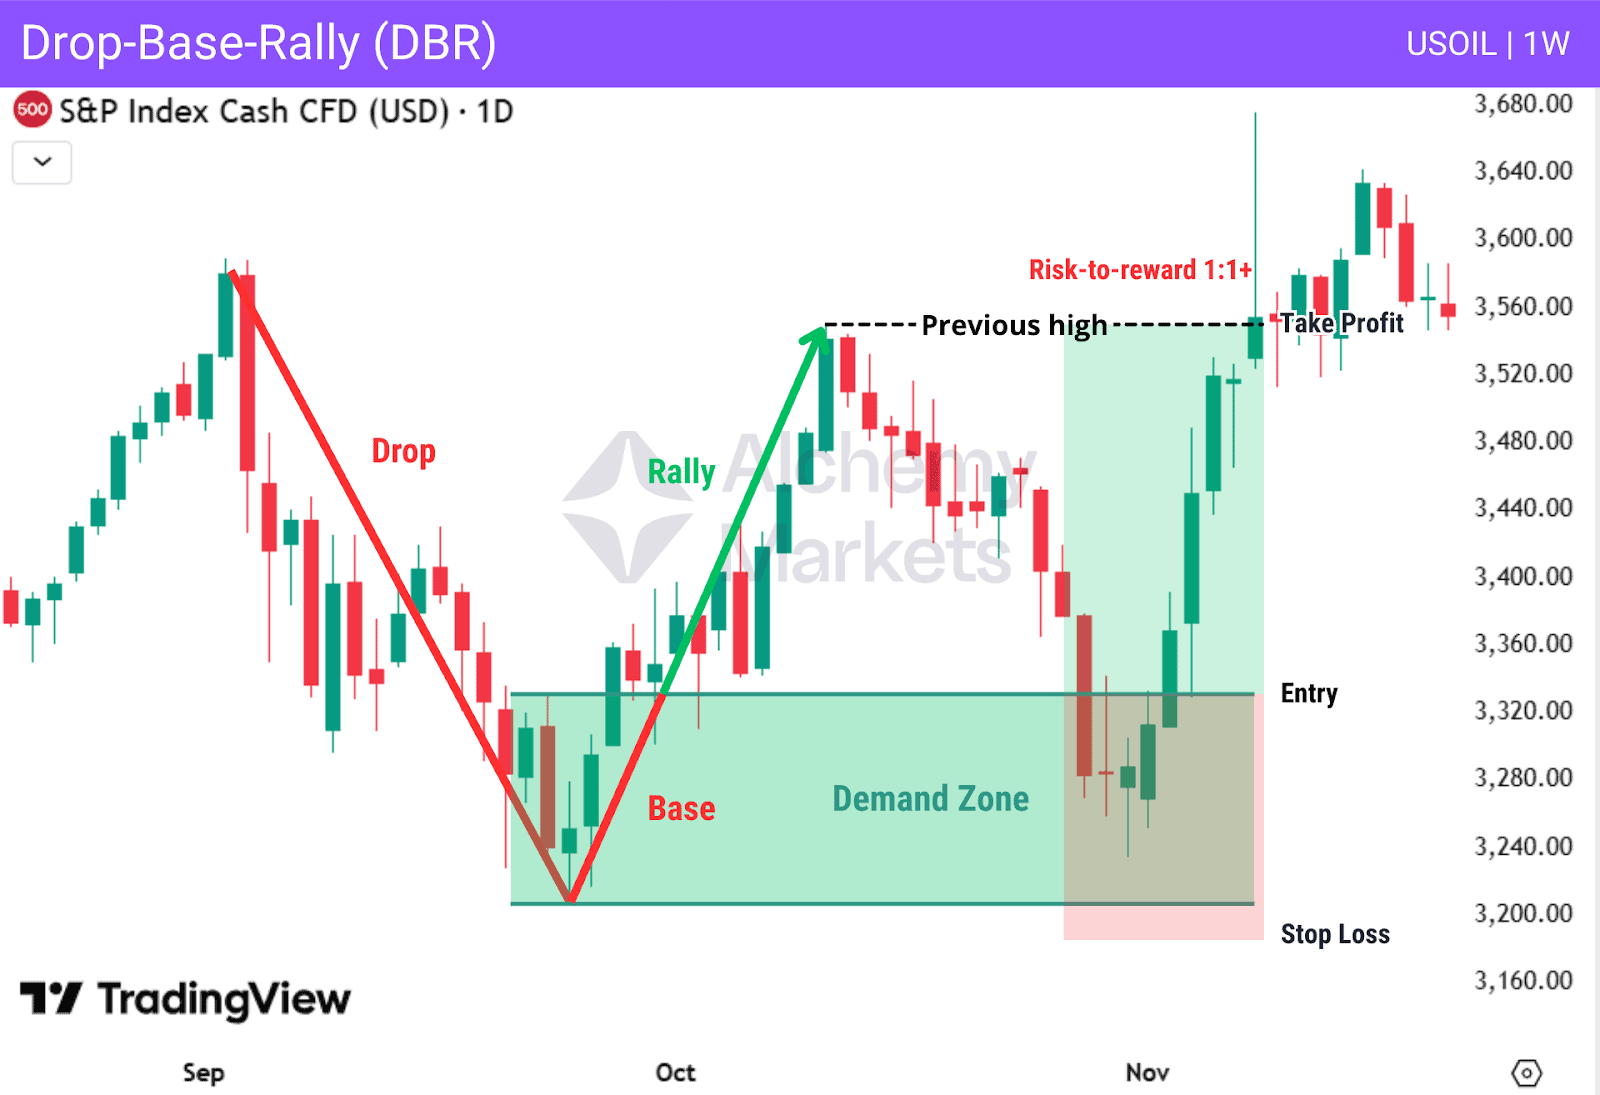
Drop-Base-Rally (DBR)
A Drop-Base-Rally (DBR) pattern is a bullish structure where price drops, pauses briefly, and then rally, forming a clear demand zone at the base.
When price returns to this demand zone, it often reacts positively and can offer a good buying opportunity. DBR patterns work effectively on higher timeframes or when they form at major key levels in the market.
Confluence with Support and Resistance Levels
Supply and demand zones become more effective when they align with key support and resistance levels. There are several ways this confluence can appear. For example, a supply zone forming at a major resistance level, or a demand zone forming at a major support level, often has a higher chance of success.
Support and resistance can also act as liquidity pools. Price may briefly move beyond a support or resistance level to trigger stop losses or induce breakout traders before reversing. This liquidity sweep often provides the fuel needed for price to react strongly from a nearby supply or demand zone.
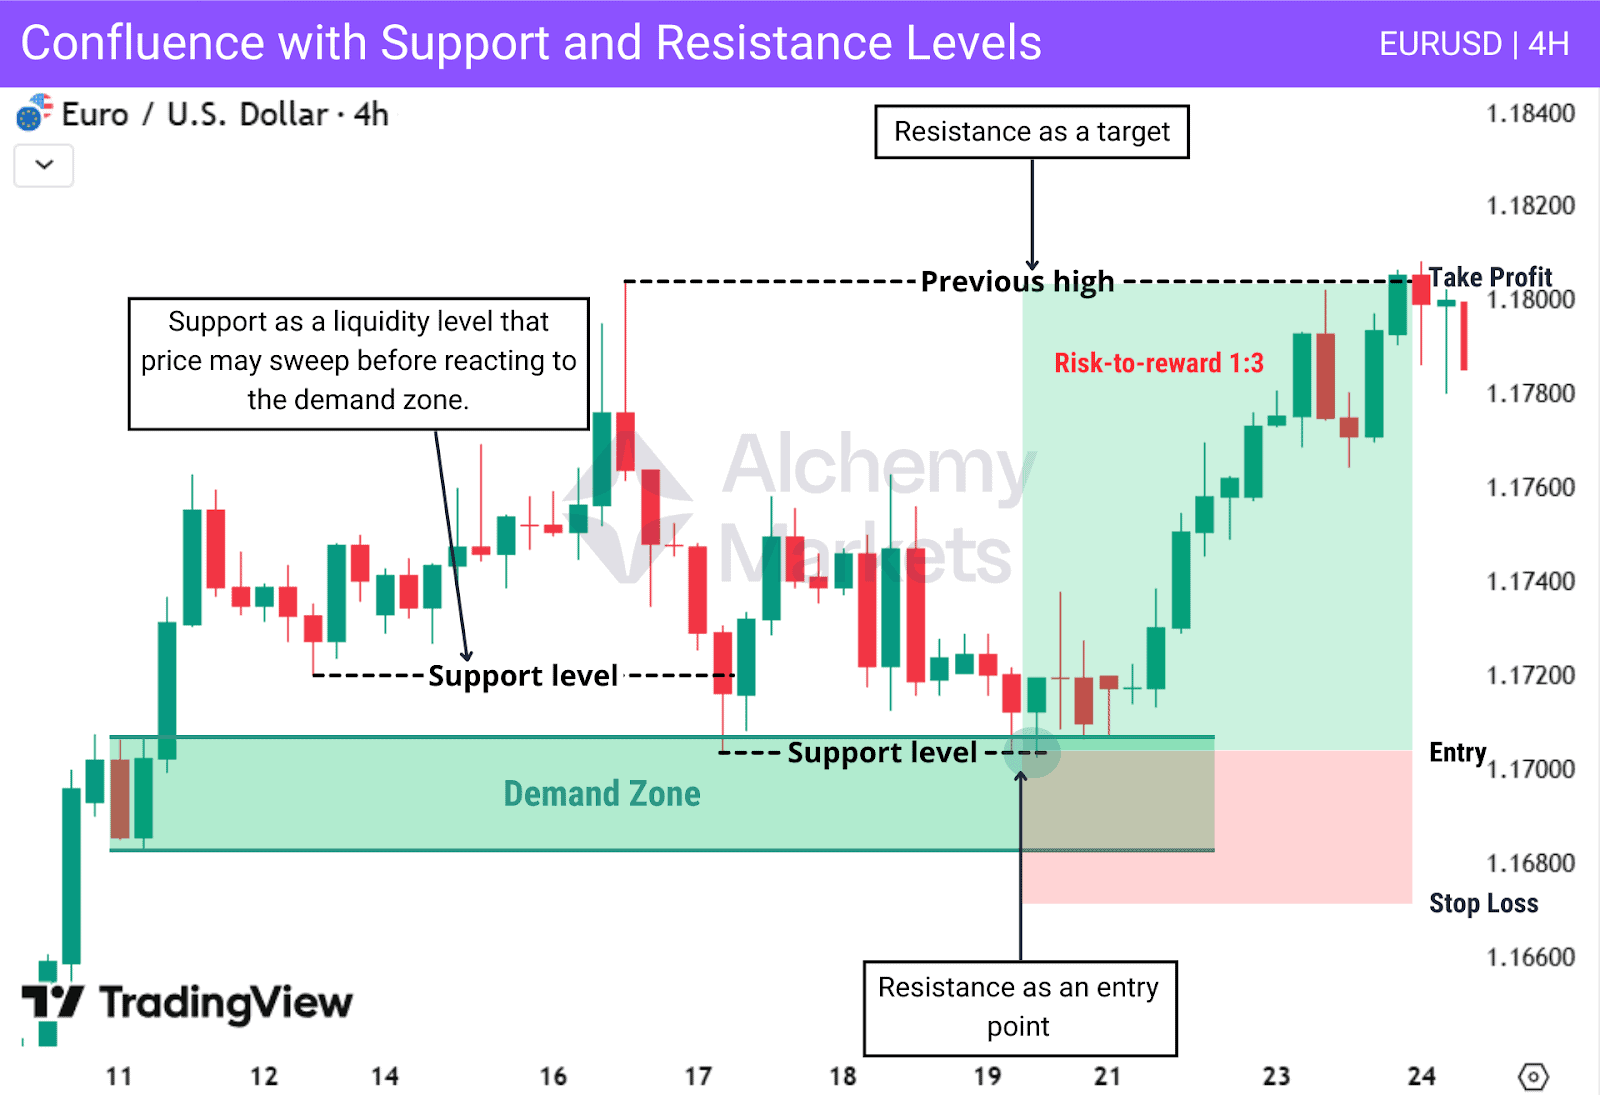
In this example, price forms a demand zone, followed by a support level above it. Price later retraces and sweeps liquidity below the support, trapping sellers and providing strength for buyers to enter. Price then reacts sharply from the demand zone, confirming strong buyer interest.
A new support level forms within the demand zone and acts as a precise entry level. The support level helps validate the demand zone, while the previous high and resistance above serve as logical profit targets.
This type of confluence increases the reliability of the setup and helps traders focus on areas where multiple technical factors align, rather than relying on a single concept in isolation.
Supply and Demand with RSI
Relative Strength Index (RSI) can be used to confirm supply and demand zones by highlighting overbought and oversold conditions, as well as divergences. Overbought readings near supply zones may signal weakening buyers, while oversold readings near demand zones suggest selling pressure is fading.
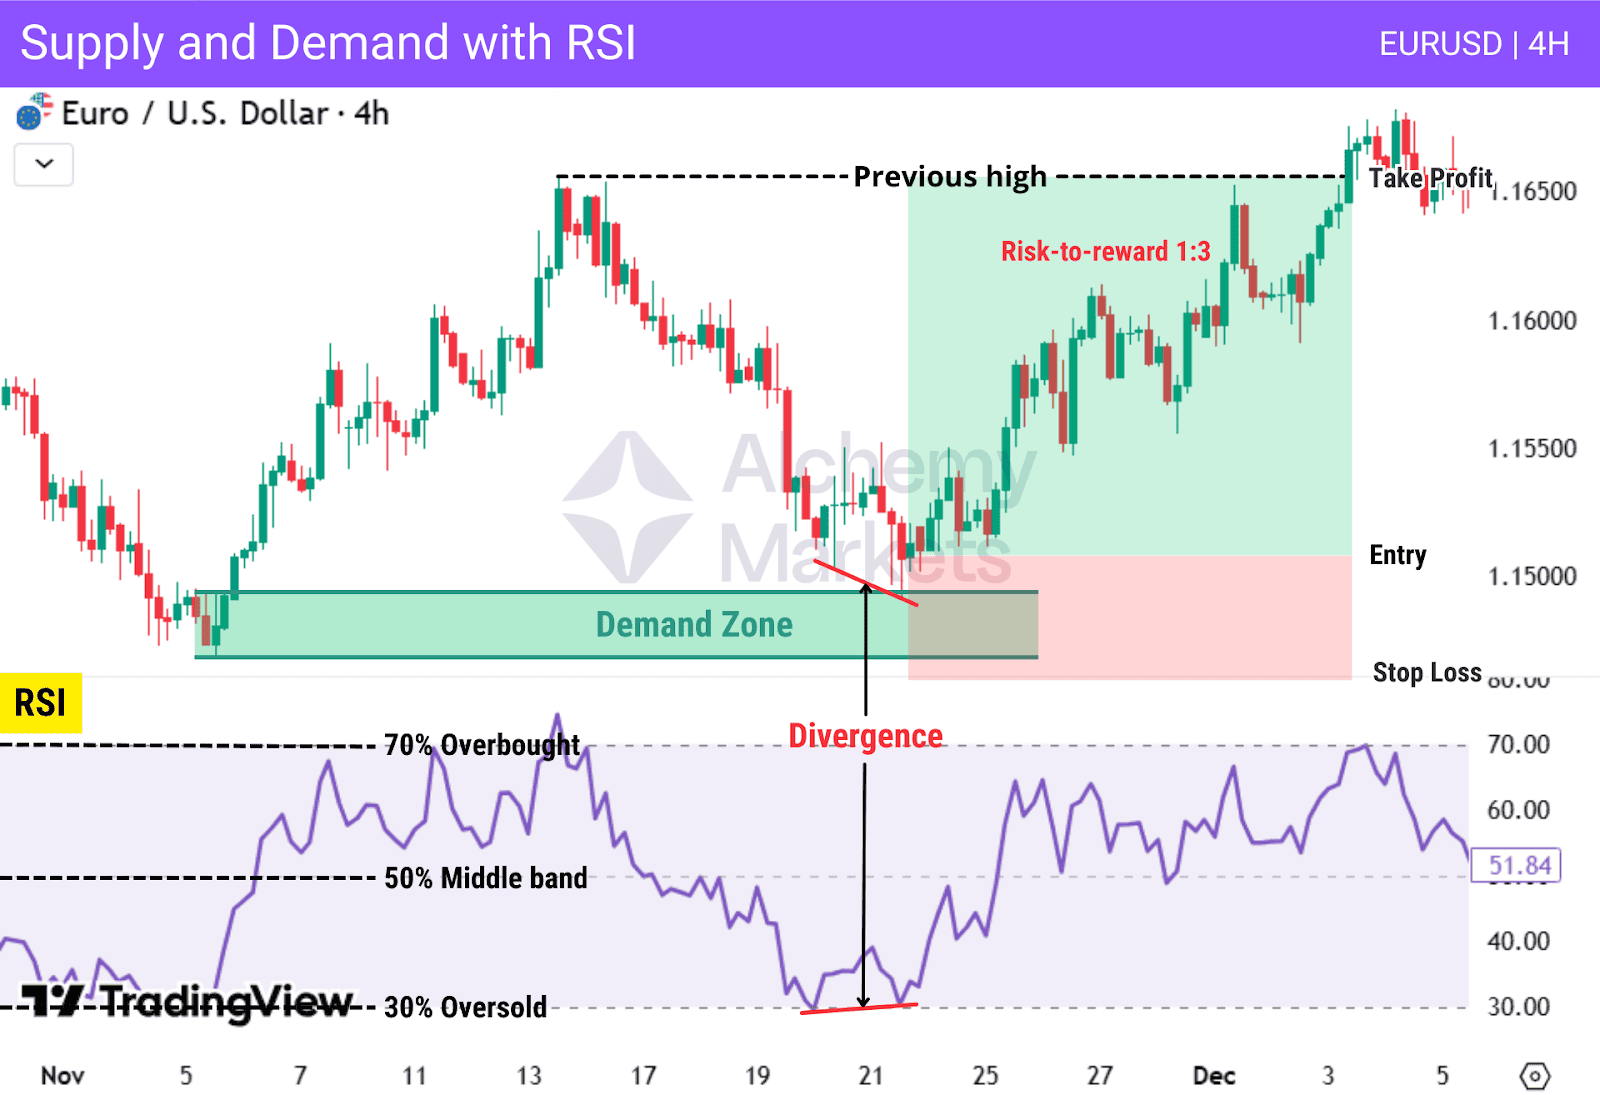
In this example, price reaches a demand zone while RSI drops to the 30 level, indicating oversold conditions. A bullish divergence forms as price makes a lower low while RSI fails to do so, suggesting fading selling momentum. Price then reacts from the demand zone, confirming buyer interest and supporting the long setup.
Supply and Demand with MACD
MACD helps identify trend direction and momentum strength. When supply or demand zones align with MACD trend signals, the reliability of the setup improves. MACD works best as a momentum filter to support trade decisions.
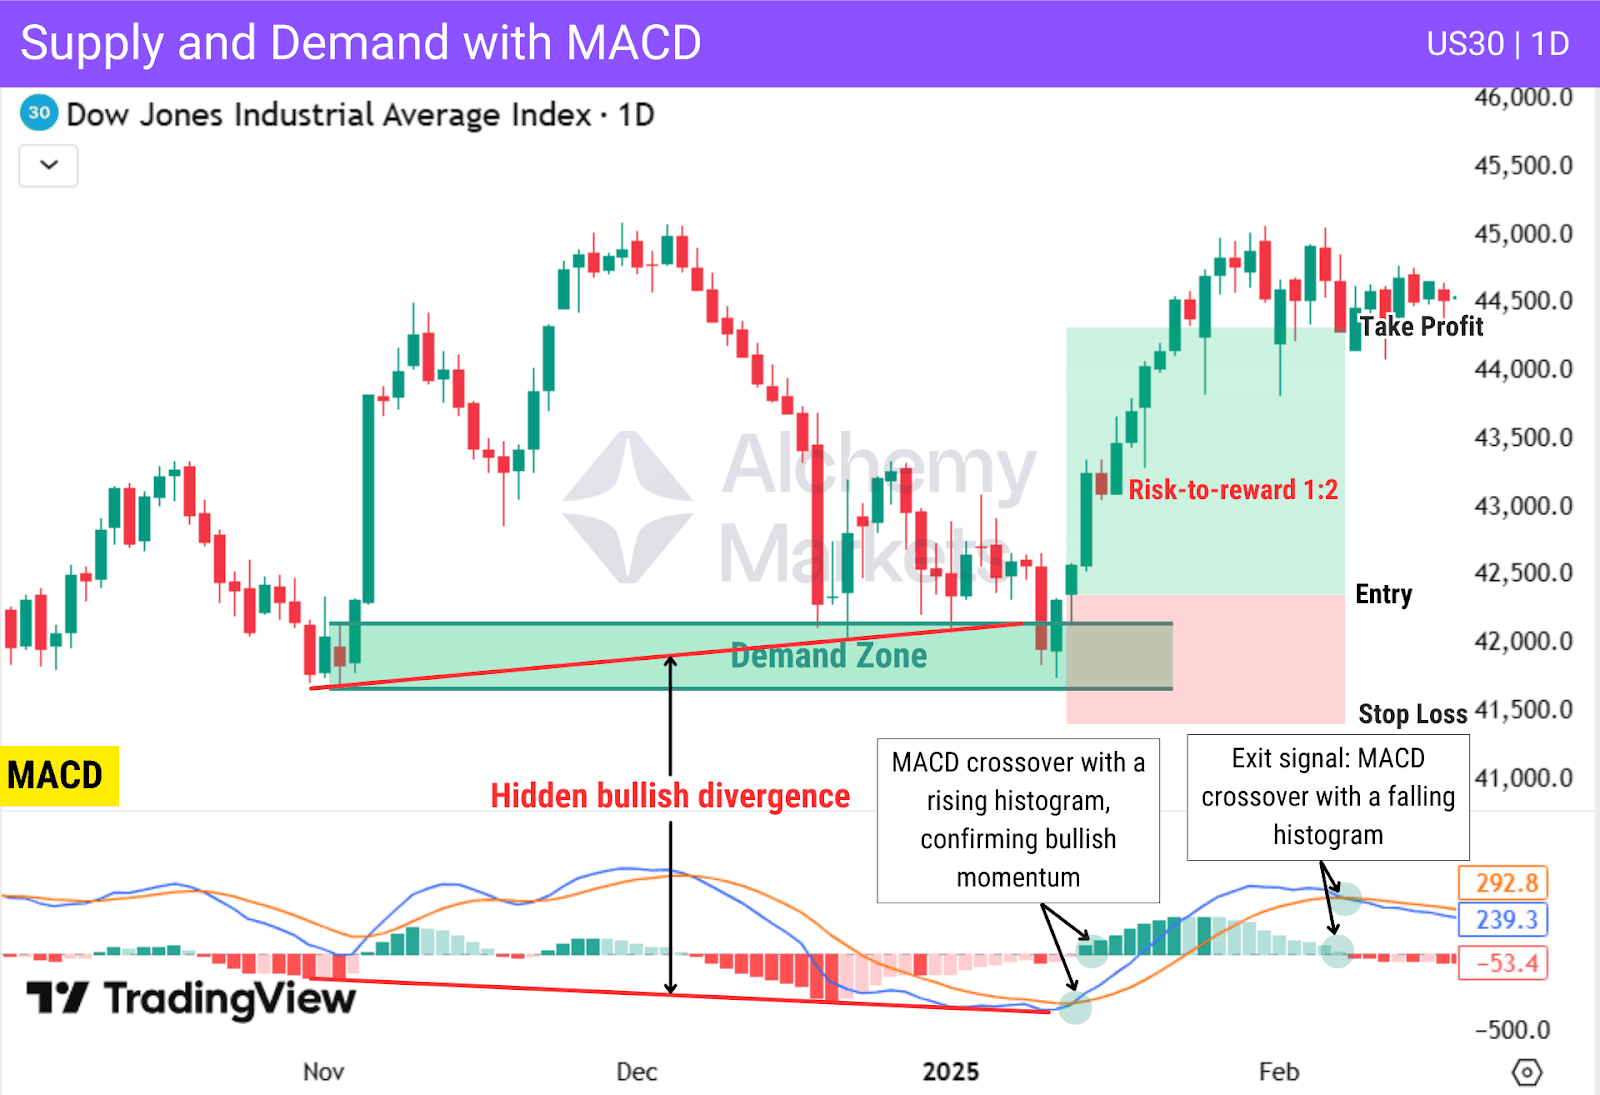
In this example, price reacts from a demand zone while MACD shows a bullish crossover and a rising histogram, confirming bullish momentum.
A hidden bullish divergence supports trend continuation, increasing confidence in the long trade. As momentum weakens and MACD crosses lower, it provides a logical exit signal.
Supply and Demand with Fibonacci Retracements
Fibonacci retracements often overlap with supply and demand zones, adding confluence to trade setups. Demand or supply zones that align with key Fibonacci levels, such as 50% or 61.8%, tend to attract stronger market reactions.
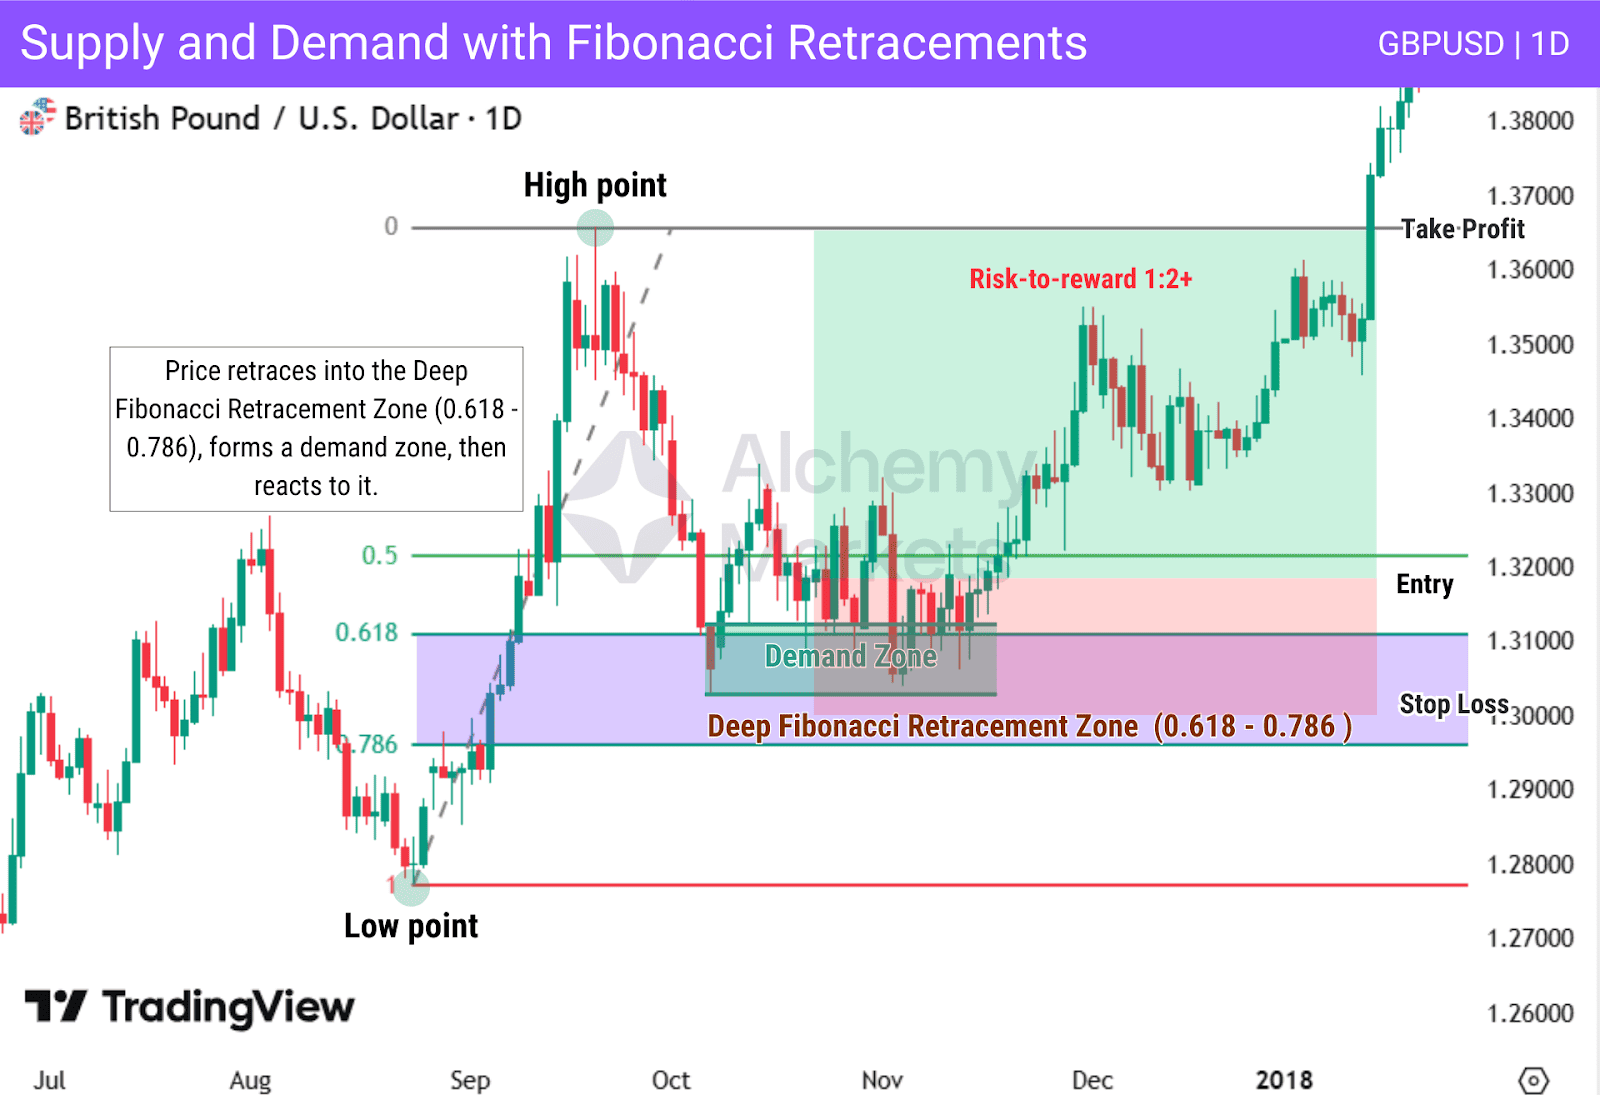
In this example, price retraces into the deep Fibonacci zone (0.618–0.786) and forms a demand zone. The alignment between the Fibonacci retracement and the demand zone strengthens the setup and supports the bullish reaction that follows.
Supply and Demand with Stochastic Oscillators
Stochastic oscillators help identify short-term momentum exhaustion. Overbought readings near supply zones and oversold readings near demand zones can support and confirm a trade idea.
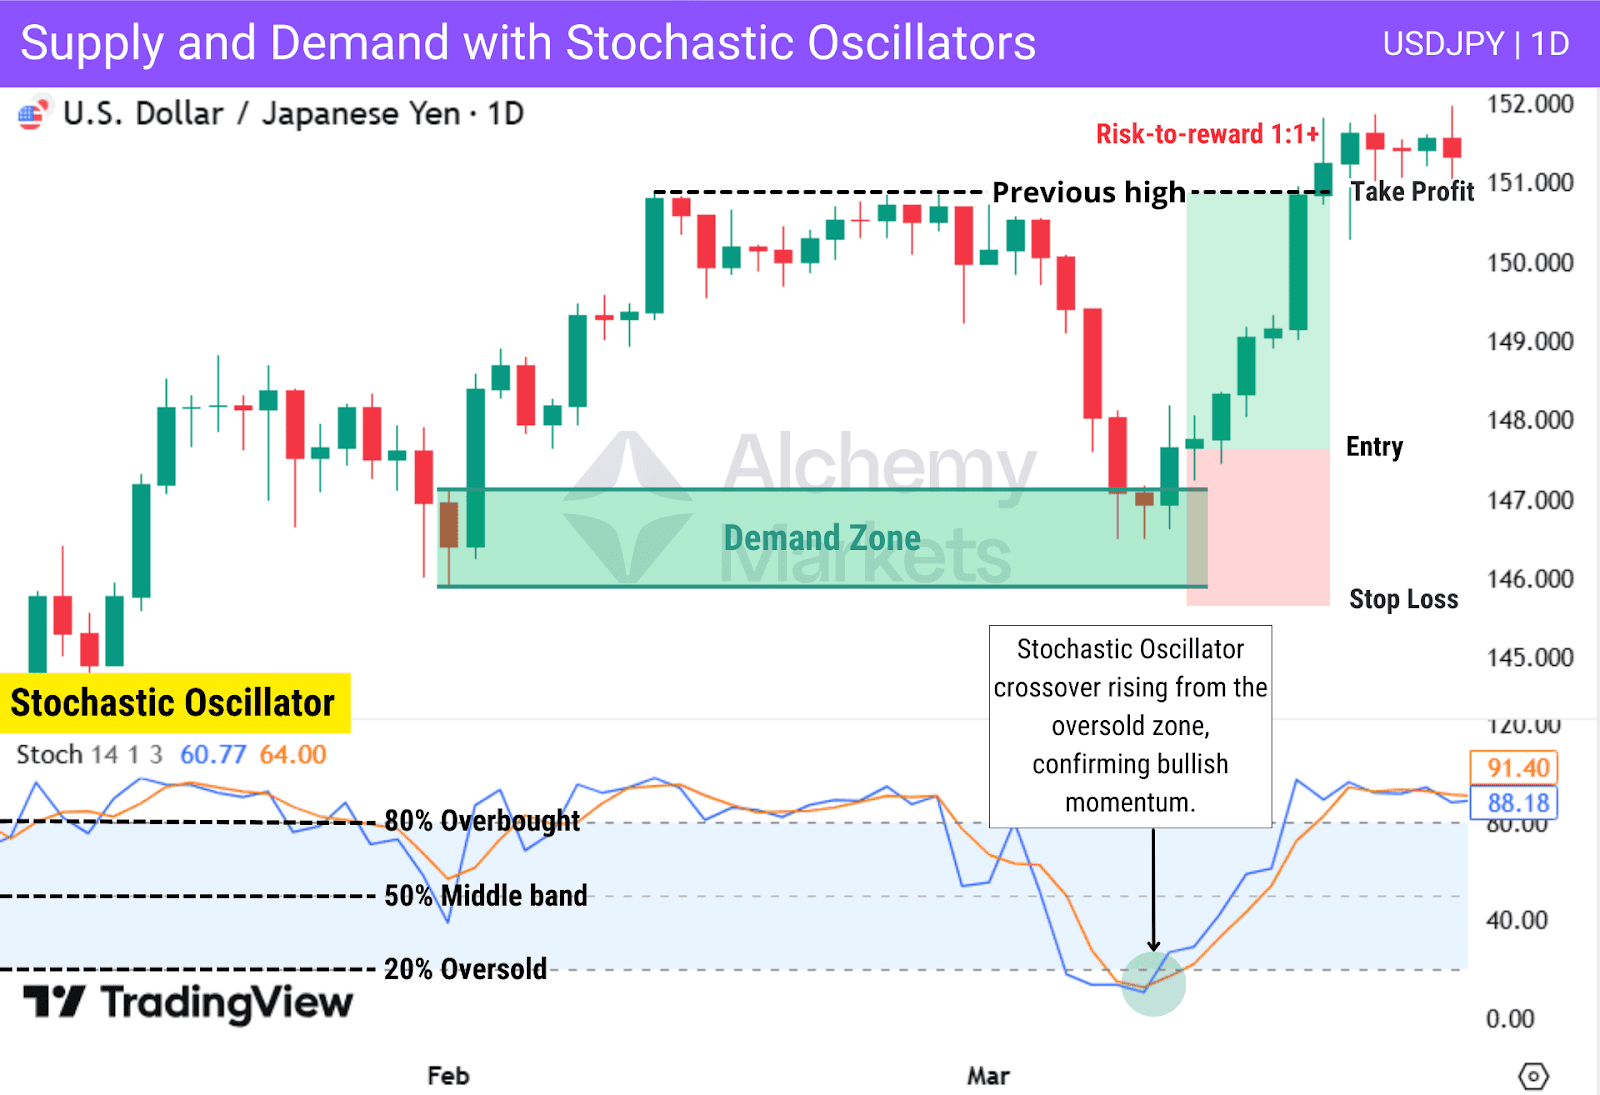
In this example, price retraces into a demand zone and reacts from it as the stochastic oscillator rises from oversold and forms a bullish crossover, confirming the long setup.
Advantages of Supply and Demand Trading
Supply and demand trading offers a structured, logic-based approach to the market. Rather than reacting emotionally to price moves, traders focus on areas where meaningful buying or selling is likely to occur.
| Advantage | Explanation |
| Clear market logic | Supply and demand explains why price moves by focusing on imbalances between buyers and sellers rather than past reactions alone. |
| High-probability trading zones | Supply and demand zones highlight areas where price is more likely to react, helping traders focus on quality setups. |
| Precise risk management | Zones provide clear structural levels for logical stop placement and consistent risk control. |
| Institutional alignment | Many supply and demand zones reflect areas of institutional accumulation or distribution, helping traders align with larger market participants. |
| Flexible across markets and timeframes | The strategy works across forex, stocks, crypto, indices, and commodities, and adapts to different trading styles and timeframes. |
| Cleaner analysis and reduced emotions | Relying on price structure keeps charts simple and encourages patience by trading predefined zones. |
Disadvantages of Supply and Demand Trading
Despite its strengths, supply and demand trading is not a shortcut to success. Like any professional approach, it comes with limitations that require experience, context, and discipline to manage effectively.
| Disadvantage | Explanation |
| Subjectivity in zone drawing | Identifying valid supply and demand zones can vary between traders, especially for beginners, leading to zones drawn too wide or too narrow. |
| Requires screen time and experience | Understanding how zones form, how they evolve, and how price reacts over time requires consistent chart study, not just theoretical knowledge. |
| False reactions and zone failures | Not every supply or demand zone will hold. Strong momentum, news, or shifting market sentiment can cause price to break through zones. |
| Lower-timeframe inaccuracy | On lower timeframes, zones are more prone to noise and false signals, making higher-timeframe alignment essential for reliability. |
| Risk of blind entries | Entering purely on zone touch without confirmation or context can lead to losses, especially when price moves aggressively through a level. |
| Less effective in low-liquidity conditions | In thin or illiquid markets, supply and demand zones may be less reliable due to weak participation and inconsistent order flow. |
Understanding these limitations helps traders apply supply and demand trading realistically, rather than treating it as a guaranteed system.
Supply and Demand Trading vs Support and Resistance Zones
Many traders who analyze stock market charts rely heavily on horizontal support and resistance, but supply and demand goes deeper by explaining the order flow behind those levels.
Support and resistance (S&R) are typically drawn as horizontal price levels, but how traders define them is often subjective. Some mark only the highest high or lowest low of a price pivot. Others require at least two touch points for confirmation, while some draw levels using candle bodies only, or candle wicks only.
While this approach can be effective, it highlights a key limitation of traditional support resistance levels: they show where price reacted before, but not why.
Supply and demand trading goes deeper by focusing on the cause of those reactions. These zones represent areas where buying or selling pressure was strong enough to move price decisively.
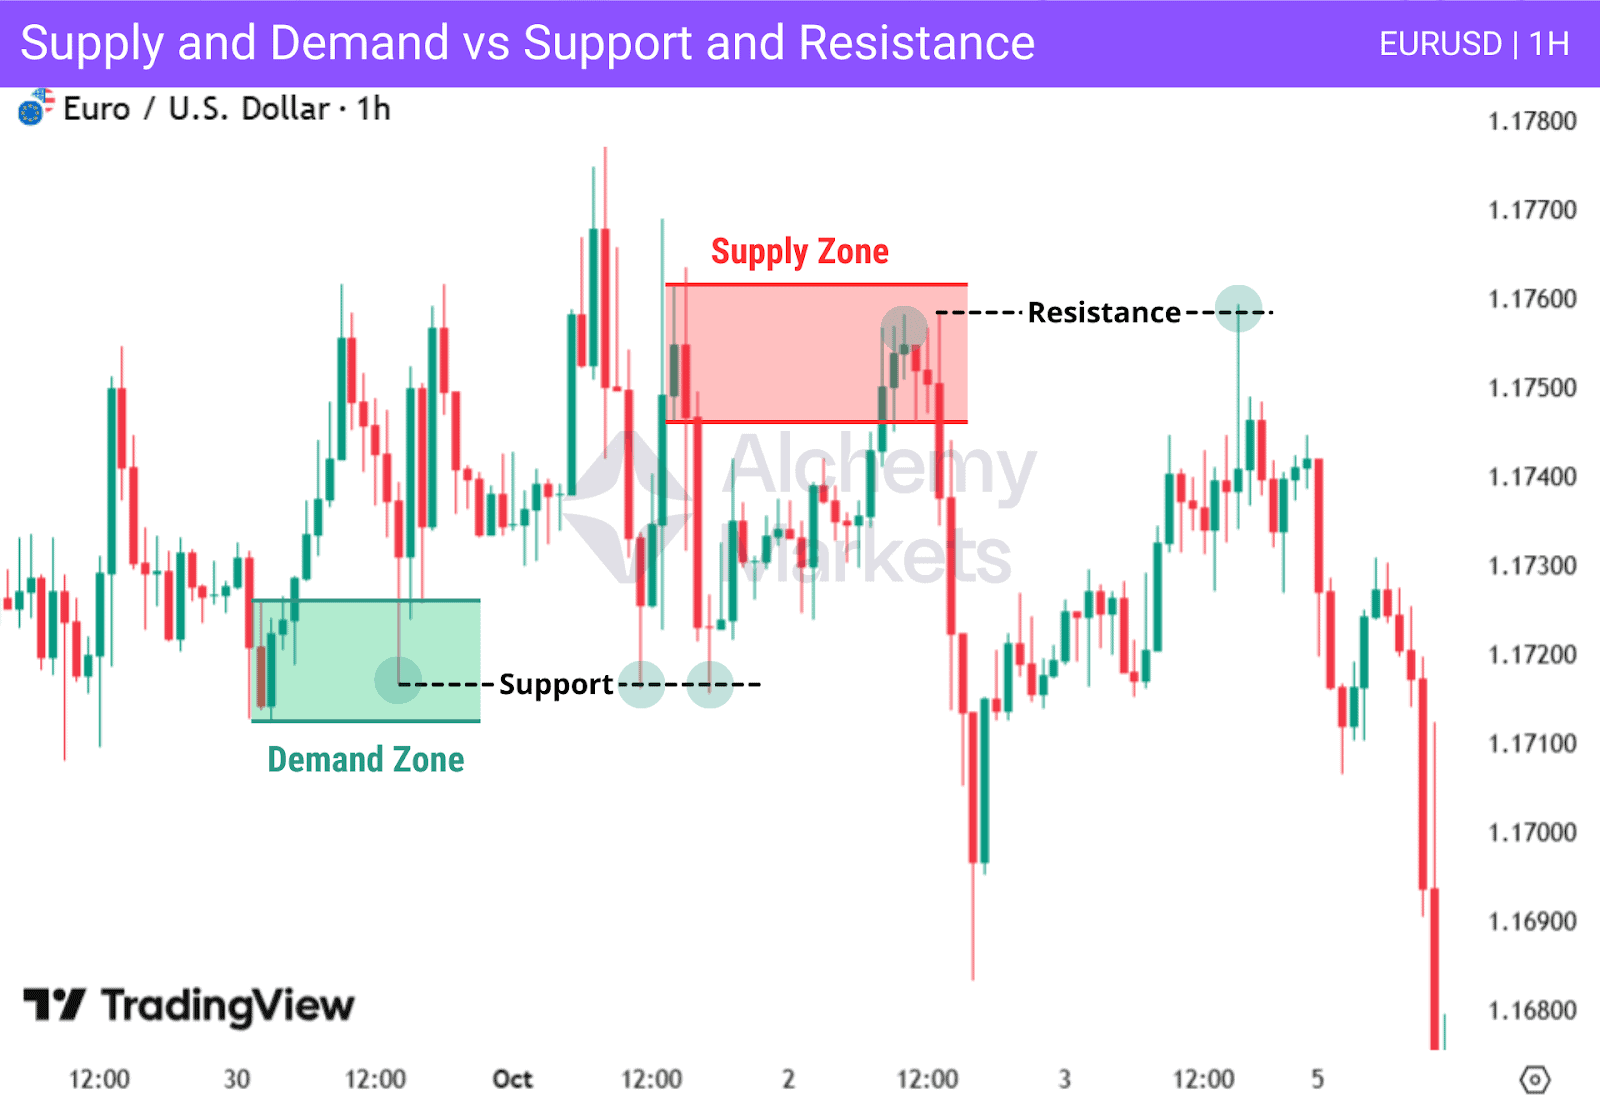
A demand zone reflects aggressive buying that pushes price higher, while a supply zone reflects strong selling that forces price lower. Rather than relying on thin horizontal lines, supply and demand zones are defined as price ranges, allowing for natural variation and small deviations in price behaviour.
In practice, supply and demand zones often overlap with traditional support and resistance. When both concepts align around the same price area, they can be combined to add confluence and improve trade quality.
What Common Mistakes Should Traders Avoid When Using Supply and Demand Trading?
Supply and demand trading is powerful, but only when zones are identified and traded correctly. Most mistakes come from poor zone selection, impatience, or ignoring broader market context. The table below highlights the most common errors and why they lead to low-quality trades.
| Common Mistake | Why It Causes Problems |
| Drawing zones too broadly | Wide zones reduce precision, make stop placement unclear, and weaken risk-to-reward |
| Misaligned timeframes | Trading lower-timeframe zones often leads to losses especially against higher-timeframe trends |
| Over-reliance on tools | Indicators can distract from price behaviour and hide weak or invalid zones |
| Trading weak zones | Zones formed by slow price movement or weak departures often fail |
| Chasing the market | Entering after price has already moved removes the zone’s edge and increases risk |
Avoiding these mistakes helps traders focus on high probability zones instead of reacting emotionally to price movements.
FAQ
What is the best time frame to use for trading with supply and demand?
Higher timeframes such as the daily and 4-hour charts tend to produce more reliable supply and demand zones. Lower timeframes can be used for entries, but only when aligned with higher-timeframe structure.
Which indicators work best for finding supply and demand zones?
Supply and demand zones are best identified using price action alone. Indicators like RSI, MACD, moving averages, or volume can support confirmation, but they should never replace zone identification.
What’s the difference between aggressive zones and strong high low zones?
Aggressive zones form quickly after sharp price moves and offer early entries with higher risk. Strong high low zones are more conservative, formed after clearer structure, and generally provide more reliable reactions.
Should I only trade fresh zones and avoid tested zones?
Fresh zones usually offer better probabilities because orders have not yet been absorbed. Each revisit reduces a zone’s strength, so tested zones should be traded with caution or avoided.
What is the relation between demand and supply?
Demand represents areas of strong buying interest, while supply represents areas of strong selling interest. Price moves between these zones as the market seeks balance.
Why is supply and demand trading so effective?
It aligns traders with how financial markets actually operate, focusing on imbalances created by large market participants rather than lagging signals.
How institutional traders use supply and demand
Institutions often build positions using limit orders within supply and demand zones. These areas later act as key reaction points when price returns.
What is the basic principle of demand and supply?
When demand outweighs supply, price moves higher. When supply outweighs demand, price moves lower. Markets constantly rotate between these two forces.
How reliable is supply and demand trading?
No strategy is perfect, but when combined with market structure, price action, and disciplined risk management, supply and demand trading can offer consistently high probability trade setups.


