


Written by:

Reviewed by:

- October 2, 2025
- 30 min read
Risk Reward Ratio – How Traders Use It
What is Risk Reward Ratio?
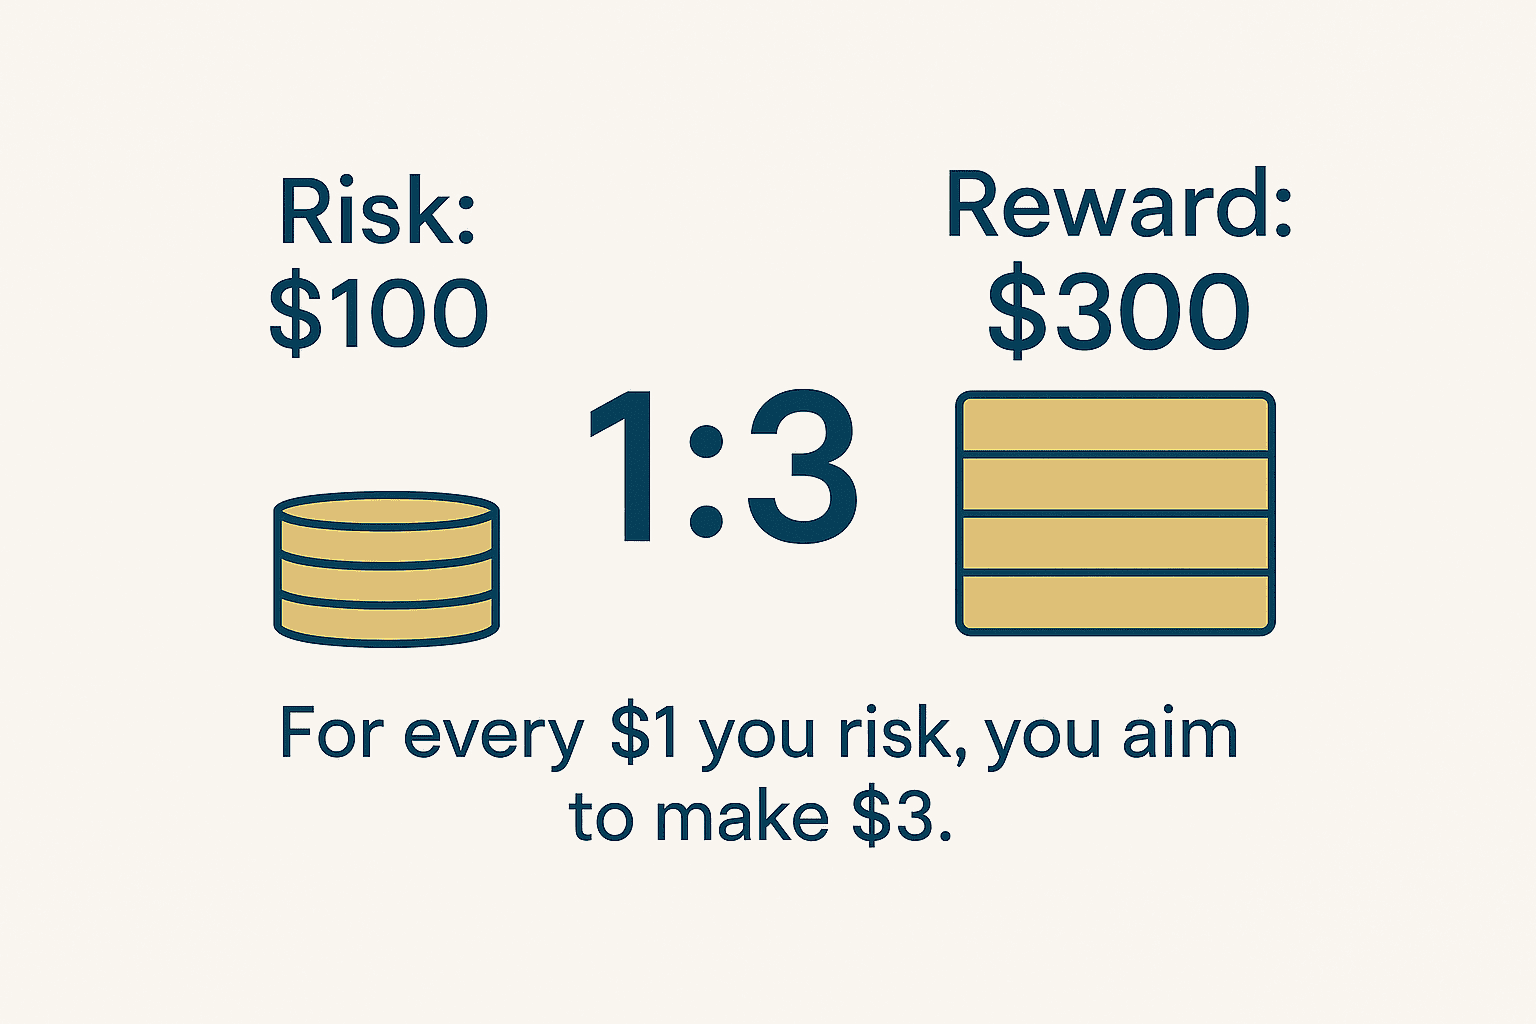
Risk reward ratio is a measure of how much you stand to profit for every dollar you risk on a trade. It is a simple but powerful tool that traders and investors use in the financial markets to assess the expected return on a trade per unit of risk. For example, if you risk $100 to make $300, your risk reward ratio is 1:3. This means for every $1 you risk, you aim to make $3.
This ratio helps traders make smarter decisions. It gives you a clear picture of whether a trade is worth taking or not. If the potential reward is not much higher than the risk, most traders will skip the trade. It’s all about finding trades where the possible reward is bigger than the possible loss.
Who uses it?
Both retail and professional traders rely on this ratio. Day traders, swing traders, crypto traders, options traders, and even long-term investors in the financial markets use it in their trading plan. It’s not limited to any one market – you’ll find it being used in stocks, forex, crypto, commodities, and more.
Even big institutions and hedge funds consider risk reward ratios before placing trades. It’s part of good risk management, and over time, it helps improve profitability.
Here’s the bottom line: A good reward risk ratio doesn’t guarantee that every trade will win, but it increases your chances of staying profitable over the long run by seeking opportunities with large potential gains to gobble up many small losses.
Now, to use the reward to risk properly, you need two key things set up on every trade: a take profit order and a stop loss order.
Setting up take profit order
A take profit order is the price level where you want to close the trade and lock in your profits. It’s like telling your trading platform, “If the price reaches this level, sell my position and take the money.”
For example, let’s say you buy a stock at $100 and set your take profit at $120. If the stock hits $120, a take profit order (usually placed as a limit order) will attempt to sell your shares at that price or better, but it will only execute if there’s enough liquidity available to fill your order.
Why is this important for risk reward ratio?
Because your target price (take profit level) is the “reward” part of the equation. Once you know how much you’re aiming to make, you can compare it to how much you’re risking. This helps you figure out if the trade is worth it.
Setting up stop loss order
A stop loss order is the safety net to manage risk. It tells your trading platform to automatically exit the trade if the price moves against you. Think of it as the level where you admit the trade didn’t work out and you cut your losses.
Using the same example, if you bought a stock at $100 and set a stop loss at $95, it means you’re willing to risk $5 per share. If the stock drops to $95, the stop loss will trigger and convert to a market order to sell your position. This helps you limit further losses, but in fast-moving markets, the actual price you get filled at could be lower due to slippage.
This is the risk part of the risk-reward ratio. Without a stop loss, you’re basically guessing how much you might lose — which is not smart trading.
By using both stop loss and take profit levels, you make your trades more structured and professional. You’re not just trading on hope — you’re trading based on clear numbers.
The Importance of Balancing Risk and Reward in Trading Strategies
One of the most important things in trading is understanding how to manage your risk while aiming for reward. If you take too much risk for too little reward, you might win a few trades, but in the long run, you’ll likely lose more than you gain.
A good risk-reward ratio helps you avoid that trap. It gives you a clear idea of whether a trade is worth it before you even enter the position. Most traders aim for a ratio like 1:2 or 1:3 — meaning they risk $100 to make $200 or $300. That way, even if they win on less than half of their trades, they can still come out ahead in the aggregate of trades.
Why This Matters for Long-Term Success
Having a solid risk-reward strategy is one of the key things that separates successful traders from beginners. If your losses are always bigger than your wins, you’re constantly playing catch-up. But when your wins are larger than your losses — even with a lower win rate — your trading becomes more sustainable.
Traders who plan trades around a fixed risk-reward ratio often perform better over time because their strategies are repeatable. They don’t trade emotionally. They let the numbers guide their decisions.
Traders Use Different Methods to Calculate It
Not all traders calculate risk-reward the same way. Some use simple price levels. Others use volatility indicators, chart patterns, or historical data. For example:
- Some traders use previous support/resistance levels to place their stop loss and take profit.
- Others use tools like ATR (Average True Range) or Fibonacci retracements to find smart exit and entry points.
- Some traders even factor in fundamental data or news to adjust their risk-reward outlook.
There’s no single risk reward ratio formula – but the core idea stays the same: don’t risk more than the trade is worth in profit potential, or keeping your risk reward ratio and 1:1 or better.
How Does the Risk to Reward Ratio Works
The risk to reward ratio helps traders manage their capital by comparing how much they are willing to lose (risk) to how much they hope to gain (reward). It’s a straightforward concept, but one that plays a critical role in trading success.
Here’s how it works: For every trade, there’s always some risk of loss. However, a key principle is that the potential reward should always be greater than the risk. This way, even if you don’t win every trade, you can still end up with more profits than losses over time.
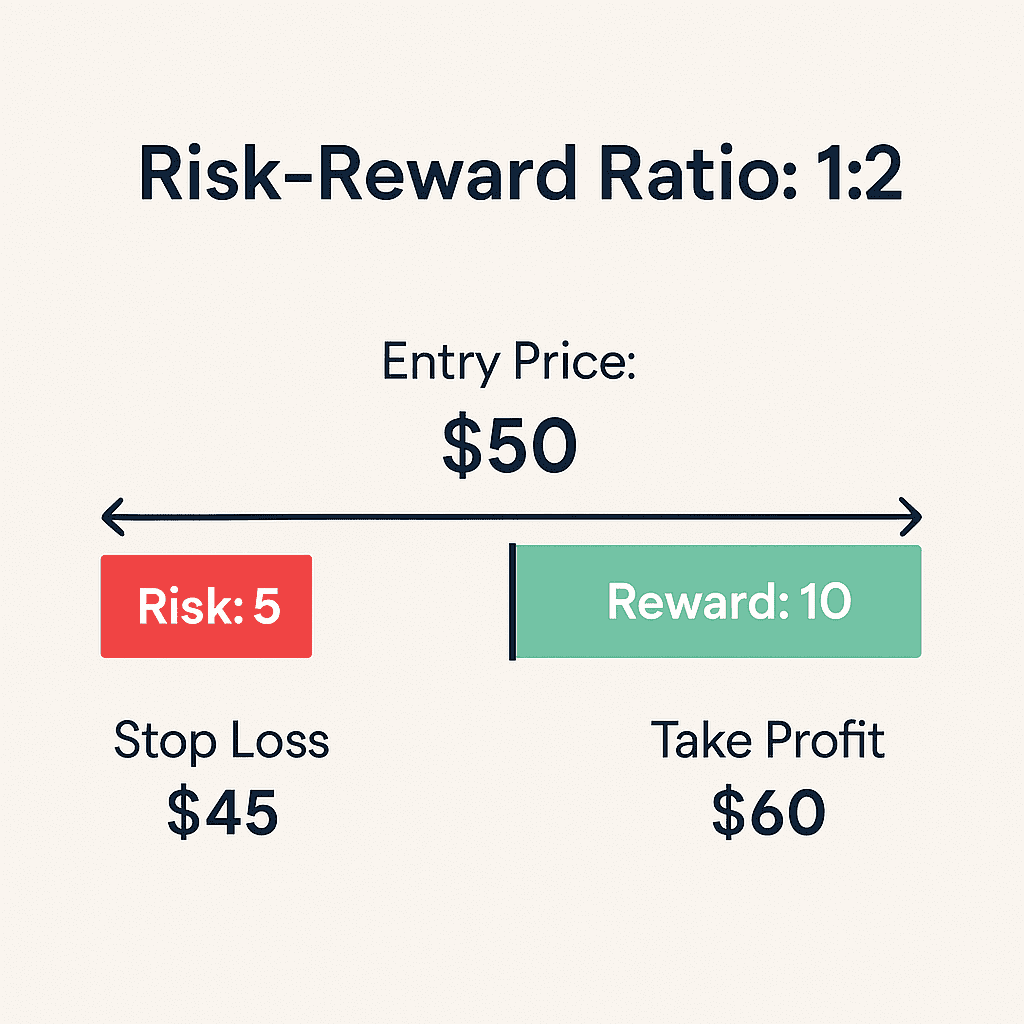
Let’s break it down with an example:
- Entry price: $50
- Stop loss: $45
- Take profit: $60
In this case:
- Risk: You’re risking $5 (from $50 to $45)
- Reward: You’re aiming to gain $10 (from $50 to $60)
This gives us a risk-reward ratio of 1:2. Essentially, you’re risking $1 to potentially make $2.
Let’s say you make 10 trades with this setup and win 4 out of 10. Here’s the breakdown:
- Wins: 4 trades × $10 = $40
- Losses: 6 trades × $5 = $30
- Total Profit: $40 (wins) – $30 (losses) = $10 profit (minus commissions)
So, even with a lower win rate, as long as your winners are bigger than your losses, you can end up with a profit. That’s how the ratio works in practice.
Why Traders Use It
The risk to reward ratio is used by traders of all kinds — day traders, swing traders, and even long-term investors. It’s not just about picking the right direction — it’s also about knowing when to get in and when to get out. And more importantly, when to walk away from a bad trade.
Using this ratio helps traders stay disciplined. Instead of getting emotional and holding onto losing trades, they stick to a clear plan. It also helps filter out bad setups. If a trade has a poor risk to reward, many traders just skip it.
How to Calculate Risk Reward Ratio
The risk reward calculation is simple and can be done using the following steps:
- Determine your entry price (the price at which you plan to buy or sell).
- Set your stop loss (the price level at which you will exit the trade to limit your loss).
- Set your take profit (the price at which you plan to close the trade and lock in your profit).
Now, calculate the risk by taking the absolute value of the difference between your entry price and stop loss. Then, calculate the reward by taking the absolute value of the difference between your entry price and take profit.
Finally, divide the reward by the risk to get your ratio:
Risk-Reward Ratio = Take Profit – Entry ÷ Stop Loss – Entry
Example 1 – Long Position (SPX):
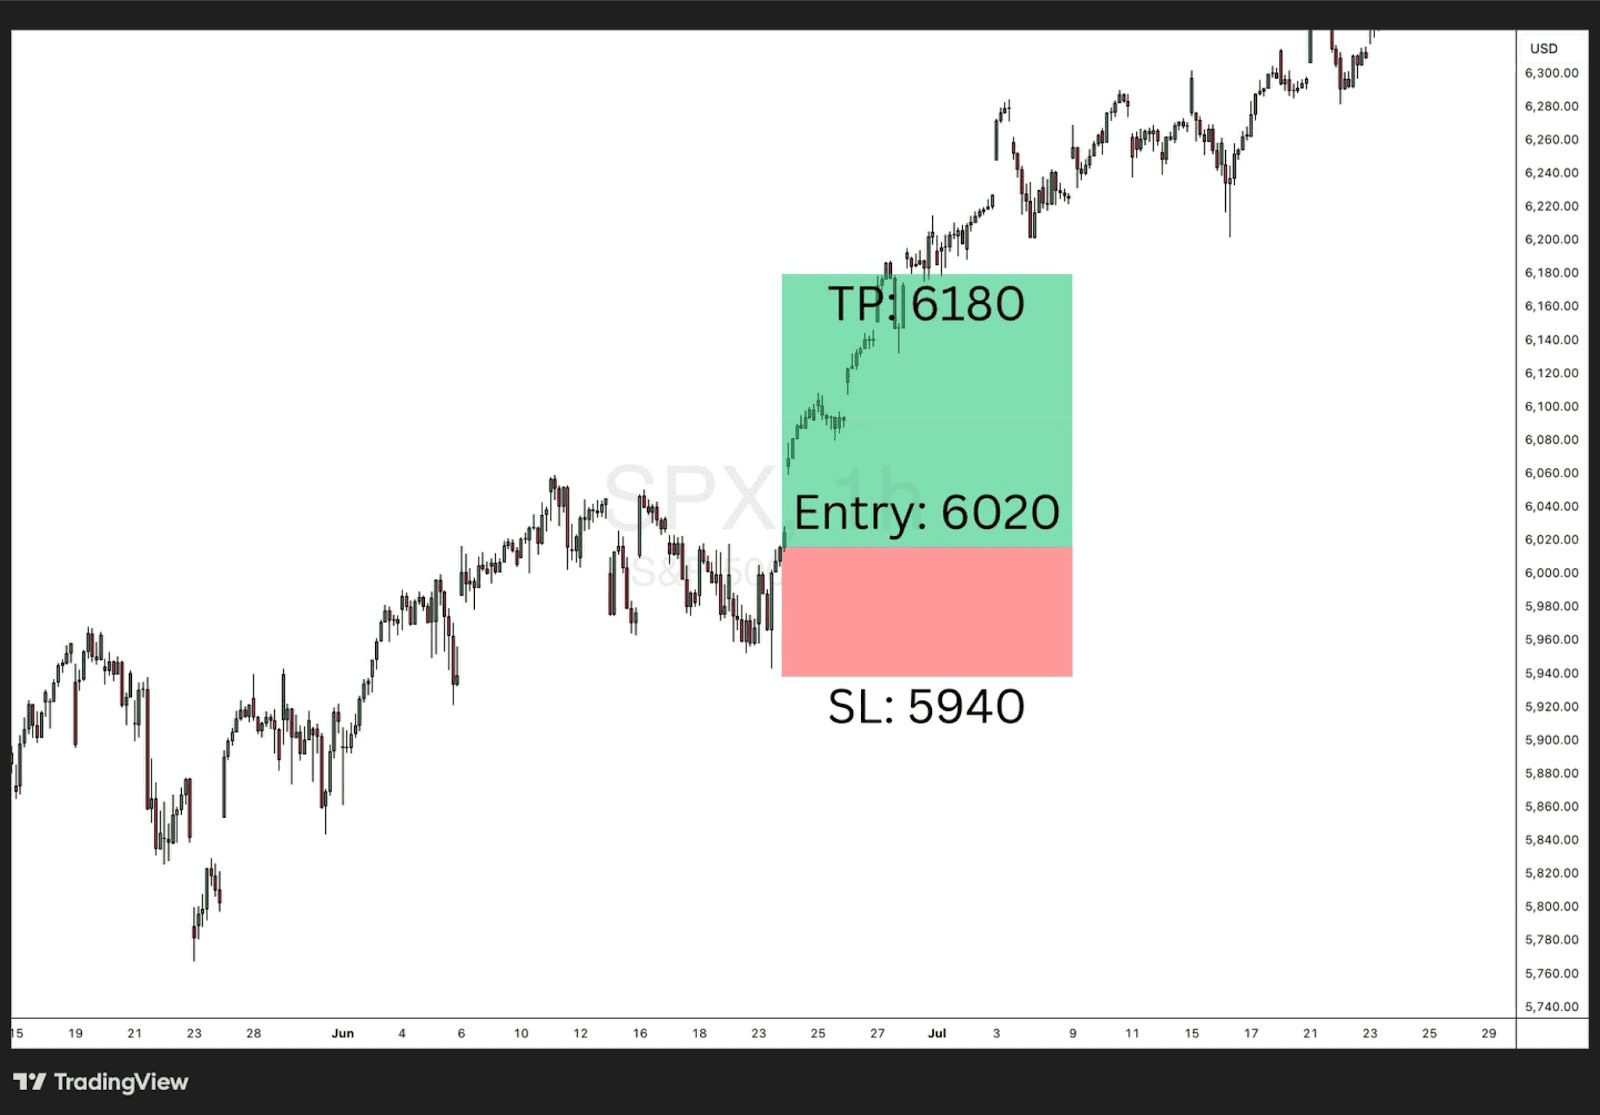
- Entry: 6,020
- Stop Loss: 5,940
- Take Profit: 6,180
- Risk: 5,940 – 6,020 = 80
- Reward: 6,180 – 6,020 = 160
- Risk-Reward Ratio: 160 ÷ 80 = 1:2
In this case, for every point you risk, you aim to make 1.75 points. It’s a clean setup with a favourable upside compared to the downside.
Example 2 – Short Position (Gold):
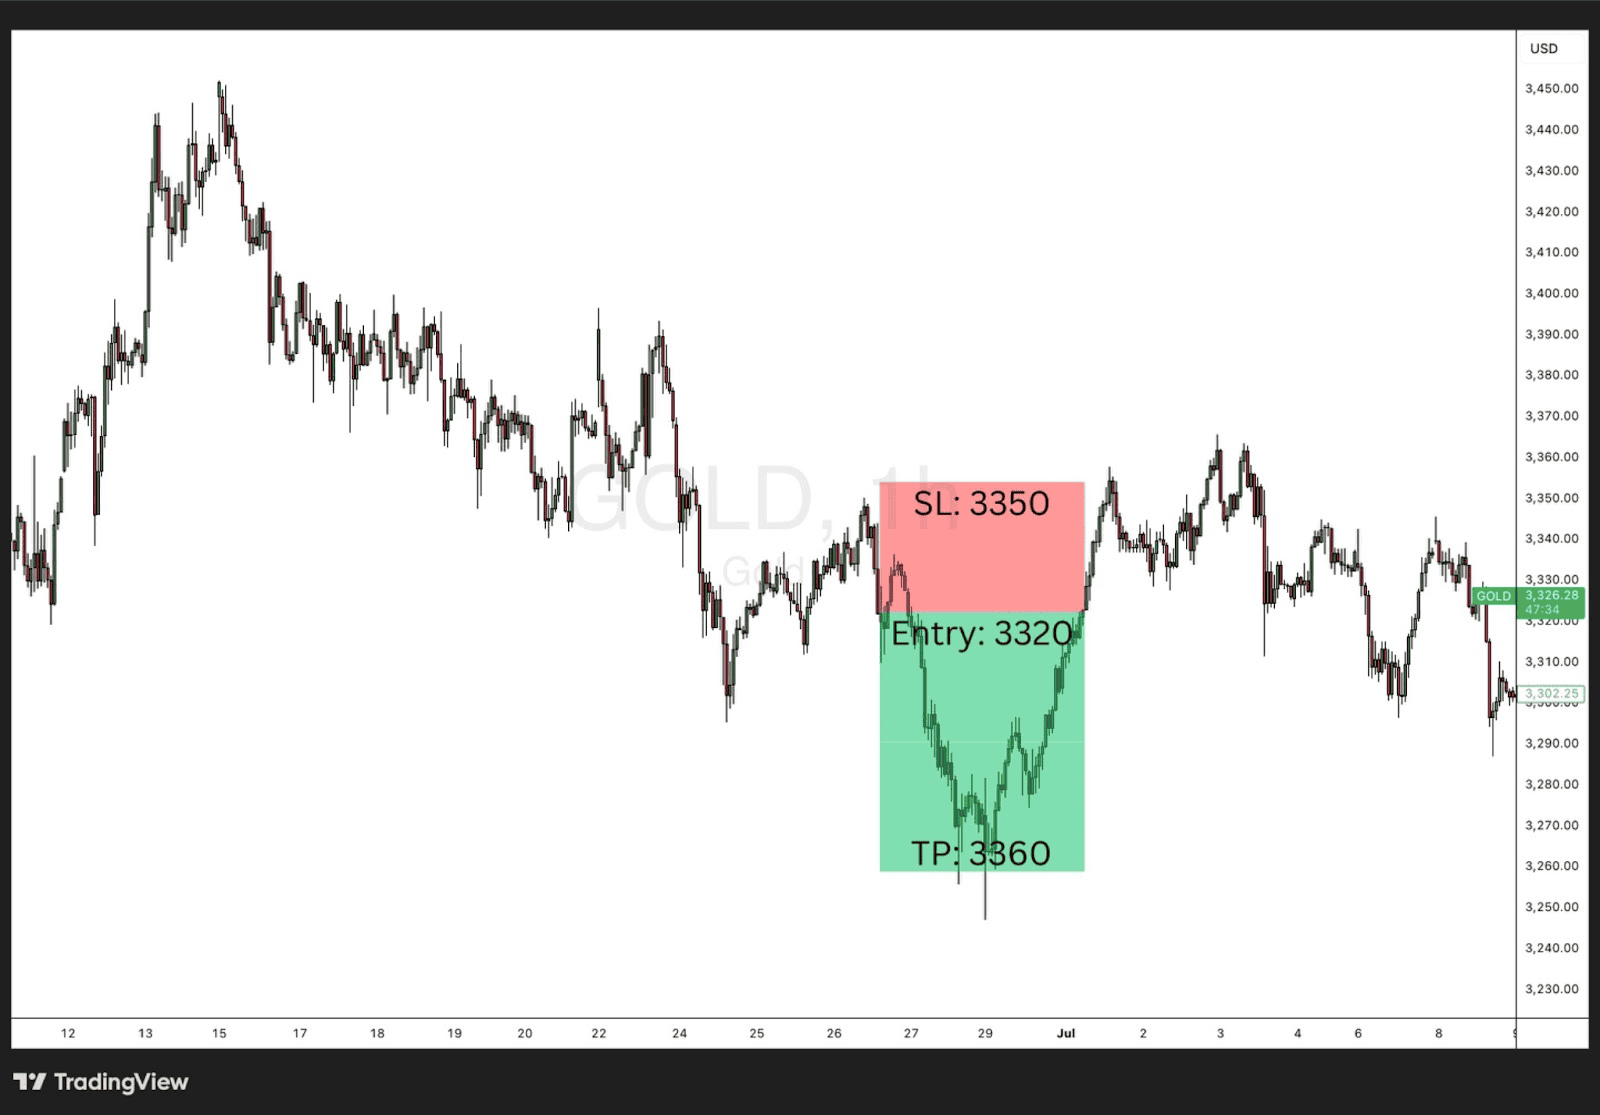
- Entry: 3,320
- Stop Loss: 3,350
- Take Profit: 3,260
- Risk: 3,350 – 3,320 = 30
- Reward: 3,320 – 3,260 = 60
- Risk-Reward Ratio: 60 ÷ 30 = 1:2
Here, you’re shorting gold at 3320 with a stop loss at 3350 and a take profit at 3260. The setup gives you a 1:2 ratio, which is a solid risk-to-reward profile — you’re aiming to make double what you’re risking
Risk Reward Ratio Formula
The formula for the risk-reward ratio is simple and essential for assessing whether a trade is worth taking. Here’s how you calculate it:
- Risk = Entry Price – Stop Loss Price
- Reward = Take Profit Price – Entry Price
- Risk-Reward Ratio = Reward ÷ Risk
For example, if you enter a trade at $50, set a stop loss at $45 (risking $5), and target a take profit at $60 (aiming for $10), the calculation would look like this:
- Risk = $50 – $45 = $5
- Reward = $60 – $50 = $10
- Risk-Reward Ratio = $10 ÷ $5 = 1:2
This means for every $1 you risk, you’re aiming to make $2. A ratio of 1:2 or higher is generally considered favourable for consistent, profitable trading.
Short Position Example – (Forex):
Let’s say you’re shorting EUR/USD at 1.1050, with a stop loss at 1.1100 and a take profit at 1.0950.
- Risk = 1.1050 – 1.1100 = 50 pips
- Reward = 1.1050 – 1.0950 = 100 pips
- Risk-Reward Ratio = 100 ÷ 50 = 1:2
Here, you’re risking 50 pips to gain 100 pips — another clean 1:2 setup that traders often look for in trending forex markets.
Risk-Reward Profiles
Risk-reward profiles are crucial for understanding the relationship between potential risks and rewards in any trade or investment. These profiles help traders assess whether a trade is worth entering based on their personal risk tolerance and financial goals.
Each trade has its own risk-reward profile, which is influenced by factors like the trader’s stop loss, take profit levels, and the volatility of the market. Understanding these profiles allows traders to make more informed decisions about where to place their stop loss and take profit orders, as well as how much capital they are willing to risk on a given trade.
For instance, a high risk-reward profile might involve aiming for large rewards (e.g., a 1:3 risk-reward ratio), where the potential gain is much higher than the amount being risked. On the other hand, a low risk-reward profile might involve smaller rewards with relatively higher risk (e.g., a 1:0.8 ratio), meaning you’re risking more than you expect to gain. While the lower ratio might give a higher win rate, it also puts more pressure on being accurate and consistent, since a few losses can wipe out multiple small wins.
High Risk Reward Ratio
A high risk-reward ratio typically involves risking a relatively small amount of capital for a chance to earn a much higher reward. For instance, a trader might risk $100 to make $300, resulting in a 1:3 risk-reward ratio.
Example – Silver (XAG/USD):
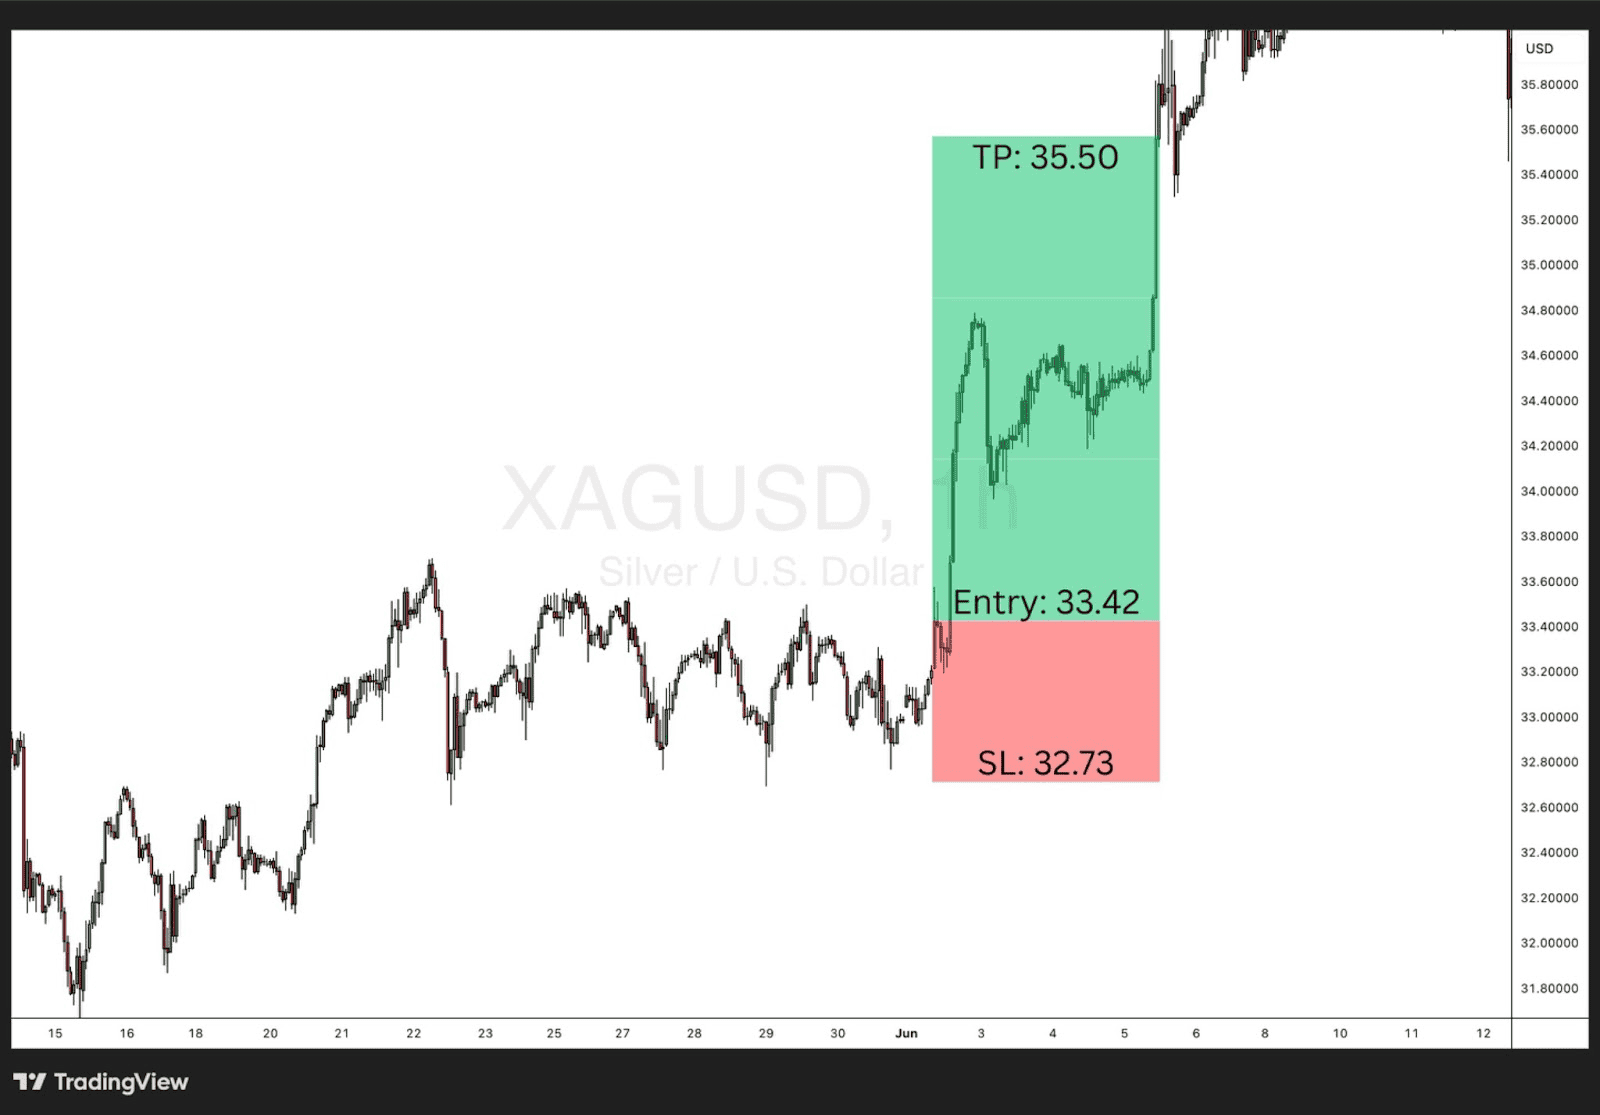
Let’s say you’re trading Silver, and you go long at $33.42, with a stop loss at $32.73 (risking $0.69) and a take profit at $35.50 (aiming for $2.08). This gives you a 1:3 risk-reward ratio.
- Risk = $33.42 – $32.73 = $0.69
- Reward = $35.50 – $33.42 = $2.08
- Risk-Reward Ratio = $2.08 ÷ $0.69 ≈ 1:3
Why High Risk-Reward Ratios Are Good:
- Potential for Larger Profits: If successful, a high risk-reward ratio can significantly boost your profitability. For example, with a 1:3 ratio, even if you win only a few trades, you can still come out ahead.
- Appealing for Big Moves: Traders looking for larger, high-impact trades (e.g., breakout trades, swing trades) often use high risk-reward ratios, aiming for larger market moves.
Why High Risk-Reward Ratios Are Bad:
- Higher Probability of Loss: A high-risk trade, even with an attractive reward, is more likely to hit the stop loss, especially in volatile markets. This means you might have to win big trades just to break even, which isn’t always feasible.
- Emotional Strain: Since these trades often involve bigger market moves, it can be stressful to hold a position through significant swings, particularly for traders with lower risk tolerance.
Low Risk Reward Ratio
A lower risk-reward ratio below 1:1 means the potential risk for the trader is greater than they hope to gain. For example, a ratio of 1:0.8 means you’re risking $1 to make only $0.80. These types of trades are usually used when a trader is aiming for small, quick profits or needs to exit a position with minimal movement.
Example:
Let’s say you’re trading gold, which is currently priced at $3,380 per ounce. You enter a long position at $3,380, set your stop loss at $3,370 (risking $10), and place your take profit target at $3,388 (aiming to gain $8). This creates a 1:08 risk-reward ratio.
- Risk: $3,380 (entry) – $3,370 (stop loss) = $10
- Reward: $3,388 (take profit) – $3,380 (entry) = $8
- Risk-Reward Ratio = $8 (reward) ÷ $10 (risk) = 1:0.8
Impact of Low Risk-Reward Ratios
Low risk-reward ratios — such as 1:0.8, where you risk more than you aim to gain — might result in a higher win rate, but they often lead to lower overall profitability, especially for newer traders. The trades may hit the take profit target more often, but the gains are small, and just one large loss can erase multiple wins.
Because the reward is smaller than the risk, traders using this strategy must take many more trades to see meaningful returns. This not only increases exposure to fees and commissions, but also adds pressure to maintain a near-perfect win rate, which is difficult in real market conditions.
The biggest issue is the increased exposure to risk. Since you’re consistently risking more than you stand to gain, your margin for error is razor thin. For newer traders without strong discipline or precision, this often leads to frustration, emotional decision-making, and eventual losses.
In short, while low risk-reward trades may seem appealing for their higher success rate, the overall impact is often negative, making them a poor choice for building a stable, long-term trading strategy.
What is a good risk reward ratio?
A good risk-reward ratio is one that fits your trading style, risk tolerance, and market conditions. Typically, a higher reward is paired with higher risk, and it’s essential for traders to balance the two for long-term success. Depending on your goals and strategy, a good ratio might vary. Let’s break down common risk-reward ratios and when they might be ideal.
Is 1:1 Risk Reward Ratio a good ratio?
A 1:1 risk-reward ratio means you’re risking $1 to make $1, essentially breaking even if you win and lose the same amount.
Why It’s Good:
- Simple and balanced: It’s a straightforward approach, particularly for beginner traders who want to keep things simple.
- Frequent wins: Since the reward is equal to the risk, it’s easier to target smaller, achieving more potential profit. This can work well in markets where quick, small moves are common.
Why It’s Not Ideal for Long-Term Success:
- High win rate needed: A 1:1 ratio requires a high win rate (over 50%) to stay profitable. Even a slight dip in your win rate could result in losses.
- Limited rewards: The potential profit doesn’t outweigh the risk, meaning that even though you might win frequently, your returns will be limited.
1:2 Risk Reward Ratio a good ratio?
A 1:2 risk-reward ratio means you risk $1 to make $2, which is a more balanced approach for many traders.
Why It’s Good:
- Better profit-to-risk ratio: With a 1:2 ratio, your potential profit is double the risk, which provides a buffer against losing streaks. You don’t need to win as often to stay profitable.
- Sustainable for long-term trading: Traders who aim for a 1:2 ratio often have better consistency in returns over time, as their wins are worth more than their losses.
When It’s Not Ideal:
- Potential for fewer trades: Depending on the market, the 1:2 ratio might be harder to achieve consistently, especially in choppy or slow-moving markets. It requires more patience and precision.
1:3 Risk Reward Ratio a good ratio?
A 1:3 risk-reward ratio means you’re risking $1 to make $3, which is the preferred ratio for many experienced traders, as it significantly increases potential profit.
Why It’s Good:
- High profit potential: With a 1:3 ratio, even if you lose a few trades, you can still make a profit, as your winners will outweigh the losses. This is especially useful for traders who are willing to take on higher risk for bigger rewards.
- More room for losses: Since your reward is larger, you can afford to lose more trades without damaging your overall profitability.
When It’s Not Ideal:
- Increased risk: The higher the reward, the higher the risk. Trades with a 1:3 ratio can sometimes be more volatile and are typically used in markets with more significant movements (e.g., swing trading or high-impact news events).
- Difficult to achieve consistently: It can be challenging to achieve a 1:3 ratio on every trade. You might need to rely on technical analysis or market insights to target bigger moves.
Risk Reward Ratio Example
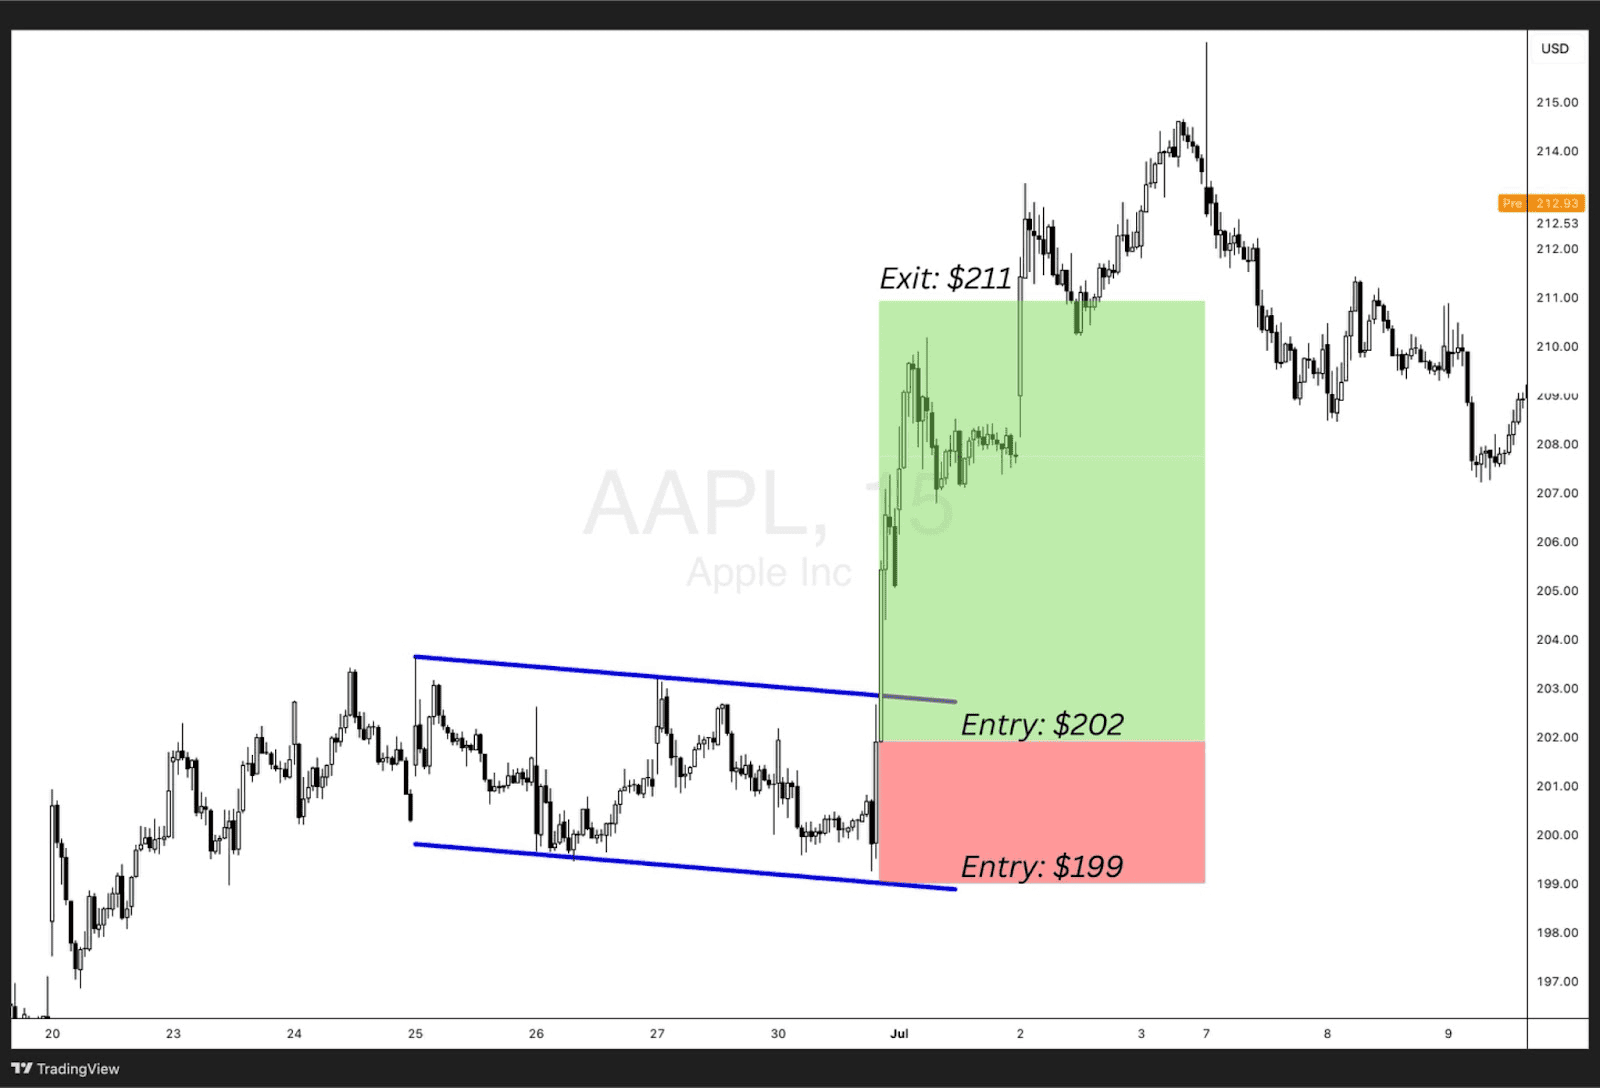
Let’s break down a real example of a 1:3 risk-reward trade using an Apple (AAPL) chart. This trade was based on a bullish flag pattern — a classic setup where price consolidates in a tight range before breaking out with strong momentum.
In this case:
- Entry was placed at $202.
- Stop loss was set just below the lower trendline of the flag at $199, to protect the trade in case of a failed breakout.
- Take profit was placed at $211, aiming for a clean 1:3 reward based on the size of the flag breakout.
How the Ratio Works Here
- Risk = $202 (entry) – $199 (stop) = $3
- Reward = $211 (target) – $202 (entry) = $9
- Risk-Reward Ratio = $9 ÷ $3 = 1:3
This is an ideal trade example where the setup was clear, the structure was tight, and the price moved in your favour with little resistance. The trade respected the breakout, and there was strong follow-through, hitting the take profit smoothly.
Why This Trade Worked Well
- Technical setup was solid (breakout from a flag pattern).
- Risk was minimal, as the stop was placed just below key support.
- Reward was maximised, with a clear and realistic price target.
- The market offered clean momentum, reducing noise or false signals.
This kind of example is great for visualising how traders apply the risk-reward ratio in real trades. It’s not just theory — it’s about planning a trade where the potential reward makes the risk worth taking.
Measuring Risk Reward Ratio Using Variance and SD in Historical Data
Another way traders and analysts measure risk and reward is by looking at historical data — specifically using variance and standard deviation (SD). This approach helps to understand how much a price typically moves over a certain period, and how consistent or volatile those moves are. It’s more common in quantitative trading, but understanding the basics can help any trader build smarter strategies.
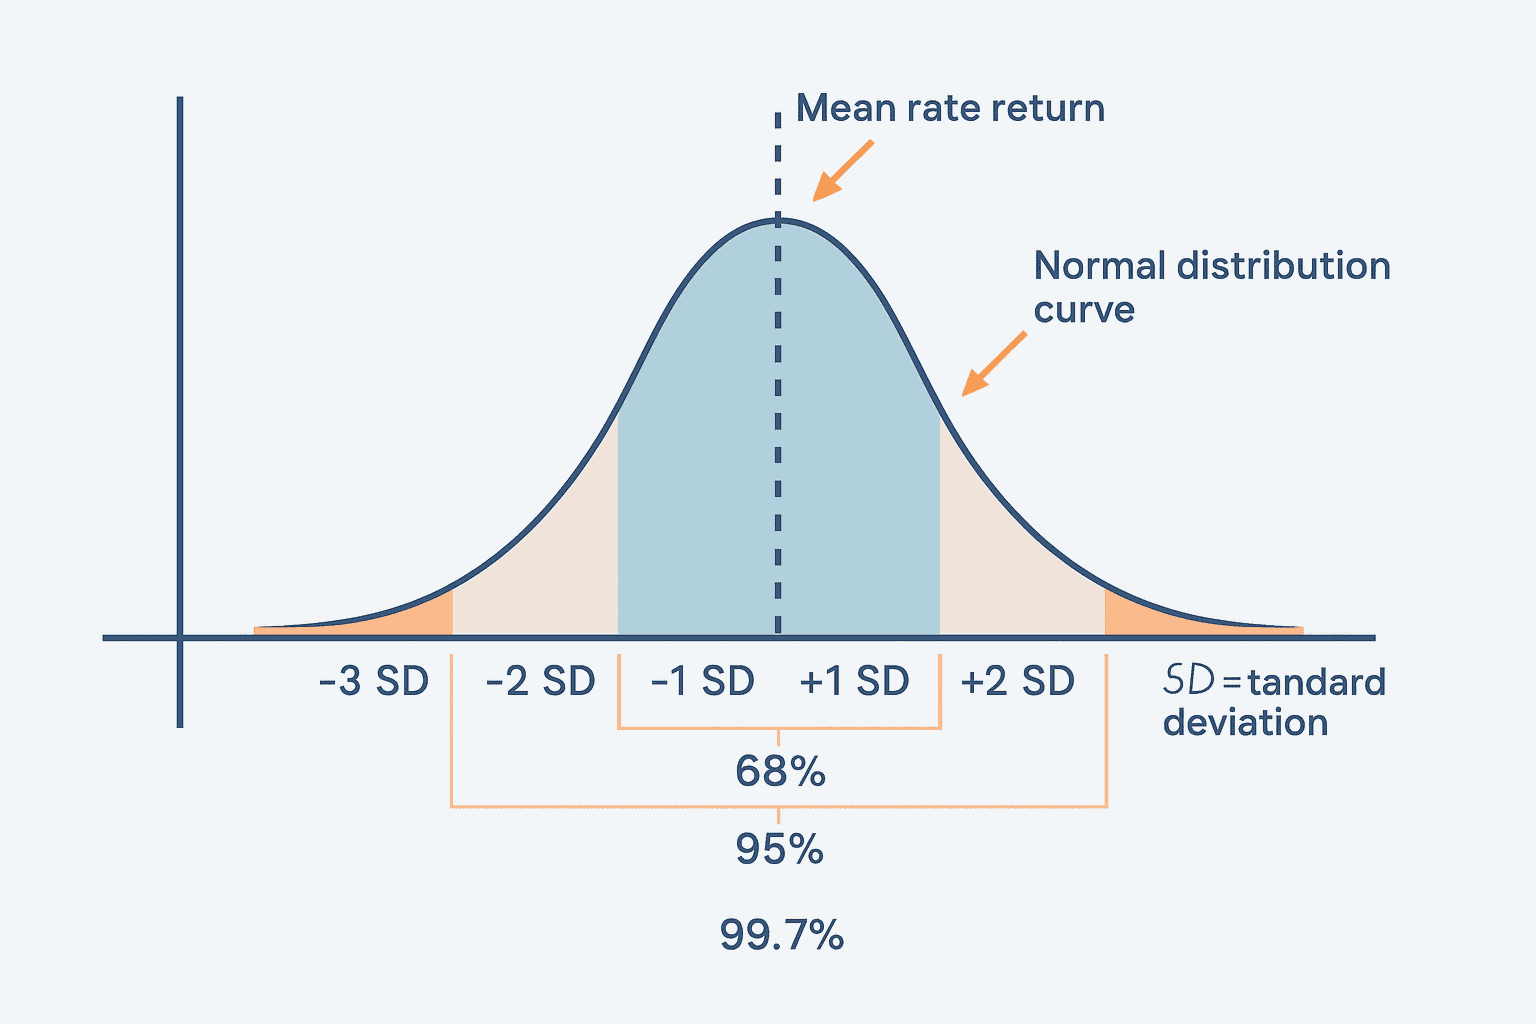
What Is Variance and Standard Deviation in Trading?
- Variance tells you how much an asset’s price fluctuates over time.
- Standard deviation is the square root of the variance — it gives a more readable figure showing how much the price typically deviates from the average.
The higher the standard deviation, the more volatile the asset is. This means there’s more risk — but also potentially more reward. Conversely, a low standard deviation suggests price moves are more stable, with less dramatic swings.
How It’s Used in Measuring Risk-Reward
Let’s say you’re backtesting a trading strategy on a stock. You notice that:
- The average return per trade over the last 50 trades is $2
- The standard deviation of those returns is $4
This tells you that while your average gain is $2, the outcomes are quite spread out — some trades may lose more or win more than expected. This affects your actual risk-reward outcome, as larger fluctuations could stop you out before you reach your profit target.
If your average reward is less than the standard deviation, your setup might be too risky, because volatility could wipe you out. But if your reward consistently exceeds 1 or 2 standard deviations, it means your strategy is performing well above the average noise level — a strong sign of an effective setup.
Real-World Application
Many institutional traders use statistical tools like variance and SD in combination with other indicators to measure risk. For example, some traders only take trades where the expected reward is 2x the SD, meaning the move must be significantly greater than typical price noise.
Using Bollinger Bands to Measure R:R through Standard Deviation
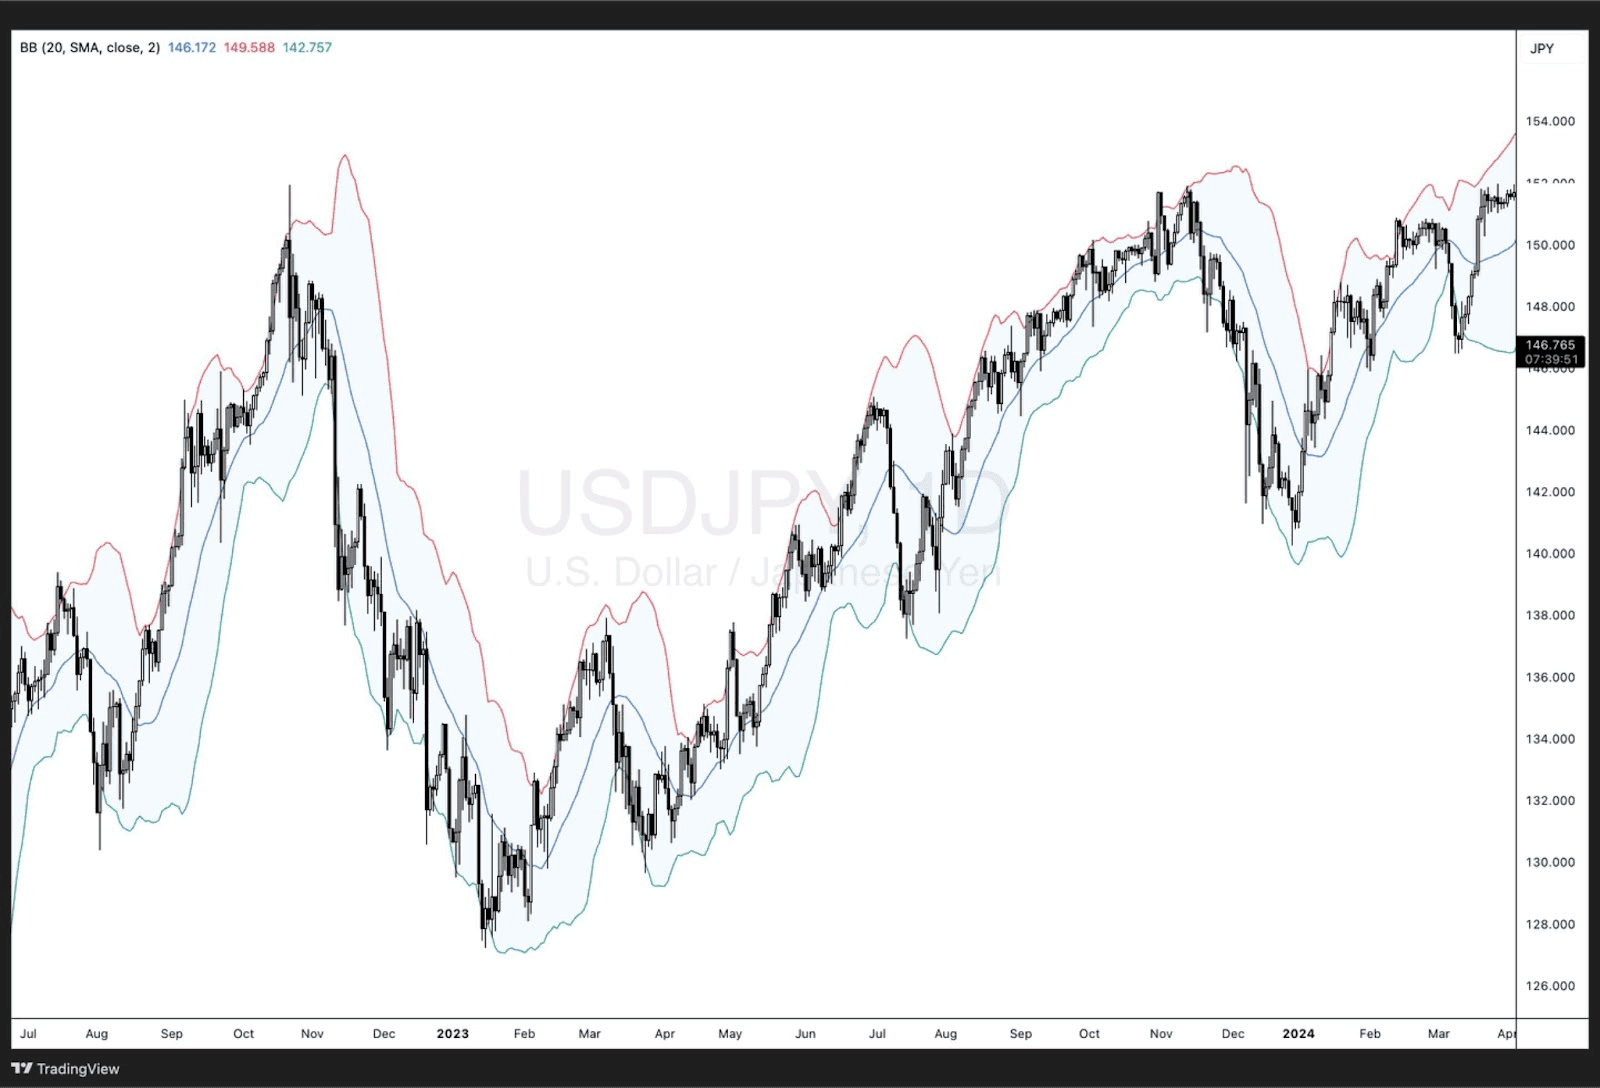
One of the most practical tools for visualising standard deviation in trading is the Bollinger Bands® indicator. It consists of three lines:
- A middle band (usually a 20-period simple moving average),
- An upper band (SMA + 2 standard deviations),
- A lower band (SMA – 2 standard deviations).
These bands expand and contract based on market volatility. When the price moves close to or outside the upper or lower band, it shows that the move is statistically significant — usually more than 2 standard deviations from the mean.
Traders can use this to:
- Gauge risk: If price is near the upper band, it might be due for a pullback, meaning higher risk for long trades.
- Spot reward zones: A breakout beyond the bands can signal strong momentum, where setting a wider take profit might make sense.
- Set stops and targets: Some traders place stops near the opposite band and targets near or beyond the breakout level.
Using Bollinger Bands as part of your risk-reward planning helps align your expectations with historical volatility — rather than guessing.
Measuring Risk Reward Ratio Using Value-at-Risk (VaR) models
Value at Risk (VaR) is a statistical tool traders use to figure out how much they could lose on a trade or portfolio, how likely that loss is, and over what time period the loss might happen — assuming market conditions stay relatively normal. It helps traders and risk managers get a clearer idea of the “worst-case scenario” within a given confidence level, like 95% or 99%.
For example, imagine a portfolio has a one-day 95% VaR of $100,000. This means there’s a 5% chance the portfolio could lose $100,000 or more in one day. Put another way, you can expect that kind of drop to happen roughly once every 20 trading days (since 5% of 20 is 1). So, while it’s unlikely, it’s still very possible — and VaR makes sure you’re aware of that risk.
This can also be written as a 5% one-day VaR of $100,000, or “one-day VaR = $100,000 at 5% confidence” — they all mean the same thing, just presented differently. Some traders and firms also express VaR as a percentage of the portfolio’s total value instead of a dollar amount. Either way, it’s a flexible and powerful method to assess risk, and it’s often used alongside risk-reward ratios to help decide whether a trade or strategy is actually worth it.
Measuring Risk Reward Ratio Using Beta
Beta is a measure that helps traders and investors understand how volatile a particular asset is compared to the overall market. A beta of 1 means the asset generally moves in line with the market. A beta above 1 means it’s more volatile — higher risk, but potentially higher reward. A beta below 1 suggests it’s more stable, with smaller price movements compared to the market.
In terms of risk-reward, traders often look at beta to estimate how much movement — or risk — they might be exposed to. For example, a stock with a beta of 1.5 could offer larger price swings and bigger profit opportunities, but it also carries greater downside risk. On the other hand, a beta of 0.7 might suggest lower reward potential, but it’s also less likely to suffer large losses. Beta doesn’t give you a risk-reward ratio directly, but it helps shape your expectations and strategy depending on your appetite for volatility.
Measuring Risk Reward Ratio Using Candlestick Patterns
Candlestick patterns are one of the most popular tools traders use to decide when to enter or exit a trade. These patterns give visual clues about market sentiment and possible reversals, making them helpful for planning trades with a clear entry point, stop loss, and take profit — all of which are essential to calculating the risk-reward ratio.
For example, if a trader spots a bullish candlestick pattern forming at a support level, they might decide to buy, placing a stop loss just below the pattern’s low and setting a target at the next resistance level. This setup gives them clear boundaries to calculate their risk and reward before entering the trade.
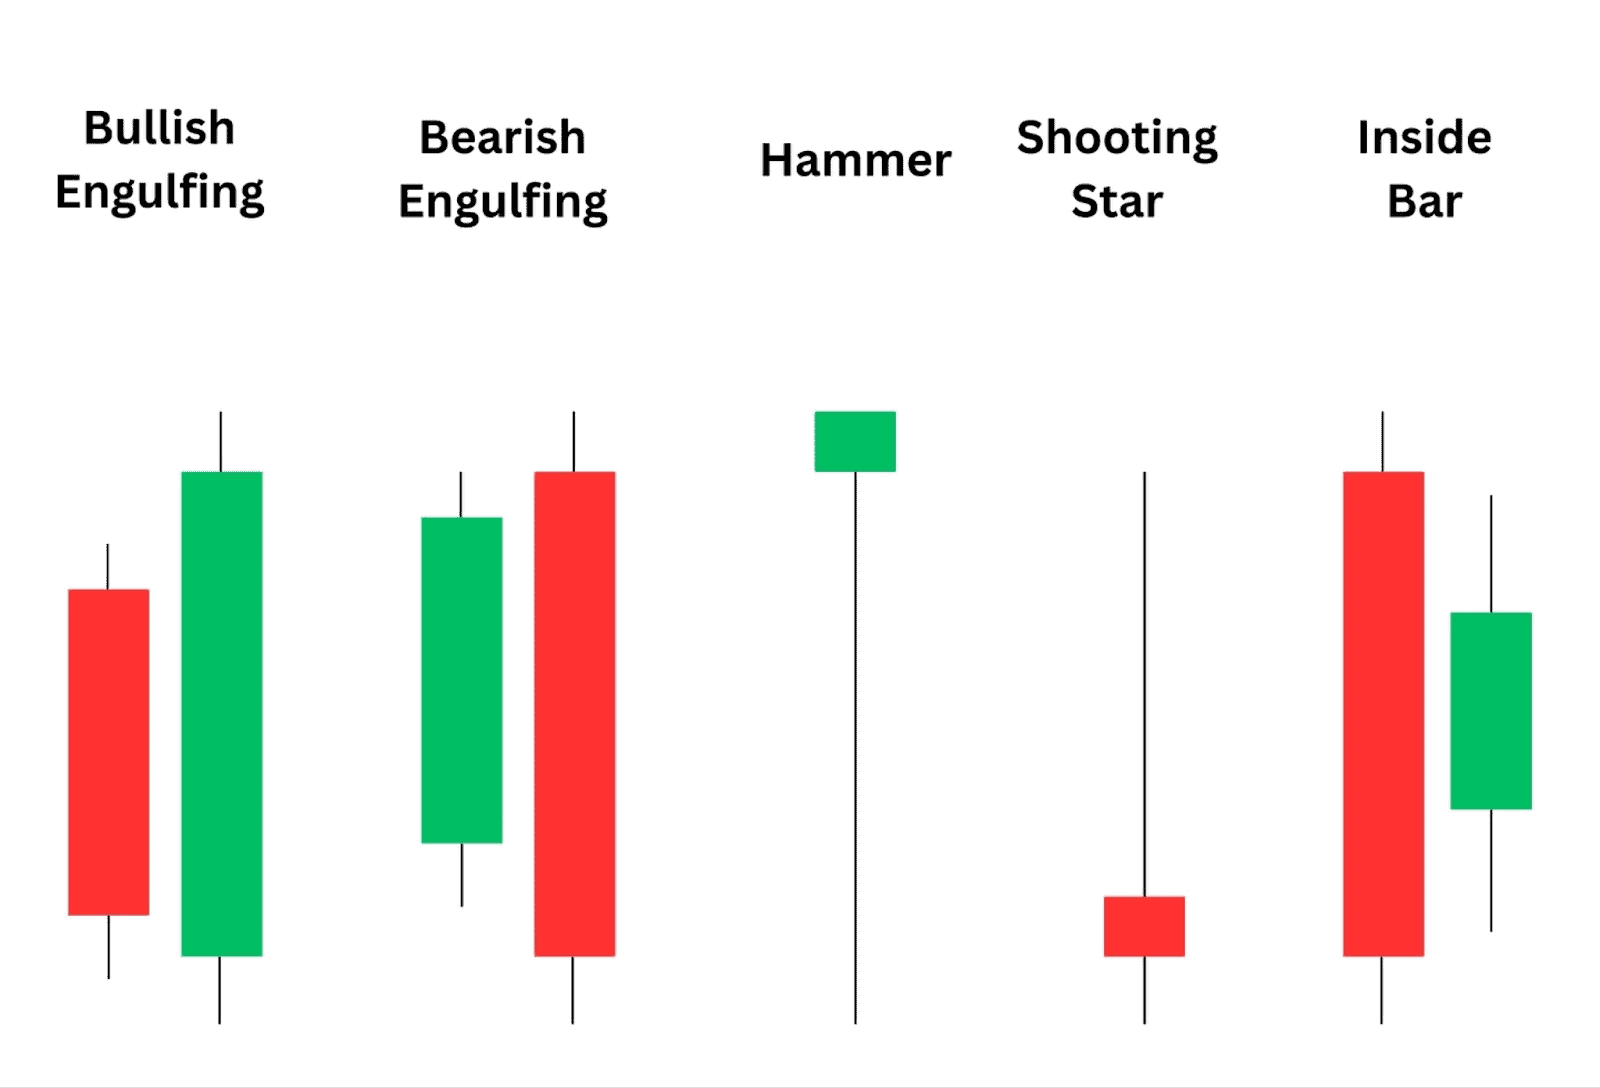
Popular Candlestick Patterns for Risk-Reward Setups:
- Bullish Engulfing
A larger green candle completely “engulfs” the previous red candle. This often signals a potential reversal to the upside. Traders might enter at the close of the bullish candle, placing a stop below the low and aiming for the next resistance area for a strong reward. - Bearish Engulfing
The opposite of the bullish engulfing — a strong red candle engulfs a smaller green one. It’s commonly used in downtrends or at the top of a range to signal a reversal. Risk is placed just above the high, with a target at the next support. - Hammer
A small-bodied candle with a long lower wick, usually found after a downtrend. It shows that buyers stepped in strongly. Traders often go long after a hammer, with a stop below the wick and a target based on previous swing highs. - Shooting Star
This is a bearish reversal pattern. It has a small body and a long upper wick, often appearing at the top of a trend. It suggests selling pressure is building, giving traders a tight stop just above the wick and potential for a good downside reward. - Inside Bar
A candle that forms entirely within the range of the previous candle. It represents a pause or indecision and is often followed by a breakout. Traders wait for a breakout in either direction, setting tight stops around the inside bar and aiming for a measured move based on previous volatility.
Candlestick patterns are especially useful for managing risk visually, as they allow for tighter stops and more accurate entries, which helps in finding trades with higher reward relative to the risk.
Measuring Risk Reward Ratio using Trading Indicators
Trading indicators help traders analyse price movement and market behaviour. While they don’t give a risk-reward ratio directly, they are incredibly useful for identifying entry points, stop loss zones, and target levels — all of which are needed to calculate a solid risk-reward setup. When used correctly, indicators can help traders find trades with better precision and higher reward potential.
Here are four of the most relevant indicators used by traders to measure or guide risk-reward decisions:
1. Fibonacci Retracement
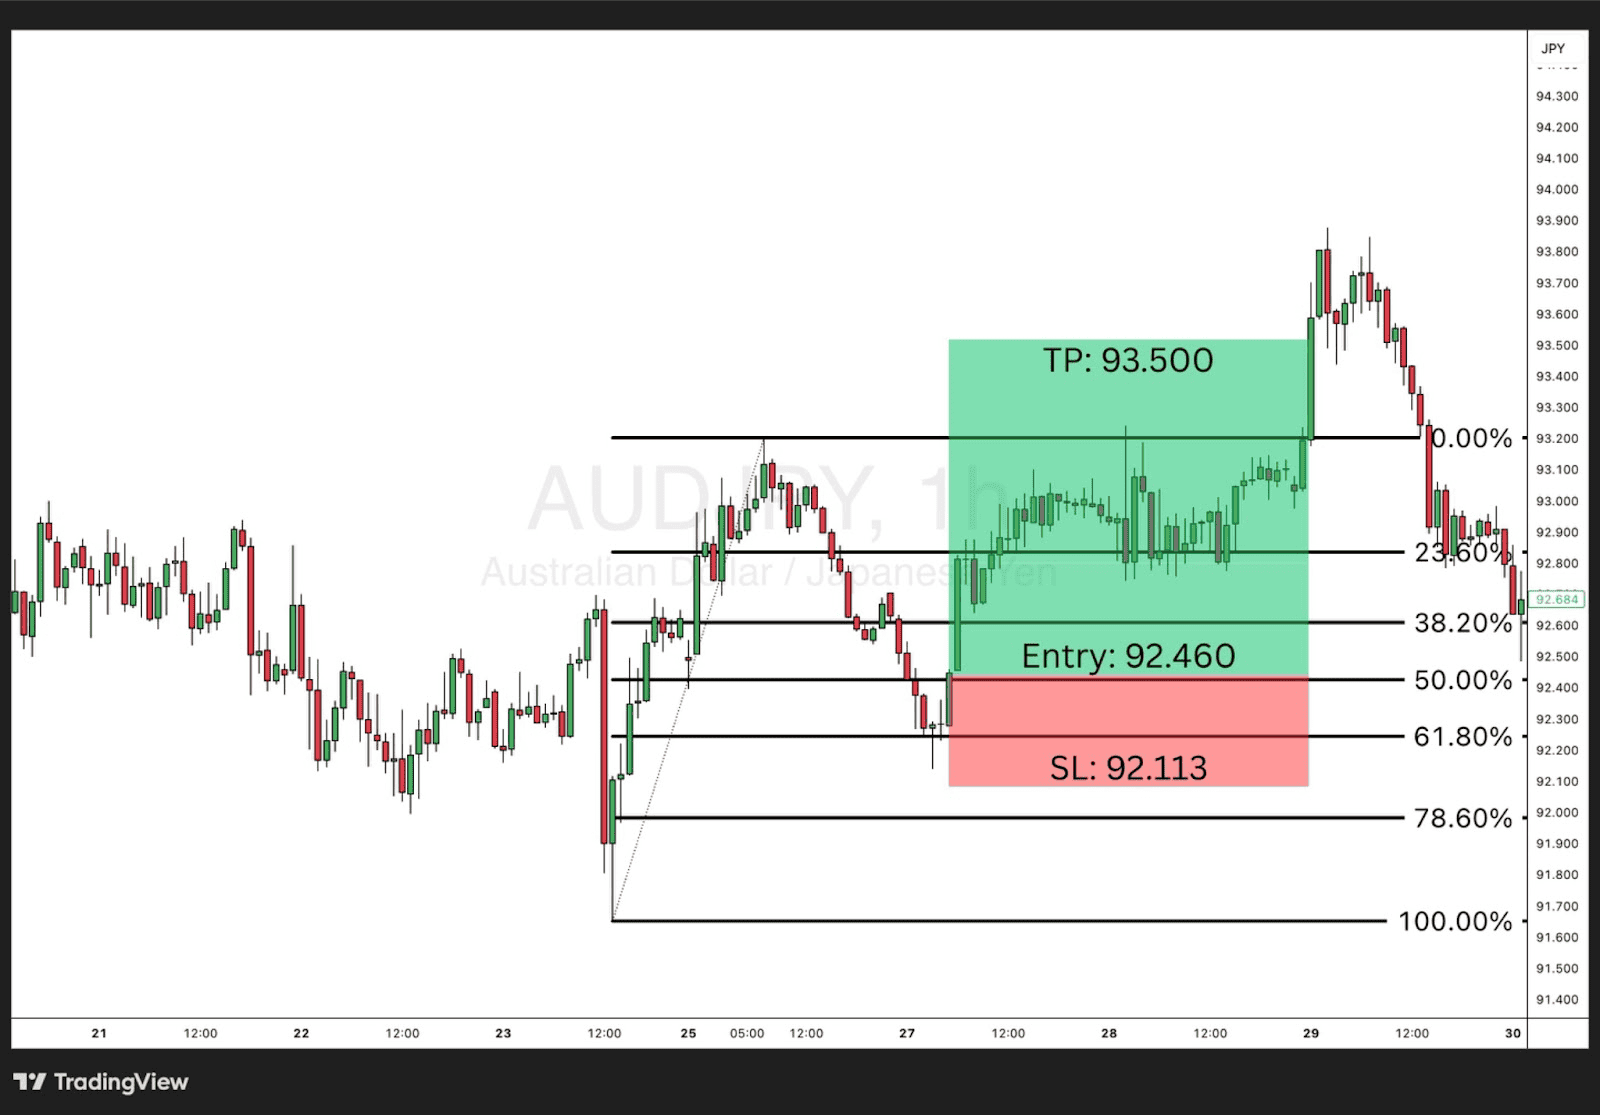
Fibonacci retracement is a popular tool based on levels derived from the Fibonacci sequence. Traders use it to spot potential pullback zones or reversal points during trending markets.
In this AUDJPY example, price pulls back from a swing high and retraces down to the 50% level, where the trader enters at 92.460. The stop loss is placed slightly below the 61.8% retracement at 92.113, and the take profit is set at 93.500, near the previous swing high — resulting in a clean 1:3 risk-reward ratio.
This method helps define clear entry, stop loss, and target levels in advance, making it easier to assess if the trade is worth taking from a risk-reward perspective.
2. Average True Range (ATR)
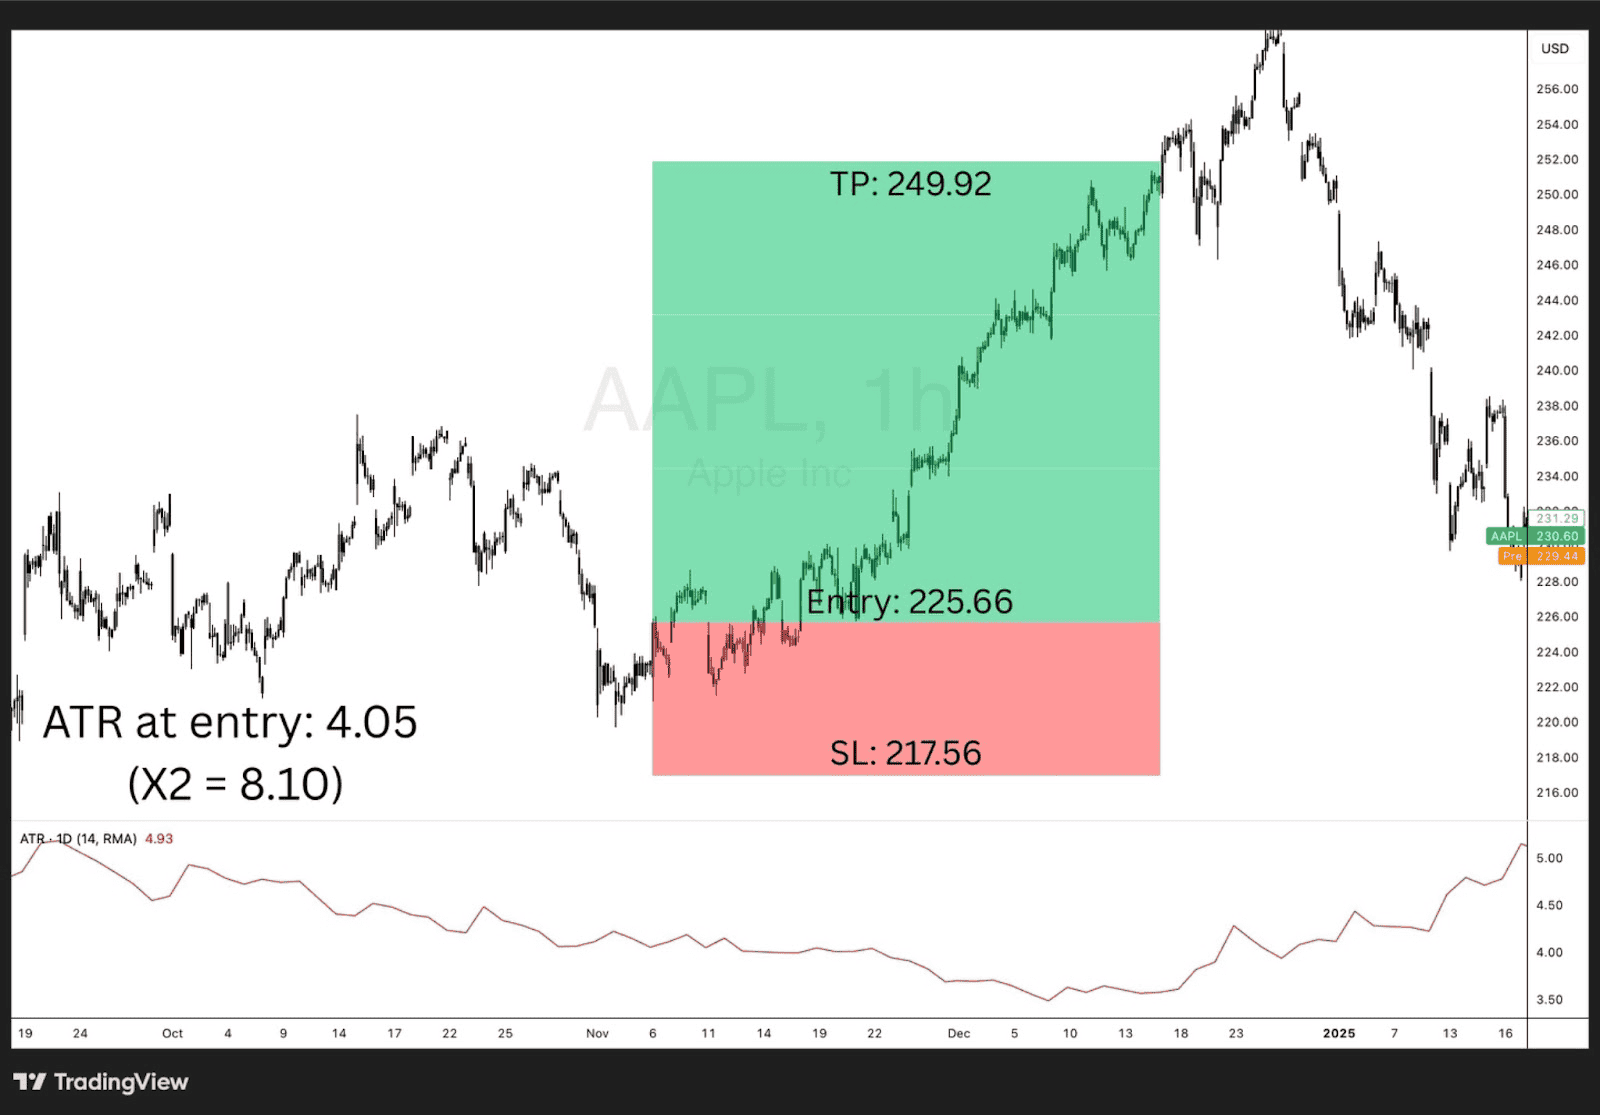
ATR is a popular indicator used to measure market volatility — essentially how much an asset typically moves over a set period. This helps traders create more realistic stop loss and take profit levels, especially in fast-moving markets.
In the example shown with Apple (AAPL), the ATR at the time of entry was 4.05. To account for typical price movement, the trader multiplies this by 2, resulting in a stop loss distance of 8.10 points. The entry was made at $225.66, and the stop was placed at $217.56 (225.66 – 8.10). With a 1:3 risk-reward ratio, the take profit was set at $249.92 — giving a well-structured and volatility-adjusted trade setup.
Using ATR like this allows traders to avoid placing stops too close and gives trades room to breathe, especially during normal price fluctuations.
3. Moving Averages (MA)
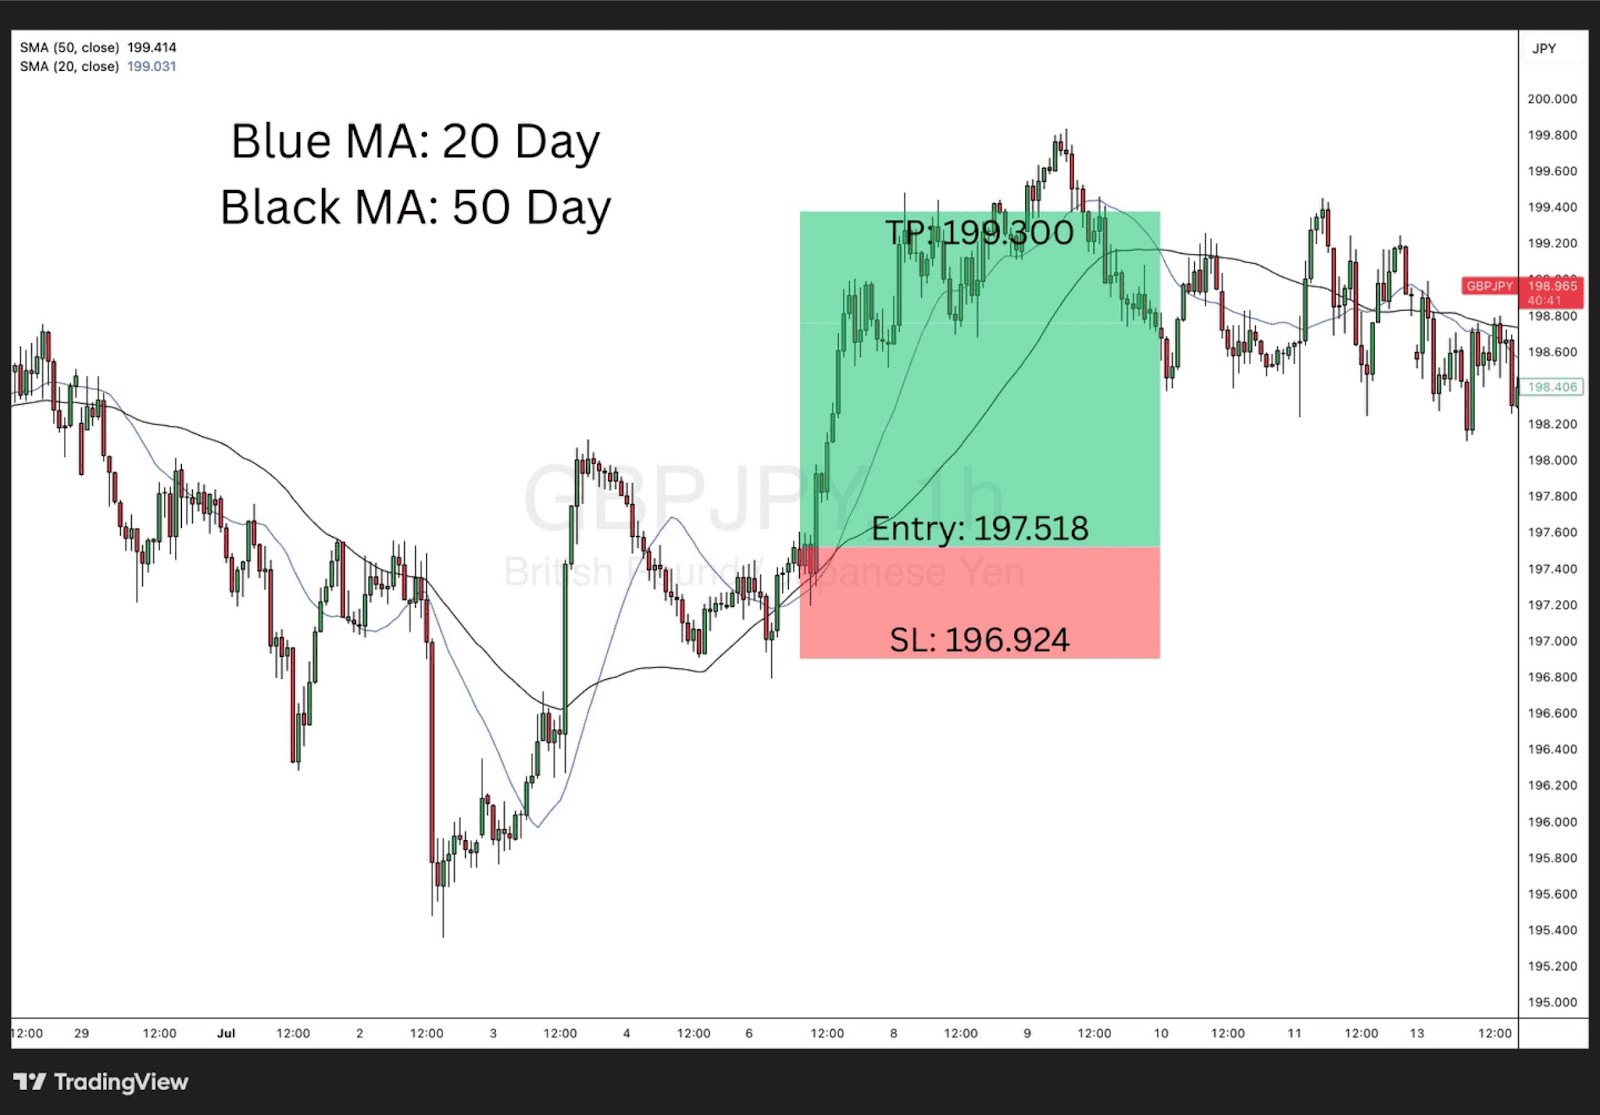
Moving averages help traders spot the underlying trend and potential entry or exit points. In particular, short-term MAs like the 20-day (blue line) and longer-term MAs like the 50-day (black line) are widely used.
In this GBPJPY setup, price breaks above both MAs, signalling bullish momentum. The trade is entered at 197.518, with a stop loss just below the recent structure at 196.924, and a take profit set at 199.300 — giving a clean and controlled risk-reward ratio.
By using moving averages to define trend direction and support zones, traders can place trades with more confidence and structure, leading to more consistent risk-reward planning.
Advantages of Using Risk Reward Ratio
The risk-reward ratio is one of the most important tools in a trader’s toolbox. It helps define whether a trade is worth taking before any money is put at risk. Here are some of the key benefits:
1. Provides Clear Trade Planning
Using a risk-reward ratio forces traders to think in advance about their entry, stop loss, and take profit. This means trades are not based on emotion or guesswork but instead follow a clear plan — improving overall discipline.
2. Helps Filter Out Poor Setups
By calculating the ratio before entering a trade, traders can quickly reject setups where the potential reward doesn’t justify the risk. This is especially helpful in volatile markets where it’s easy to make emotional decisions.
3. Supports Consistent Trade Expectations
Over time, maintaining a consistent risk-reward ratio (like 1:2 or 1:3) can lead to positive returns, even with a relatively low win rate. This makes it easier to stay profitable without needing to win every trade.
4. Encourages Risk Management
The ratio naturally keeps risk in check by making it a core part of every trade decision. Traders become more aware of how much they’re risking and more selective with the trades they take.
5. Works Across All Markets
Risk-reward principles can be applied in any market — stocks, forex or commodities — making it a universal concept that scales with different strategies.
Disadvantages of Using Risk Reward Ratio
While the risk-reward ratio is a helpful tool, it’s not perfect. Like any method, it has limitations and can be misleading if used without proper context.
1. Doesn’t Reflect Win Rate
One major downside is that the ratio doesn’t account for how often trades actually win. A 1:3 ratio sounds great, but if your win rate is only 20%, you might still lose money. Traders must balance both risk-reward and win rate together.
2. Not Always Realistic
In fast-moving or illiquid markets, it’s not always easy to hit your take profit level. Market noise or slippage can knock you out of the trade before your target is reached, even if the setup was sound.
3. Can Be Misleading in Backtesting
Sometimes, historical data looks great on paper, but in real-time trading, the actual price movements don’t follow the same pattern. Relying solely on fixed risk-reward setups can give false confidence without factoring in changing market behaviour.
4. Traders May Force Trades
Some traders get caught in the trap of only taking trades that “look good” based on ratio alone, even if the setup doesn’t make technical or fundamental sense. This can lead to overtrading or ignoring other key factors.
Considerations for Trading with Risk Reward in Mind
Knowing your risk-reward ratio is important, but applying it correctly requires looking at the bigger picture. It’s not just about the numbers — it’s about how those numbers fit into your strategy, trading style, and market conditions. Here are a few things to think about.
Leverage and Risk-Reward in CFDs and Options
When trading leveraged instruments like CFDs and options, the risk-reward ratio takes on even more importance. These products allow you to trade larger positions with a smaller amount of capital, which can amplify both profits and losses.
A setup with a tight stop loss and large target might look good on the surface, but leverage can make the trade far riskier than it appears. Even small moves against your position can lead to significant losses. So while a 1:3 ratio might be your goal, you still need to think about how much you’re really exposing your account to.
Adjusting for Volatility and Market Conditions
Markets don’t move the same way every day. That means your risk-reward setups shouldn’t be static either. In high-volatility environments, prices can swing more wildly, so you might need to place your stop loss wider to avoid getting knocked out too early.
On the flip side, in a slow market, using a wide stop may not make sense. This is where understanding current market volatility helps you place more realistic stops and targets, leading to a better overall risk-reward balance.
Position Sizing and Capital Allocation
Even with a solid risk-reward ratio, how much you risk per trade can make or break your results. Many traders stick to risking a small percentage of their capital — often around 1% to 2% per trade.
This keeps losses manageable and allows the risk-reward ratio to do its job over the long run. If you’re risking too much, even a great 1:3 setup can result in large drawdowns. Consistency in position sizing matters just as much as the setup itself.
Avoiding Over-Optimisation
Not every trade needs to be 1:3 or higher. Sometimes, a high-probability 1:1 trade makes more sense than chasing a risky 1:5 idea that rarely plays out. The key is to focus on the quality of the setup, not just the numbers.
Chasing idealised ratios can cause traders to force trades or hold positions longer than they should. A good trade isn’t only about the ratio — it’s about timing, structure, and market behaviour.
Win Rate vs Risk-Reward Ratio
Your win rate plays a big role in how effective your risk-reward ratio really is. If your ratio is low, like 1:1, then you’ll need a higher win rate — above 50% — to stay profitable. But if your ratio is higher, like 1:3, you can still be profitable with a win rate as low as 30-40%.
The two need to be in balance. There’s no magic number — what matters is that your risk-reward ratio and win rate work together to keep your edge in the market. Find the combination that suits your strategy and stick with it.
FAQ
Can the Risk/Return Ratio of an Investment Change Over Time?
Yes, as market conditions shift and price levels move, the risk-reward profile of a trade can change before or even during the trade.
What are some things that the risk-reward ratio doesn’t take into account?
It doesn’t factor in win rate, trade probability, slippage, or emotional discipline — just the ratio between potential loss and gain.
What is the best risk reward ratio in day trading?
Many day traders aim for a minimum of 1:2, balancing fast execution with realistic targets and manageable stops.
What is the best risk reward ratio in crypto
In crypto’s high-volatility environment, traders often aim for 1:3 or higher to justify the added risk.
What is the best risk reward ratio in forex
Forex traders typically target 1:2 or 1:3 depending on the pair and session volatility, allowing enough room to account for price swings.


