- November 29, 2024
- 84 min read
Elliott Wave Theory – How to Use It In Trading
What is the Elliott Wave Theory?
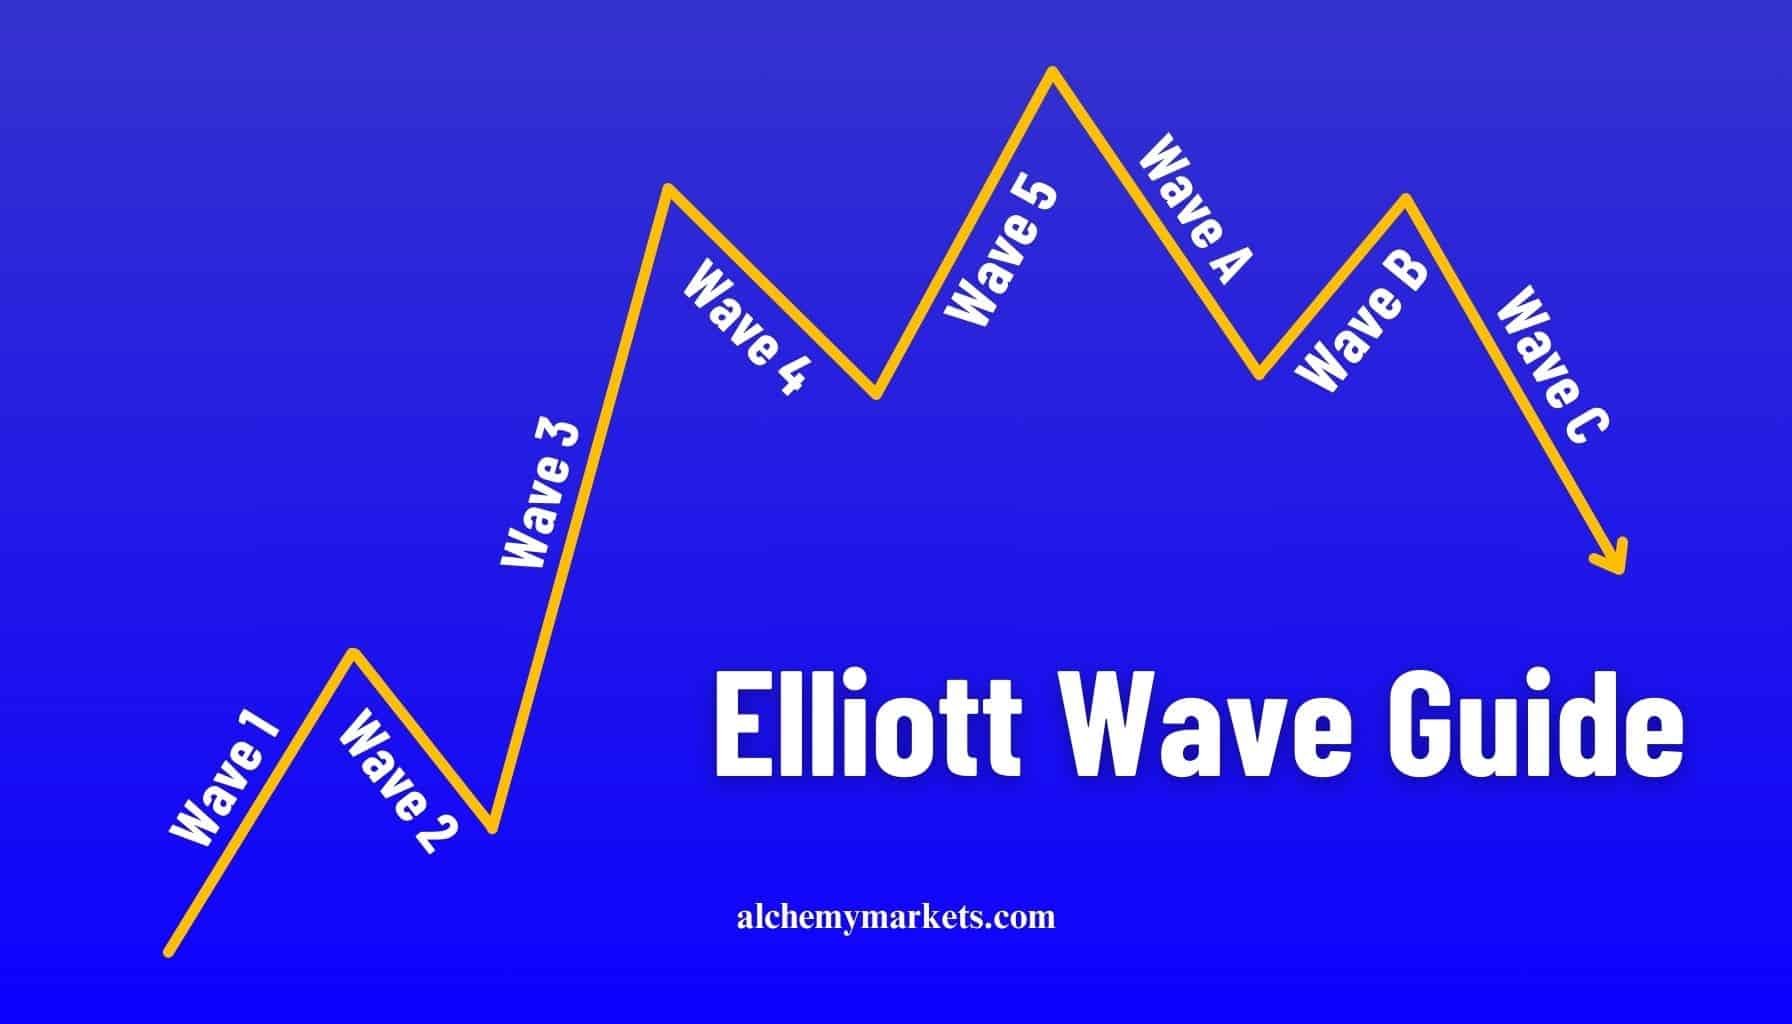
The Elliott Wave Theory is a form of technical analysis used to predict financial market trends by identifying recurring patterns in price movements. Developed by Ralph Nelson Elliott in the 1930s, the theory is based on the belief that financial markets move in repetitive cycles, which are influenced by the psychology and sentiment of investors. These patterns, known as “waves,” reflect shifts in collective behaviour, oscillating between optimism and pessimism in a sequence of peaks and troughs.
At its core, the Elliott Wave Theory suggests that market movements are not random but follow a recognisable rhythm or flow. This ebb and flow is divided into impulse waves, which move in the direction of the overall trend, and corrective waves, which move against it. By identifying these wave patterns, analysts attempt to forecast future price movements and take advantage of trading opportunities.
The theory is widely known for its application in various markets, such as stocks, commodities, and forex, offering traders a structured way to interpret market behaviour, predict future price direction, and identify trading opportunities. While it doesn’t guarantee precise predictions, the Elliott Wave Theory is celebrated for providing a robust framework to understand market cycles and investor sentiment.
How Does Elliott Waves Theory Work
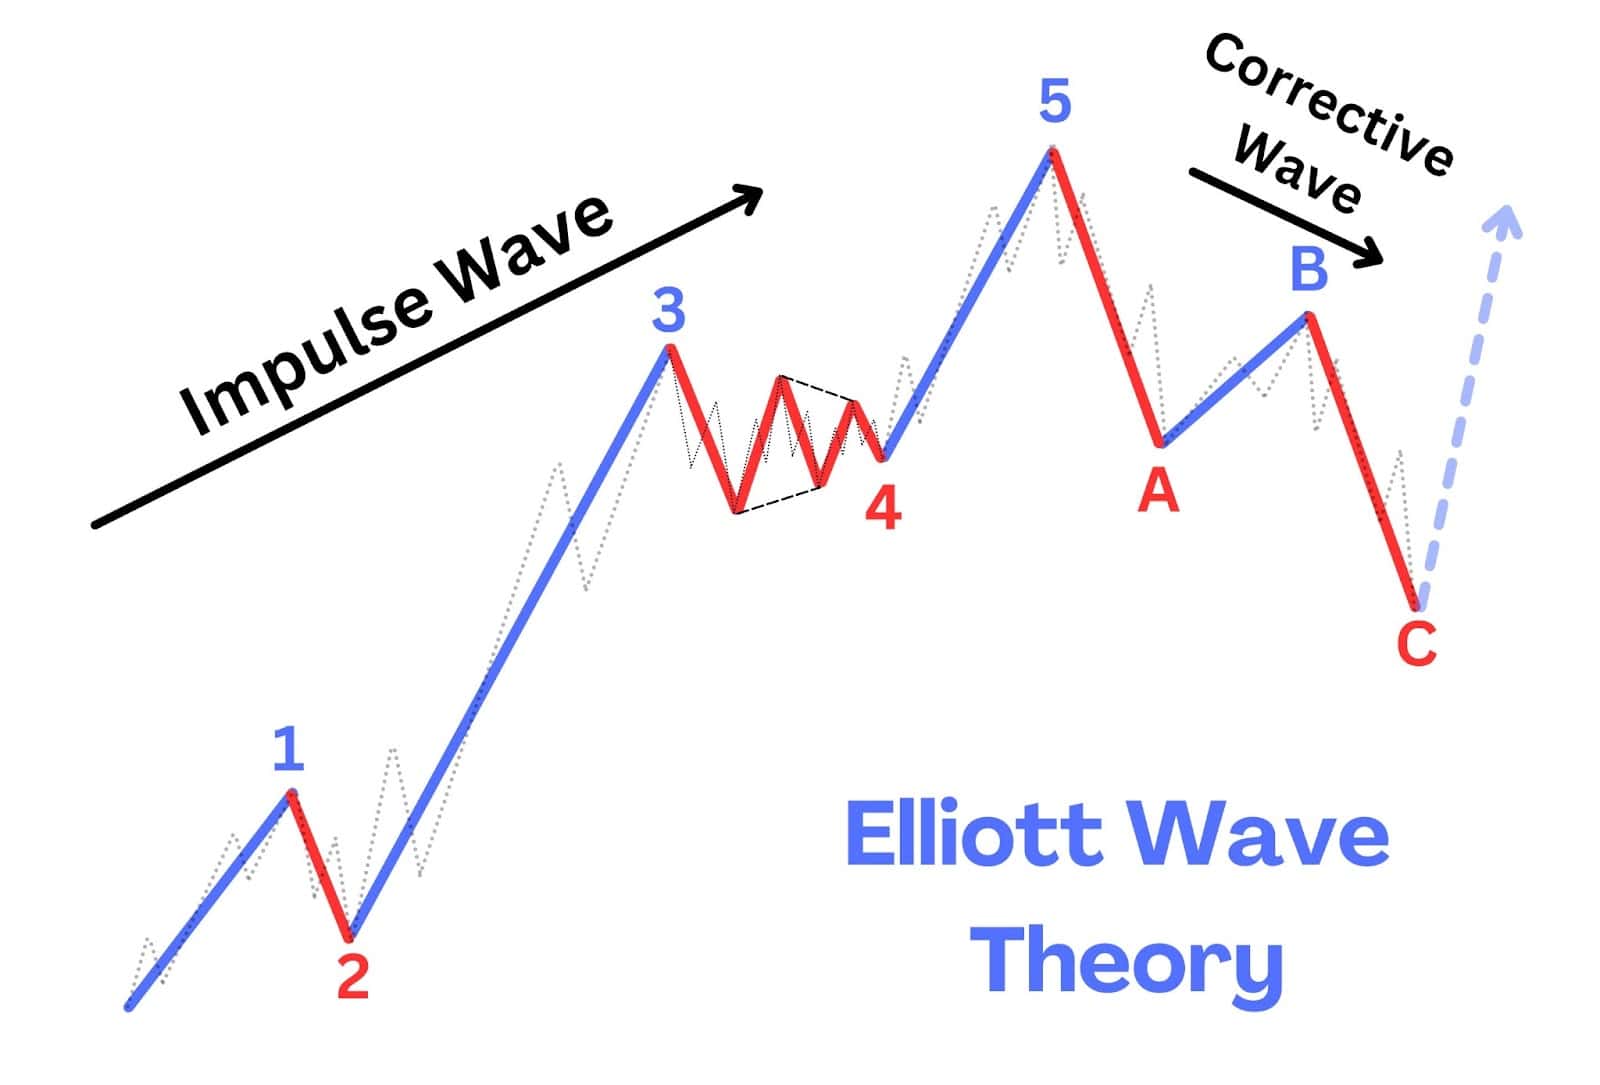
The Elliott Wave Theory operates by analysing market price movements in a series of waves that reflect the underlying psychology of traders and investors. These waves follow a repetitive, cyclical pattern of advances and corrections, which, when identified correctly, can help traders anticipate future market trends and spot trading opportunities. The theory is grounded in the belief that markets are driven by collective investor sentiment, which oscillates between optimism and pessimism in predictable phases.
Market Psychology and Wave Cycles
The driving force behind these wave patterns is market psychology as a result of investor sentiment. Elliott observed that investor sentiment such as fear and greed fuel buying and selling activity, which leads to waves of price movements. As market participants collectively swing from optimism to pessimism and back again, these sentimental shifts manifest in price patterns that form the waves.
In a rising market (bullish trend), increasing optimism and bullish sentiment drive prices upward, creating the five-wave impulse pattern. As the market becomes overbought or as external factors shift, profit-taking or anxiety may cause a retracement in the form of corrective waves. Conversely, in a falling market (bearish trend), pessimism dominates, leading to a downward impulse, followed by temporary recoveries during corrective phases.
The Fractal Nature of Elliott Waves
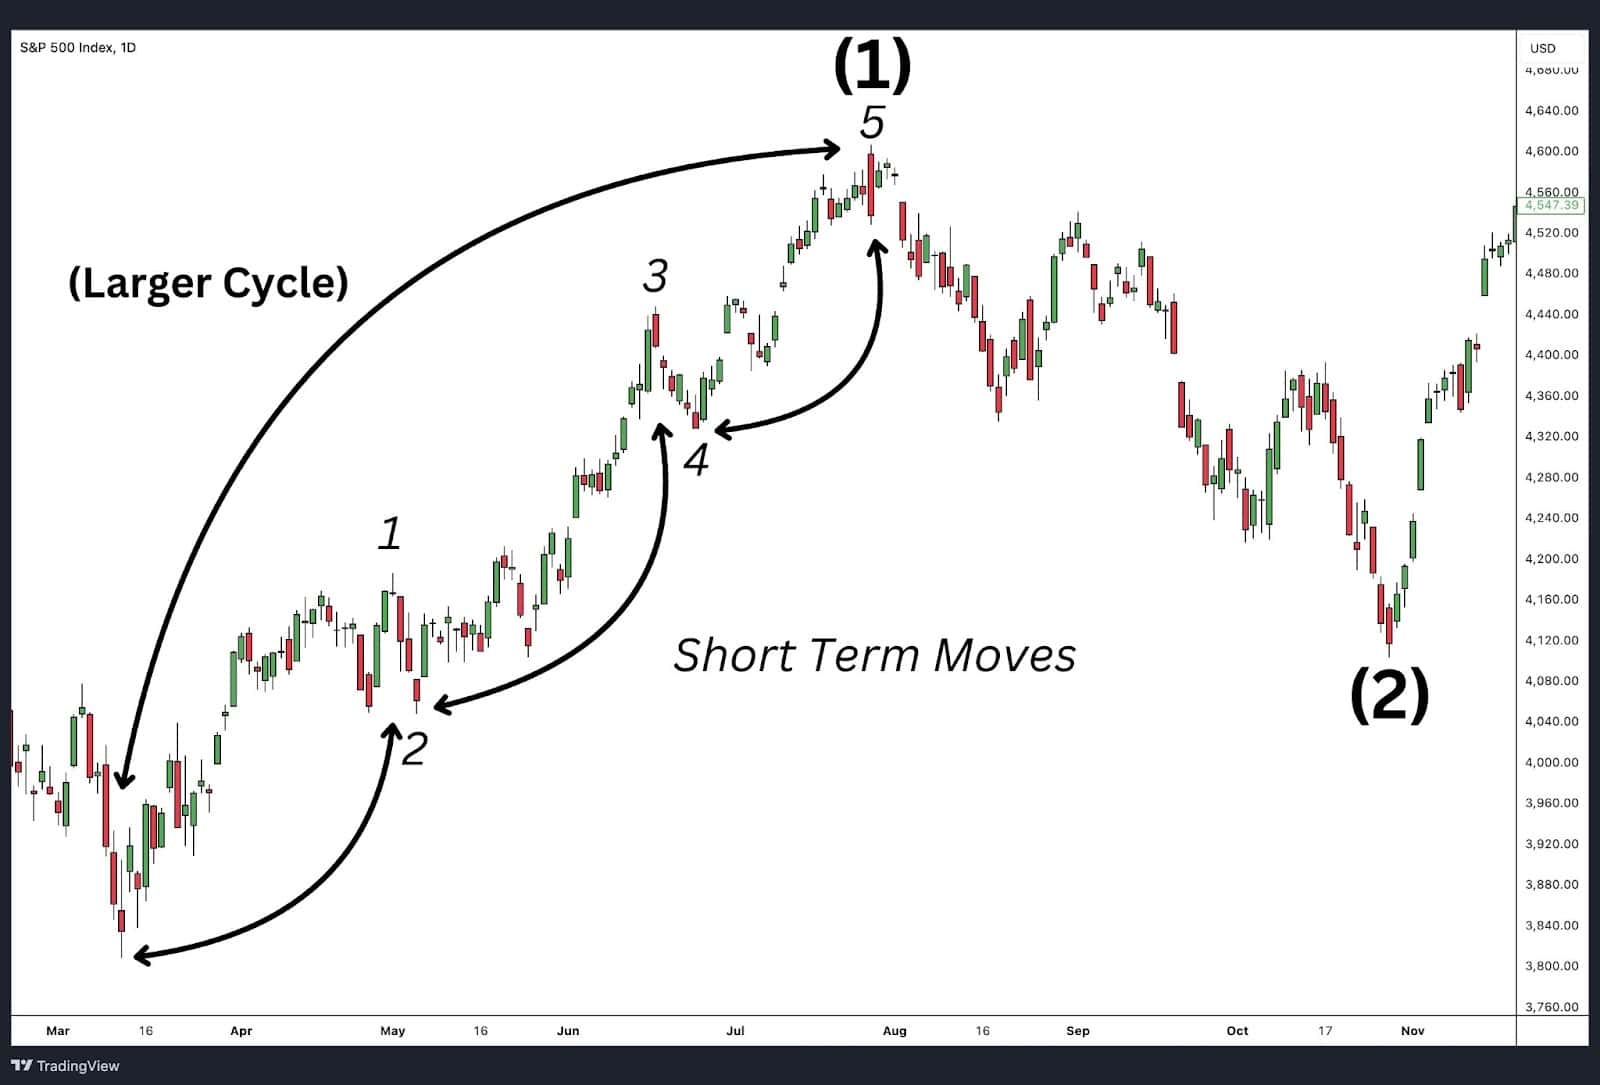
One of the most unique aspects of Elliott Wave Theory is its fractal nature. This means that the patterns found on a larger scale can also be observed on smaller time frames. Each wave within the larger cycle can be broken down into smaller waves that follow the same impulse and corrective structure. This fractal property allows traders to apply the Elliott Wave Theory across different time frames, from minute-by-minute charts to long-term monthly trends.
For example, within a single wave of a larger cycle, there could be smaller five-wave impulse and three-wave corrective patterns. This multi-level patterning helps traders look at short-term moves within the context of the larger trend. We will cover these Elliott specific patterns further down.
Flexibility and Subjectivity
One of the strengths of the Elliott Wave Theory is its flexibility. It can be applied to any market (stocks, commodities, forex, etc.) and across any time frame. However, this flexibility also introduces a level of subjectivity. Wave patterns are not always clear-cut, and misidentifying a wave can lead to incorrect predictions. Therefore, study this guide carefully to improve your Elliott wave skill. Experienced traders, therefore, need to refine their skills in recognising wave patterns and stay adaptable to market changes.
How Can I Apply the Elliott Wave Theory
The Elliott Wave Theory offers a practical framework for understanding and predicting future price movements by analysing price patterns. By identifying these patterns, traders can better gauge the market’s current trend, anticipate potential reversals, and make informed decisions on when to enter or exit trades. Let’s explore how the Elliott Wave Theory can be applied in practice.
Identifying the Market’s Trend
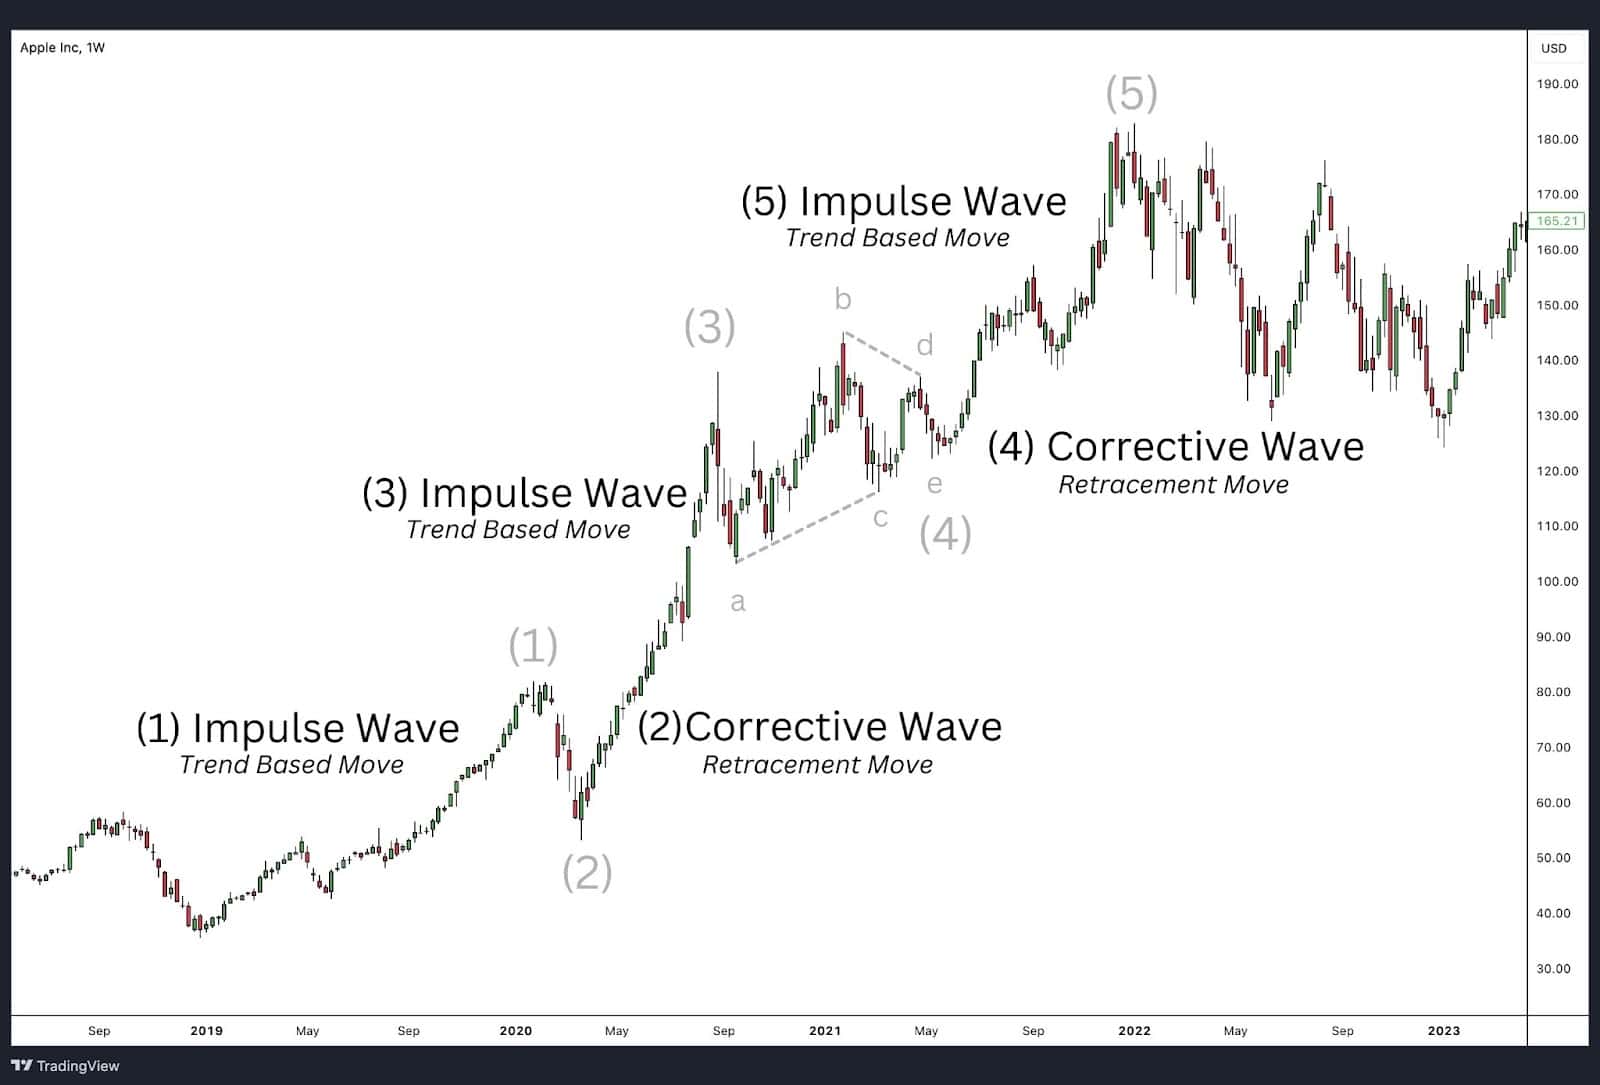
One of the primary uses of the Elliott Wave Theory is to determine whether the market is in a trend or a correction. For example, when you observe a five-wave impulse wave pattern, it signals that the market is currently trending in a particular direction. Whether it’s an uptrend or downtrend, the presence of five distinct waves (three advancing and two correcting) confirms that the trend is in play.
Once the five-wave impulse completes, you can expect the market to enter a corrective phase, often in the form of an A-B-C pattern. Recognising this transition helps traders avoid buying into the end of a trend and getting caught in the subsequent correction.
For instance, if you see that wave 5 has just completed, this indicates that the price is likely extended in the current degree of the trend, and a corrective wave is due. At this point, traders may either exit long positions or prepare for the correction before considering re-entry. This application is invaluable for timing market entries and exits based on the stage of the trend.
Anticipating the Next Move
The Elliott Wave Theory is also a powerful tool for predicting the next potential move in the market. For example, if you observe waves 1 and 2 have already formed, you can expect that the next major move will be wave 3, which is typically the strongest and longest wave in the sequence. This gives you an edge in anticipating significant price movements.
Alternatively, even if the market doesn’t follow the expected pattern and begins to correct, what was initially anticipated as wave 1 and 2 could turn out to be wave A and B of a larger corrective structure. In this case, what seemed to be wave 3 may not reach its target, but instead could be wave C of the correction. This insight helps traders stay on top of sudden changes in the market’s trend, allowing them to adjust their strategy accordingly and avoid being caught off guard by unexpected shifts in price direction. The difference between impulse and corrective waves can be identified by examining their characteristics and applying Fibonacci Extension guidelines, which will be discussed further in the article.
This ability to anticipate future price action gives traders greater confidence in their decisions and helps them better manage risk.
Using Corrective Patterns to Gauge Market Continuation
Corrective waves, while more complex and varied than impulse waves, also provide critical insights into market behaviour. Patterns such as zigzags, flats, and triangles occur during market corrections, and recognising these patterns helps traders predict when the larger trend will likely resume.
For example, during a correction, if you identify a zigzag pattern, it can signal that the market is temporarily pulling back but may soon resume its previous trend. By applying Fibonacci retracement levels, which are commonly used in Elliott Wave analysis, you can further refine your understanding of where the correction might end and the trend could continue. For instance, corrective waves often retrace 38.2% or 61.8% of the previous impulse wave, giving you a clearer picture of potential support or resistance levels.
Spot Tradeable Opportunities
In Elliott Wave Theory, the most tradeable opportunities typically occur during Wave 3, Wave 5, and Wave C, as these waves often provide the clearest and most powerful price movements.
- Wave 3 is usually the strongest and steepest wave in an impulse wave pattern, driven by broad market participation and momentum. Traders often look to enter at the start of Wave 3, following the completion of Wave 2, as this wave provides the highest potential for profit with minimal resistance.
- Wave 5, while often less powerful than Wave 3, represents the final push in impulsive waves. It offers trading opportunities for Elliott wave traders to ride the trend’s final leg before a reversal or correction.
- Wave C in corrective patterns like zigzags or flats is another prime opportunity. It frequently mirrors Wave A in size and momentum, providing a clear target. Wave C often concludes the corrective structure, making it ideal for anticipating a trend resumption.
By focusing on these specific waves and combining them with guidelines like Fibonacci projections and confirmations from other indicators, Elliott Wave traders can identify high-probability trade setups – these will be discussed further below.
Motive Waves vs Corrective Waves
At the core of the Elliott Wave Theory are two types of waves: motive waves and corrective waves. Together, these waves form the building blocks of market trends. Each serves a distinct role in the overall structure of price movements, contributing to the flow of trends and pauses in the market.
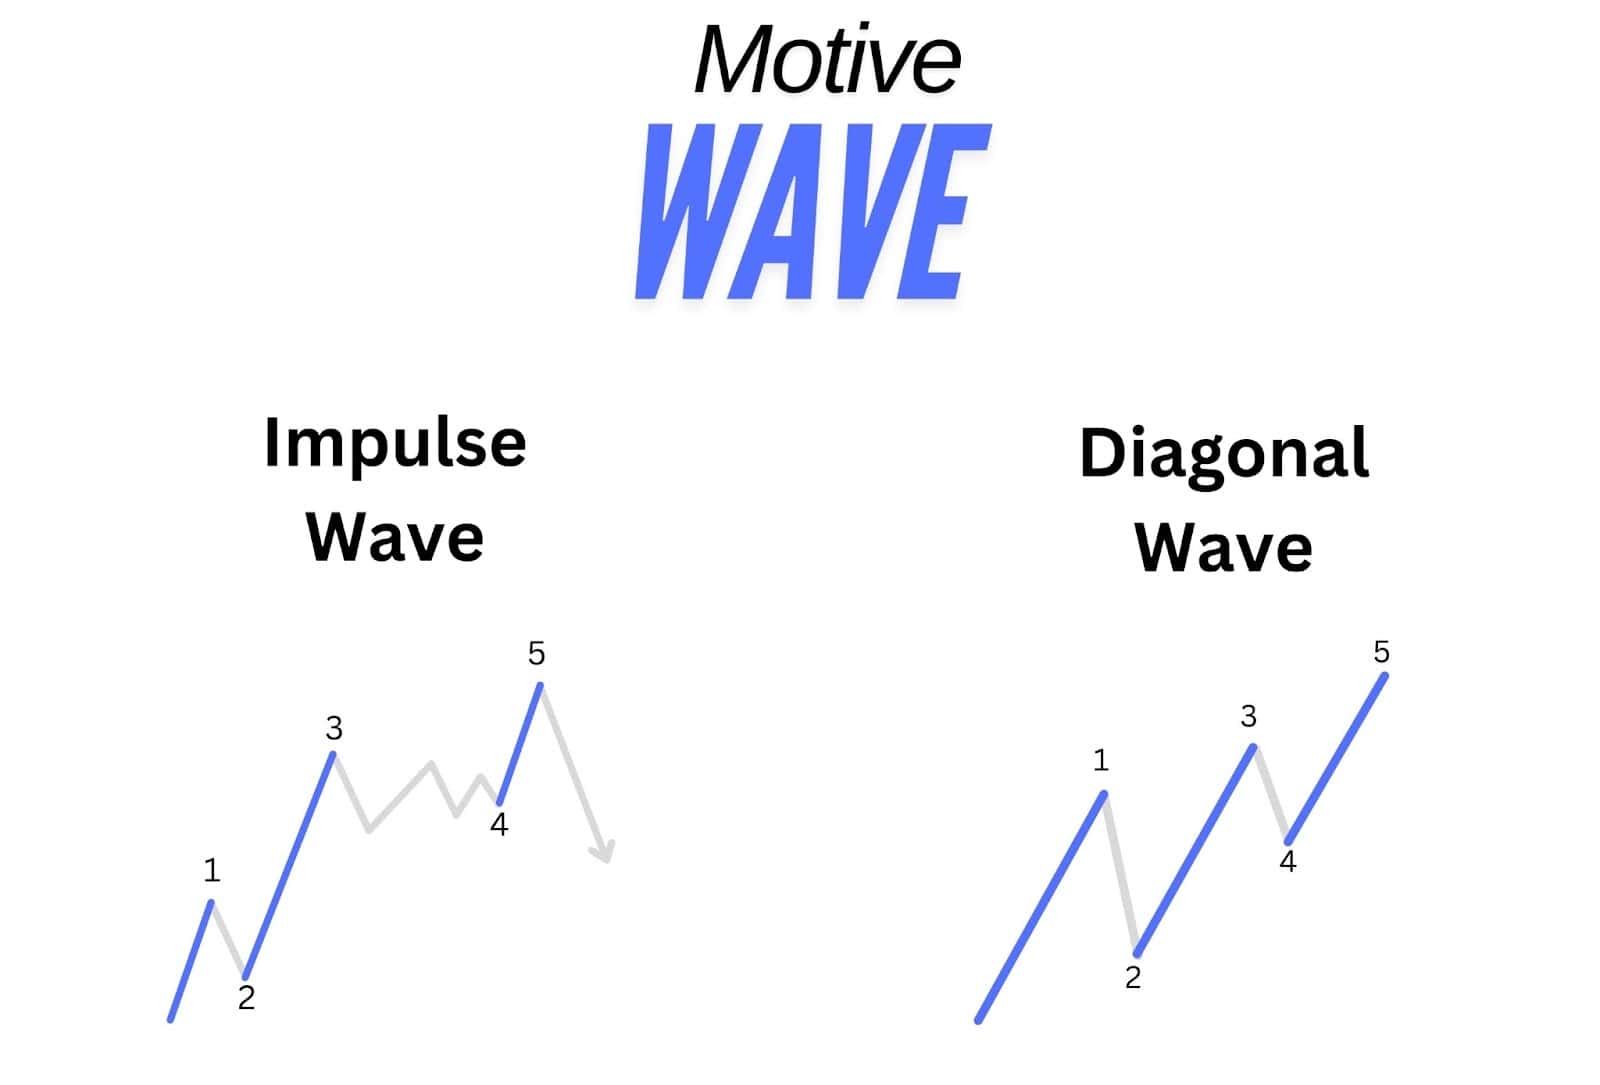
Motive waves are composed of five sub-waves and move in the direction of the larger trend. They represent the driving force behind market momentum, pushing prices higher in an uptrend or lower in a downtrend. These waves showcase the strength and direction of the current trend, capturing the periods when market sentiment is most aligned.
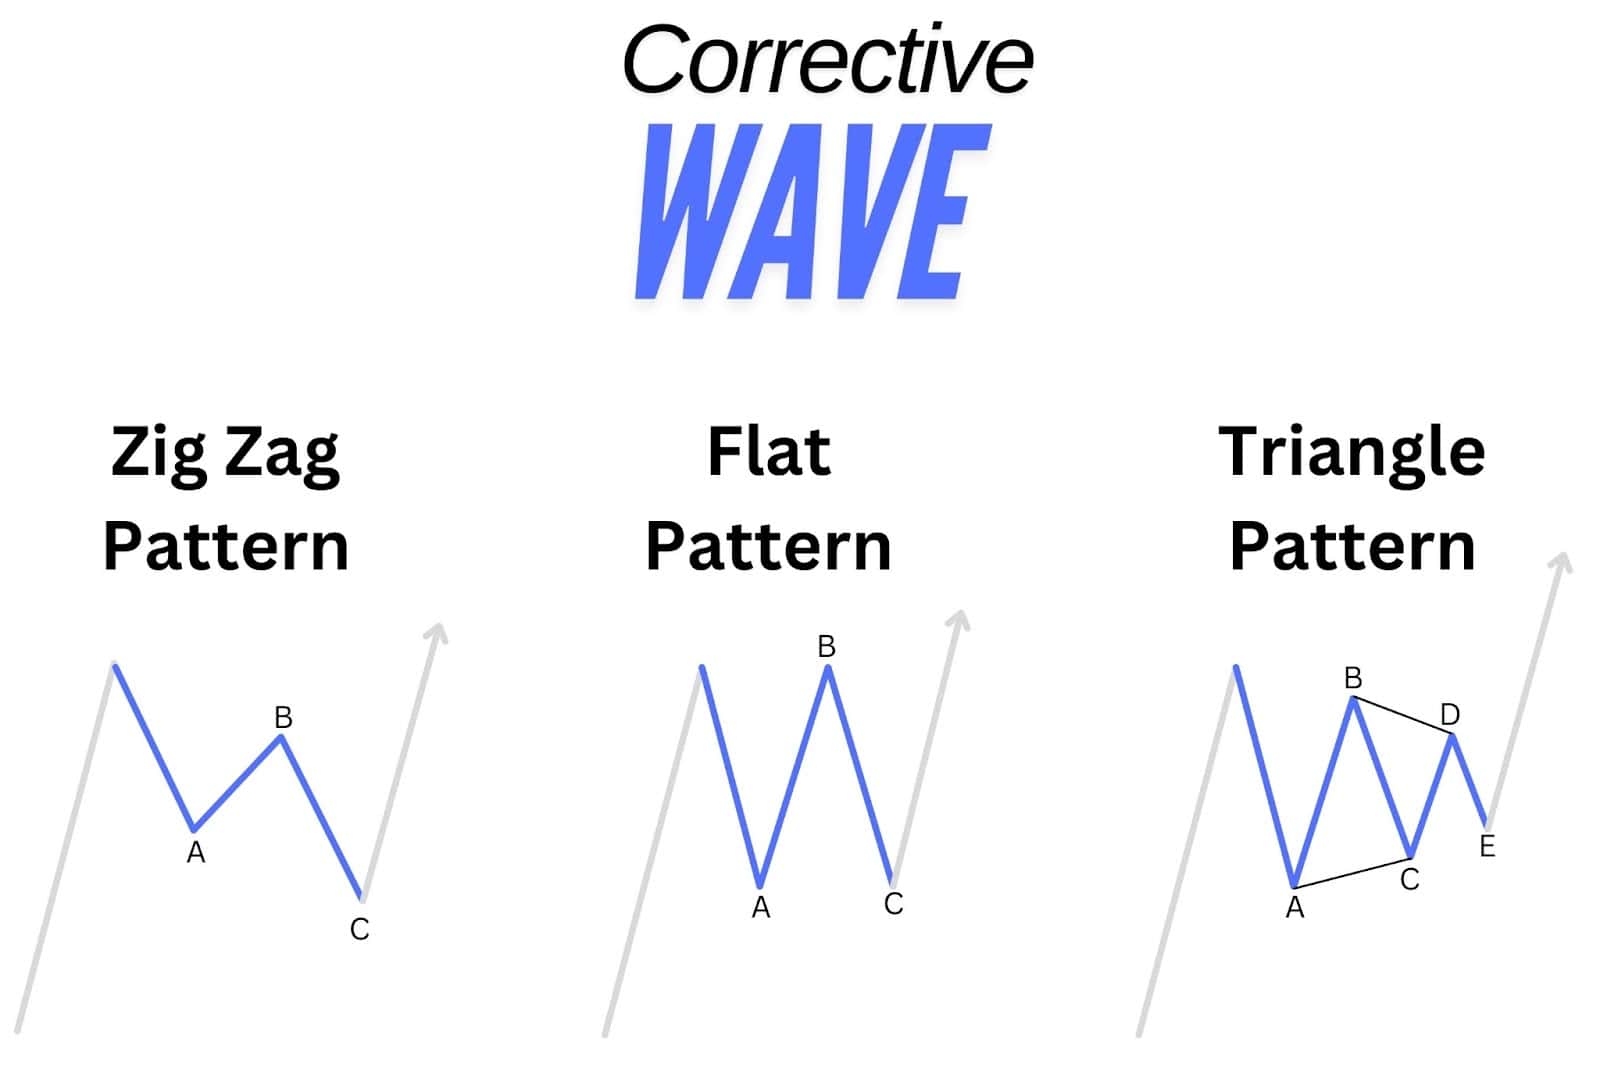
Corrective waves, on the other hand, are composed of three sub-waves and run counter to the prevailing trend. They act as “breathers” within the broader market cycle, providing temporary pullbacks or consolidations before the trend resumes. These corrections don’t signal a reversal of the overall trend but reflect moments when market participants pause, take profits, or reassess their positions.
It’s important to note that both types of waves can occur within each other. Corrective phases are found within motive waves (such as waves 2 and 4), and similarly, motive waves can appear within corrective patterns, like in the case of zigzag corrections. More detailed discussions on these variations and their patterns will follow later in the article.
This interaction of motive and corrective waves across different timeframes and structures creates the continuous ebb and flow of market trends.
The 5 Basic Patterns in Elliott Wave Theory
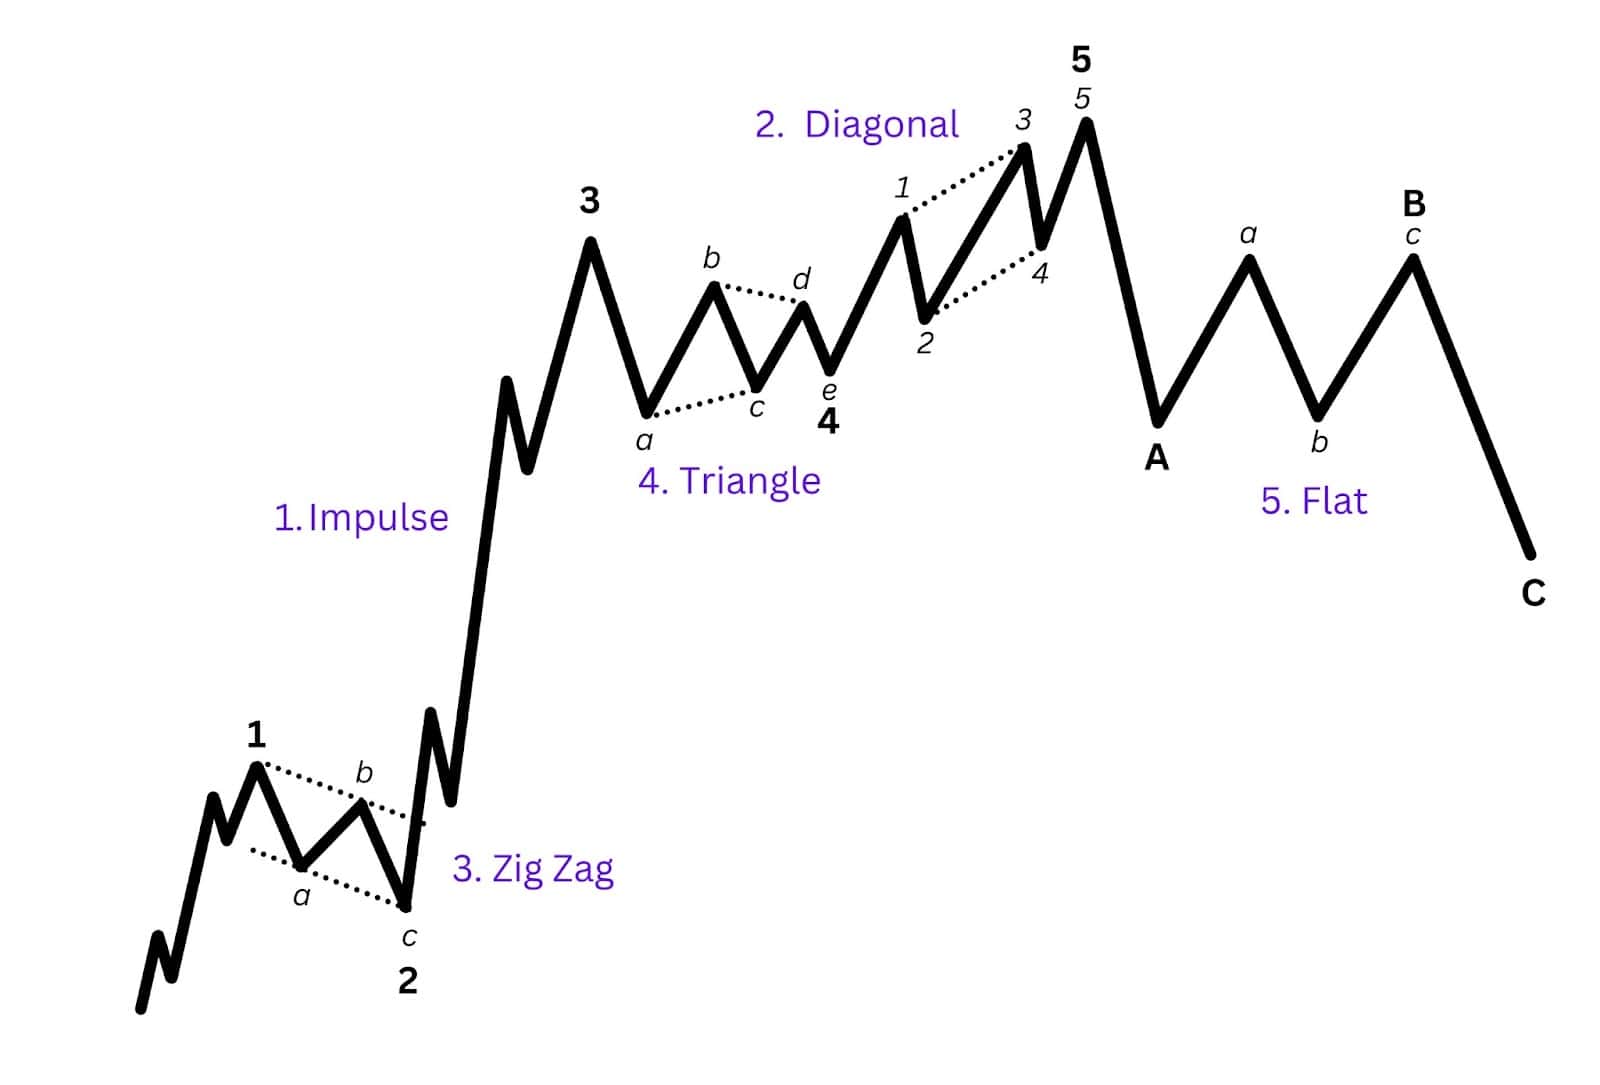
The Elliott Wave Theory is built on five fundamental patterns that form the structure of price movements in the market. Two of these patterns are motive waves (impulsive waves and diagonals) while three of the patterns are corrective (zigzag, triangle, and flat). These patterns have specific shapes and substructures that traders and analysts use to spot where the price may be located within the Elliott wave sequence.
These patterns provide traders with a roadmap to understand both trending and corrective phases.
The five basic patterns include:
- Impulse (motive) – the most common and straightforward trending pattern.
- Diagonal (motive) – a variation of the motive wave but with overlapping sub-waves.
- Zigzag (corrective) – a sharp corrective pattern that moves against the main trend.
- Triangle (corrective) – a consolidation pattern often seen in corrections before a trend continuation.
- Flat (corrective) – a sideways corrective pattern that signals temporary market indecision.
Each of these patterns plays a unique role in signalling market trends and corrections. In the following sections, we’ll explore each of these patterns in detail, breaking down how they form and how traders can use them to anticipate market moves.
Impulse Wave
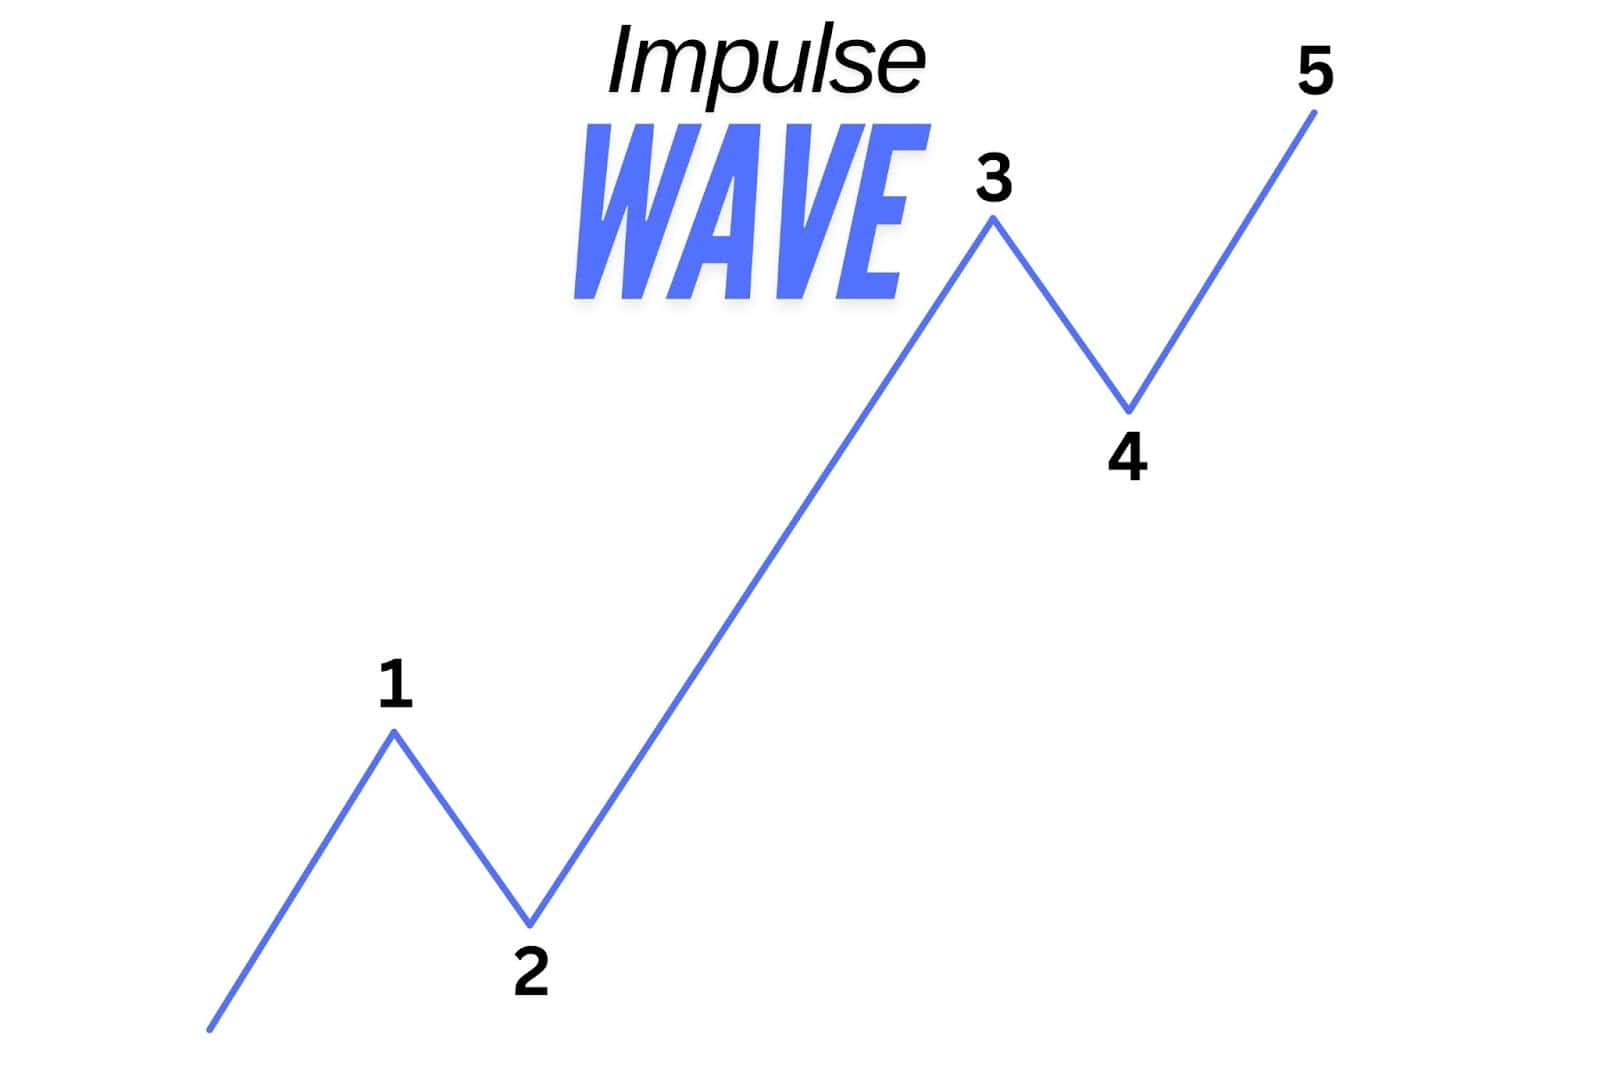
Impulsive waves are the most common and straightforward pattern in Elliott Wave Theory, consisting of five waves that move in the direction of the larger trend. These five waves include three motive waves (waves 1, 3, and 5) that push in the trend’s direction and two corrective waves (waves 2 and 4) that move against it. Impulse waves represent strong market momentum and are typically the driving force behind significant market moves, whether in a bullish or bearish trend. This pattern forms the foundation for identifying trends in the Elliott Wave structure.
Fibonacci Ratio Relationship
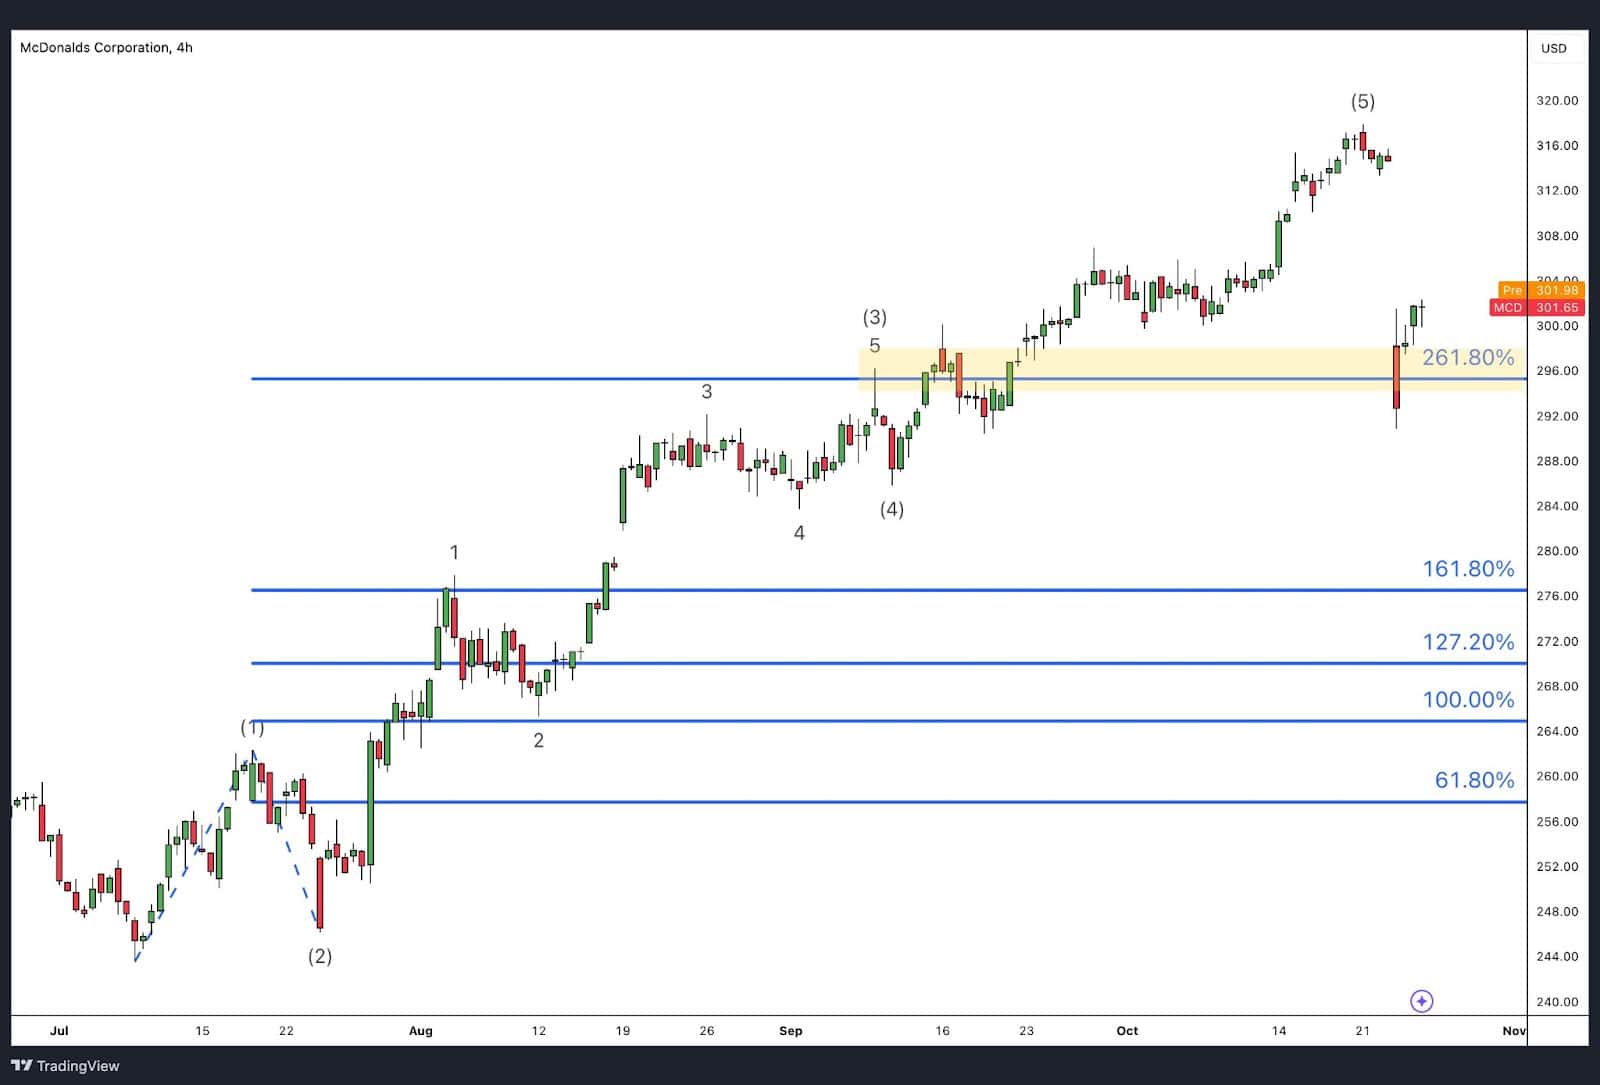
Example: Wave 3 2.618 Fibonacci Extension
Example: Wave 5 61.8% Fibonacci Extension
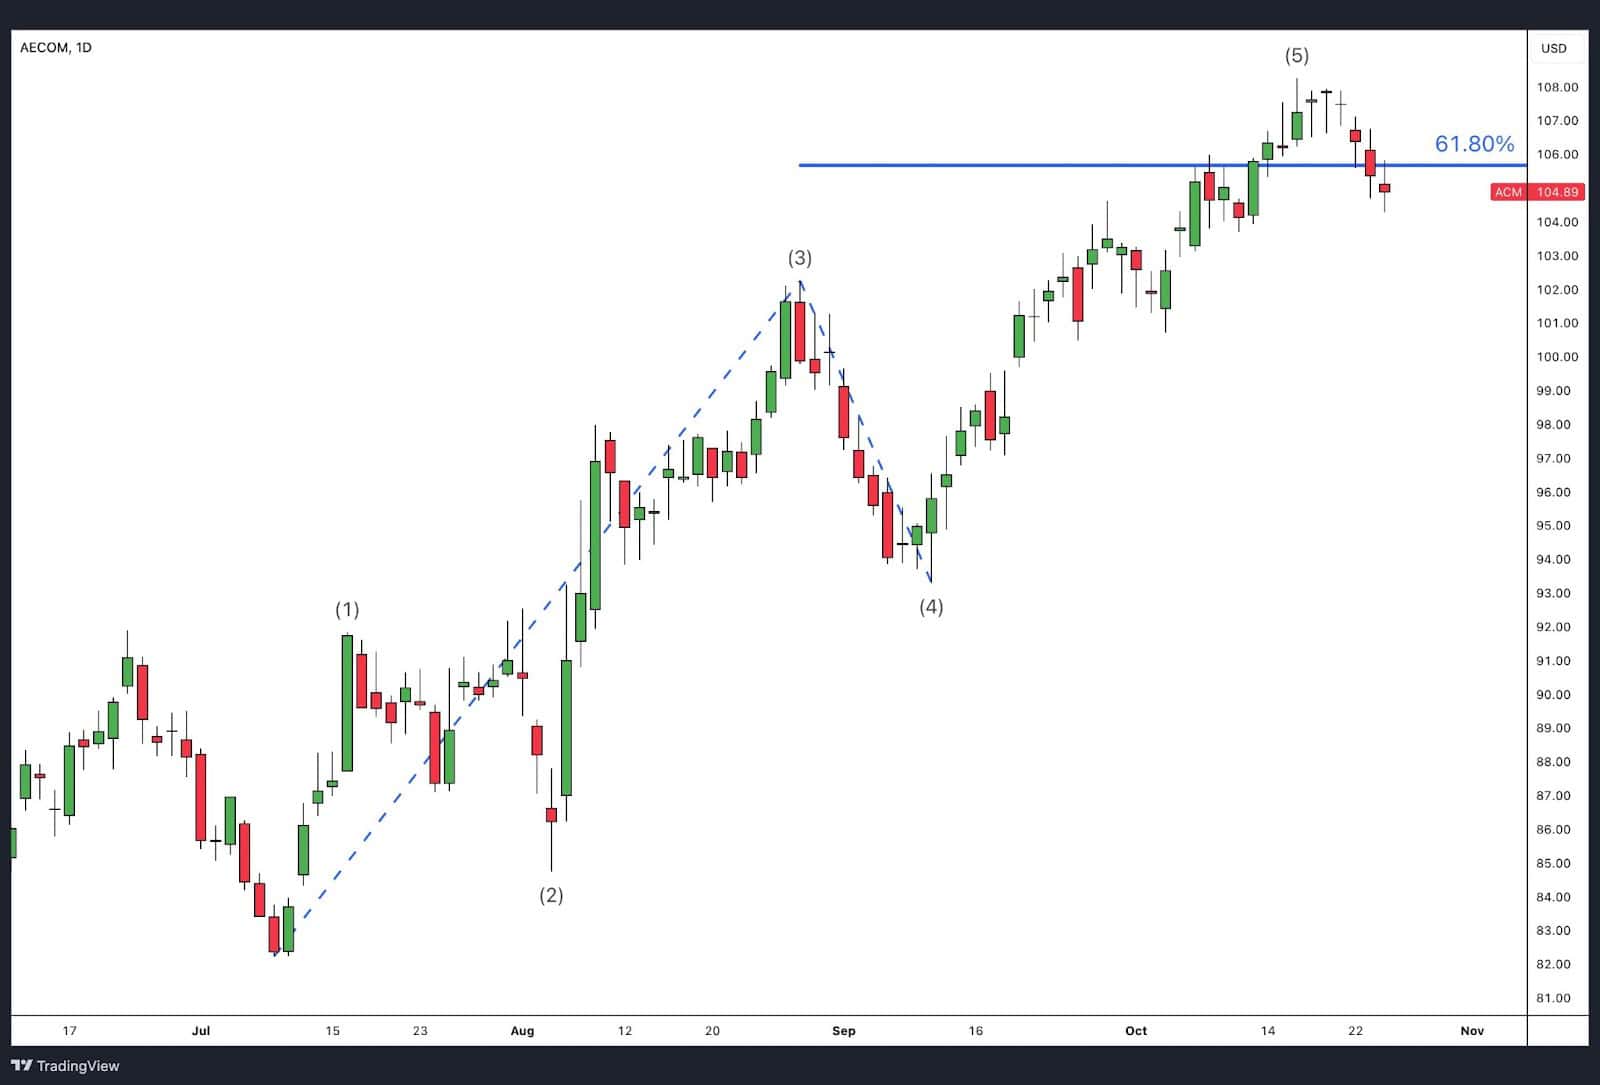
In Elliott Wave trading, Fibonacci ratios help traders predict the potential length and targets of each wave.
- Wave 3: The usual target for Wave 3 is 1.618, 2 and 2.618 times the length of Wave 1. This is because Wave 3 often experiences the greatest market participation and buying/selling pressure.
- Wave 5: The length of Wave 5 is often related to Wave 1. It may be equal in length to Wave 1, or it could extend 61.8% of the total distance from Wave 1 to Wave 3.
These Fibonacci relationships offer key insights into potential price trends and help traders set realistic expectations for future price movements.
Impulse with Extension
Depending on market conditions, one of the waves within the impulse wave pattern (Wave 1, 3, or 5) can extend significantly beyond the others. These extensions occur due to shifts in market sentiment or external catalysts, making one wave substantially longer than the others. Here’s how each type of extension functions:
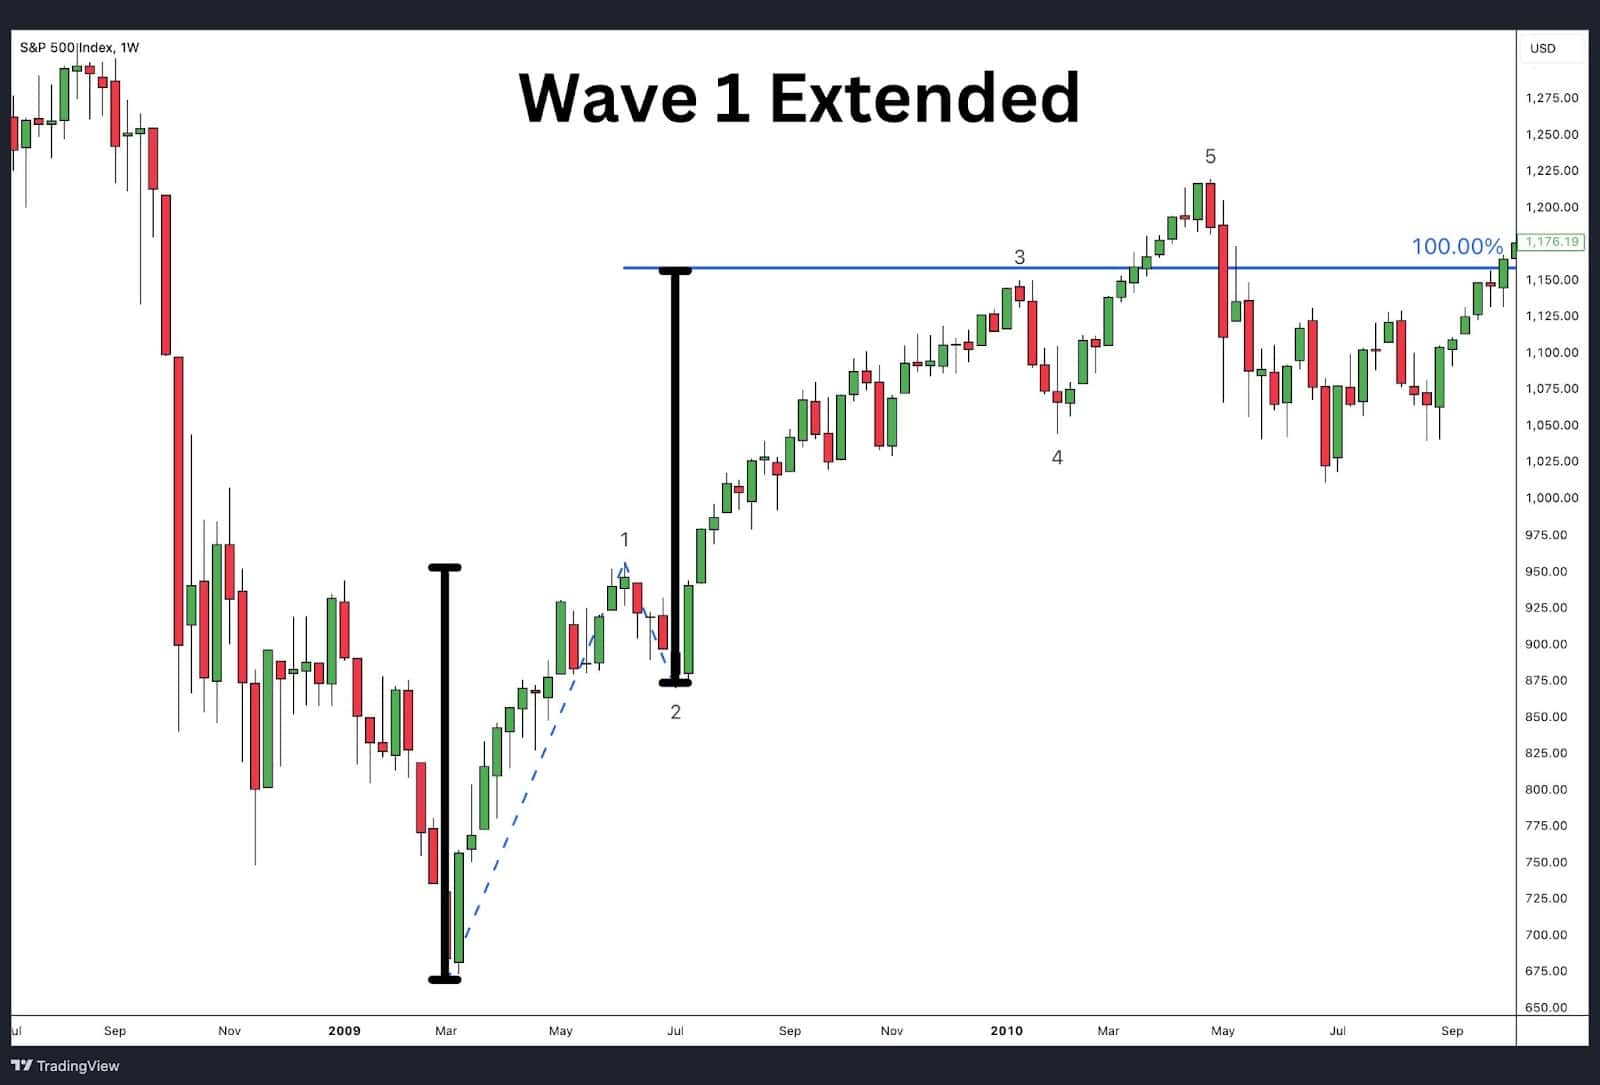
- Wave 1 Extension: Rare but occurs when a new trend starts with extreme strength, often after a long period of consolidation or following major news or policy changes. This sharp movement marks a powerful reversal, with Wave 1 reflecting strong buying or selling pressure from the outset.
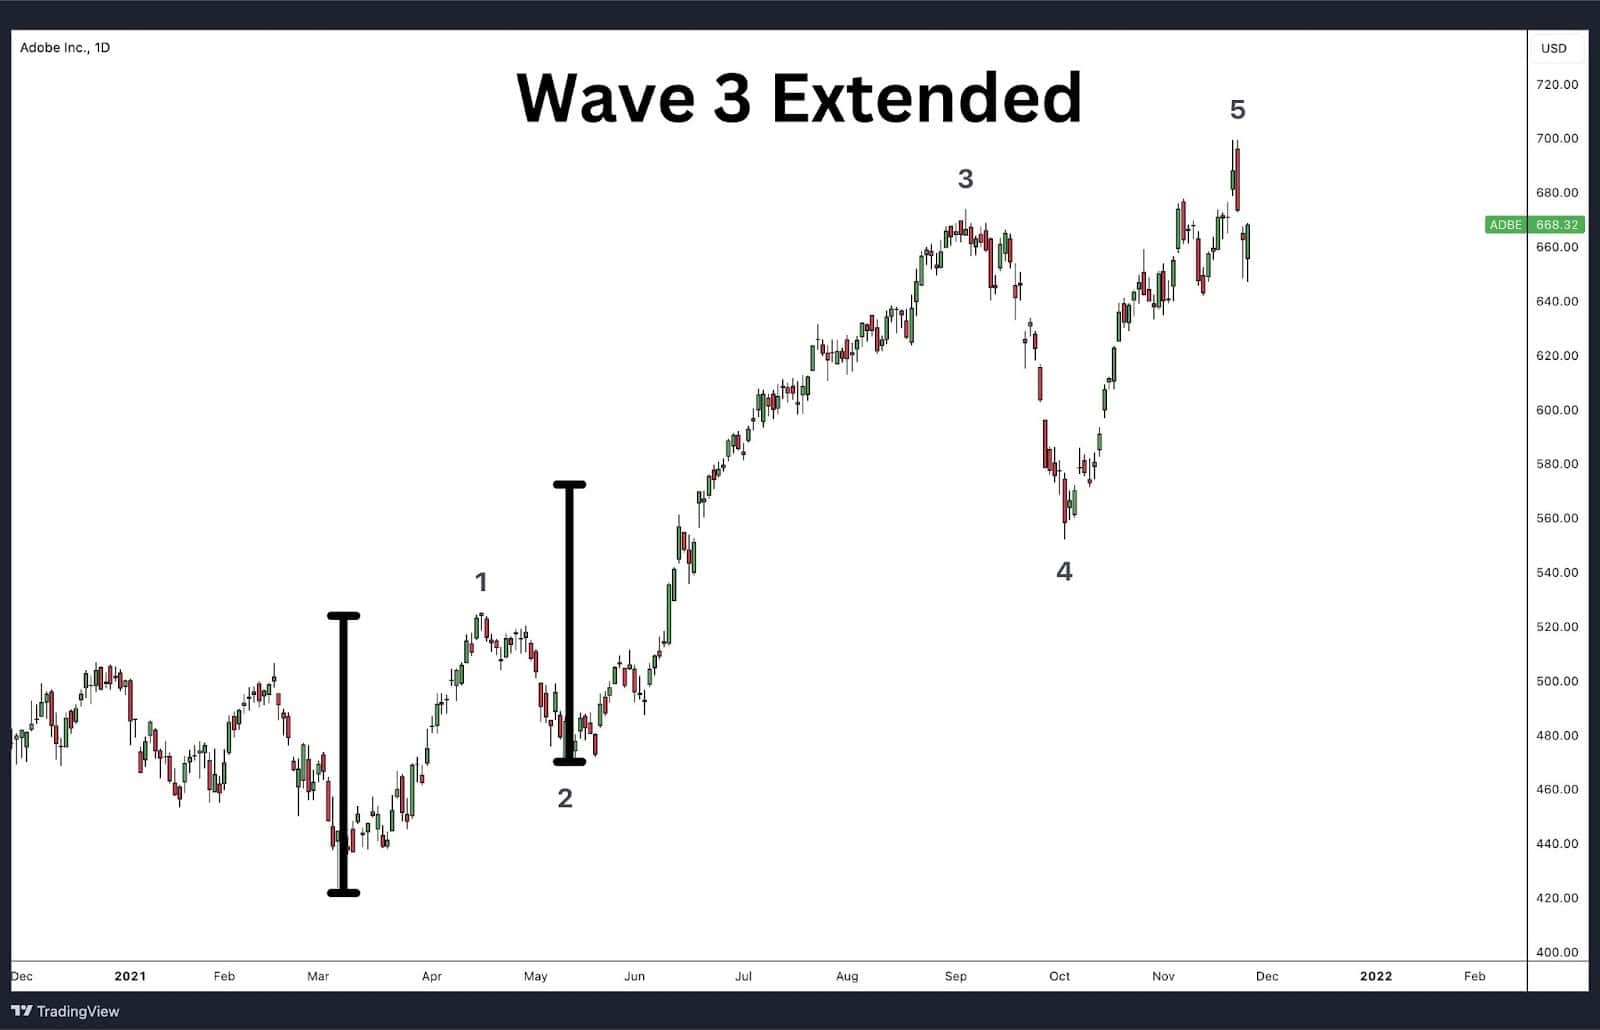
- Wave 3 Extension: The most common type of extension. Wave 3 is typically the strongest wave, driven by market-wide recognition of the trend. Investors and traders pile in, causing the wave to extend. It’s often fuelled by strong economic data or broad market participation, and it usually marks the most significant price movement in the sequence.
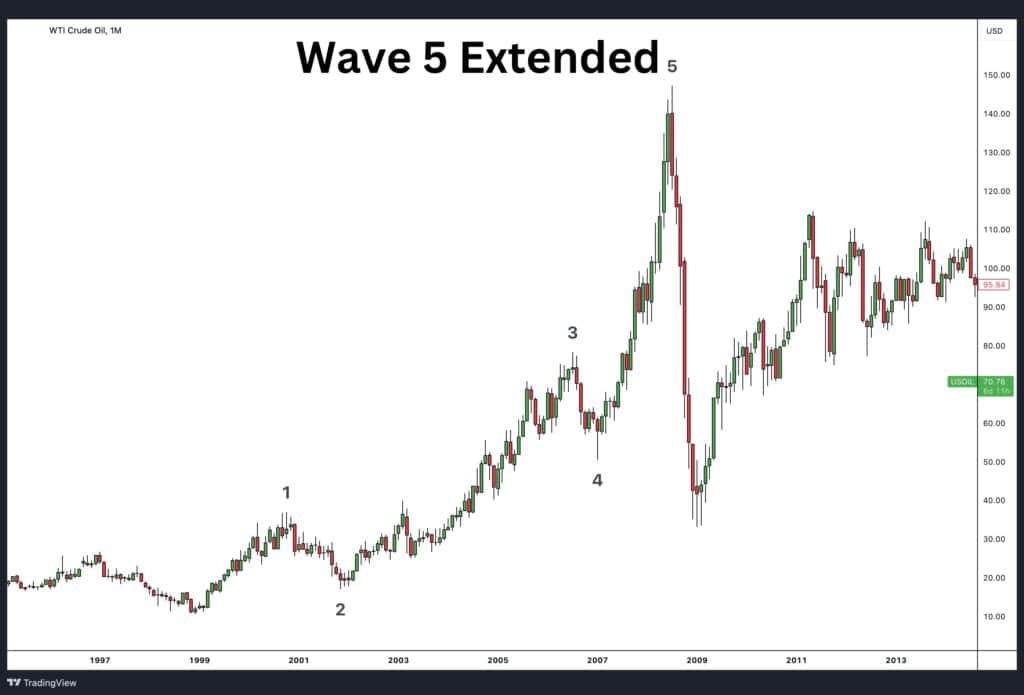
- Wave 5 Extension: Seen more frequently in commodities and speculative markets. Wave 5 extensions occur during the final stages of a trend, often marked by extreme sentiment or speculative excess. Prices surge beyond expectations, but this wave is often followed by sharp corrections once the trend exhausts itself.
Extensions provide valuable insight into where market momentum is strongest, and knowing which wave is extending can help traders plan their strategies and manage risk.
Diagonal Waves
In Elliott Wave Theory, diagonal waves are unique motive waves that are five-wave structures, but differ from the impulse pattern. The diagonals take the shape of a traditional wedge structure, like a rising wedge or falling wedge.
Unlike typical impulse waves, diagonal waves allow for overlap between waves 1 and 4. This overlap signals a weak or weakening trend. Diagonal patterns signal the beginning or end of a trend depending on where they appear within the larger Elliott wave sequence. They come in two forms: leading diagonals and ending diagonals.
Leading Diagonal
A leading diagonal appears in the Wave 1 position of an impulse or the Wave A position of a zigzag pattern. It consists of five waves, and unlike a traditional impulse wave, will exhibit overlap between wave 1 and 4. This overlap hints at a lack of clear momentum but suggests the trend is trying to get organised to build stronger.
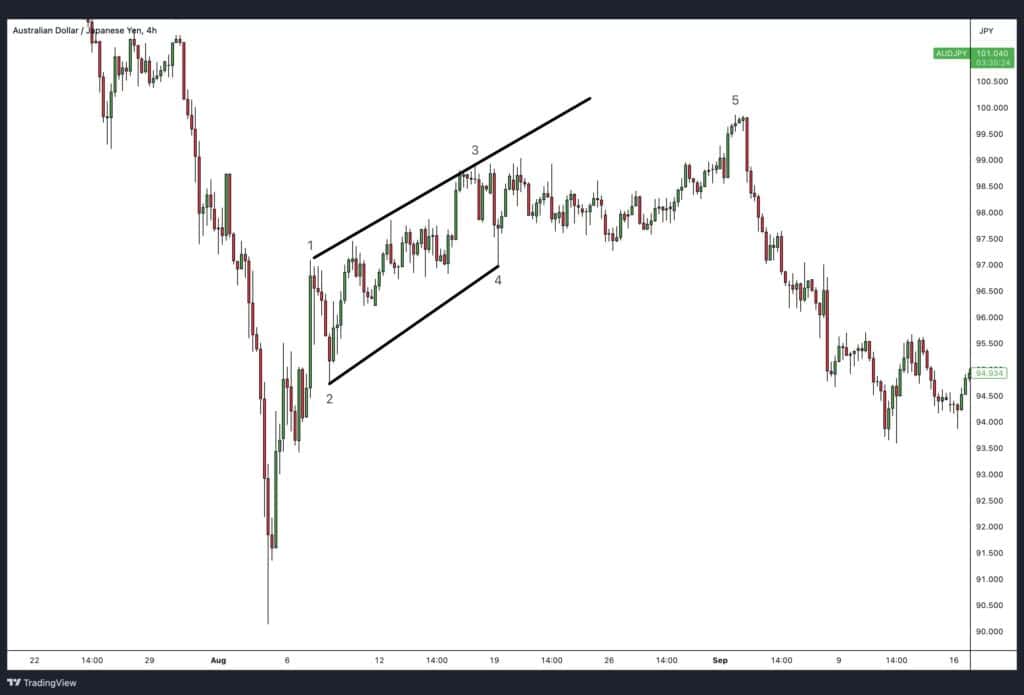
In a contracting leading diagonal, each successive wave is smaller than the previous one, creating a wedge-like structure. This formation shows that while the trend is starting, the market may lack full confidence, causing the waves to narrow.
- Wave 1 establishes the trend direction.
- Waves 2 and 4 are corrective, and they retrace a portion of Waves 1 and 3, respectively.
- Waves 3 and 5 move in the trend direction but grow progressively shorter, indicating diminishing strength.
Leading diagonals are typically seen in markets just beginning a new trend, where uncertainty still exists.
Ending Diagonal
An ending diagonal appears at the end of a trend, usually in Wave 5 of an impulse or Wave C of a zigzag or flat pattern. It indicates exhaustion in the market, with participants losing momentum in the corrective trend direction. Ending diagonals signal that a reversal is approaching.
Note: In this section, we will focus on contracting ending diagonals, as they are more common and practical for real-time analysis. Expanding ending diagonals are extremely rare and usually only identifiable in hindsight, making them less useful for traders aiming to spot patterns in live markets.
Contracting Ending Diagonal
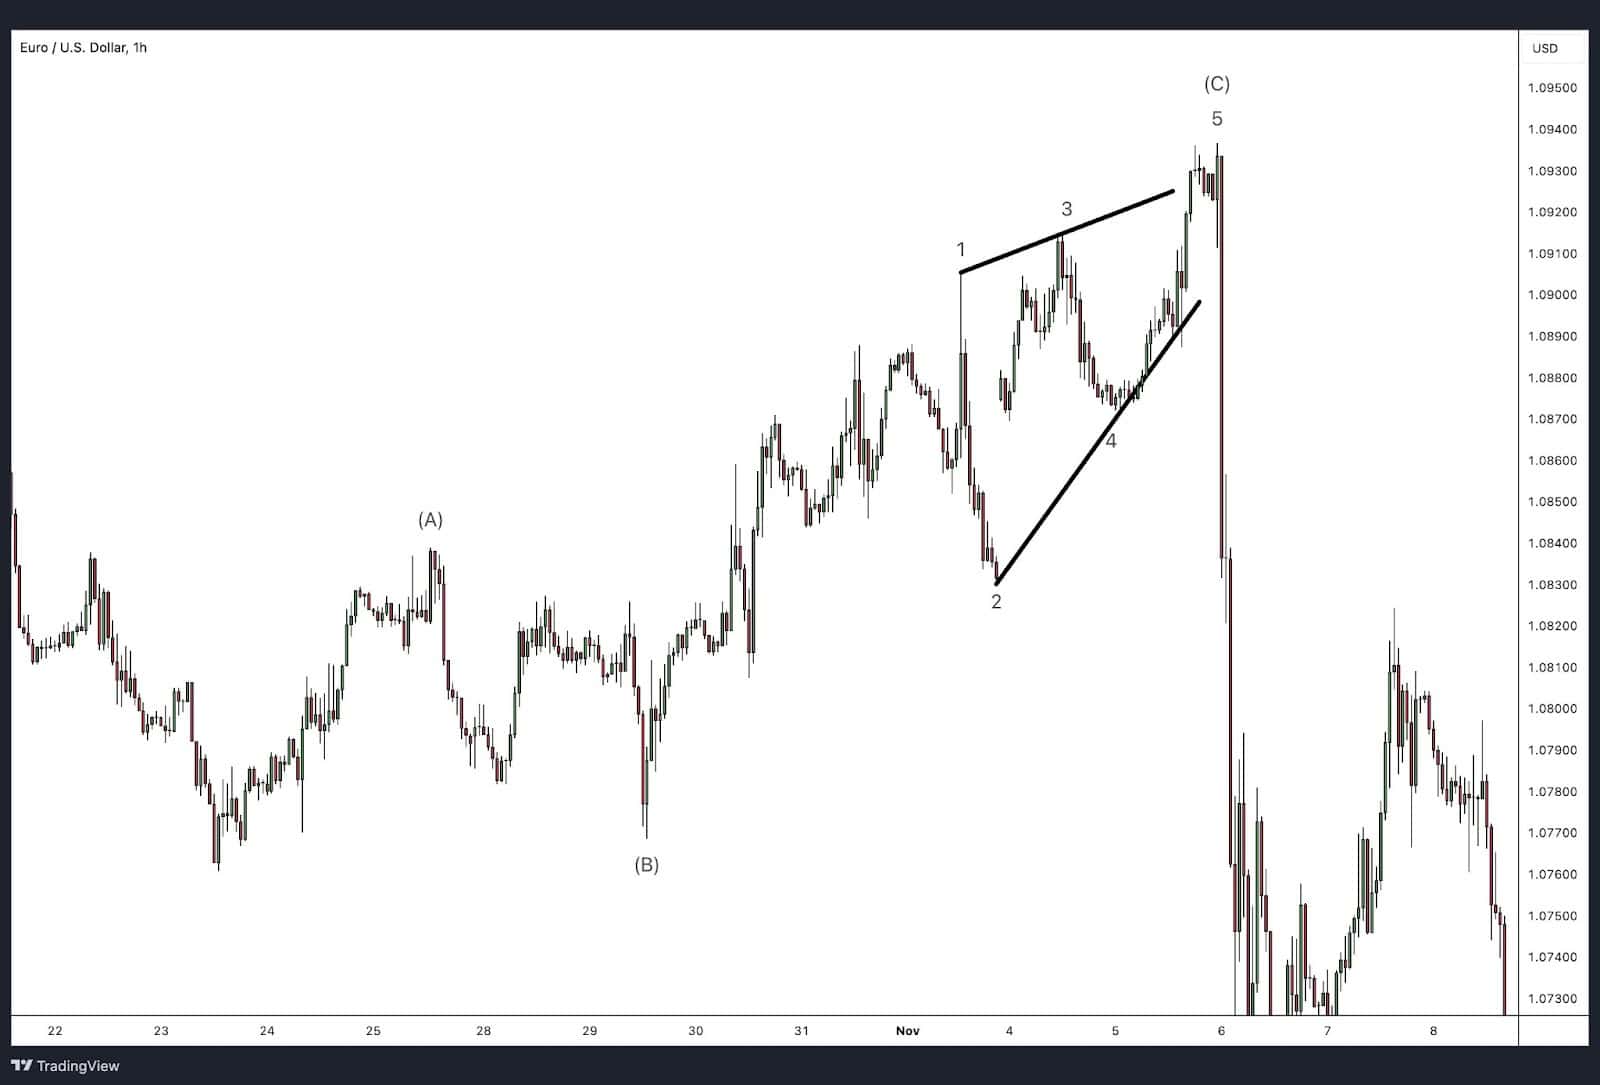
A contracting ending diagonal forms as a narrowing wedge, with each wave smaller than the previous one. This pattern signals that the trend is losing strength, often marking the peak (or trough) before a significant reversal.
- Wave 1 sets the trend direction, but it lacks the force of typical impulses.
- Waves 3 and 5 continue in the direction of the trend but diminish in length, showing exhaustion.
- Waves 2 and 4 retrace parts of Waves 1 and 3 but are also smaller, reinforcing the contracting form.
Contracting ending diagonals often indicate a final push of the trend before a strong correction. To spot the ending diagonal, draw a trend line crossing the ends of wave 1 and 3. Many times, wave 5 likes to tag that line, though it doesn’t have to. You’ll know when the ending diagonal is over when you draw a line connecting the end of waves 2 and 4 with the price breaking that trend line after the fifth wave is in place.
Zigzag Pattern
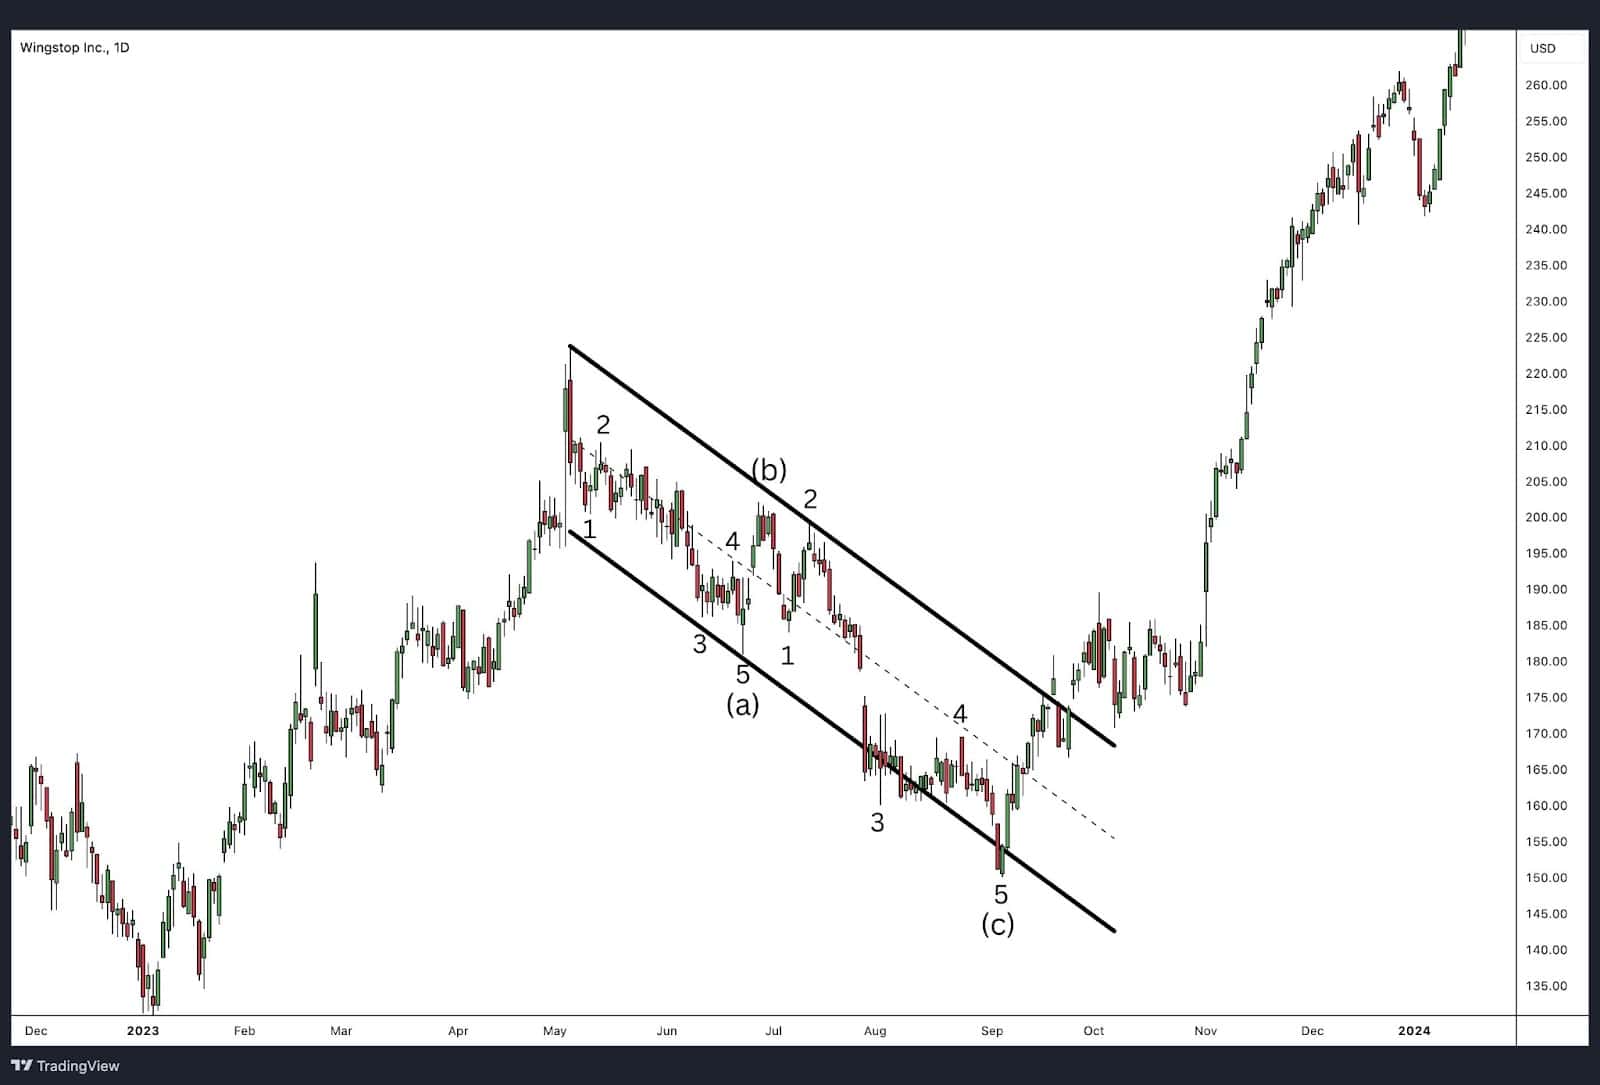
Zigzag Patterns are one of the most common corrective patterns in Elliott Wave Theory, typically moving steeply against the main trend. Zigzags occur frequently as Wave 2 corrections and sometimes as Wave 4 corrections. These patterns are characterised by their clear, sharp retracements, often spanning a significant portion of the previous impulse. Zigzag corrections follow a 5-3-5 structure, with three distinct waves labelled A-B-C.
Zigzag waves are common in Wave 2 because, following the completion of Wave 1—for example, a bullish move—bears are often still active, attempting to resume the previous downtrend. This creates strong counter-trend pressure. However, once Wave 2 completes, many bears turn bullish, increasing the number of bulls in the market and propelling the trend forward. Consequently, one of the critical rules is that Wave 2 cannot retrace beyond the origin of Wave 1, as this would invalidate the trend’s progress and fail the corrective purpose of Wave 2.
- Wave A: Consists of five sub-waves moving in the corrective direction.
- Wave B: Consists of three sub-waves moving briefly in the original trend’s direction, offering a partial retracement to wave A.
- Wave C: Consists of five sub-waves completing the correction, typically reaching or exceeding the level of Wave A.
Traders often look for bullish entry points when prices break above the end of Wave B for a more conservative approach, or at the break of Wave 4 of C for a more aggressive entry.
Double Zigzag
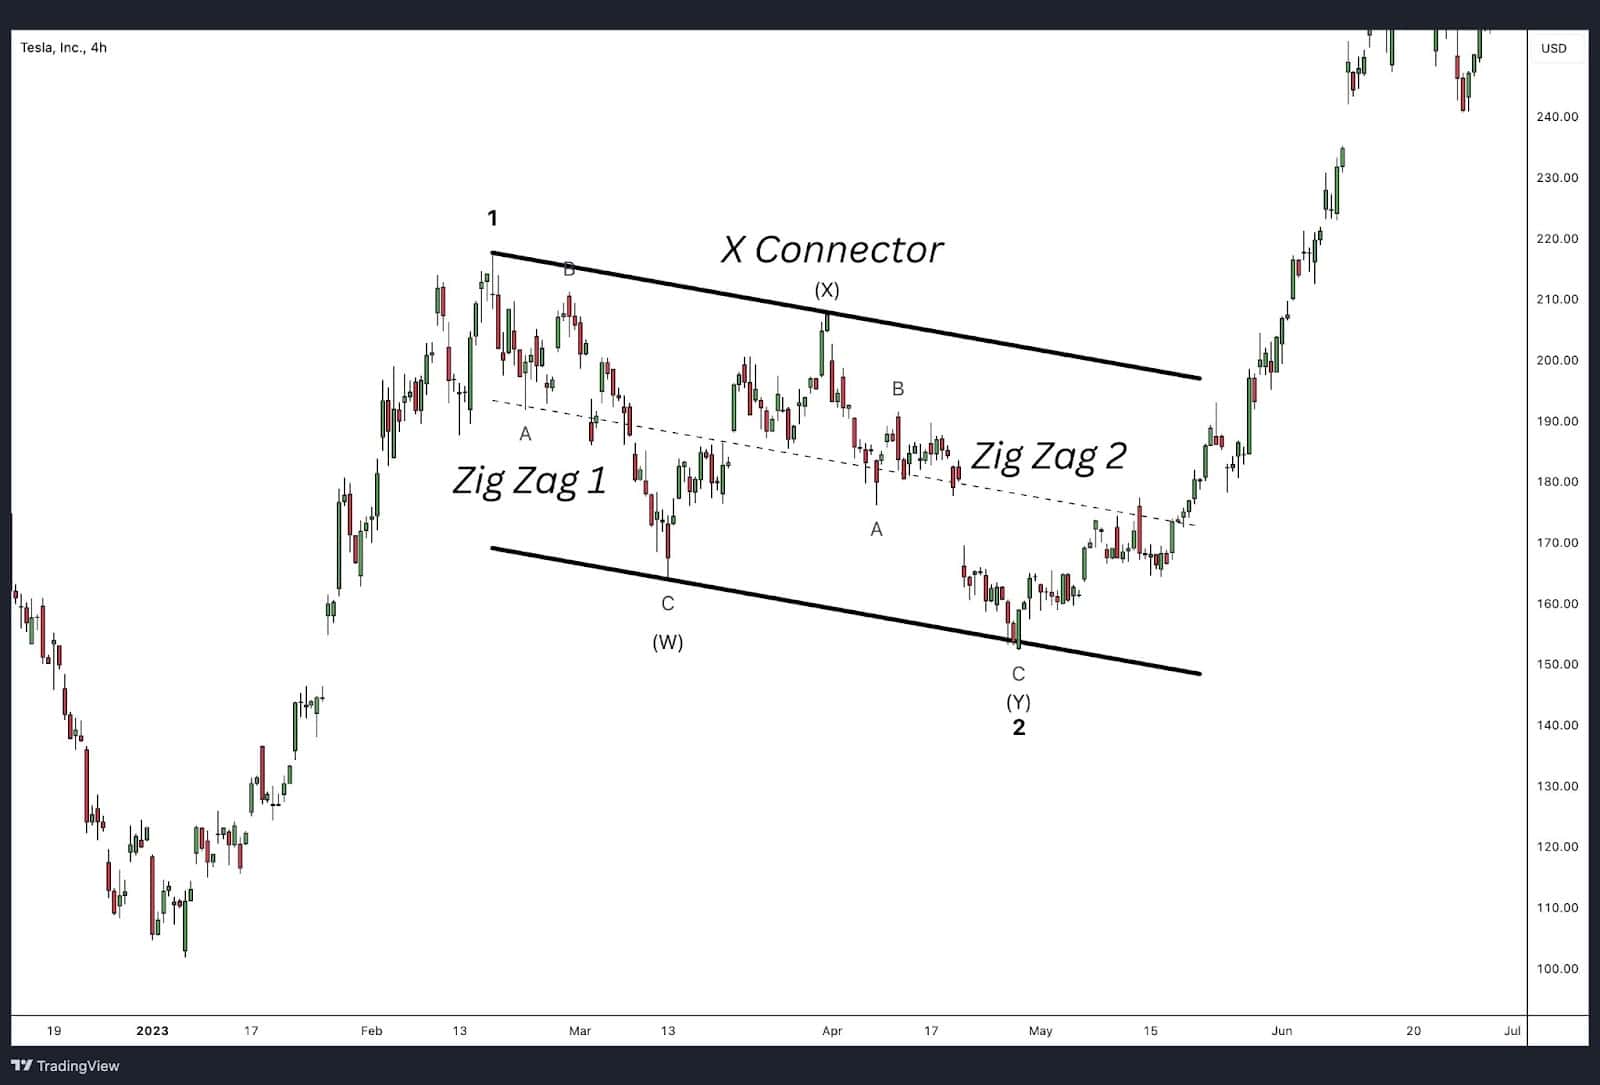
When a single zigzag doesn’t achieve a sufficient correction, the market may form a double zigzag. In this pattern, two zigzags connect, indicating prolonged indecision within the correction phase. The double zigzag structure follows a 3-3-3 sequence, with the individual zigzag waves labelled as W-X-Y.
- Wave W: A full zigzag pattern (A-B-C) consisting of 5-3-5 waves.
- Wave X: A connecting wave with any three-wave corrective structure, acting as a bridge.
- Wave Y: Another zigzag pattern (A-B-C), completing the double zigzag formation.
Double zigzags tend to form when a single zigzag doesn’t satisfy the depth of correction, creating another counter-trend zigzag. Traders can often identify a double zigzag if the market continues showing corrective characteristics without impulsive strength, and if prices fail to break through Wave B of the first zigzag. A break above or below Wave B is generally considered a confirmation that the correction may be complete and the overall trend is likely to resume.
Quick Tip: If you are unclear of the substructure, simply count the waves. A double zigzag will have 7 waves and is considered a corrective wave.
Triple Zigzag
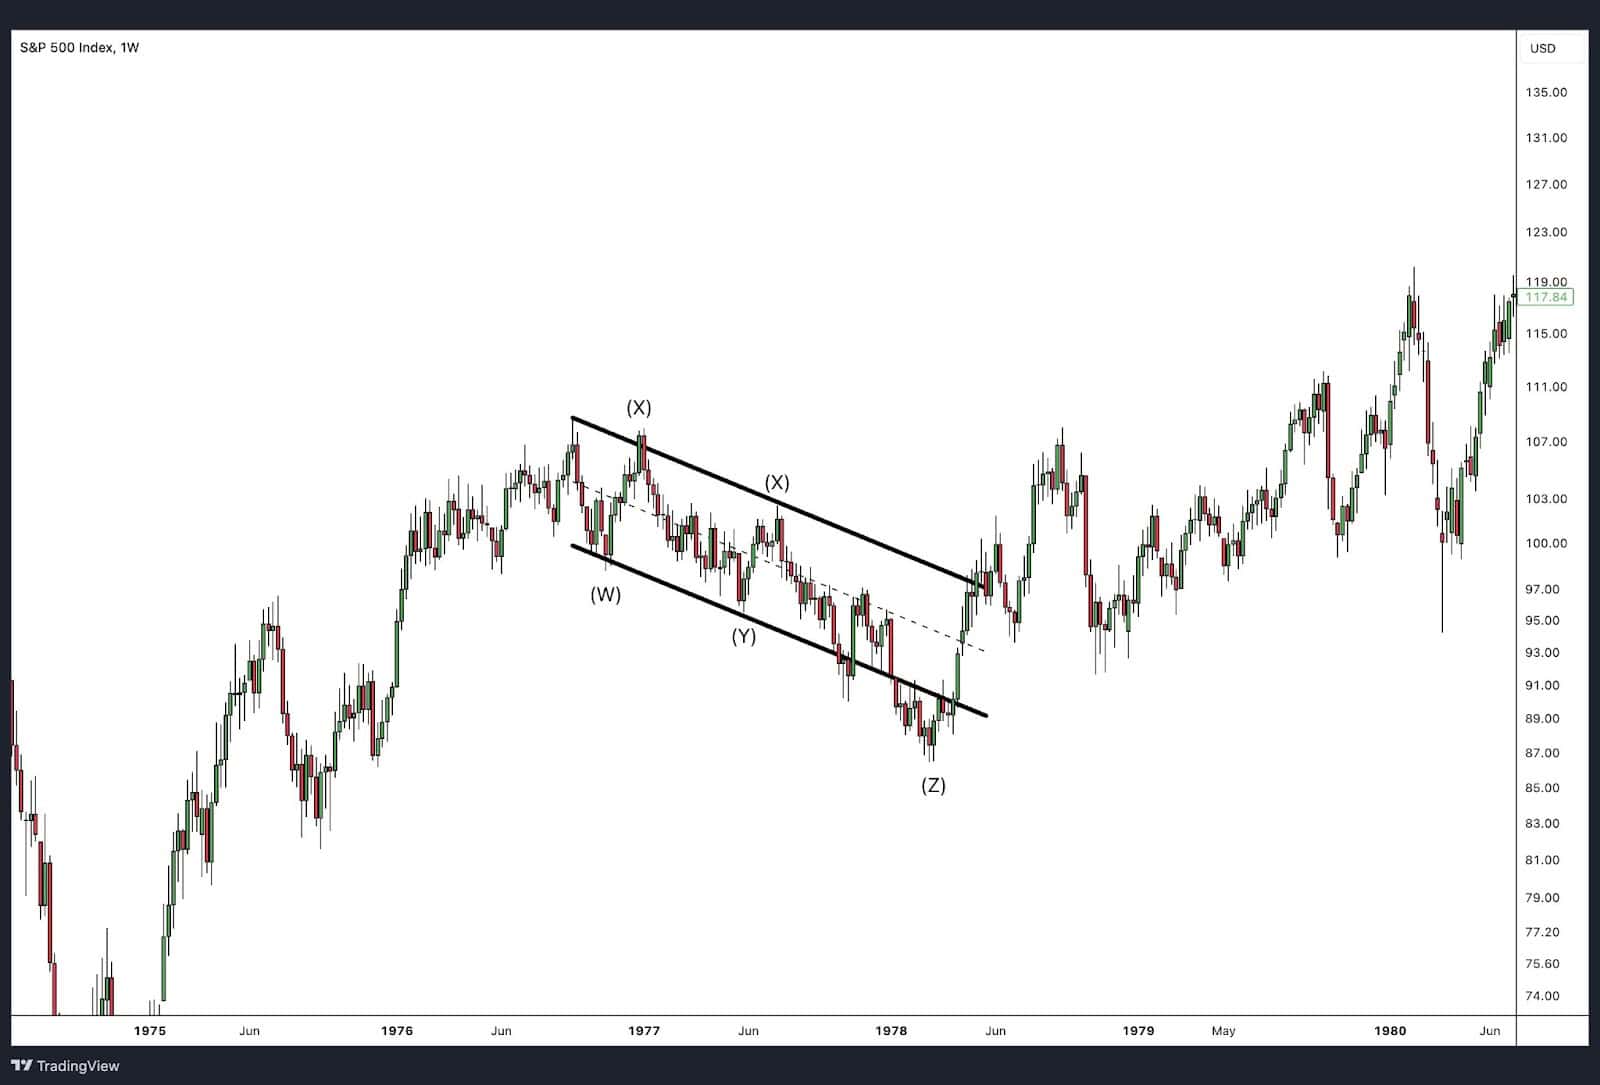
A triple zigzag is rare and occurs only in particularly complex corrective phases. It represents an extended correction where three zigzag patterns connect with two intervening X waves. Like the double zigzag, it follows a 3-3-3-3-3 structure, labelled as W-X-Y-X-Z:
- Wave W: Initial zigzag (A-B-C), typically a 5-3-5 pattern.
- First X wave: A corrective structure connecting Wave W to Wave Y.
- Wave Y: Second zigzag pattern (A-B-C), also 5-3-5.
- Second X wave: Another corrective structure, connecting Wave Y to Wave Z.
- Wave Z: Final zigzag pattern, completing the triple formation.
Due to its rarity, the triple zigzag generally signals extreme market indecision. Traders watching for a triple zigzag often notice that the market struggles to break above or below Wave B across each zigzag phase, indicating the persistence of the corrective phase. However, the presence of three connected zigzags is so uncommon that traders typically only look for this pattern if the market fails to establish a clear direction.
Fibonacci Ratio Relationship
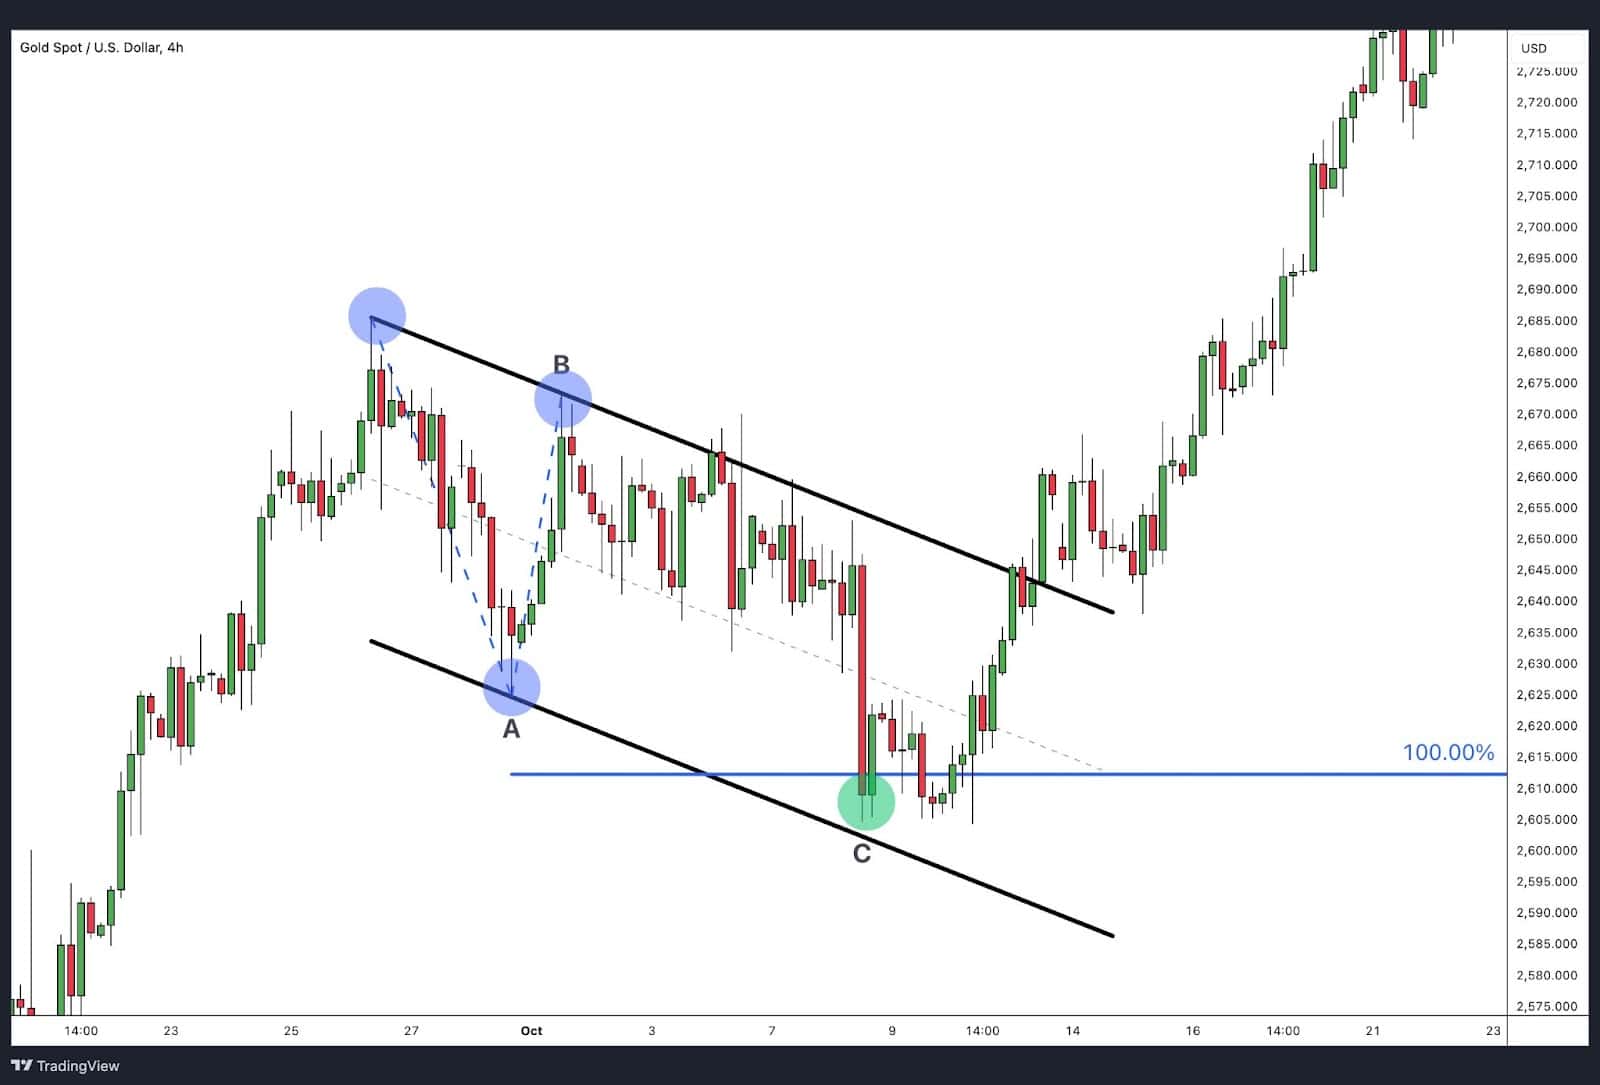
Fibonacci ratios play an essential role in setting expectations for zigzag corrections:
- Wave C typically equals the length of Wave A in a single zigzag, creating a target where Wave C may reach 100% of Wave A. (Use the Fibonacci extension tool to measure)
- In a double zigzag, the length of Wave Y is often close to that of Wave W, aiming for equality, or 100% of Wave W’s length.
These Fibonacci guidelines provide structure to zigzag patterns, helping traders assess potential reversal points and manage their entry and exit strategies accordingly.
Flat Pattern
The flat pattern is a type of sideways corrective wave structure within Elliott Wave Theory, commonly seen in Wave 4 but also in Wave 2 or in the subwaves of larger corrective waves. Flats develop when the trend takes a pause, often after a strong Wave 3 move, as traders take profits, leading to a horizontal or “flat” price action. This sideways movement continues until a new catalyst pushes the market out of the consolidation, resulting in Wave 5. Traditional technical analysts might recognize the flat pattern as a horizontal flag pattern.
Flat patterns follow a 3-3-5 structure, with two corrective waves (A and B) followed by one motive wave (C). The A and B waves may take the form of a flat, zigzag, multiple zigzag, or combination, providing flexibility within the flat structure.
Rules and Guidelines for Flat Patterns
- Wave A and Wave B consist of three subwaves, while Wave C is composed of five subwaves.
- Wave B often retraces a substantial portion of Wave A and can even exceed it, depending on the type of flat (expanded or running). Wave B typically retraces 90-138% the length of wave A.
- Wave C is always a motive wave, completing the flat structure with a decisive five-wave move.
- A typical target for wave C is 100% the length of wave A or the end of wave A.
There are three types of flat patterns, each taking on a slightly different shape though the underlying subwave structure of 3-3-5 remains the same.
Regular Flats
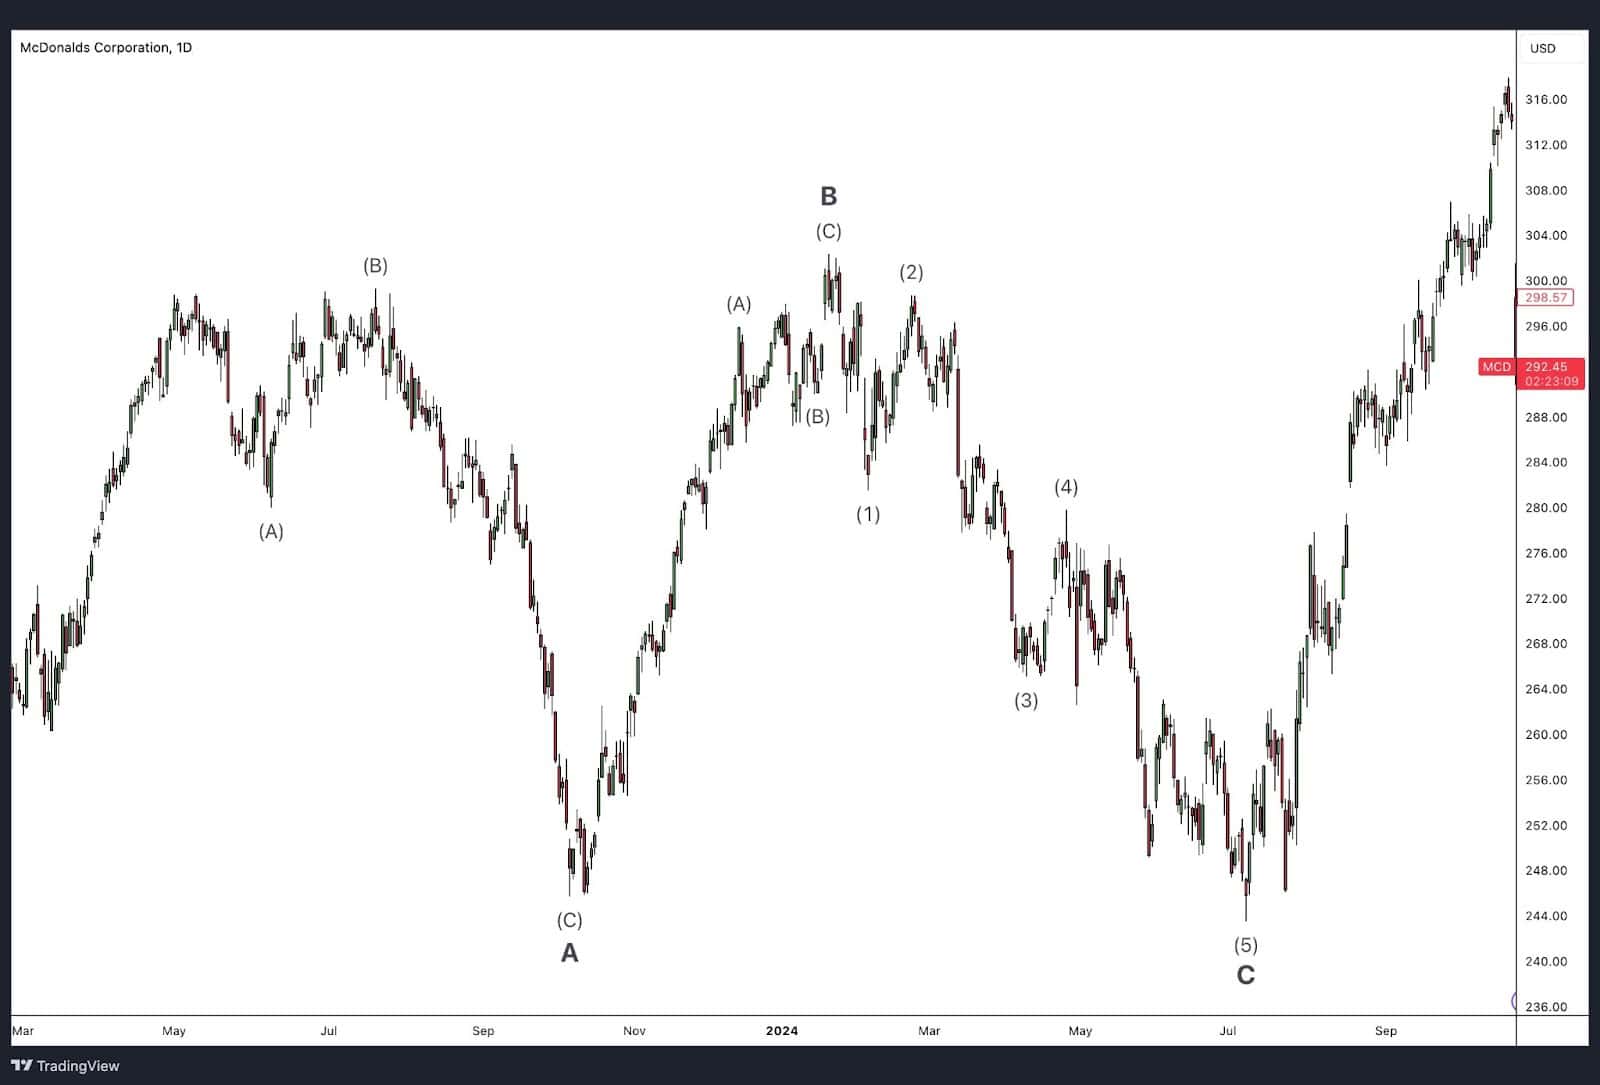
A regular flat is a straightforward 3-3-5 structure where Wave B retraces approximately the same length as Wave A, and Wave C completes near the end of Wave A.
Fibonacci Ratio Relationship
- In a regular flat, Wave C often equals the length of Wave A, maintaining a 1:1 Fibonacci ratio. This creates a balanced corrective structure, indicating the potential end of the flat pattern.
Expanded Flats
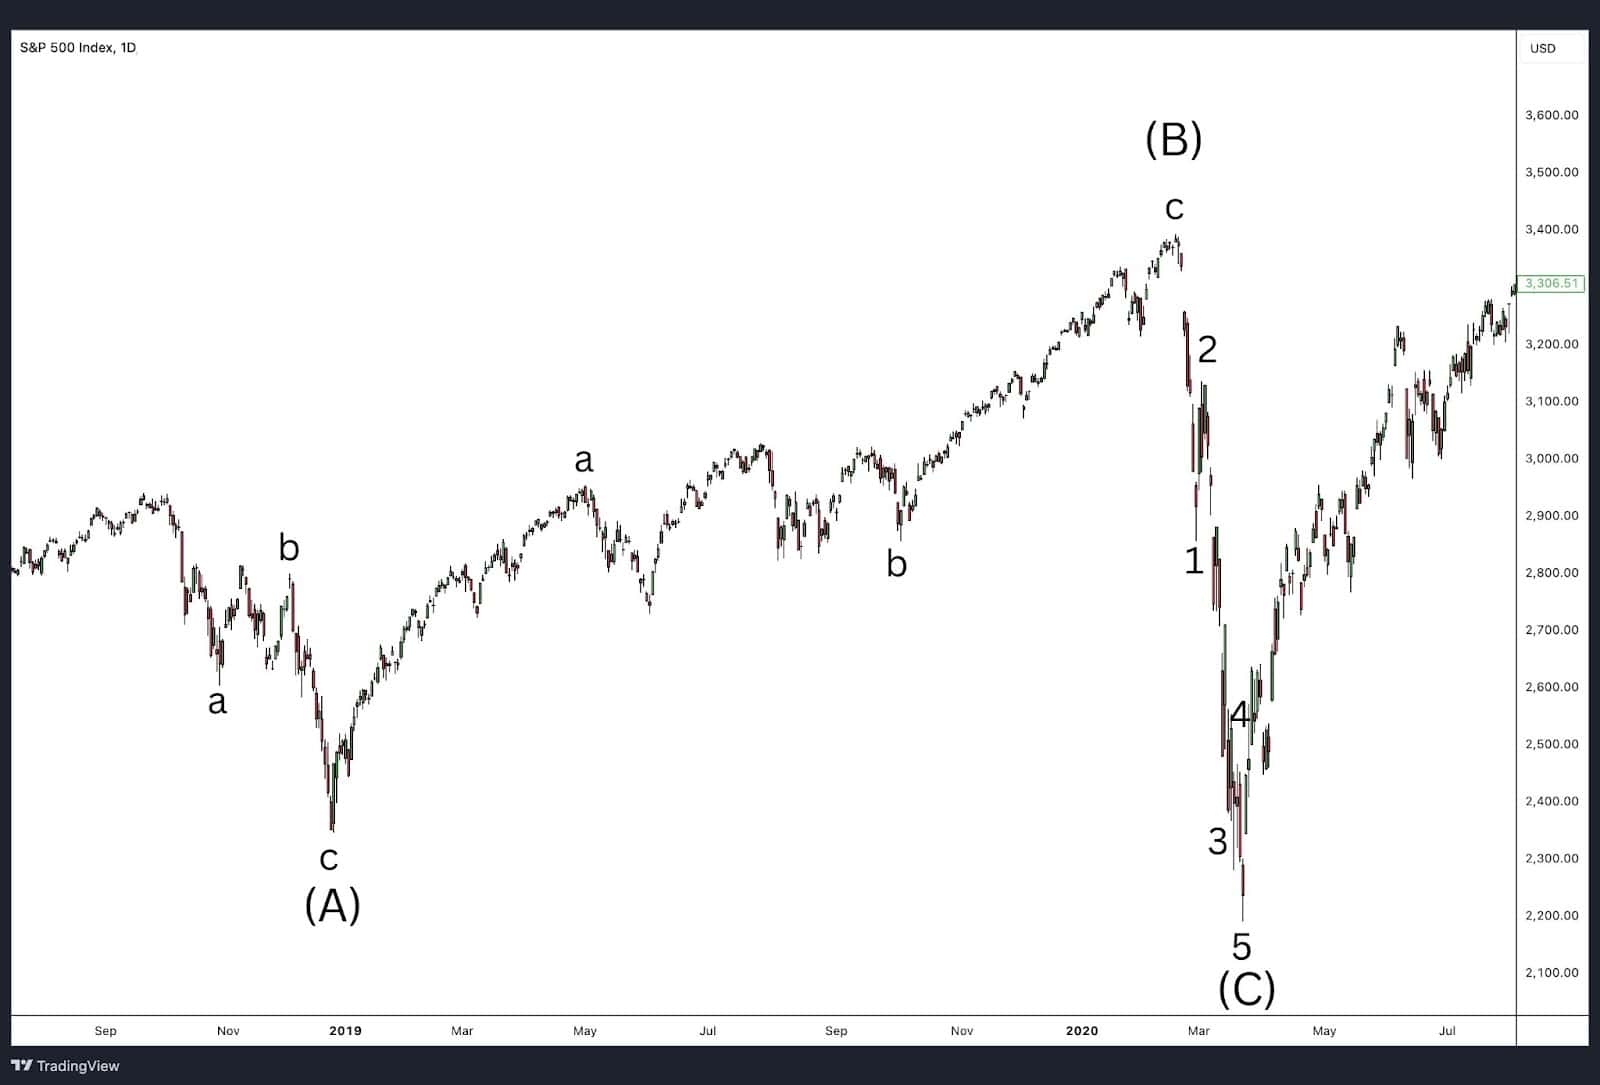
An expanded flat occurs when Wave B exceeds the starting point of Wave A, creating a slightly higher high or lower low, depending on the trend direction. Wave C then reverses sharply, often extending beyond Wave A in the opposite direction. A guideline to follow for wave B is that it typically remains less than 138% the length of wave A, though in rare instances it can exceed that distance.
Fibonacci Ratio Relationship
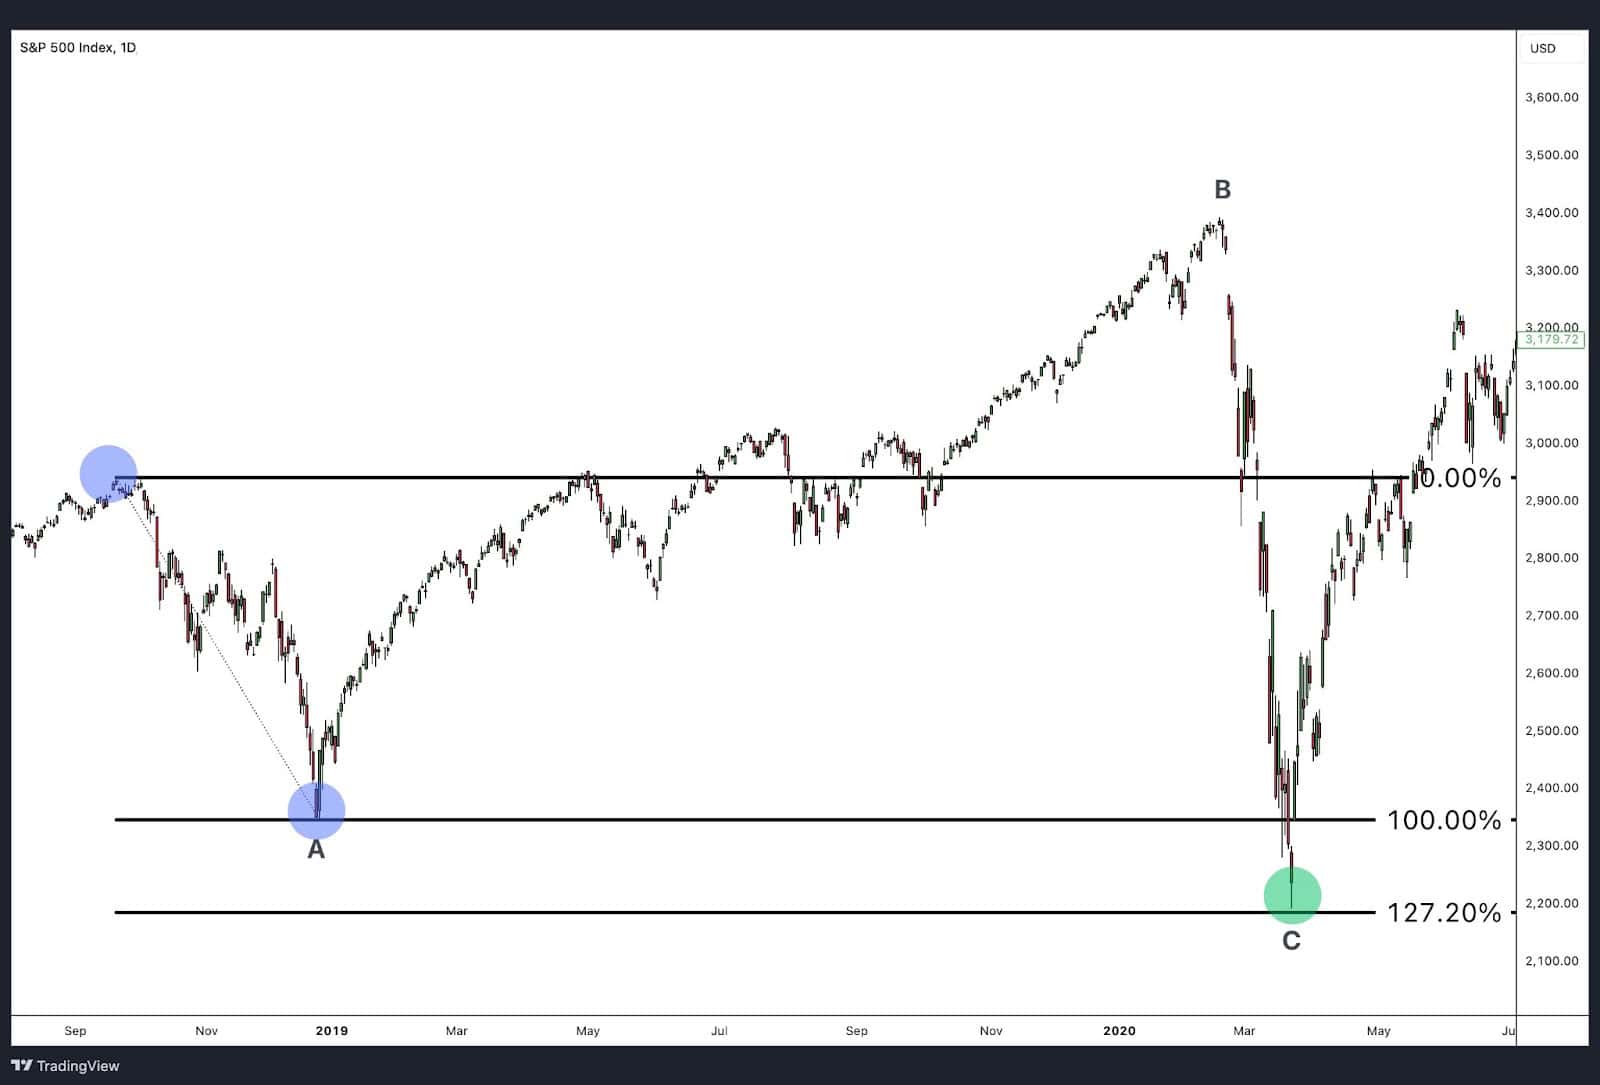
- Wave C in an expanded flat typically extends to 1.272 or 1.618 times the length of Wave A, signalling a deeper or more exaggerated correction before the trend resumes. This extended Wave C is a common feature, creating a clear indication that the correction is ending.
Running Flats
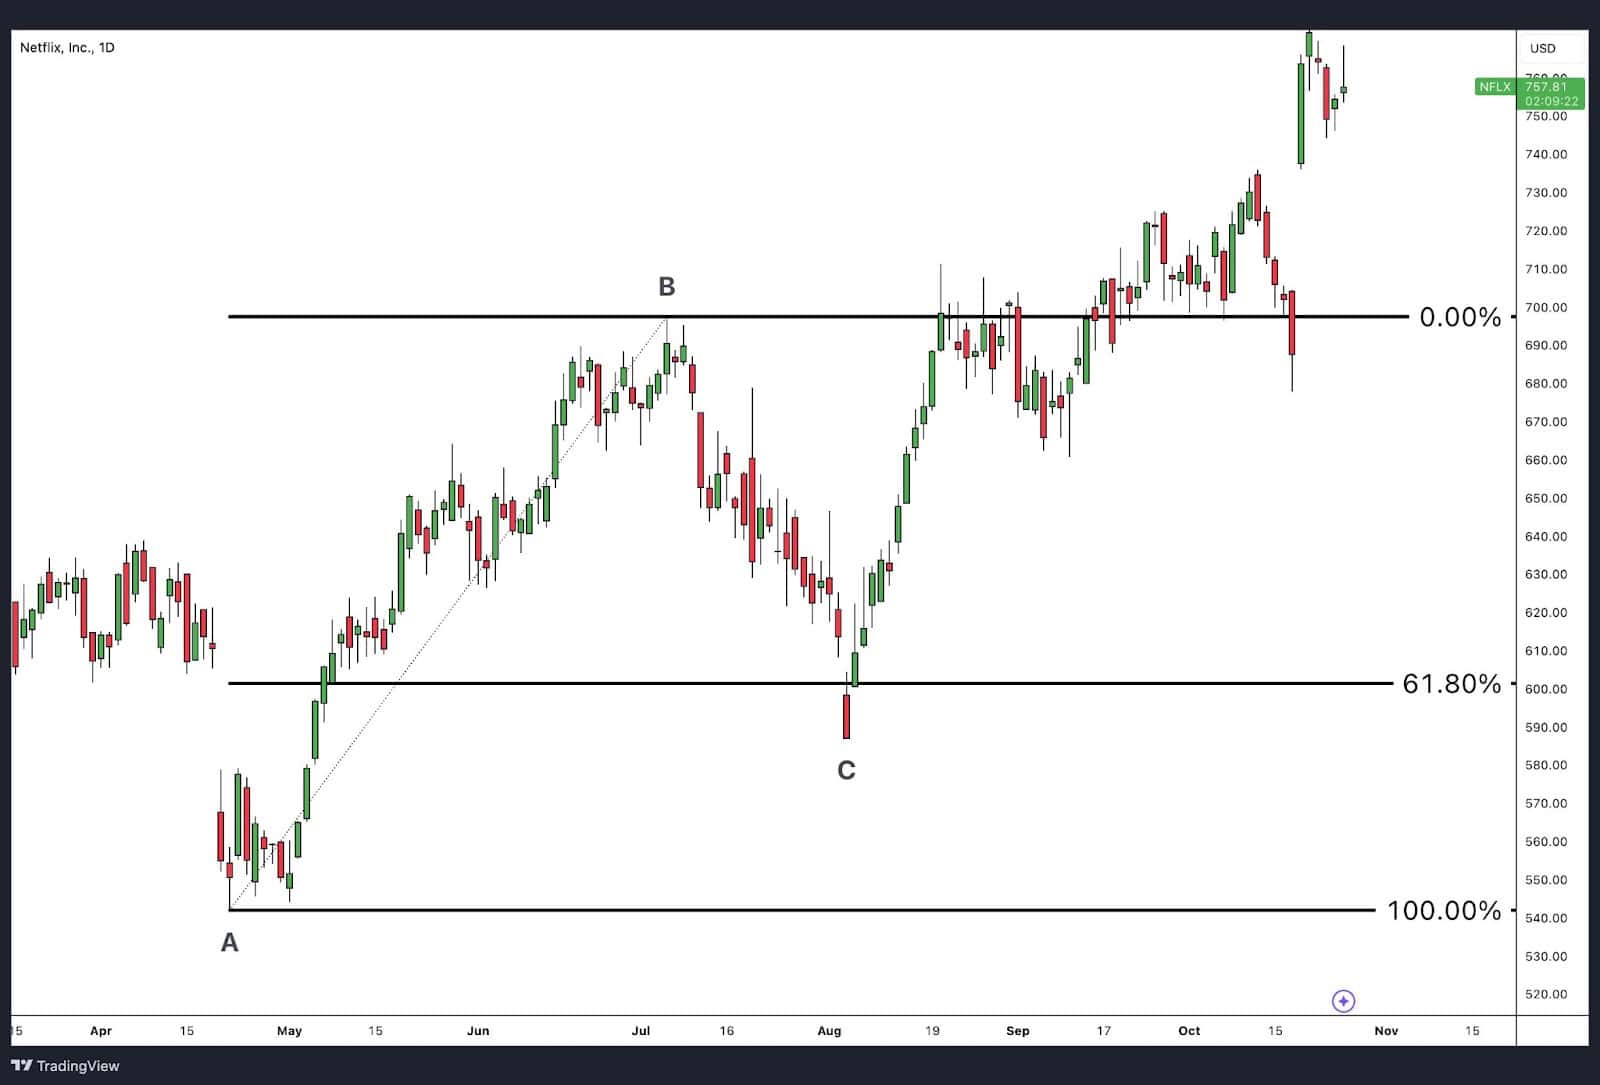
A running flat is an unusual type of flat pattern where Wave B also surpasses the start of Wave A, but Wave C fails to reach the ending level of Wave A. This pattern occurs when the market maintains strong trend momentum despite the corrective structure.
Fibonacci Ratio Relationship
- In a running flat, Wave C is equal (100%) or shorter than Wave A, typically around 0.618 of Wave A. This shortened Wave C reflects the underlying strength of the prevailing trend, indicating a quick return to the trend direction.
Triangle Wave Patterns
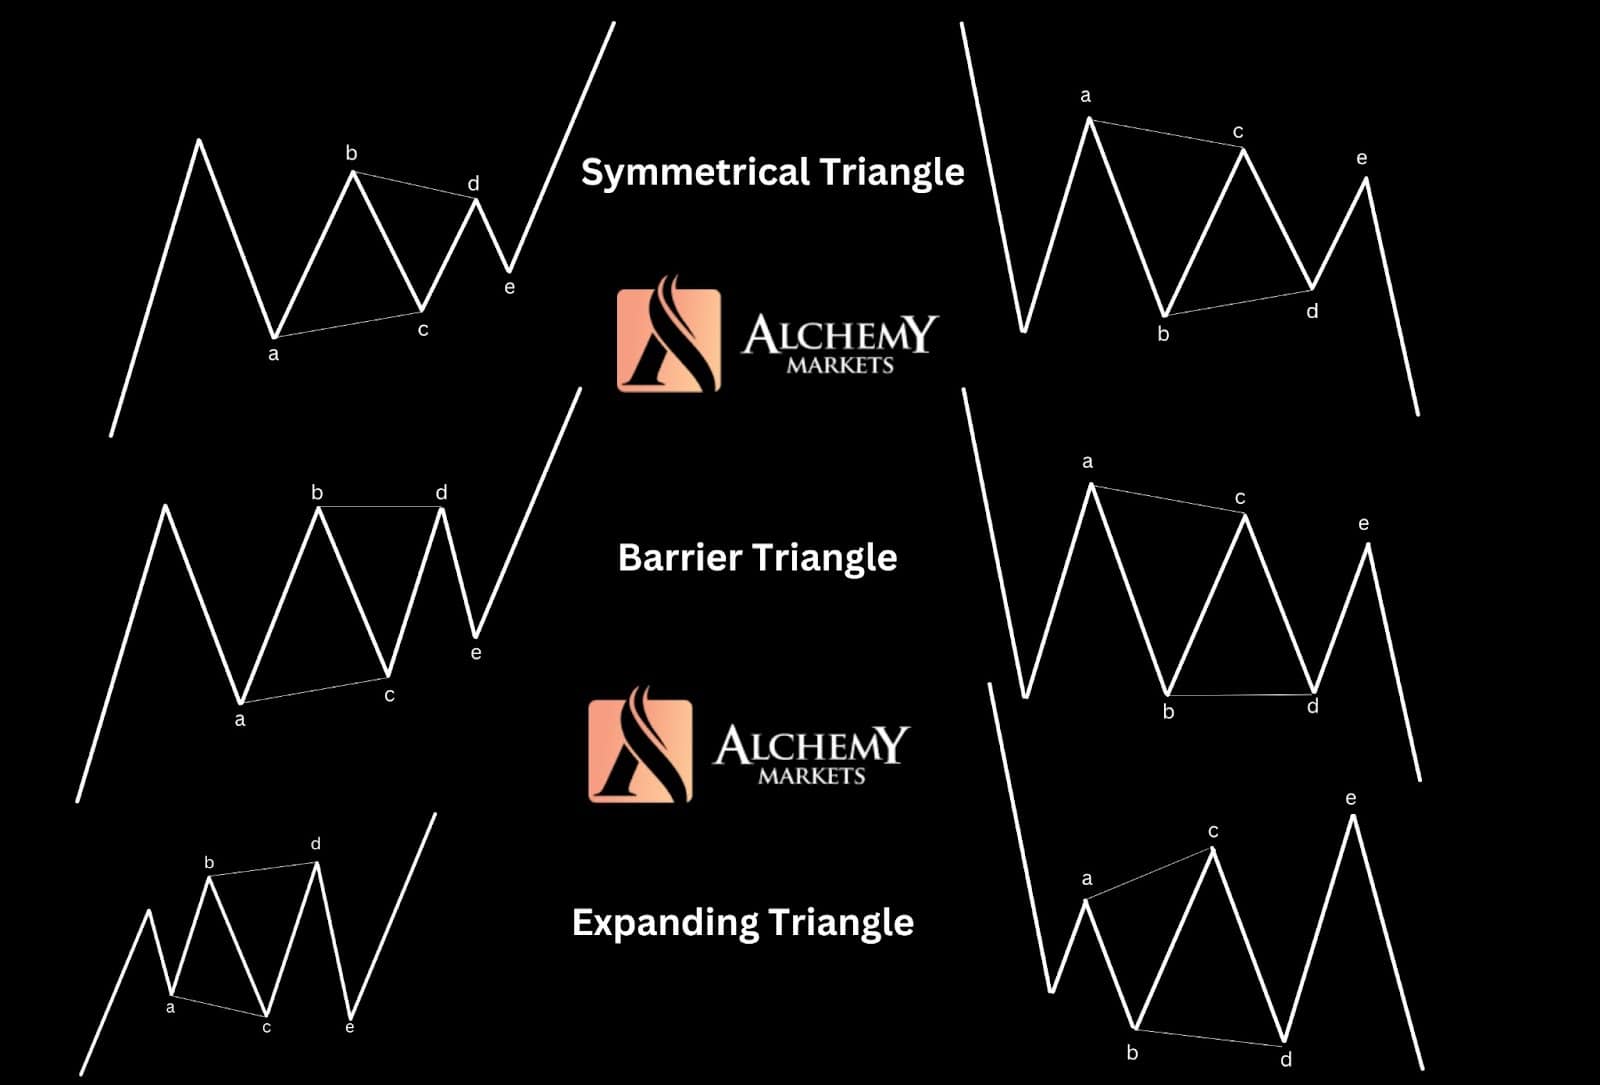
A triangle reflects a balance between buying and selling pressures, resulting in a sideways movement typically marked by decreasing volatility. This pattern comprises five overlapping waves that subdivide in a 3-3-3-3-3 structure, labelled A-B-C-D-E. The triangle’s boundaries are formed by connecting the endpoints of waves A and C and B and D. Notably, Wave E often undershoots or overshoots the A-C line, a common occurrence based on market behaviour.
Triangles are only visible in the final corrective position before a trend’s last push—commonly in Wave 4 of an impulse, Wave B of a zigzag, or Wave X of a double or triple pattern. They do not occur in Wave 2.
As each wave contracts, the triangle builds pressure that often leads to a strong breakout, or “thrust,” in the direction of the trend.
Entry and Exit Points for Triangle Patterns
Traders typically enter a triangle trade at the break of Wave D, with stops set just beyond Wave E for risk management. Once the triangle breaks, the price is expected to thrust in the trend’s direction. A common target for this thrust is calculated by measuring the widest part of the triangle (the base) and projecting that distance from the breakout point, giving traders a reliable profit target.
Symmetrical Triangles
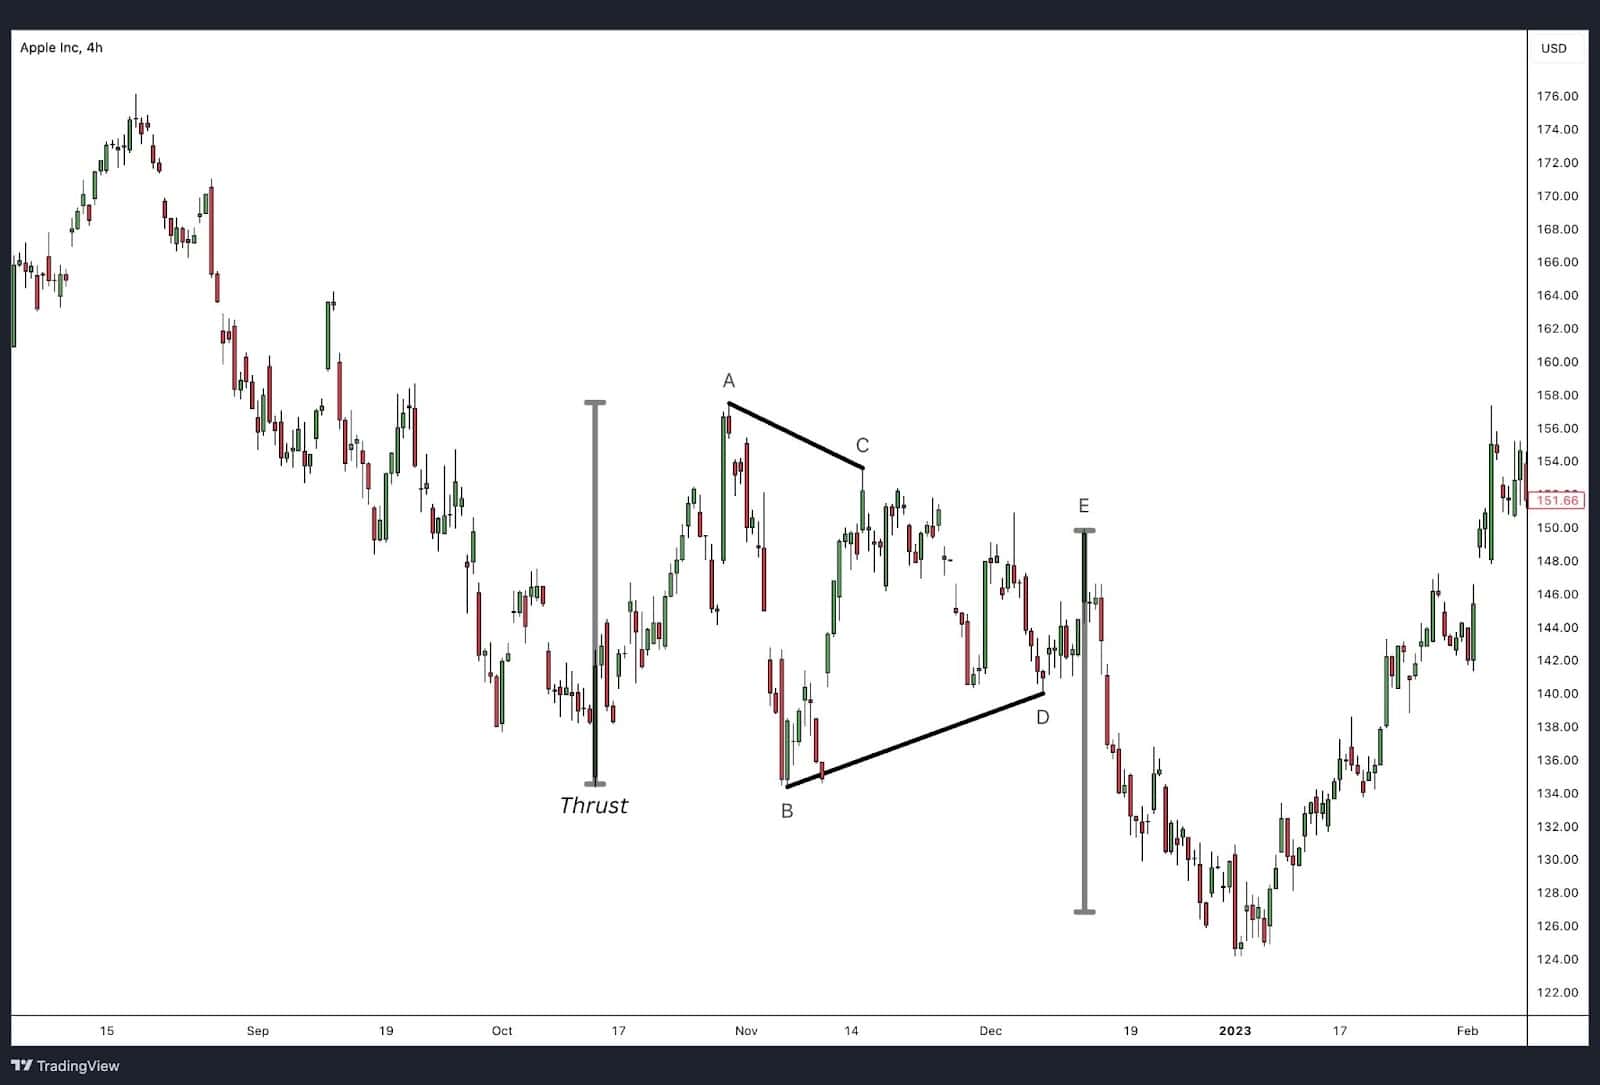
A symmetrical triangle is the most balanced type of triangle, where each leg (A, B, C, D, and E) converges towards a central point, creating roughly equal slopes for both the upper and lower boundaries. Symmetrical triangles indicate equilibrium in the market as buying and selling pressures balance out before the breakout.
Ascending Triangles
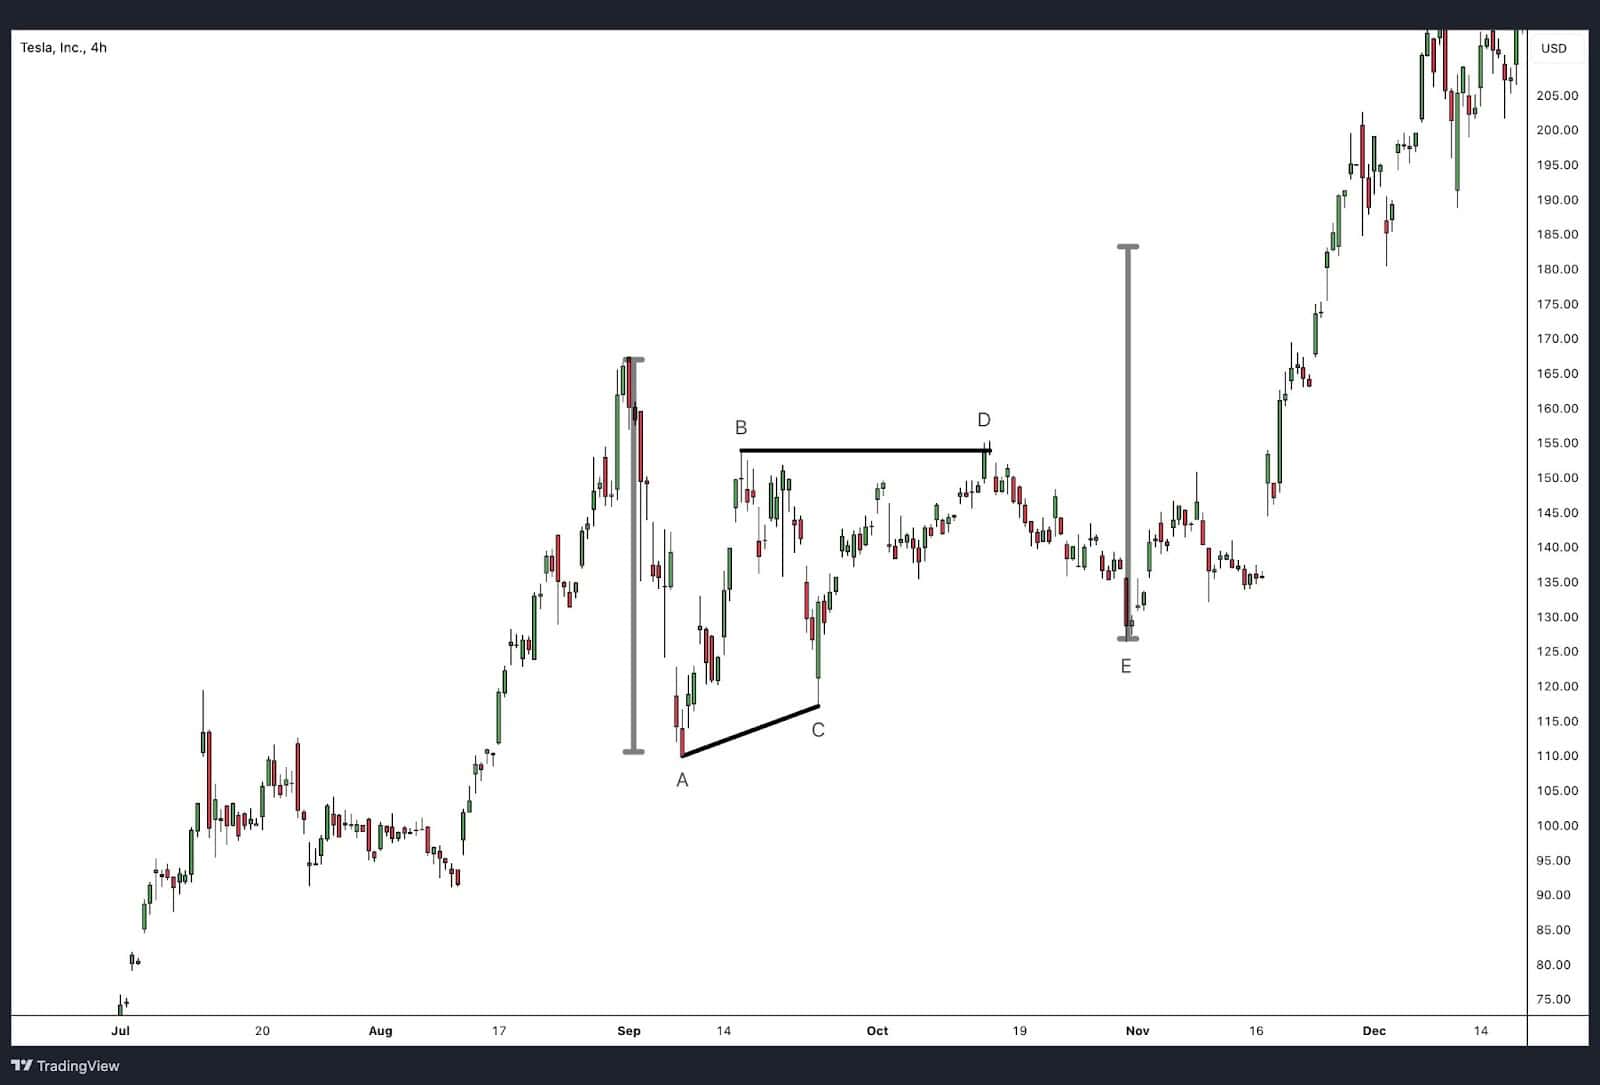
An ascending triangle (Bullish Barrier) has a flat upper boundary with a rising lower boundary, showing that buyers are gradually gaining strength, pushing prices higher while sellers hold a specific resistance level. Ascending triangles are generally considered bullish as the lower boundary progressively slopes higher.
Descending Triangles
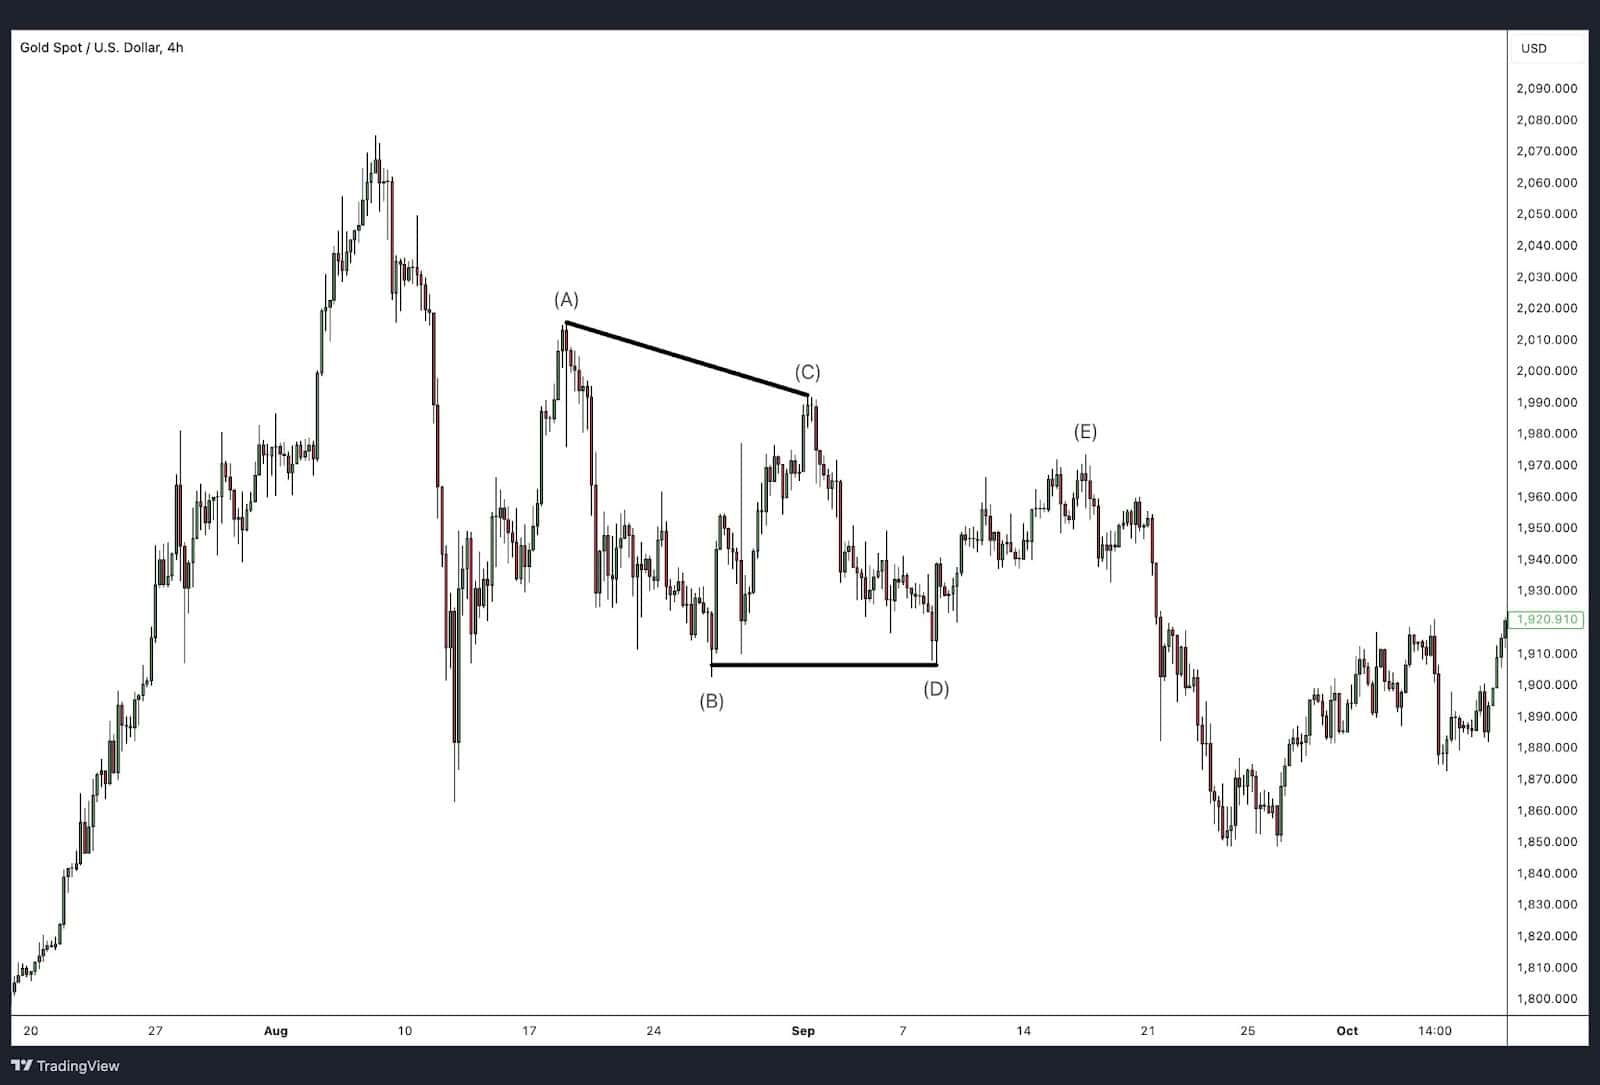
A descending triangle (Bearish Barrier) is characterised by a flat lower boundary with a descending upper boundary, showing that sellers are gaining strength while buyers hold a specific support level. Descending triangles are considered bearish patterns due to a downward sloping resistance trendline within the pattern.
Running Triangle
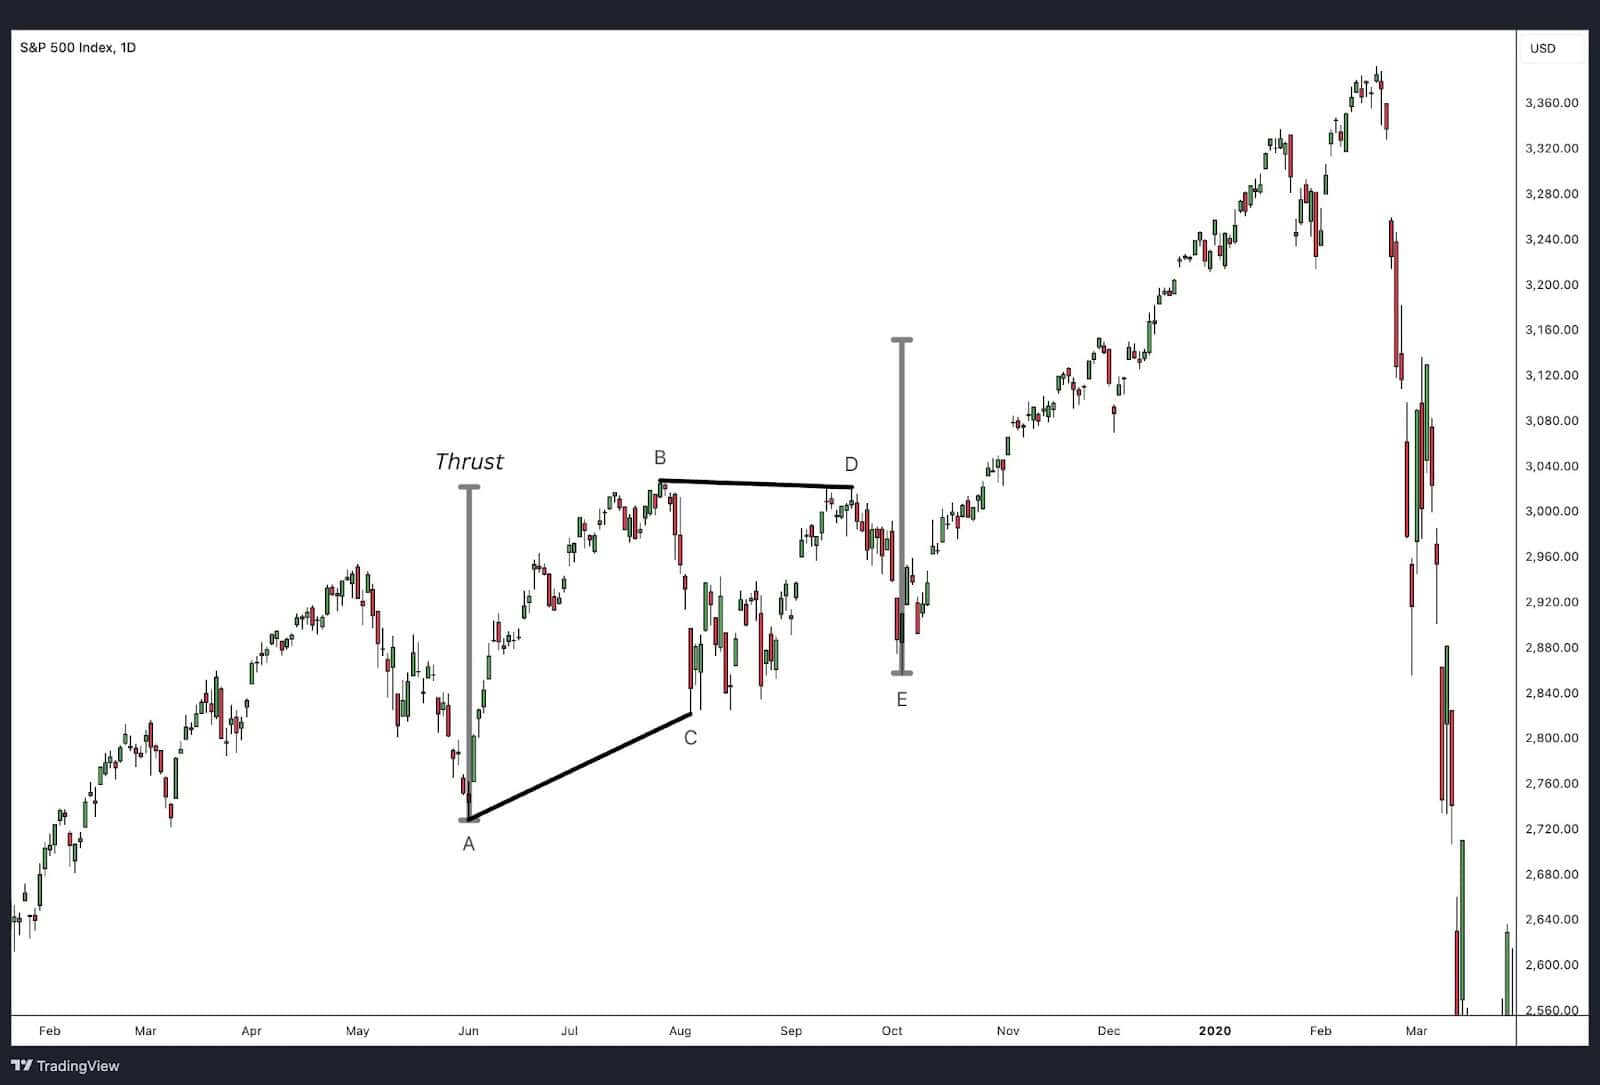
A running triangle is a unique formation where Wave B extends beyond the starting point of Wave A, but the remaining waves do not exceed their respective boundaries. This pattern indicates that the trend is especially strong and likely to continue.
Expanding or Reverse Symmetrical Triangles
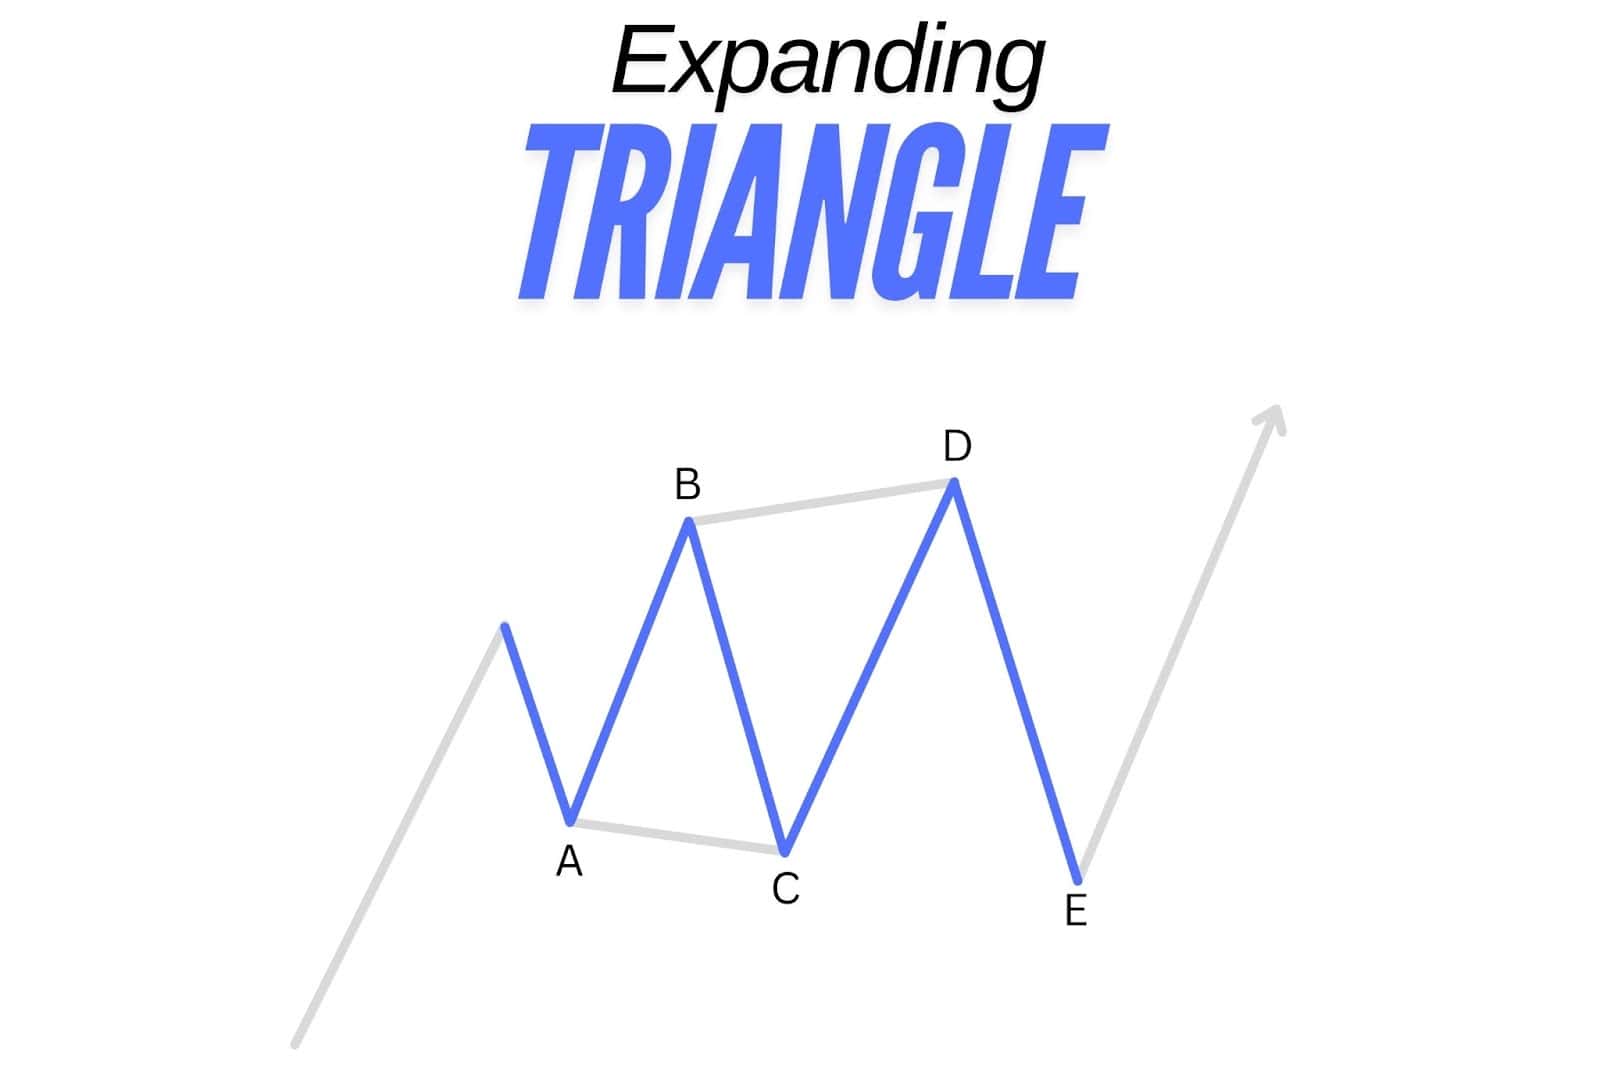
An expanding triangle (or reverse symmetrical triangle) forms with diverging boundaries, where each wave is larger than the last, creating a broadening formation. This pattern reflects extreme volatility and uncertainty, typically leading to a sharp breakout once the pattern completes.
Expanding triangles are rare and difficult to spot in real time. Breakouts from expanding triangles are often forceful, and measuring the widest point of the triangle for the thrust target can give an idea of the potential breakout range.
Complex Corrective Waves
Double Three
Elliott referred to a sideways combination of two corrective patterns as a “double three” and three patterns as a “triple three.” While a single “three” can be any zigzag or flat, a triangle can also serve as the final component in these combinations, and is referred to as a “three” in this context (even though it has five subwaves).
A combination consists of simpler corrections—such as zigzags, flats, and triangles—working together to extend sideways action, especially in flat corrections. The individual components in these patterns are labelled W, Y, and Z, while each intervening wave, labelled X, is typically a zigzag but can take the form of any corrective pattern. Similar to multiple zigzags, combinations are limited to three patterns, with double threes being far more common than triple threes. Elliott sometimes used different labels for these combinations, but they often alternate in form—for example, a flat followed by a zigzag is a typical double three structure.
Flat and a Zigzag
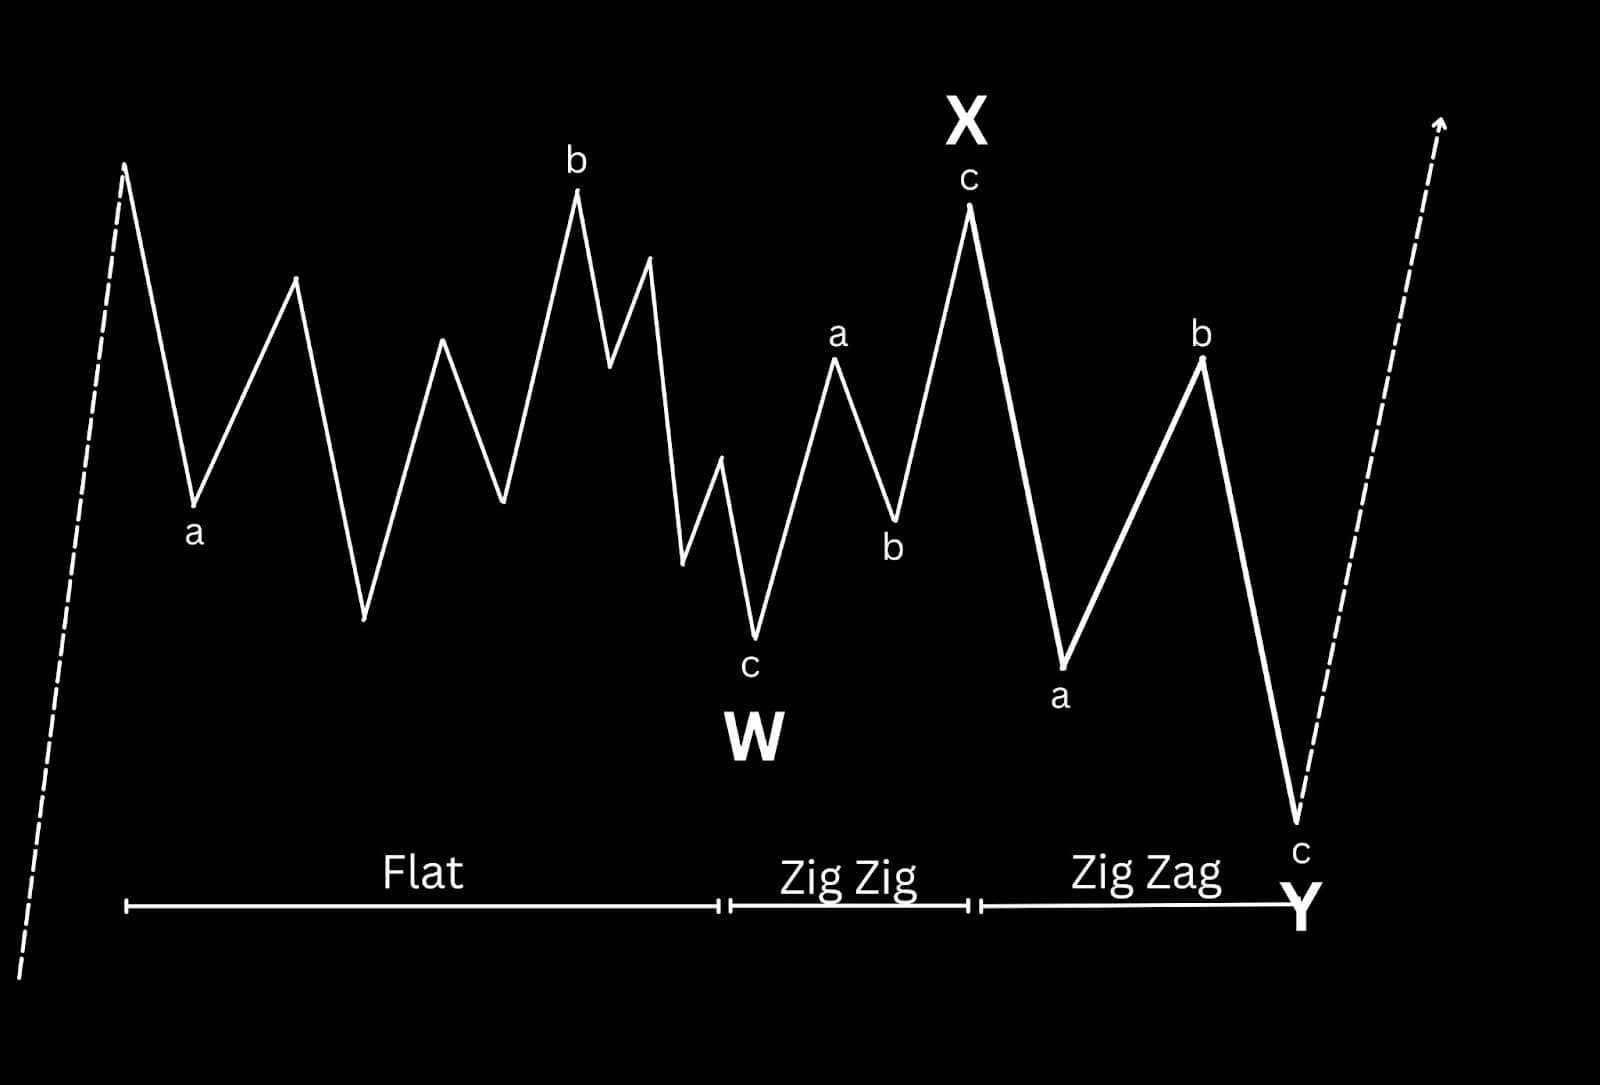
A flat followed by a zigzag is a frequent structure in complex corrective combinations, particularly in sideways markets. This combination generally maintains a horizontal formation, countering the main trend without significant directional movement. While theoretically, such formations could tilt against the trend, this is uncommon in practice. Typically, only one zigzag appears in these combinations, as multiple zigzags would shift the pattern away from its characteristic sideways correction.
Flat and a Triangle
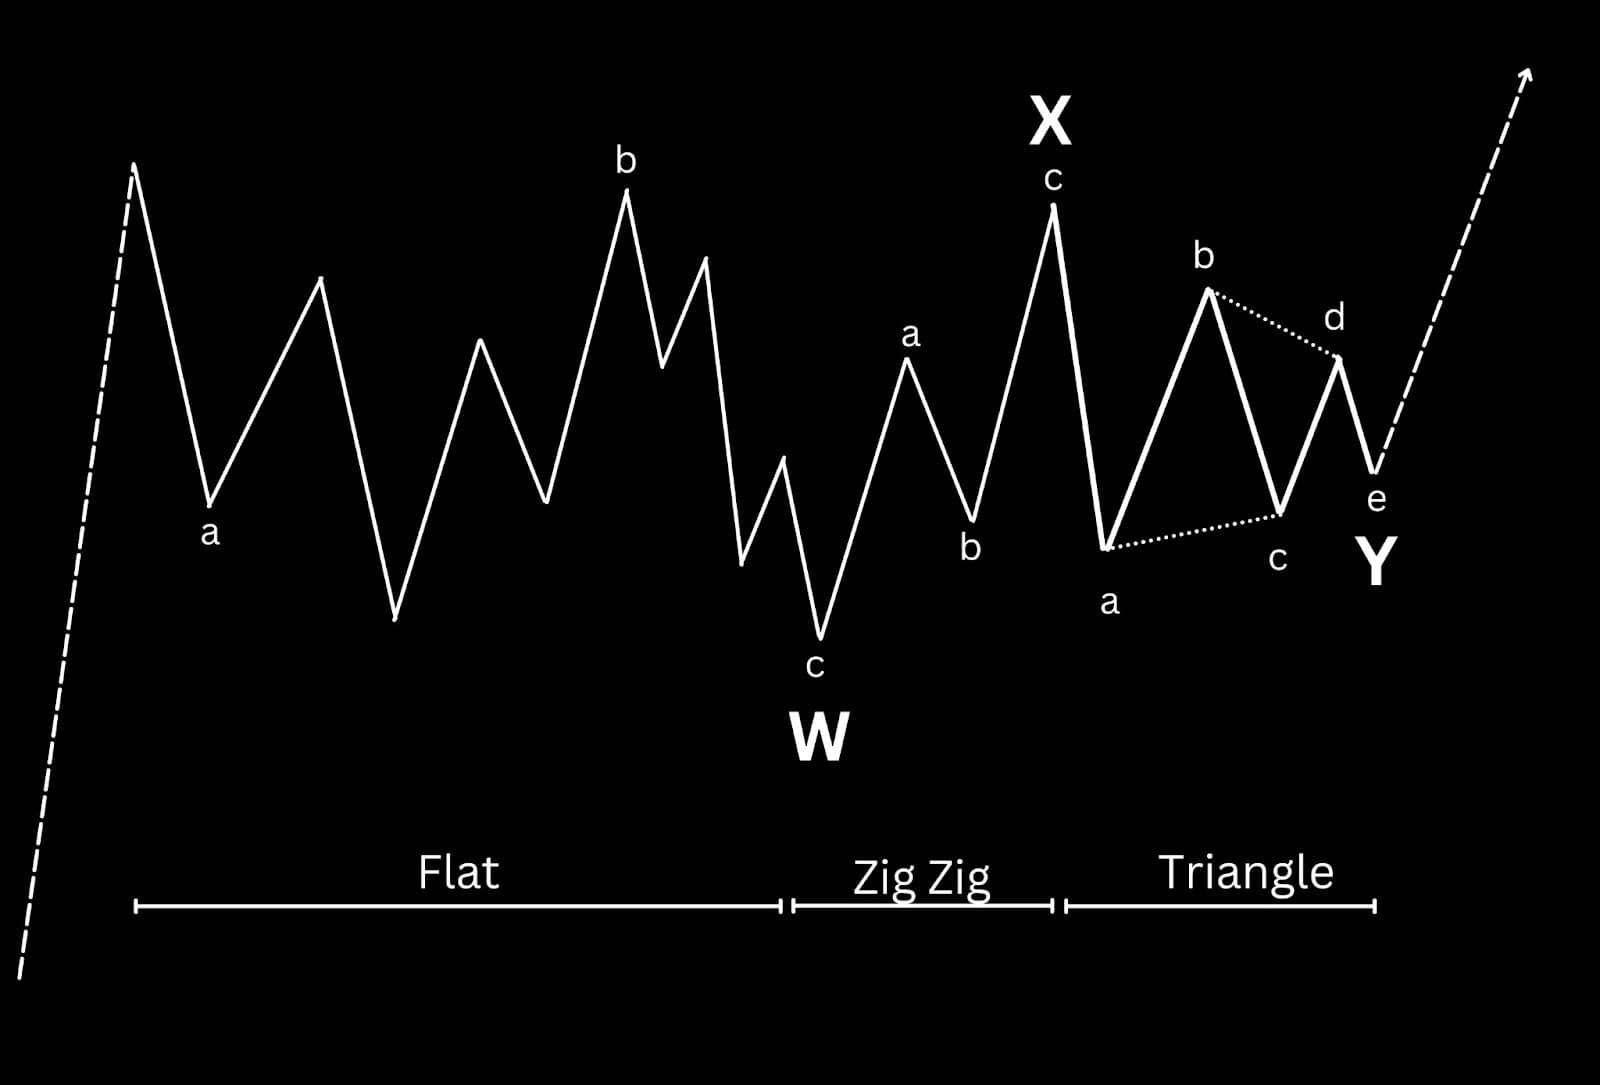
A combination featuring a flat followed by a triangle is another potential structure within complex corrective patterns. In this arrangement, the flat pattern initiates a sideways correction, and the triangle completes it, signalling the final phase before the trend resumes. This combination typically appears as a horizontal structure, consolidating within a limited range rather than advancing in any particular direction. Importantly, the triangle’s placement as the concluding wave aligns with its function of marking the end of a corrective sequence, reinforcing that the next movement is likely to be an impulse in the direction of the primary trend.
Double Threes of Lesser Degree
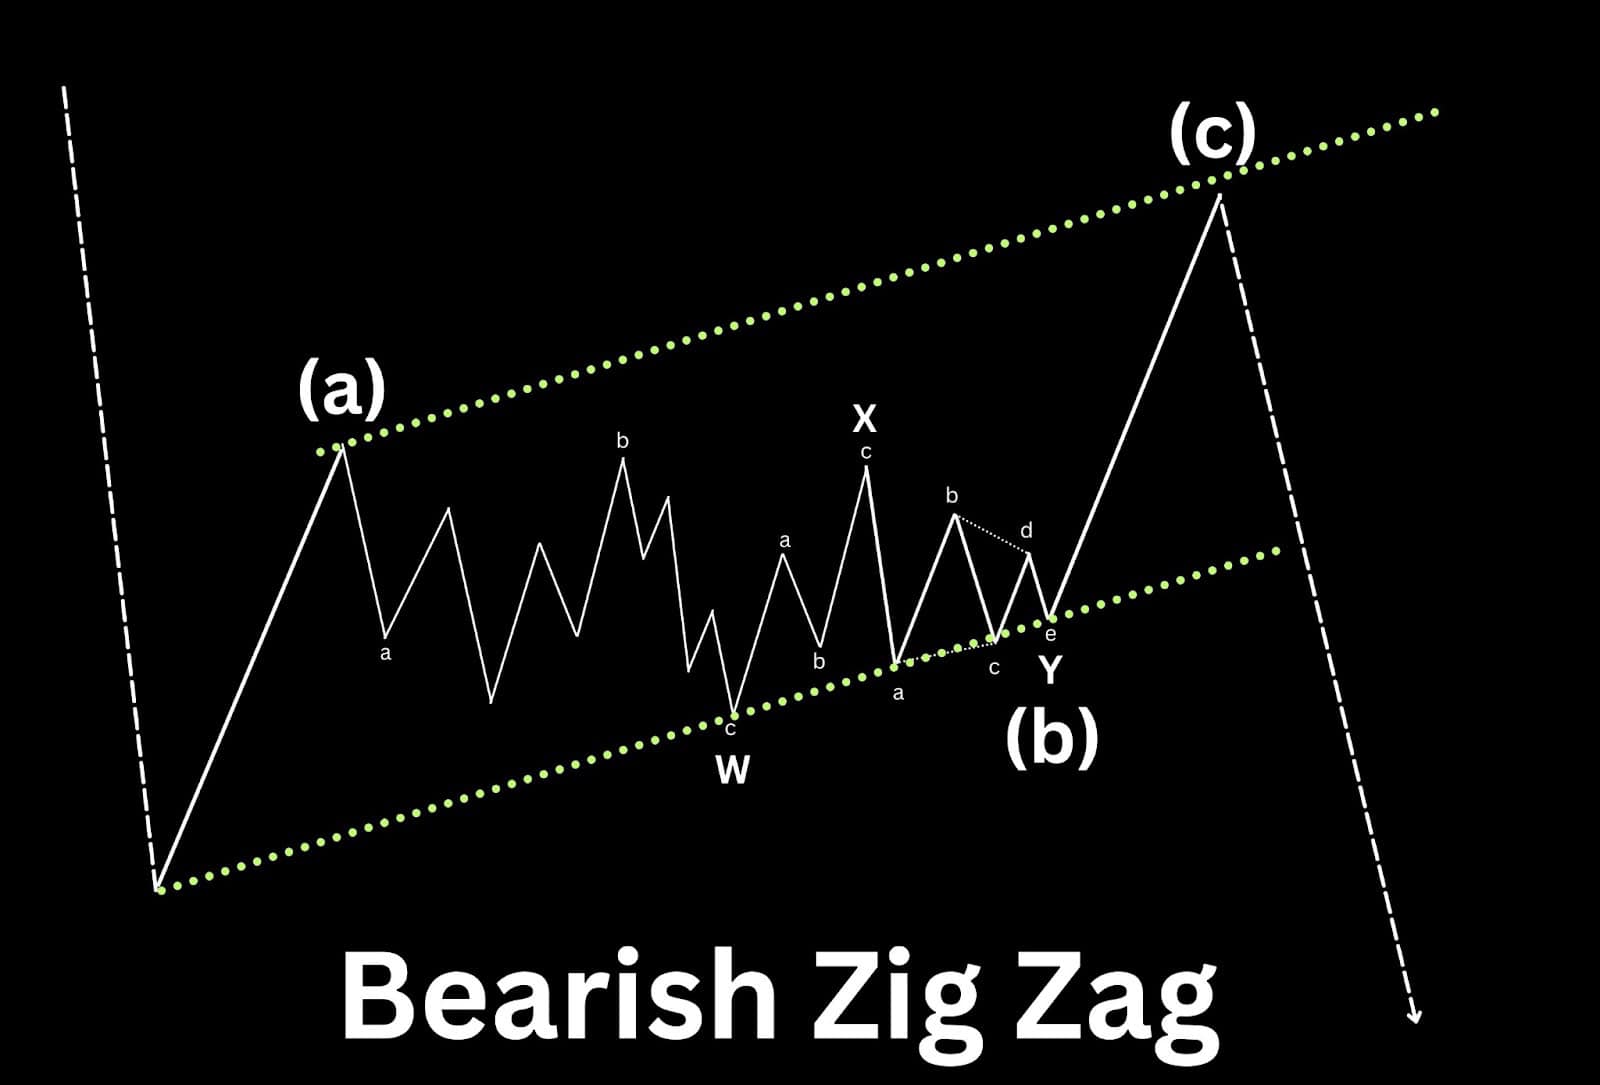
The term “Double Threes of Lesser Degree” refers to an advanced corrective structure where double three patterns—each a combination of two corrective formations, such as zigzags, flats, or triangles—appear at a smaller degree within a larger corrective wave structure. This setup involves double threes embedded within a broader wave, resulting in a layered, multi-part corrective pattern.
Within corrective patterns, Wave A or Wave B for flat and Wave B zigzag can sometimes take the shape of a double three pattern, adding further depth to the corrective phase. Here are two examples:
- In a flat pattern, Wave B could unfold as a double three, combining two smaller corrective formations, such as a zigzag followed by another flat or triangle. This expanded Wave B extends the sideways action, adding complexity before the final leg of the flat pattern completes.
- Similarly, within a zigzag pattern, Wave B may also develop as a double three, bringing additional sideways movement before the final Wave C completes the zigzag.
Flat, Double Three, and Zigzag
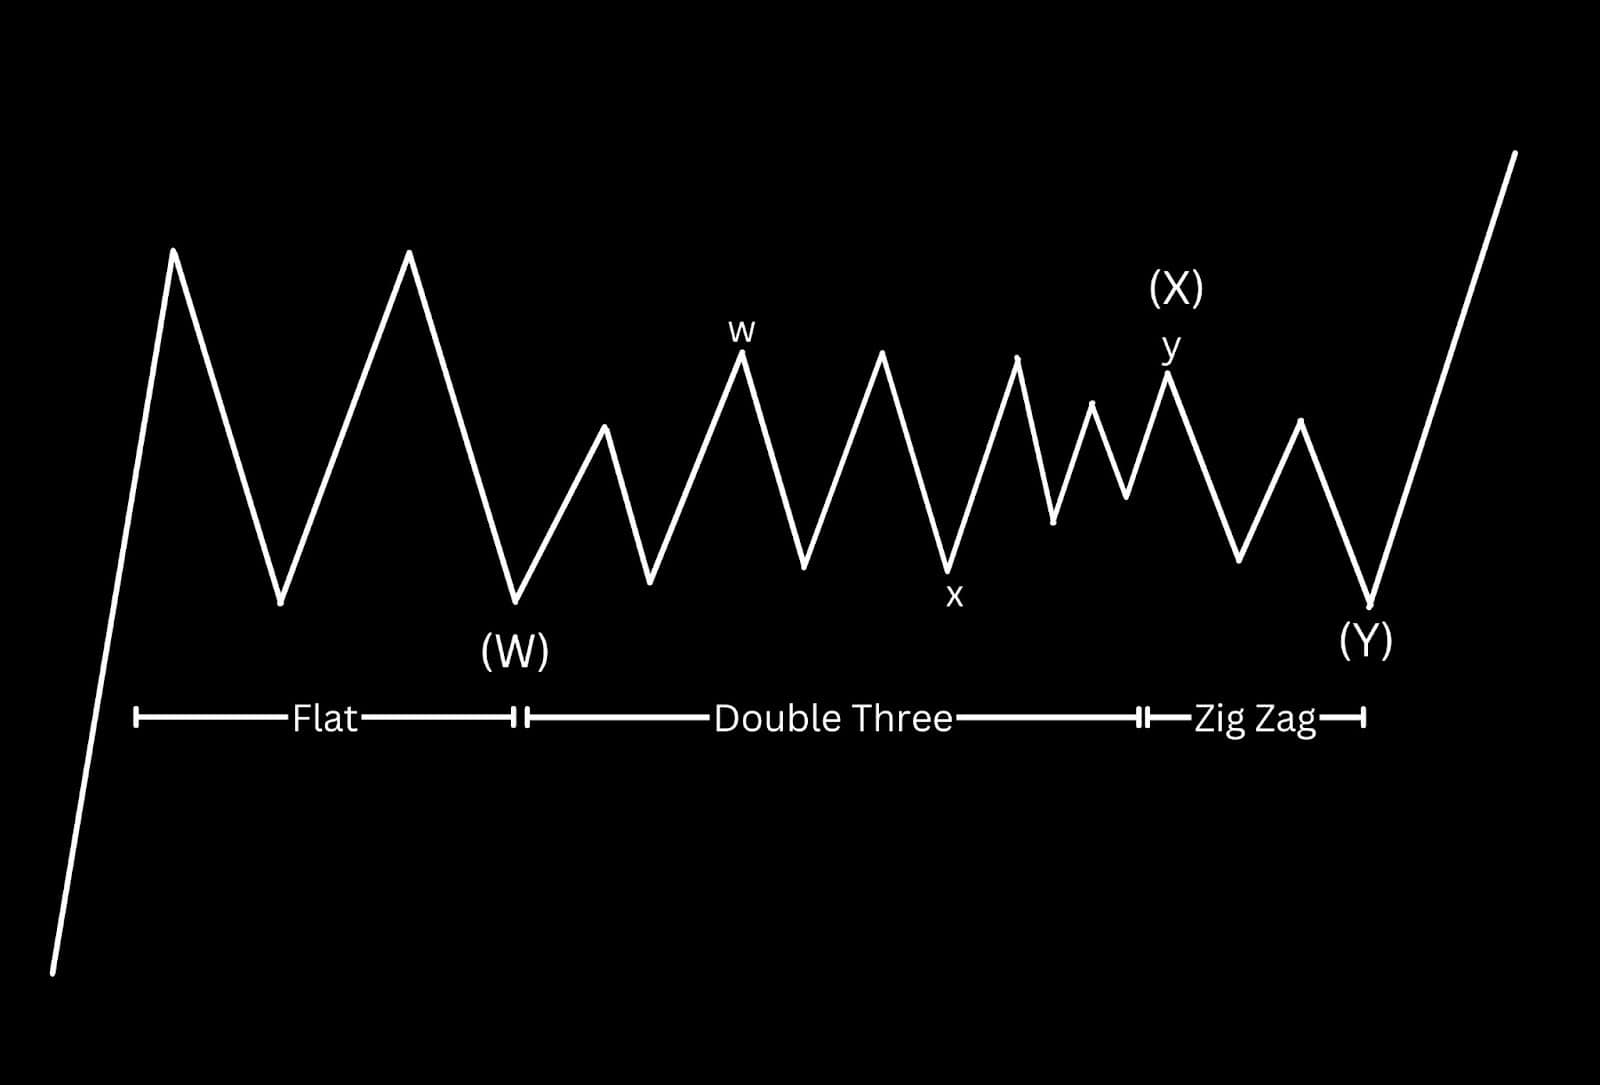
A flat, double three, and zigzag is another example of a double three at lesser degree. Here the flat would be wave W, the double three is wave X, and a zigzag for wave Y. Within a mix of corrective structures, the wave X can be a double three pattern as it simply is a bridge between waves W and Y.
These double threes within a larger corrective wave add further intricacy to the correction, often prolonging its duration without causing a significant shift in price direction. This added complexity indicates a more drawn-out consolidation phase, which can affect the timing and analysis of potential breakouts.
Fibonacci Ratio Relationship
In complex corrections like double threes, Fibonacci relationships act more as guidelines than strict rules due to the flexibility and variable structure of these patterns. The most common relationship observed within double threes is based on equality between corrective components, which helps in estimating target levels for each segment of the pattern.
Here are the primary Fibonacci-based guidelines for double threes:
- Wave Y often equals the length of Wave W, adhering to a 1:1 ratio. This equality provides a balanced structure, with Wave Y ideally reaching or slightly exceeding the endpoint of Wave W.
- Connecting Wave X typically does not follow a strict Fibonacci ratio, as it serves as a transitional phase between W and Y. However, it frequently retraces around 50% to 61.8% of Wave W, helping to gauge the potential size of the following corrective segment.
- In rare cases where a double three includes triangles or flats, the final wave (often a triangle if present) may also align with equality relative to the preceding segment, maintaining a proportionate structure across the correction.
Triple Three
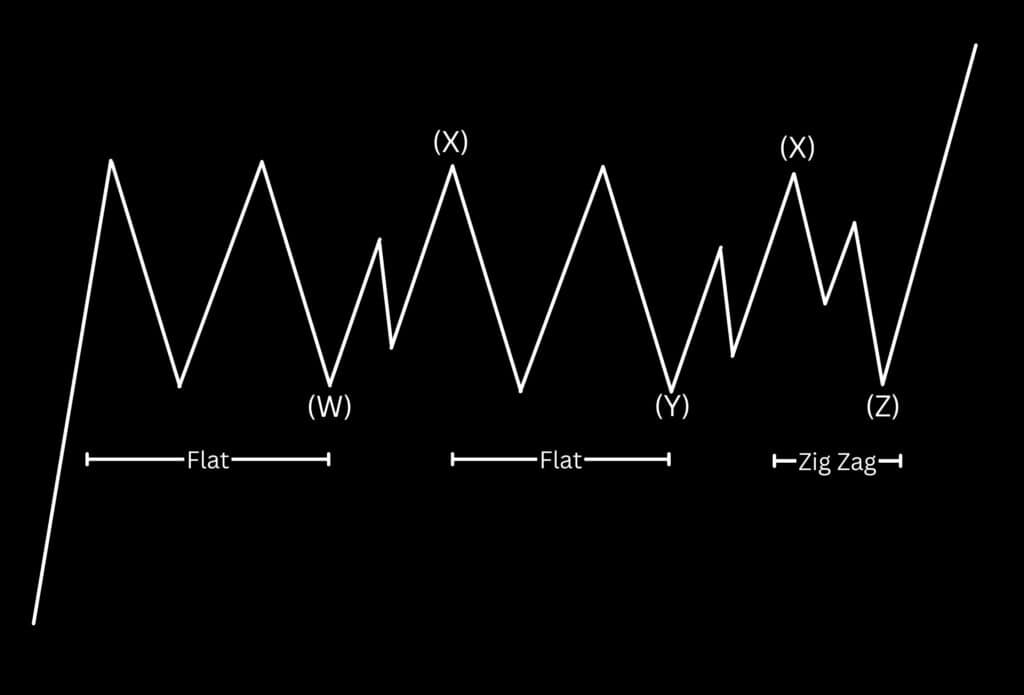
In Elliott Wave Theory, a triple three is an extended complex corrective pattern made up of three simpler corrective structures, connected by two X waves. This pattern combines three distinct corrective waves, such as zigzags, flats, or triangles, within a single larger correction, creating a highly intricate sideways movement. The triple three is less common than the double three, appearing in markets that require a prolonged period of consolidation before the trend resumes.
Each corrective wave within a triple three is labelled as W-X-Y-X-Z, where W, Y, and Z are the corrective components, and X waves connect them. This structure allows for more extensive sideways price action, which can take on various forms, such as a flat followed by another flat, then a final zigzag. While rare, triple threes can appear in larger-degree corrective waves, adding significant time and complexity to the consolidation.
Fibonacci Ratio Relationship
In triple threes, Fibonacci relationships serve primarily as loose guidelines rather than strict rules, due to the inherent complexity and flexibility of these patterns. However, equality between components can still provide insights into the correction’s overall structure:
- Wave Y commonly matches the length of Wave W at a 1:1 ratio, creating a balanced progression from the first to the second corrective segment.
- Wave Z may also tend towards a 1:1 ratio with Wave Y, particularly if Wave Z takes the form of a zigzag or flat.
- Each X wave can retrace approximately 50% to 61.8% of the preceding corrective wave, helping define the boundaries of each transition.
These Fibonacci relationships offer general targets within the structure, supporting traders in identifying key levels within the correction’s progression. However, the triple three’s complexity means Fibonacci guidelines are more approximate and less reliable than in simpler corrective patterns.
Waves Personality – Step by Step Recognition and Confirmation
Each wave in Elliott Wave Theory has distinct characteristics or “personalities” that give clues about the current stage of the trend and market sentiment. Recognising these personalities step by step helps traders confirm the wave count and gauge the trend’s strength, volatility, and potential turning points. Let’s explore the unique characteristics of each wave.
Example 1 – Uptrend
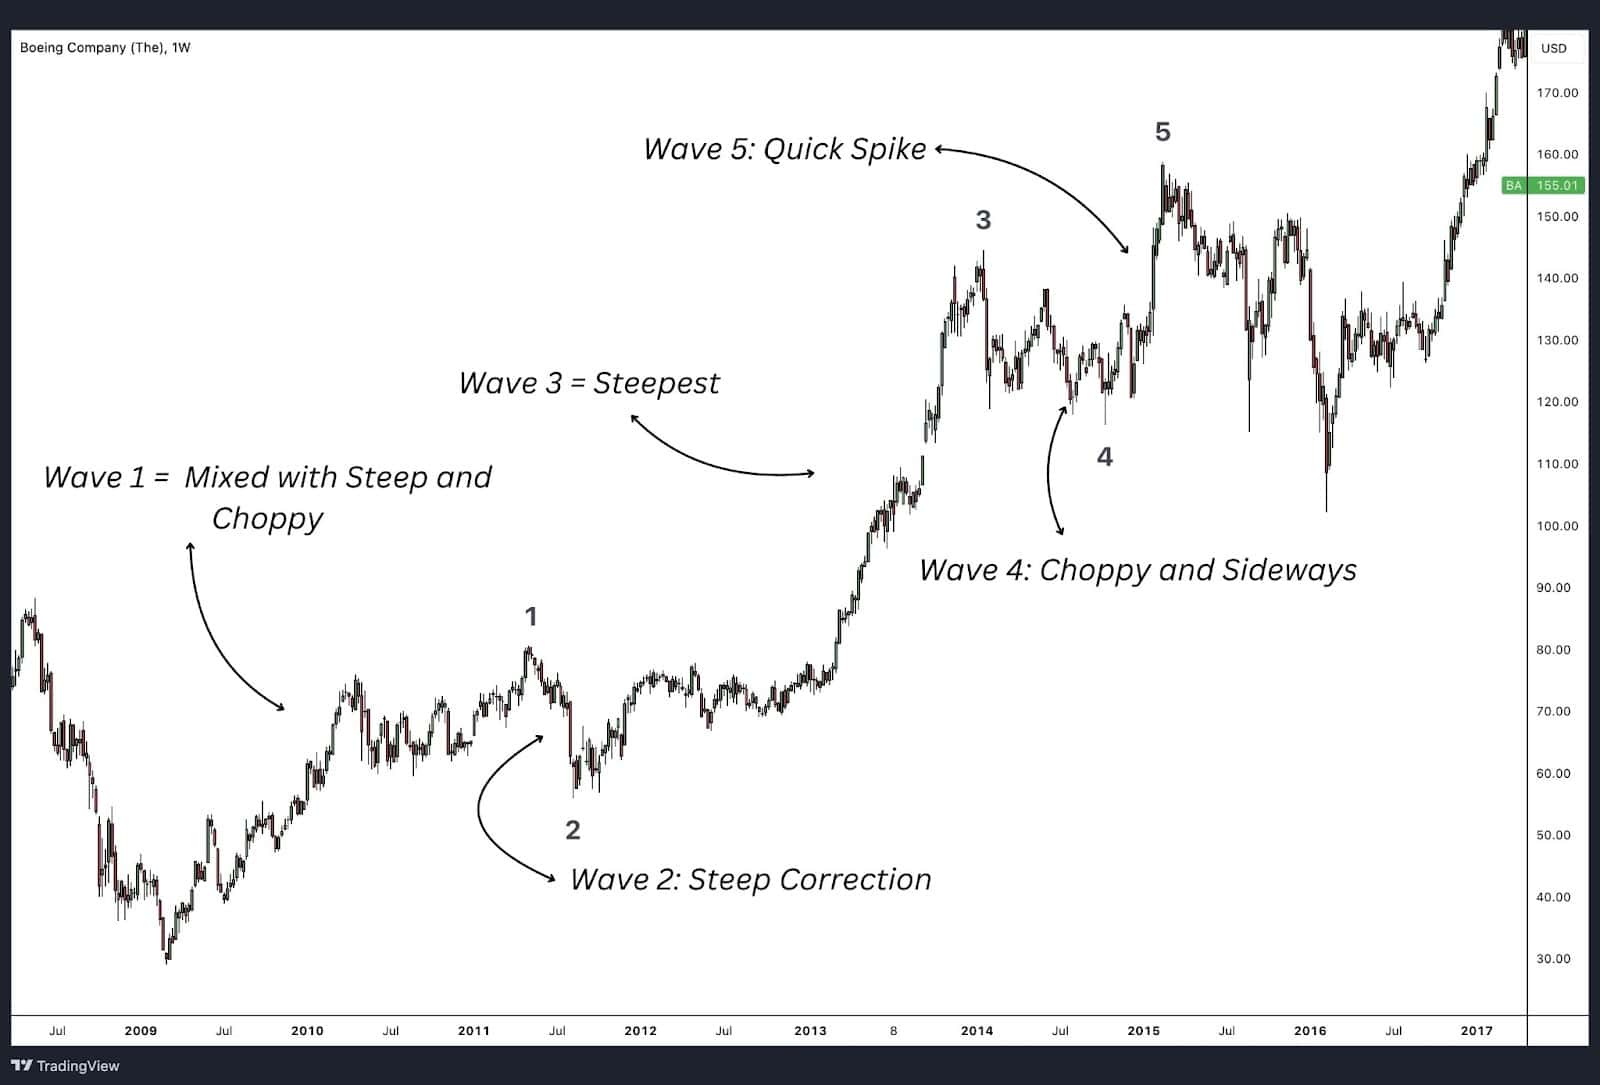
- Wave 1: Begins with a mix of steep and choppy movement. This represents the initial breakout, but market participants are still cautious, leading to a mix of strong moves and pullbacks as the trend starts to take shape.
- Wave 2: Experiences a steep correction, retracing a significant portion of Wave 1 as early profit-taking occurs. This correction does not go below the starting point of Wave 1, maintaining the integrity of the new trend.
- Wave 3: Typically the steepest and most powerful wave in the impulse wave pattern. The trend gains strong momentum here as more traders recognize it, resulting in a steady, sharp climb without major pullbacks. This is often the most profitable part of the trend.
- Wave 4: Develops in a choppy, sideways manner, indicating consolidation after the powerful Wave 3. This wave is less volatile and often appears as a flat or triangle pattern, reflecting a pause in the trend before the final push.
- Wave 5: Ends with a quick spike upwards, as the final leg of the trend exhausts itself. The movement is sharp but short-lived, signalling that the trend is near completion and a correction or reversal is likely to follow.
Example 2 – Downtrend
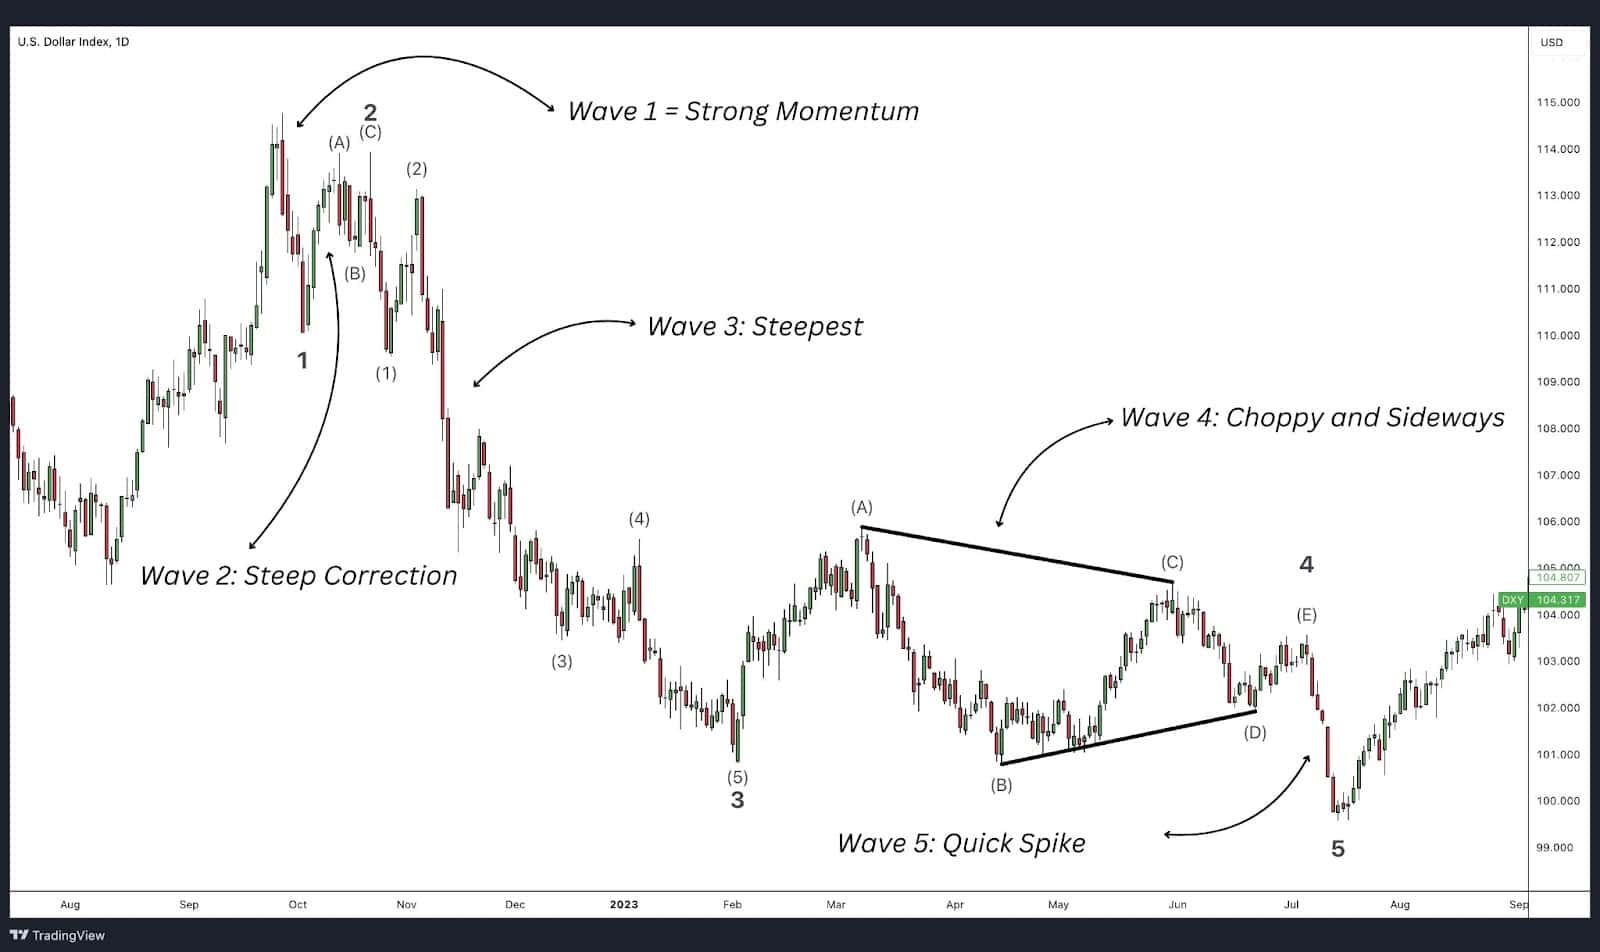
- Wave 1: Kicks off with strong momentum, indicating the start of a new trend as early participants enter the market in the new trend’s direction.
- Wave 2: Experiences a steep correction as initial skeptics take profits, testing but not surpassing the start of Wave 1.
- Wave 3: Shows the steepest and most powerful trend in the sequence, driven by broad market participation as the trend gains recognition.
- Wave 4: Moves in a choppy, sideways manner, often forming a triangle, as the trend pauses for consolidation before the final leg.
- Wave 5: Ends with a quick spike, marking trend exhaustion as the last of the trend fades, setting up for the corrective phase.
Wave 1
Wave 1 marks the beginning of a new trend but often lacks widespread recognition. Market sentiment is tentative, with participants unsure whether a new trend has truly started. Due to this uncertainty, Wave 1 can appear choppy or erratic in volatile markets as it builds momentum, or it can show strong momentum if driven by a catalyst.
- Personality: Choppy or steep, especially in its early stages, as only a small segment of the market recognises the trend.
- Confirmation: Wave 1 is confirmed once a clear reversal from the prior trend is evident, though the market remains cautious.
Wave 2
Wave 2 is usually a sharp correction, as the market tests the new trend established by Wave 1. Many participants remain sceptical, thinking the prior trend will resume, which results in a strong pullback.
- Personality: Steep retracement of Wave 1, often returning 50-61.8% of the first wave.
- Confirmation: Wave 2 cannot exceed the start of Wave 1; if it does, then Wave 1 is invalidated as the start of a new trend.
Wave 3
Wave 3 is usually the most powerful and steepest of the impulsive waves, as the trend gains widespread recognition and market participants rush in. This wave typically shows the strongest momentum of the entire impulse sequence.
- Personality: Strong, extended, and steep, with high momentum as both retail and institutional investors enter.
- Confirmation: Wave 3 is never the shortest wave and should ideally reach at least 1.618 times the length of Wave 1, providing further confirmation of the trend.
Wave 4
Wave 4 is a corrective phase that moves sideways rather than sharply retracing, as the trend has already been well-established. This wave often represents profit-taking, with fewer market participants reversing direction.
- Personality: Sideways or ranging, often taking the form of a flat or triangle pattern as the trend temporarily pauses.
- Confirmation: Wave 4 must not overlap with the price range of Wave 1 in a standard impulse; if it does, the pattern is likely incorrect.
Wave 5
Wave 5 is often characterised by reduced momentum, as the trend approaches its exhaustion point. Momentum can decrease, and the movement may appear choppy or accelerate in a quick spike, reflecting the final effort to continue the trend.
- Personality: Either choppy and uneven or a quick thrust, as market interest dwindles and the trend prepares for correction.
- Confirmation: Wave 5 often ends near the peak of Wave 3 or slightly beyond, with momentum indicators showing divergence.
Waves A, B, and C (Corrective Waves)
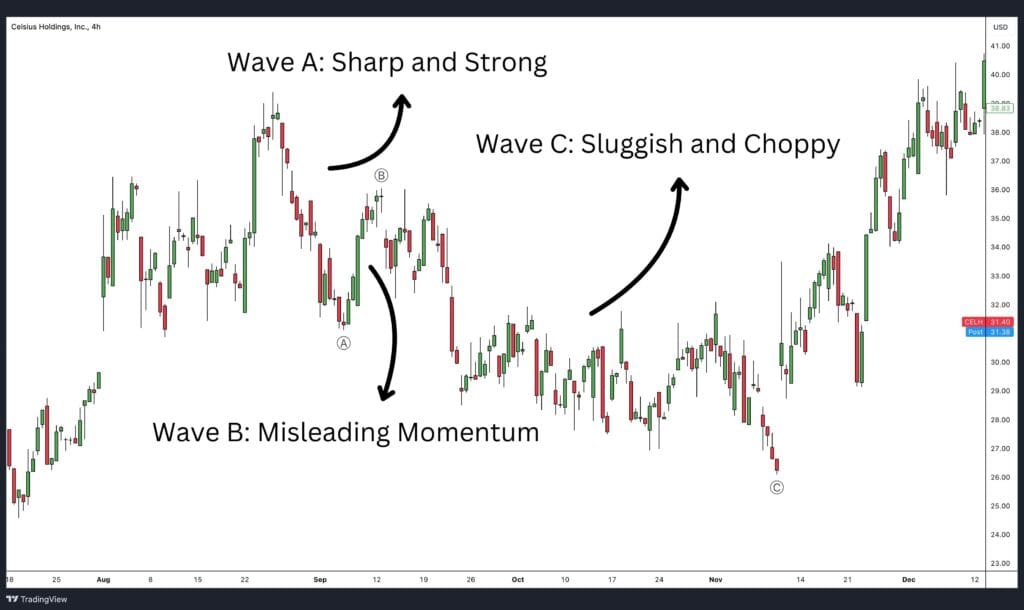
Corrective waves A, B, and C form after the impulse wave and vary in character based on the specific corrective pattern they form. Each wave has a unique personality depending on the type of correction—whether it’s a zigzag, flat, or triangle.
Wave A
Wave A of a correction is often the first sign of a reversal, and it can sometimes be mistaken for a pullback within the impulse. Wave A typically retraces the final impulse wave and can take the form of either five or three subwaves, depending on the larger corrective pattern.
- Personality: The initial counter-trend wave, which is generally sharp if it’s a zigzag or more moderate if it’s part of a flat or triangle.
- Confirmation: This wave shows initial weakness in the trend but isn’t confirmed as a full reversal until further development.
Wave B
Wave B represents a temporary reversal back toward the direction of the prior trend, but it typically lacks momentum. This wave can trap traders who assume the prior main trend will resume, only to see it reverse again with Wave C.
- Personality: Often corrective and misleading, showing momentum back in the direction of the prior trend.
- Types: Can take on various corrective forms, including a zigzag, flat, or triangle.
Wave C
Wave C is the final wave of the corrective structure and usually moves decisively against the preceding trend. In most cases, Wave C is a five-wave impulse, showing strong momentum as it completes the correction.
- Personality: For Zig Zag, it depends on Wave A characteristics, it can be either strong and aggressive or sluggish due to guidelines of alternation.
- Types: Typically takes the form of a five-wave impulse and completes the structure, especially if the correction is a zigzag or flat.
These wave personalities not only aid in recognising each wave within the broader structure but also provide insights into market psychology and trend confirmation at each phase. By understanding the distinct characteristics of each wave, traders can better time entries and exits, managing risk more effectively across different stages of the trend.
Which Elliott Wave is the strongest?
Wave 3 is generally the strongest and most powerful of the Elliott Waves. It often displays the steepest price movement with high momentum, driven by widespread recognition of the trend among both retail and institutional traders. Wave 3 typically extends to at least 1.618 times the length of Wave 1, reflecting strong market confidence and broad participation. This makes Wave 3 the prime wave for trend-following strategies and capturing substantial price gains.
Which Elliott Wave is the weakest?
Wave B is considered the weakest. It is usually a sloppy, overlapping structure that represents a partial retracement of Wave A. If Wave B does create a temporary price extreme, as can be found in flat corrections or triangles, it is often short-lived and quickly retraced. As a result, Wave B is not considered a strong tradeable opportunity and is better viewed as part of the broader corrective structure leading into Wave C.
What Are the Elliott Wave Theory Rules and Guidelines?
In Elliott Wave Theory, certain rules help identify, confirm, and provide wave structure clarity. Guidelines, on the other hand, provide additional context for interpreting the patterns accurately. Here are the main rules, followed by an in-depth look at some key guidelines.
Core Rules of Elliott Wave Theory
- Wave 2 cannot retrace more than 100% of Wave 1.
- Wave 3 cannot be the shortest wave in relation to waves 1, 3, and 5 of a motive wave sequence.
- Wave 4 cannot overlap the price territory of Wave 1 (except in diagonal patterns).
These rules must be followed for a wave structure to be classified as impulsive waves. Now, let’s explore the essential guidelines in Elliott Wave Theory.
Wave 2 Cannot Retrace More Than 100% of Wave 1
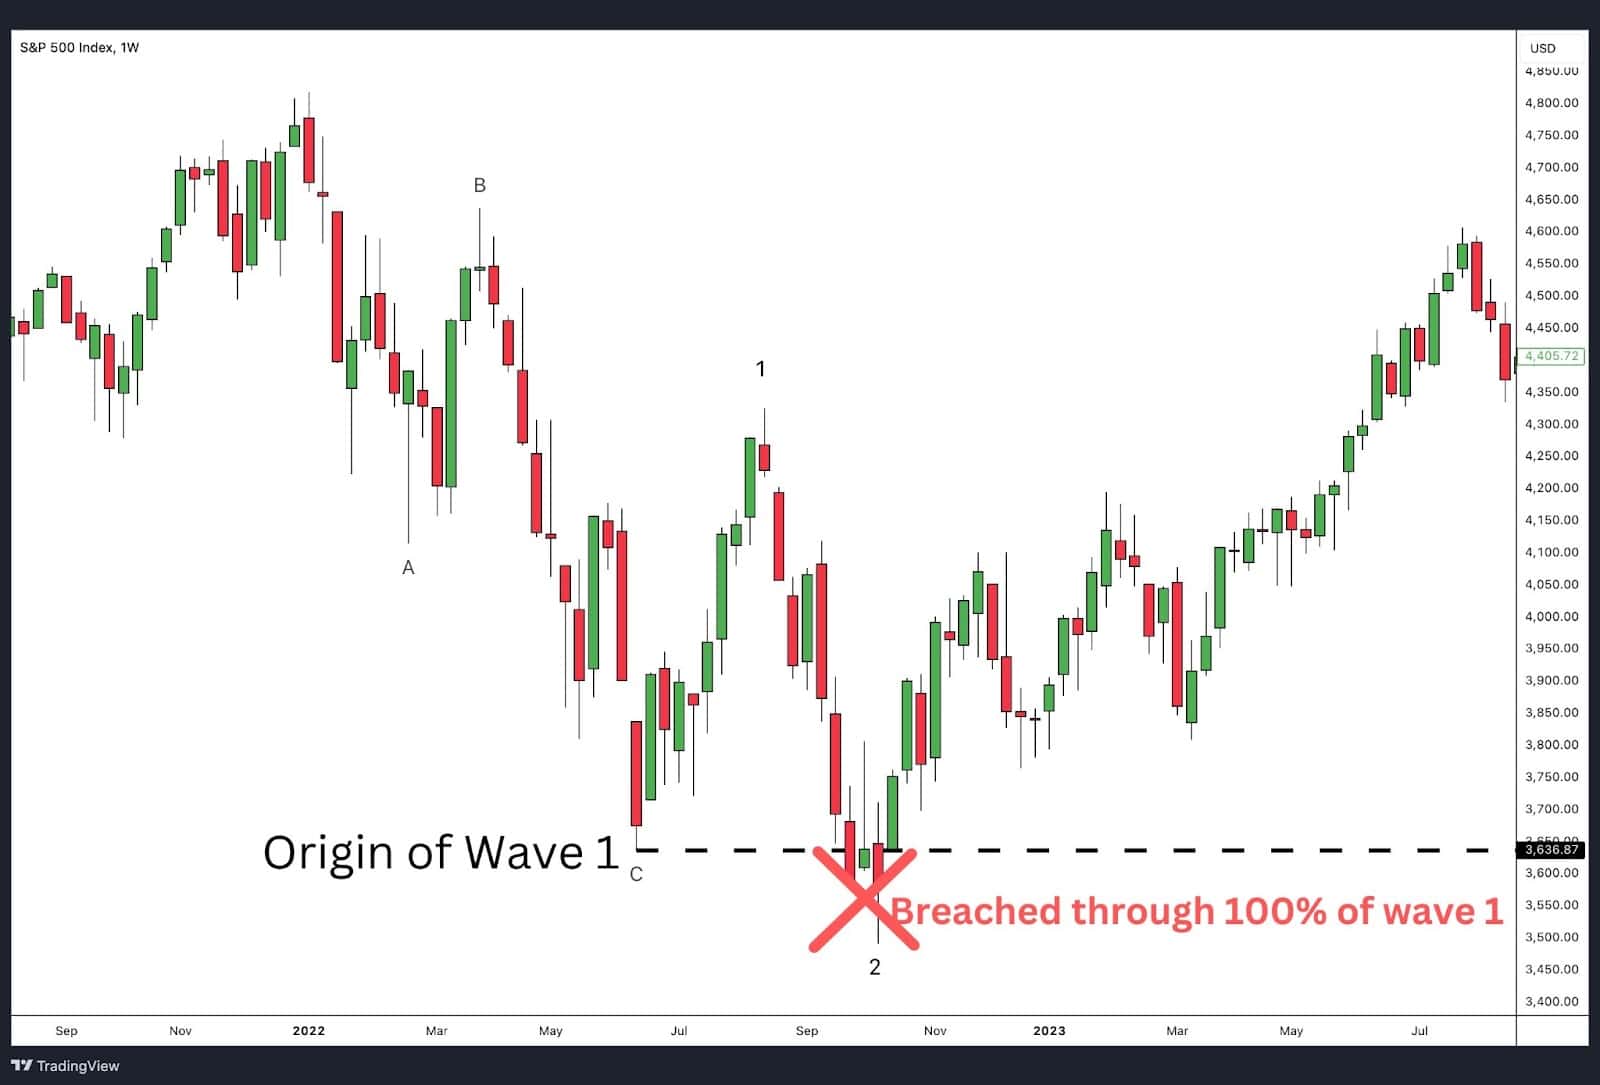
Reason for the Rule:
Wave 2 is a corrective wave that follows the first impulse wave pattern (Wave 1). Its role is to “correct” the initial price movement but still stay within the larger trend’s direction. If Wave 2 retraces more than 100% of Wave 1, it means that the price has returned to or below the starting point of Wave 1, which would essentially erase the progress made by the initial upward or downward move.
This would invalidate the idea of a new trend, as the market would have completely negated the impulse, indicating that Wave 1 was likely not the start of a new trend but rather a part of a corrective or sideways movement.
Why It Invalidates the Impulse Wave:
A retracement beyond 100% of Wave 1 suggests the market is not trending but moving in the opposite direction, likely signalling that what was perceived as the start of a trend (Wave 1) was actually part of a larger corrective phase. An impulse wave is meant to show progress in the direction of the overall trend, and a full retracement signals the absence of such progress, breaking the structure of the impulse.
Wave 3 Cannot Be The Shortest Wave Among Waves 1, 3 and 5
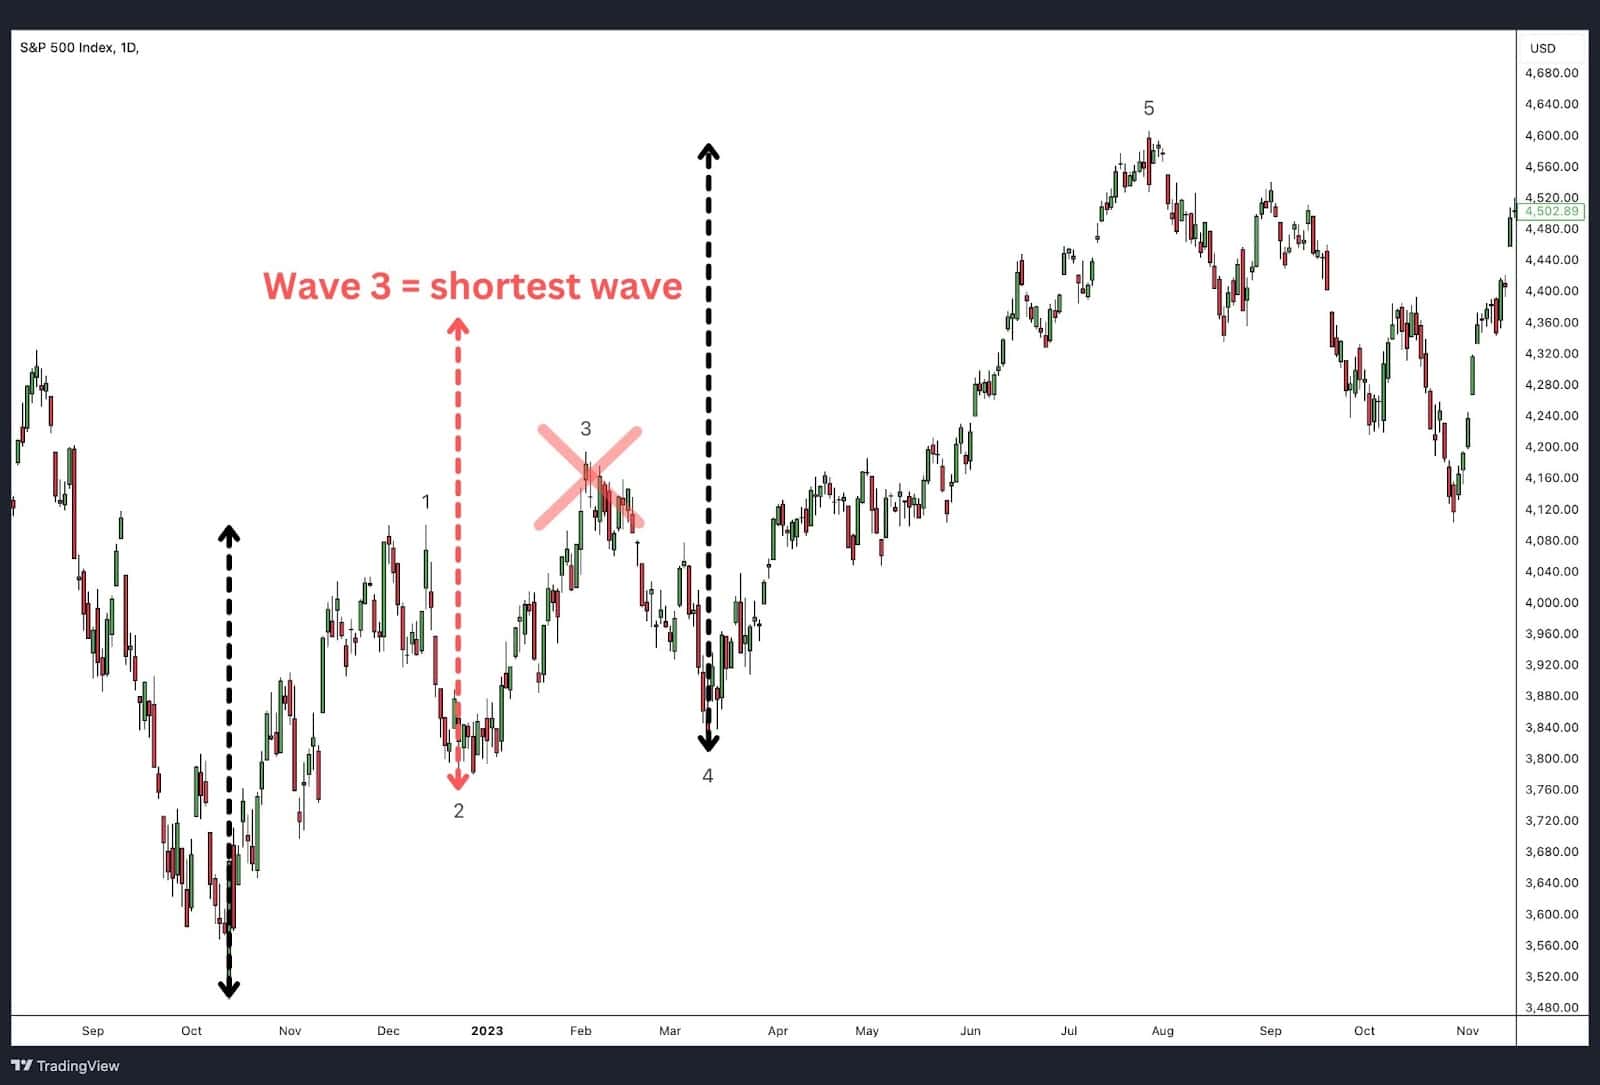
Reason for the Rule:
Wave 3 is typically the most powerful wave in an impulse pattern, reflecting strong market momentum in the direction of the main trend. The psychology behind this is that during Wave 3, the market sentiment is firmly established, and the majority of participants have aligned with the trend, whether bullish or bearish.
Early entrants to this new trend are rewarded and those believing in the old trend are forced to exit, further exacerbating the imbalance of buyers and sellers. As a result, Wave 3 is often the longest and most aggressive wave in the sequence. If Wave 3 were to be shorter than both Wave 1 and Wave 5, it would contradict this psychological dynamic of all market participants aligning to the same side of the trend pushing the market strength in the same direction.
Why It Invalidates the Impulse Wave:
The rule exists because an impulse wave must reflect progressive strength in the direction of the trend. If Wave 3, which is expected to show the strongest movement, is shorter than both Wave 1 and Wave 5, it signals that the market lacks sufficient momentum, and the impulse structure may be incorrect.
This would indicate either an incorrect wave count or a potential corrective pattern at play. When wave 3 is the shortest of waves 1, 3, and 5, it undermines the entire notion of increasing market participation and strength, invalidating the impulse.
Wave 4 Cannot Overlap The Price Territory of Wave 1 In An Impulse
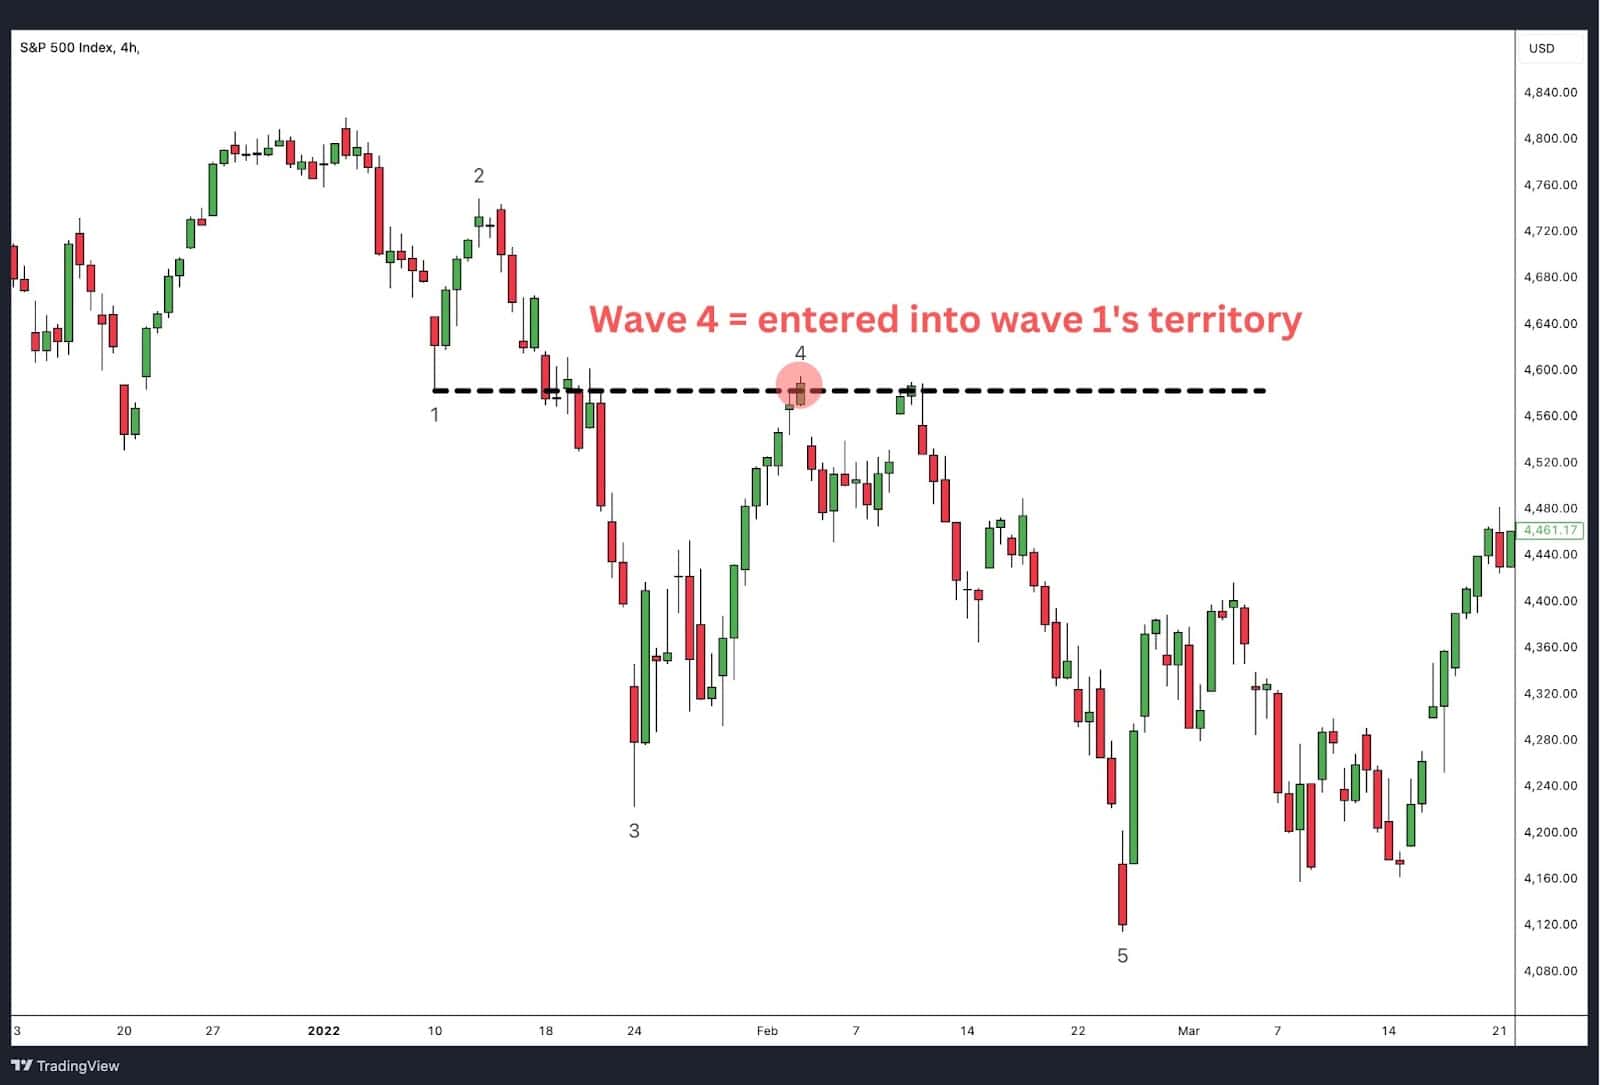
Reason for the Rule:
Wave 4 is a corrective wave that occurs after Wave 3, but it must remain distinct from Wave 1. This is because an impulse wave is designed to show clear, progressive movement in the direction of the trend. If Wave 4 were to overlap with the price range of Wave 1, it would indicate the trend progression was compromised or the trend strength was so weak that wave 4 became obnoxiously large, which goes against the very nature of trend progression.
In a strong trend, corrections should be relatively shallow and should not retrace to the point where they enter the price zone of a previous impulsive move (Wave 1).
Why It Invalidates the Impulse Wave:
Overlap between Waves 1 and 4 signals that the market is failing to make decisive progress in the direction of the trend. This behaviour is more characteristic of a corrective or sideways market, where there is indecision and no strong directional movement. An overlap between these waves breaks the clear structure of the five-wave impulse, indicating that what seemed to be an impulse wave is likely part of a larger corrective pattern (such as a diagonal or triangle). Such an overlap erases the trend continuity required for a valid impulse wave, suggesting the market is not truly trending as anticipated.
Guidelines of Elliott Wave Theory
Alternation
The guideline of alternation suggests that waves of similar function alternate in their characteristics, which helps keep the wave structure balanced. This guideline applies both within impulses and corrections.
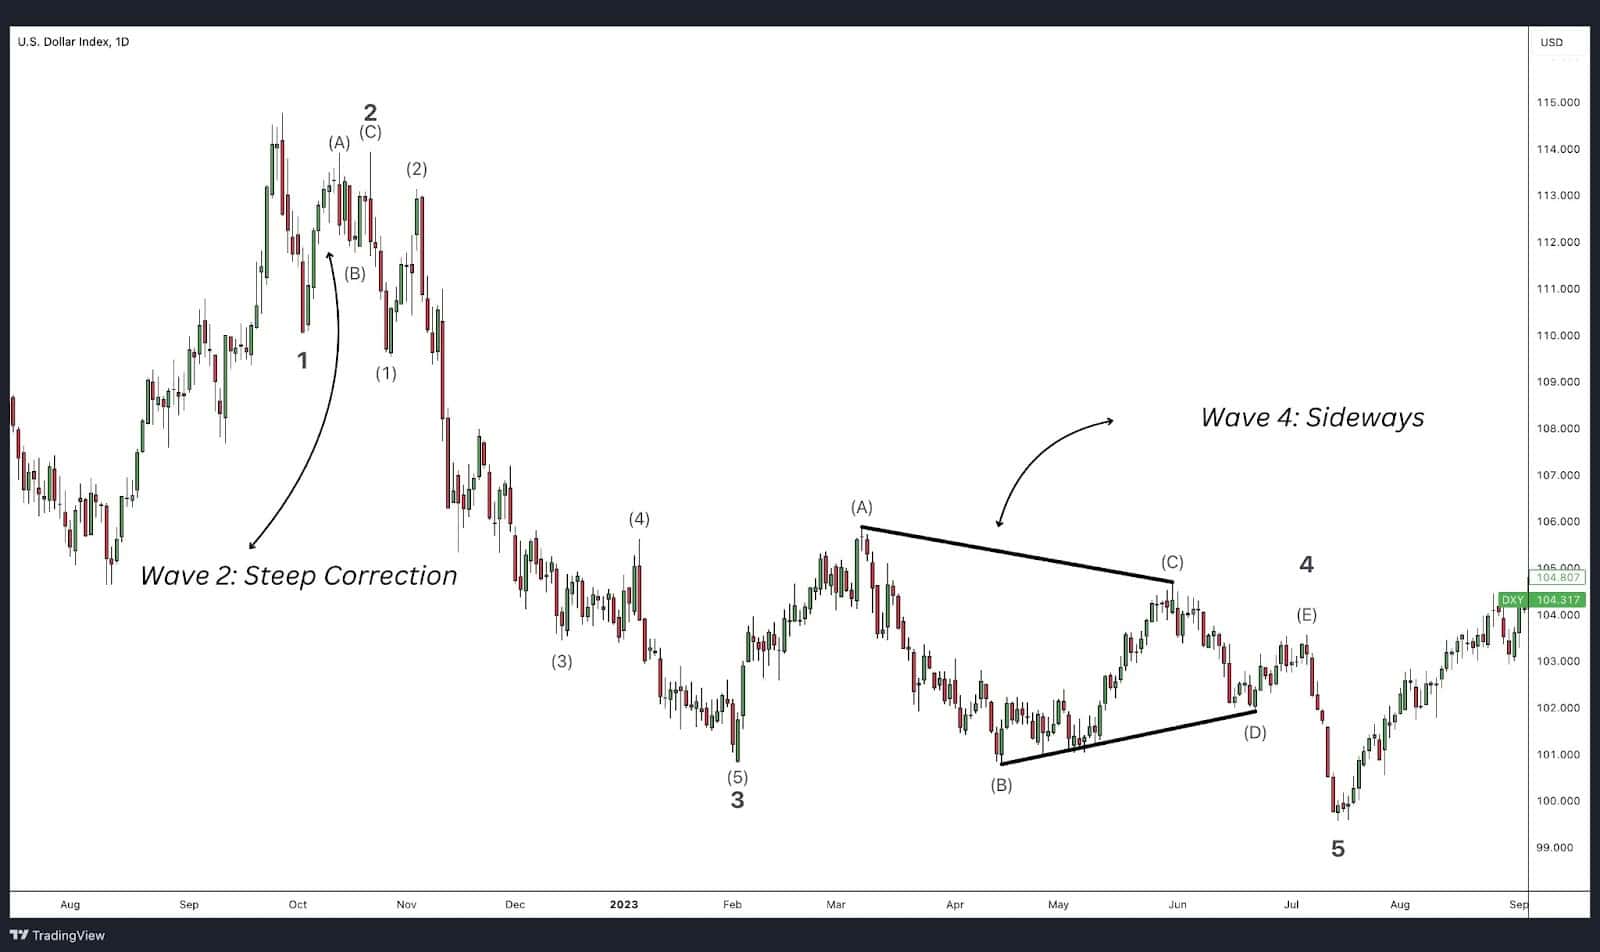
- Alternation Within an Impulse: In an impulse sequence, if Wave 2 is sharp or steep, Wave 4 will likely be more sideways or shallow, often taking the form of a flat or triangle. Conversely, if Wave 2 is more complex or sideways, Wave 4 tends to be sharper and more direct.
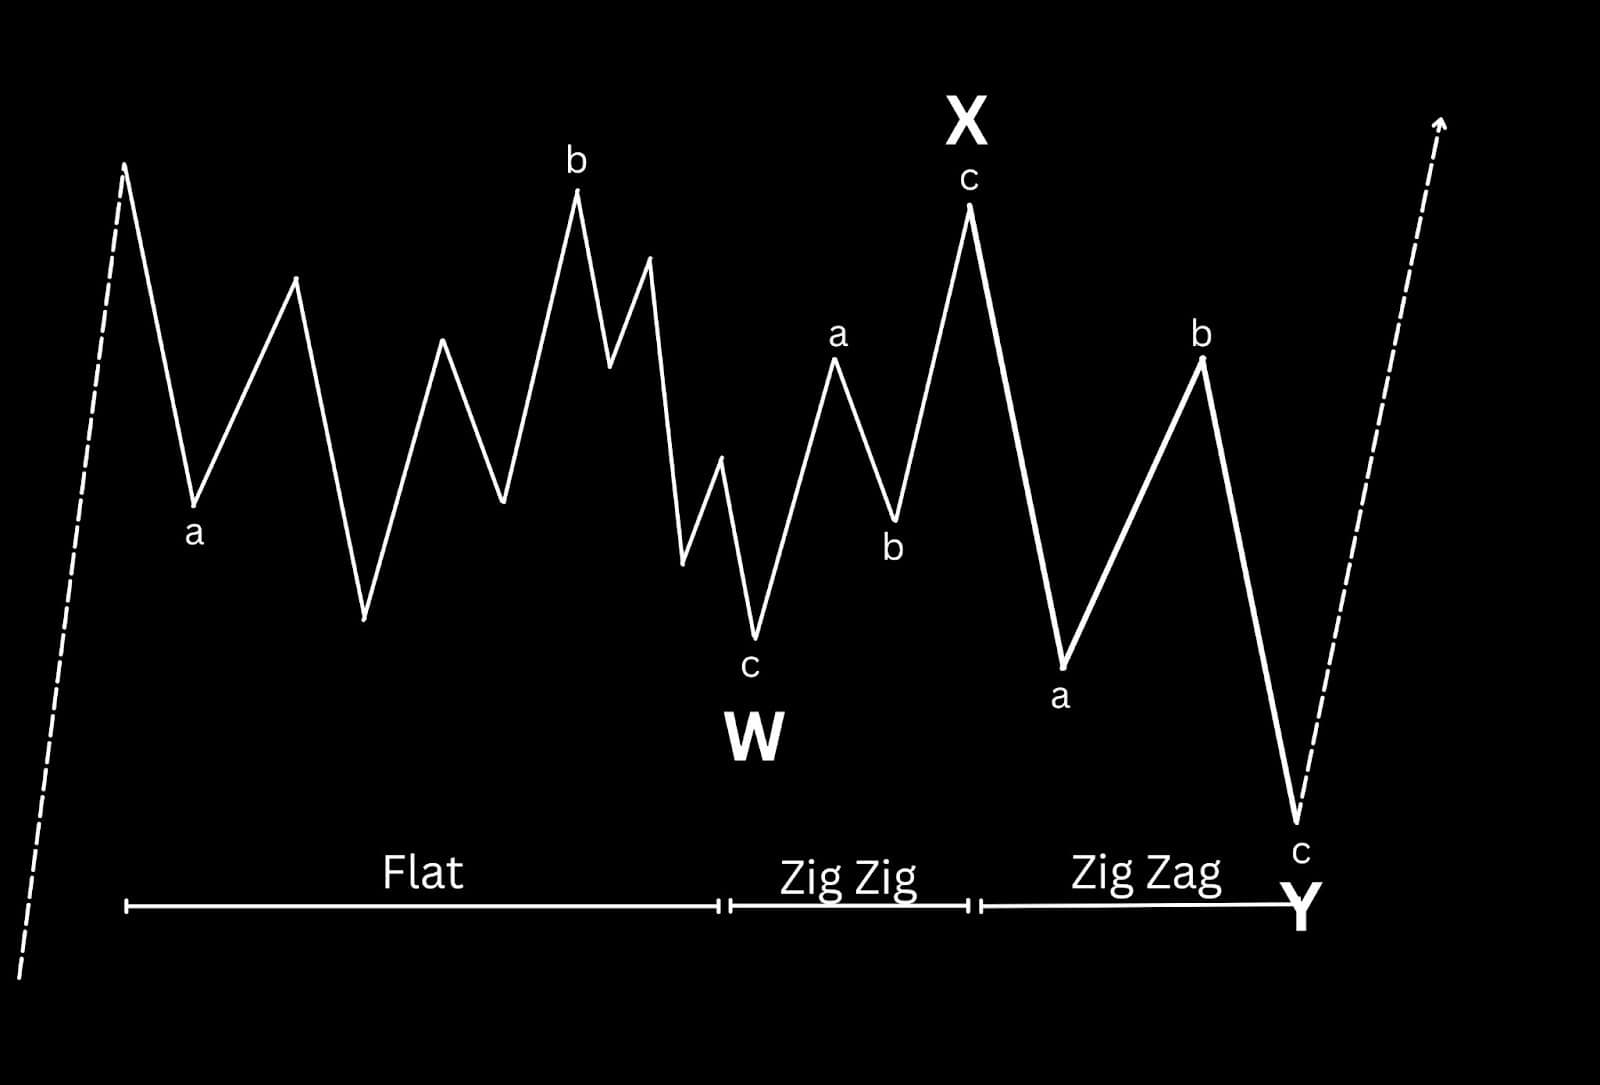
- Alternation Within a Correction: In corrective patterns like double or triple threes, if one corrective structure is a zigzag, the next correction in the sequence may appear as a flat or triangle, providing variety within the overall correction.
Depth of Corrective Waves
The depth of corrective waves is often guided by Fibonacci retracement levels, which help traders estimate how far the market may retrace.
- Wave 2 generally retraces 61.8% of Wave 1, especially if it’s a sharp correction.
- Wave 4 tends to retrace only about 38.2% of Wave 3, reflecting the trend’s stability. These retracement levels aren’t strict rules but offer helpful reference points for spotting potential reversals.
Wave Equality
The guideline of wave equality states that in a five-wave impulse, two of the motive waves (typically Waves 1 and 5) will often be equal in time and magnitude. When one wave in an impulse extends, the other two tend to exhibit a balanced or equal length.
- Example: If Wave 3 is the extended wave, then Wave 1 and Wave 5 are likely to be close to equal in length. If perfect equality isn’t observed, a 0.618 multiple is the next common relationship. This guideline provides symmetry to the impulse wave structure.
Channeling Technique
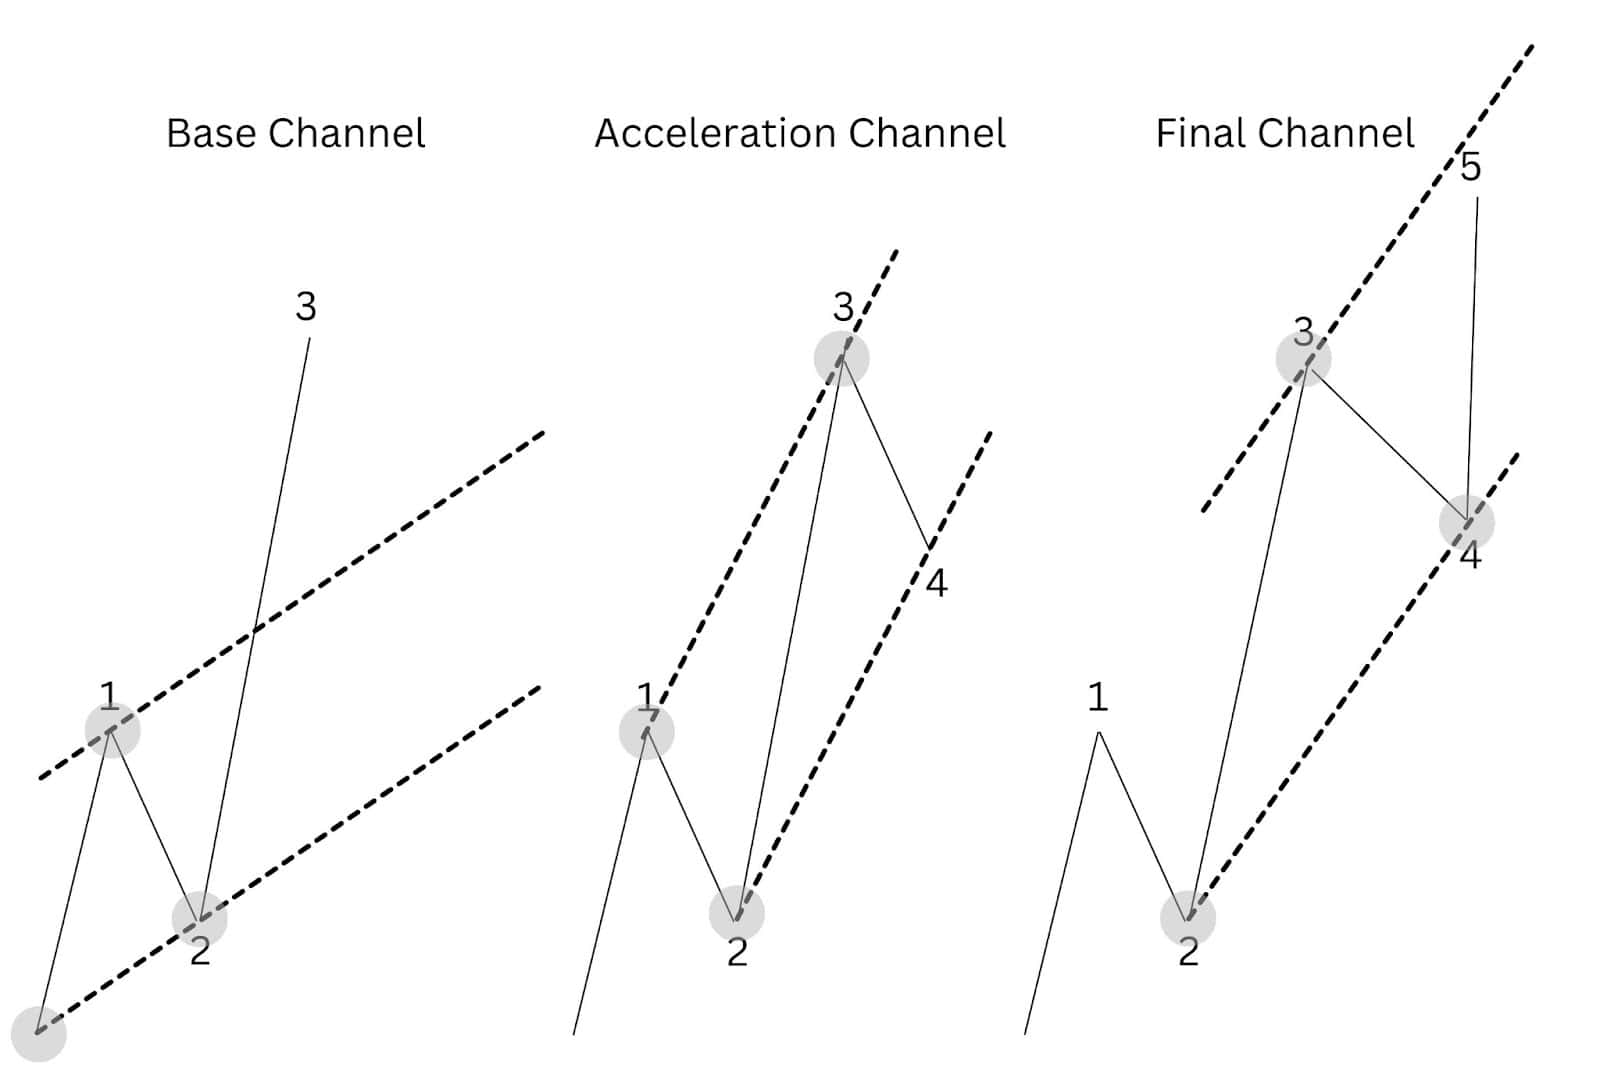
The channeling technique is useful for visually defining the boundaries of an impulse wave as it progresses. This method was popularised by Jeffrey Kennedy, who outlined three primary channels:
- Base Channel: Drawn from the start of Wave 1 to the end of Wave 2, this channel helps project the path of Wave 3, ideally it should break out of it.
- Acceleration Channel: Drawn during Wave 3 by connecting the ends of Waves 1 and 3. This channel highlights the strength of Wave 3 and helps identify the boundaries for Wave 4.
- Final Channel: Drawn once Wave 4 completes, connecting the end of Wave 2 to the end of Wave 4, projecting the likely path of Wave 5.
These channels help guide expectations for the remaining waves and provide useful reference points for trend boundaries.
The “Right Look”
The guideline of the “right look” emphasises that wave structures should appear proportionate and fit naturally into Elliott Wave patterns. Each wave must visually match the expected appearance, providing coherence within the structure.
- Wave Shape: The structure should be consistent with the classic look of each wave. For example, a five-wave impulse should be identifiable as five clear waves, without forcing parts of the structure into a count that doesn’t fit.
- Degree Clarity: If a wave pattern appears unclear on one timeframe, it can be helpful to zoom out to a longer timeframe (like daily or weekly) for better context, or zoom in for faster timeframes in rapidly moving markets. This ensures that the count stays proportional and maintains the integrity of the overall pattern.
Following the “right look” helps avoid forced or distorted wave counts, preserving the accuracy of the analysis.
Summary of Elliott Wave Guidelines
Here’s a rapid-fire list of key Elliott Wave guidelines to help you build familiarity with wave behaviour. Think of this as a quick reference that will become more intuitive as you practise identifying and applying these patterns.
Impulse Waves
Rules
- An impulse always subdivides into five waves.
- Wave 1 always subdivides into an impulse or a diagonal.
- Wave 3 always subdivides into an impulse.
- Wave 5 always subdivides into an impulse or a diagonal.
- Wave 2 always subdivides into a zigzag, flat, or combination.
- Wave 4 always subdivides into a zigzag, flat, triangle, or combination.
- Wave 2 never moves beyond the start of Wave 1.
- Wave 3 always moves beyond the end of Wave 1.
- Wave 3 is never the shortest wave of waves 1, 3, or 5
- Wave 4 never moves beyond the end of Wave 1.
- Waves 1, 3, and 5 are never all extended.
Guidelines
- Wave 4 will almost always be a different corrective pattern than Wave 2.
- Wave 2 is usually a zigzag or zigzag combination.
- Wave 4 is usually a flat, triangle, or flat combination.
- Sometimes, Wave 5 does not move beyond the end of Wave 3 (a truncation).
- Wave 5 often ends near or slightly exceeds a line parallel to the one connecting the ends of Waves 2 and 4.
- The centre of Wave 3 usually has the steepest slope of any section within the parent impulse.
- Typically, only Wave 1, 3, or 5 is extended.
- If Wave 3 is extended, Waves 1 and 5 often tend toward equality or a 0.618 relationship.
- When Wave 5 is extended, it aligns with Fibonacci proportions in relation to Waves 1 through 3.
- Wave 4 often subdivides the impulse into Fibonacci proportions in time and/or price.
Diagonal Waves
Rules
- A diagonal always subdivides into five waves.
- An ending diagonal always appears as Wave 5 of an impulse or Wave C of a zigzag or flat.
- A leading diagonal appears as Wave 1 of an impulse or Wave A of a zigzag.
- Waves 1, 2, 3, 4, and 5 of an ending diagonal, and Waves 2 and 4 of a leading diagonal, always subdivide into zigzags.
- Wave 2 never goes beyond the start of Wave 1.
- Wave 3 always goes beyond the end of Wave 1.
- Wave 4 never moves beyond the end of Wave 2.
- In a contracting diagonal, Wave 4 is always shorter than Wave 2, and Wave 5 is shorter than Wave 3.
Guidelines
- If Wave 1 of a diagonal is a diagonal, Wave 3 is unlikely to extend.
- Wave 2 and Wave 4 of a diagonal typically retrace 66% to 81% of the preceding wave.
- Wave 3 in a contracting variety is usually shorter than Wave 1.
- In the expanding variety, Wave 5 generally ends just short of or beyond the end of Wave 3.
Zigzag Waves
Rules
- A zigzag always subdivides into three waves.
- Wave A always subdivides into an impulse or leading diagonal.
- Wave C always subdivides into an impulse or diagonal.
- Wave B typically subdivides into a zigzag, flat, triangle, or combination.
- Wave B never moves beyond the start of Wave A.
Guidelines
- Wave A almost always subdivides into an impulse.
- Wave C is often about the same length as Wave A.
- Wave B typically retraces 38% to 79% of Wave A.
- If Wave B is a running triangle, it will retrace between 10% and 40% of Wave A.
- If Wave B is a zigzag, it will retrace 50% to 79% of Wave A.
- Wave C often ends on a line drawn from Wave A parallel to the one connecting Waves A and C.
Flat Waves
Rules
- A flat always subdivides into three waves.
- Wave A is never a triangle.
- Wave C is always an impulse or a diagonal.
- Wave B retraces at least 90% of Wave A.
Guidelines
- Wave B usually retraces between 100% and 138% of Wave A.
- Wave C is typically between 100% and 165% as long as Wave A.
- Wave C usually ends beyond the end of Wave A.
Contracting Triangle Waves
Rules
- A triangle always subdivides into five waves.
- At least four waves among Waves A, B, C, D, and E subdivide into zigzags or zigzag combinations.
- Wave B never moves beyond the start of Wave A, and Wave E never moves beyond the start of Wave D.
- If Wave B ends beyond Wave A, it is known as a running triangle.
Guidelines
- Wave B typically retraces 38% to 50% of Wave A.
- In a running triangle, Wave B does not end beyond the start of Wave A.
Barrier Triangle
Rules
- A barrier triangle has the same characteristics as a contracting triangle except that Waves B and D end near the same level.
- When Wave 5 follows a barrier triangle, it often shows rapid movement or an extended length.
Expanding Triangle Waves
Rules
- Wave C, D, and E each moves beyond the end of the previous wave in the same direction.
- Subwaves B, C, and D each retrace 100% to 150% of the previous subwave.
Guidelines
- Subwaves B, C, and D usually retrace 105% to 125% of the preceding subwave.
Combination Waves
Rules
- Combinations consist of two (double three) or three (triple three) corrective patterns separated by one or two corrective patterns (labelled X).
- A zigzag combination comprises two or three zigzags.
- A “double three” consists of combinations like a zigzag and flat, a flat and triangle, or other variations.
- Triple threes are rare, usually involving three flats.
- Expanding triangles have yet to be observed in combinations.
Guidelines
- When a zigzag or flat appears too small relative to the preceding wave, combinations may form.
Elliott Wave Degrees
Elliott Wave Theory categorises these waves into different degrees, which represent the size or length of a wave cycle. Larger trends contain smaller trends within them, and these are identified by specific degrees ranging from large, multi-decade “Supercycles” down to very short-term “Minute” or “Subminuette” waves. The following are eight commonly recognised degrees in total:
- Grand Supercycle: Lasts multiple decades, even centuries.
- Supercycle: Lasts several years to decades.
- Cycle: Usually spans one year to several years.
- Primary: A trend lasting a few months to a year.
- Intermediate: A trend lasting weeks to months.
- Minor: Spanning days to weeks.
- Minuette: A trend covering hours to days.
- Subminuette: Very short-term trends, lasting minutes to hours.
By identifying which wave degree the market is in, traders can better position themselves for short-term moves while keeping an eye on the larger trend.
1. Hierarchy of Degrees and Market Context
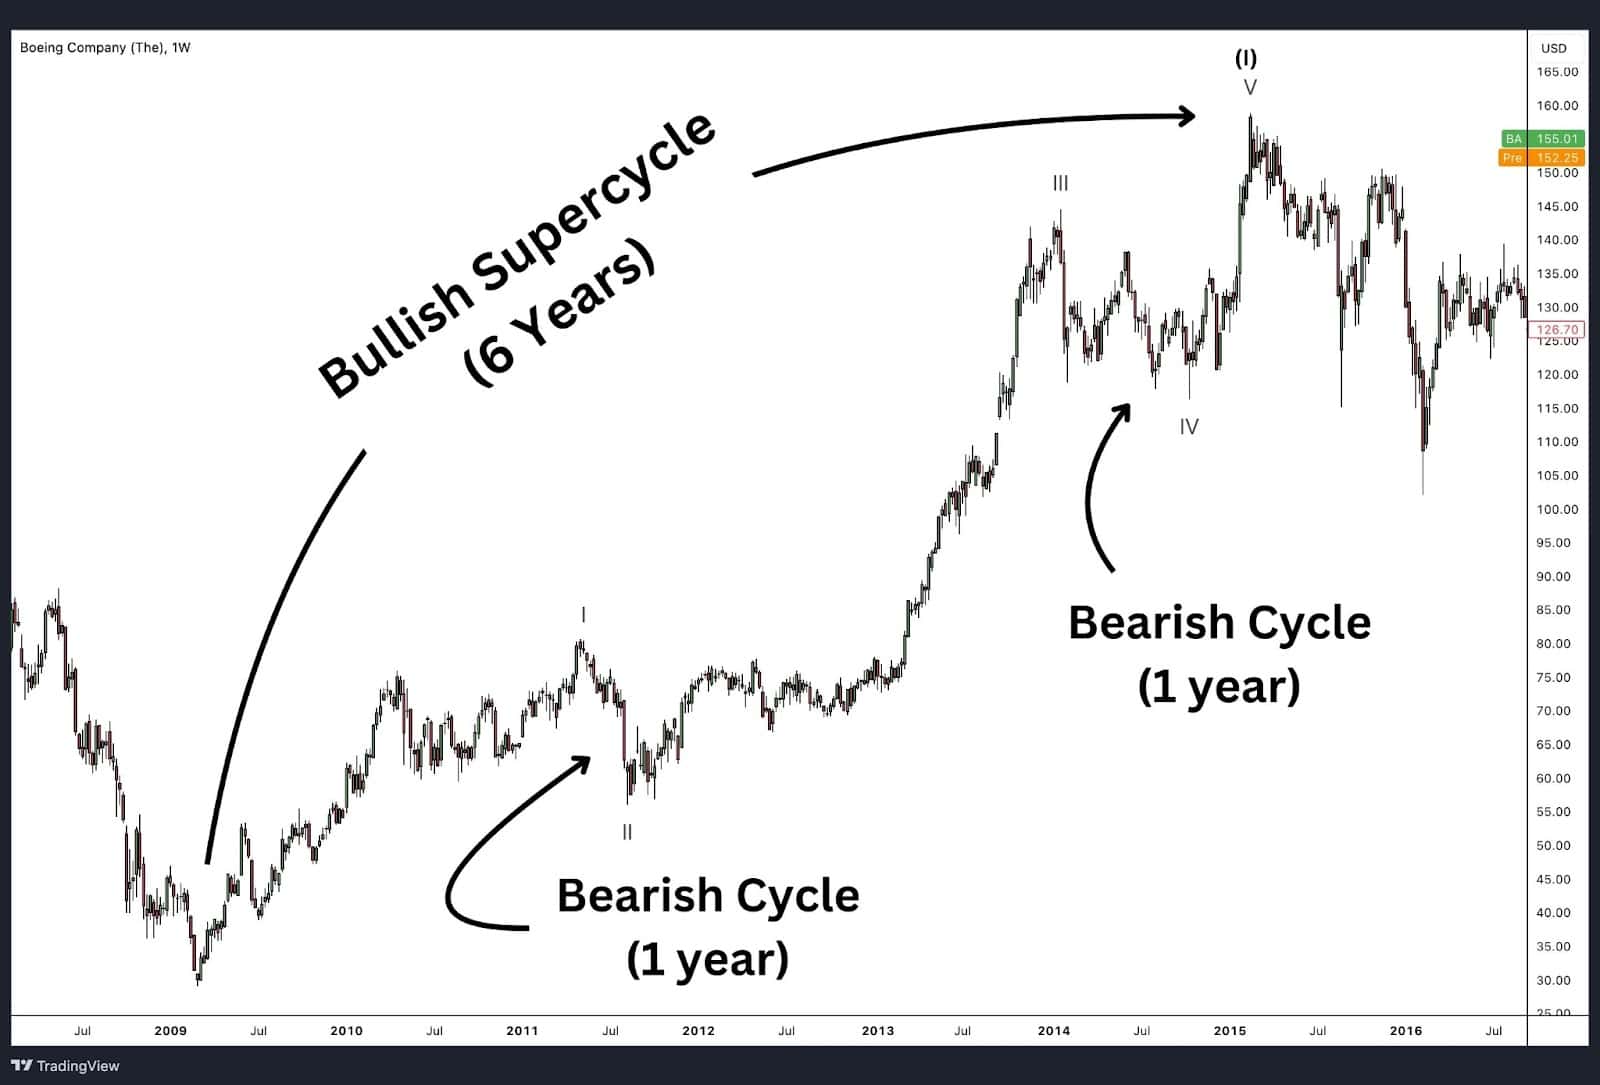
The hierarchy of Elliott Wave degrees provides a structured view of the market’s position within long-term trends, allowing traders to assess where they are in the larger market cycle. Degrees range from Grand Supercycle (lasting several decades) to Minuette (lasting only hours or days). Understanding this hierarchy helps traders align their strategy with the market’s timeframe.
- Practical Application: For instance, if a trader is seeing a cycle degree impulse wave unfolding within a larger Supercycle uptrend, they may interpret the cycle degree downtrend as a countertrend rally rather than a full trend reversal.
- Degree Overlap: Multiple degrees often overlap, allowing traders to assess short-term waves within the context of a broader trend. This nested approach helps to avoid taking impulsive positions that don’t align with the larger market cycle.
2. Fractal Nature and Self-Similarity Across Degrees
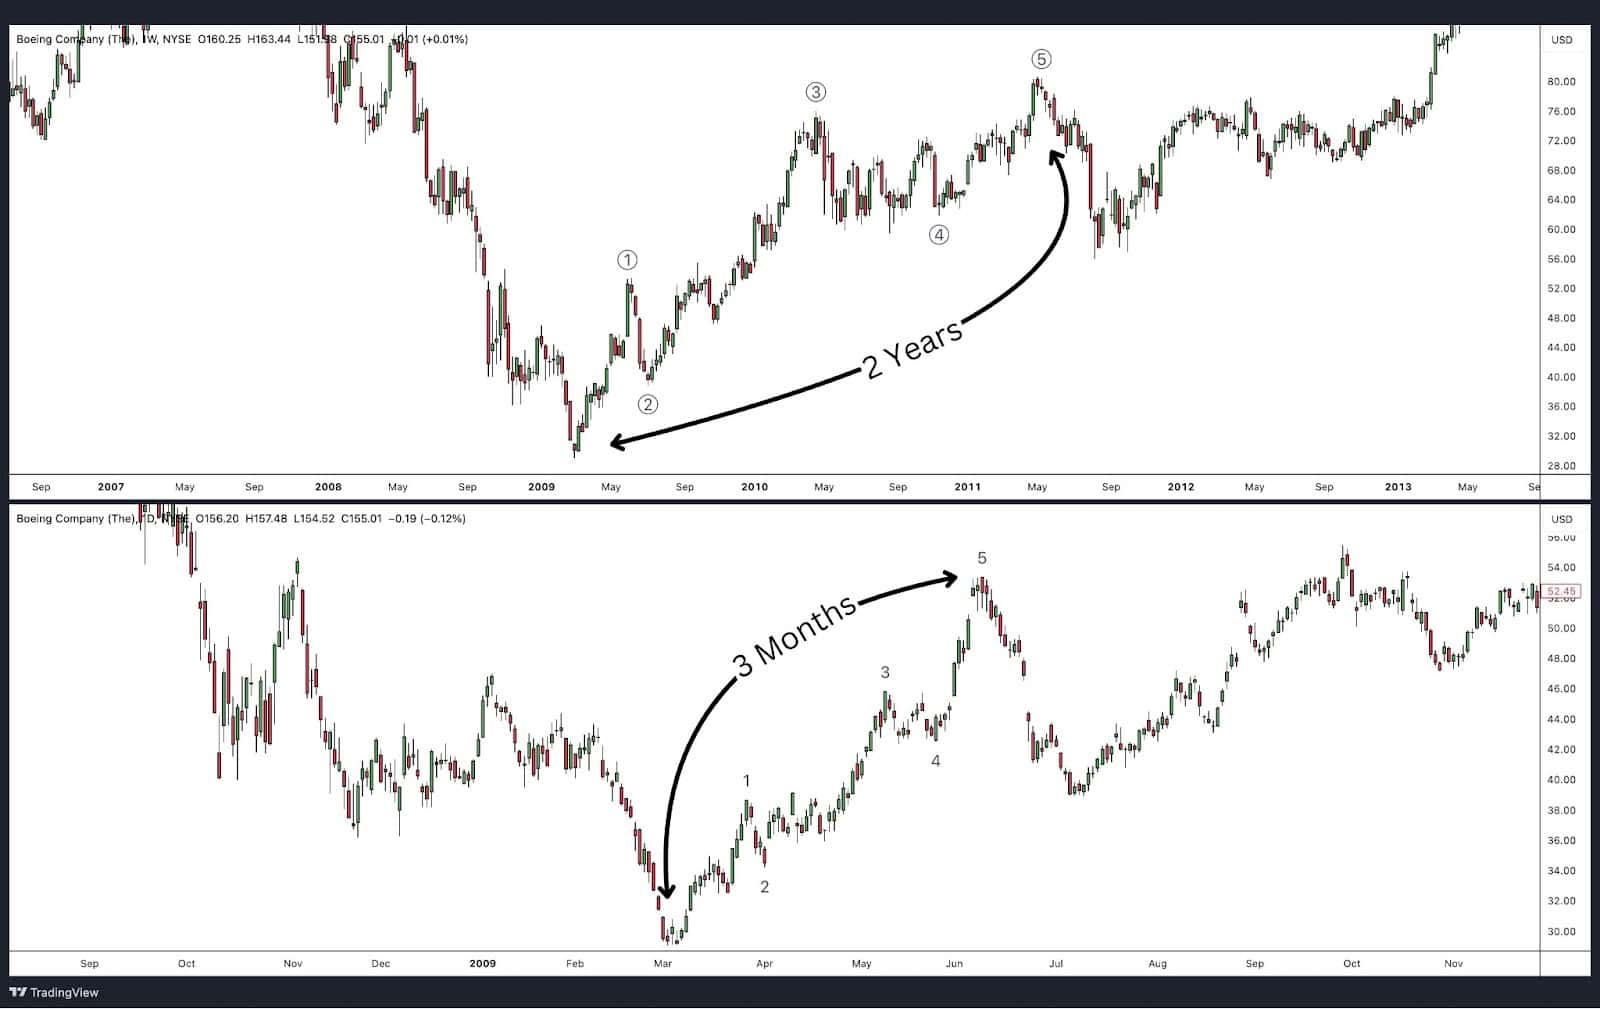
One of the essential aspects of Elliott Wave degrees is that each degree mirrors the structure of other degrees, creating a fractal pattern. This concept is based on self-similarity, where the same five-wave impulses and three-wave corrections recur on every scale. This consistency across degrees allows traders to apply the same rules and guidelines regardless of the market timeframe.
- Example: A five-wave impulse on a Cycle degree (couple of years) will mirror the same structure as an impulse on a Minor degree (few weeks and months), even though the timeframes differ. This fractal nature helps in forecasting movements based on wave structures that repeat consistently.
3. Using Degrees to Anticipate Trend Reversals and Continuations
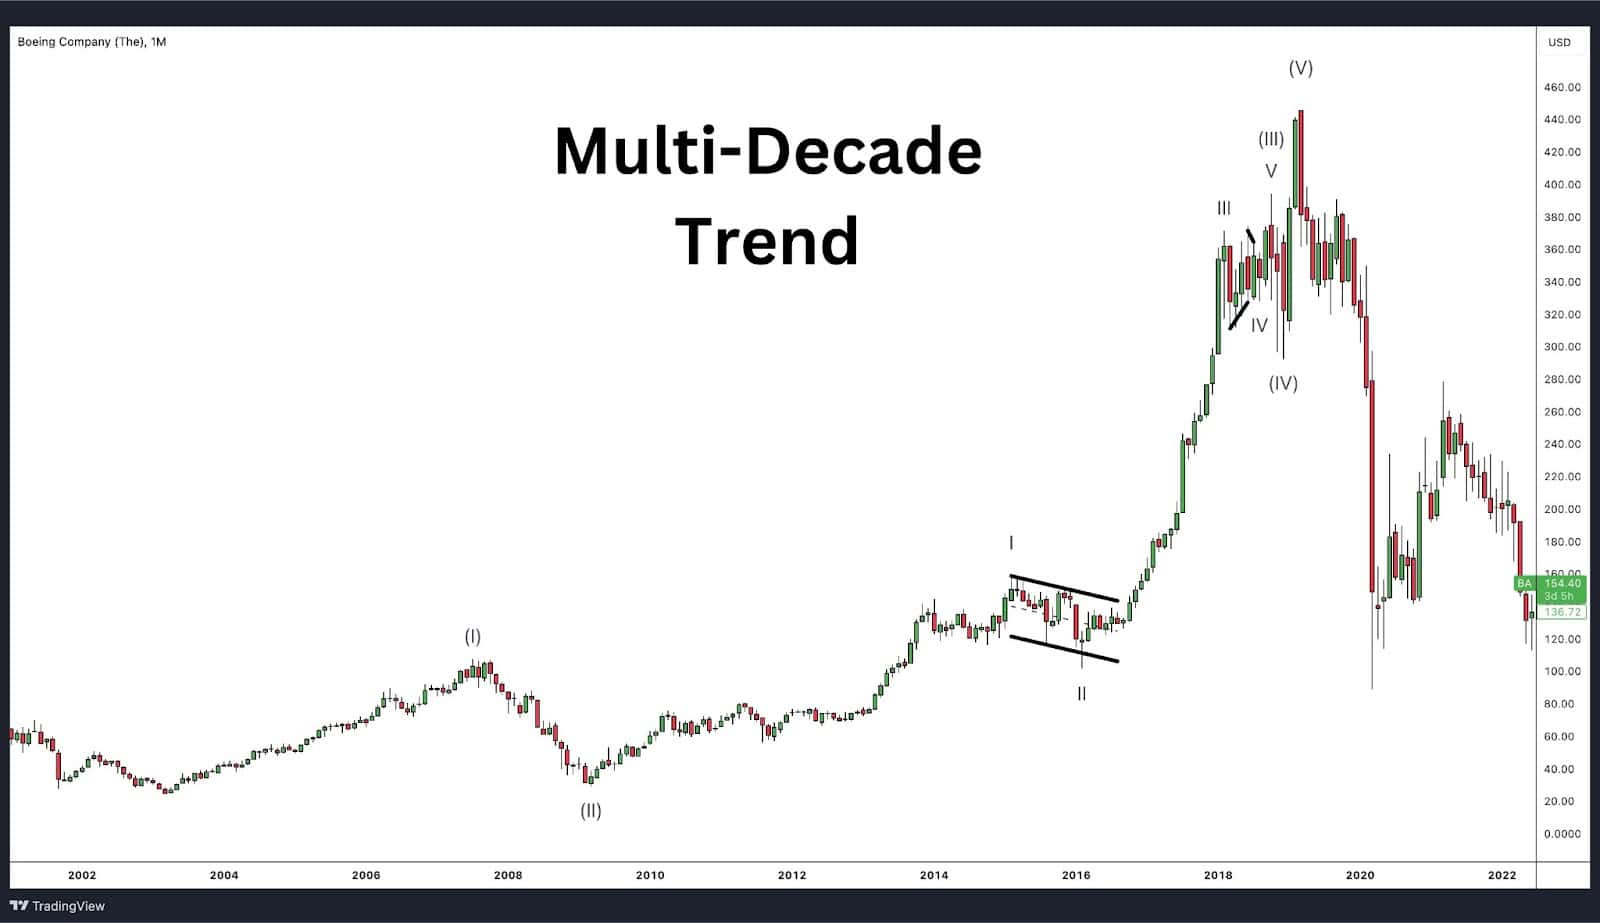
This monthly chart of Boeing illustrates a multi-decade uptrend that is nearing its peak, with Wave (V) of a larger degree coming to an end. The sustained upward trend across cycles suggests a mature bull market. However, as the larger Supercycle degree trend completes, the market shows signs of exhaustion, indicating a potential full reversal or extended correction following the end of this long-term trend.
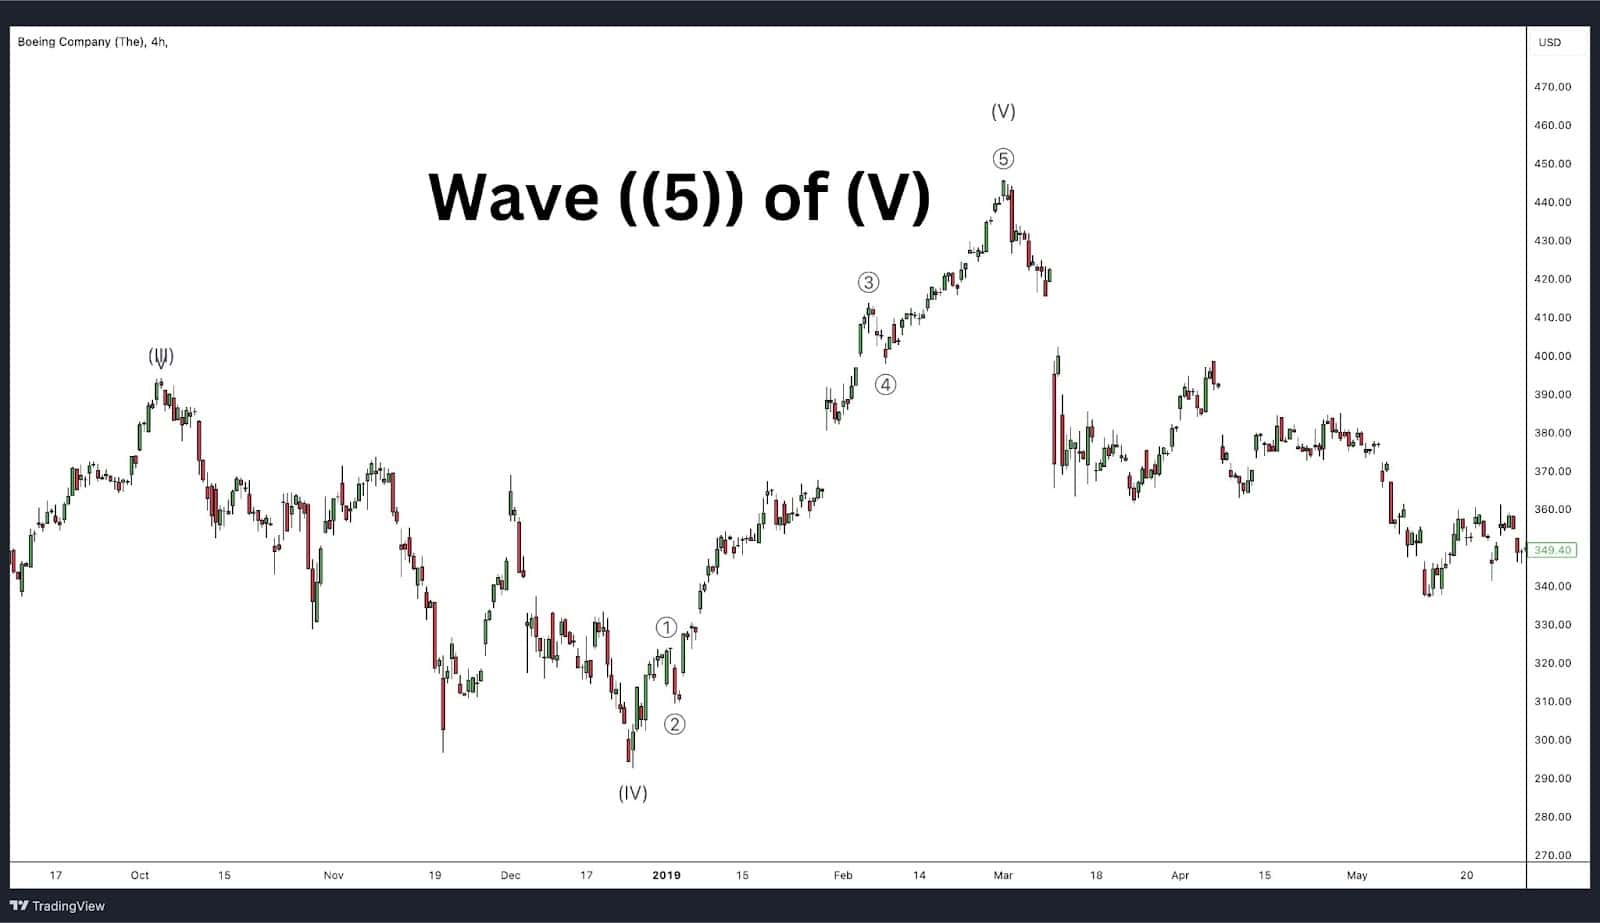
Zooming into a lower degree within the larger Wave (V), we observe a clear five-wave impulse structure, marking the final stages of the uptrend in finer detail. This five-wave sequence within Wave (V) signals that not only is the larger trend concluding, but also that the momentum of the current wave is spent. This alignment across degrees confirms that a reversal is imminent, indicating a transition from a bullish to bearish outlook.
Each Elliott Wave degree represents a level of trend maturity, which can be a valuable indicator for potential trend exhaustion or continuation. When a wave structure completes across multiple degrees simultaneously, it often signals a high-probability reversal or significant market move.
- Multiple-Degree Completion:When waves of higher and lower degrees reach their terminal points simultaneously, this alignment can signify a major trend reversal. For example, the culmination of a Cycle degree Wave V within a larger Supercycle uptrend suggests that the long-term trend is nearing exhaustion. Additionally, a five-wave sequence of Primary degree within the Cycle degree Wave V adds further confirmation. This alignment across Supercycle, Cycle, and Primary degrees signals a likely end to the broader uptrend and a potential shift in market direction.
- Confirmation of Wave Patterns: Analysing degrees side by side can confirm wave counts. If a smaller-degree impulse wave completes within a larger degree’s corrective wave, it may validate the larger wave count as corrective rather than impulsive.
4. Degree Alignment and Market Sentiment Analysis
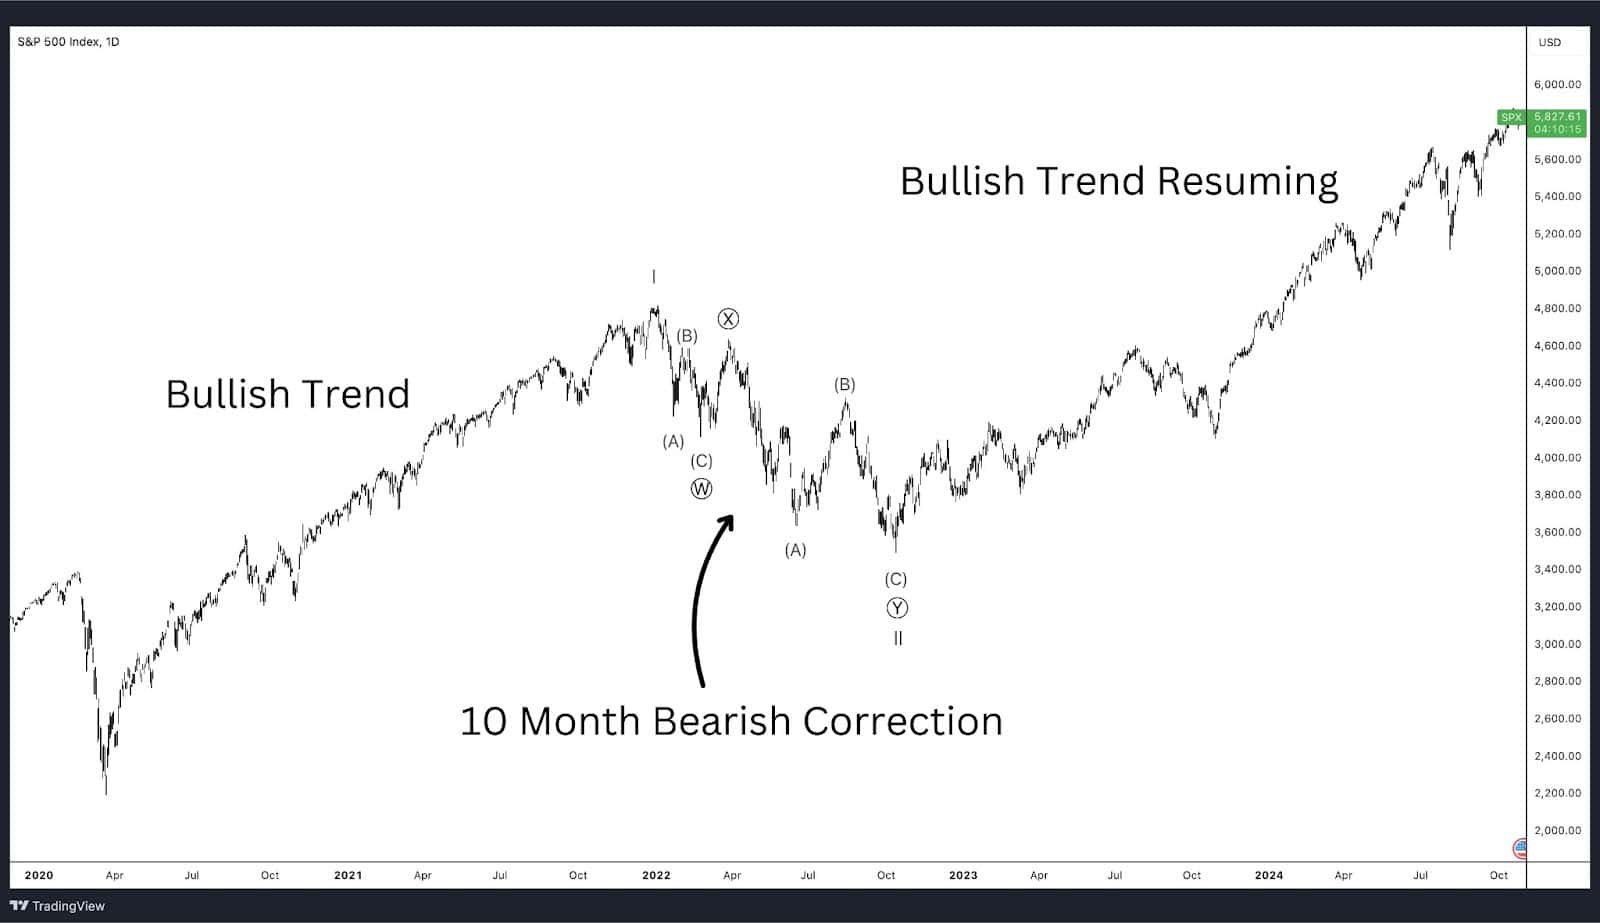
Different wave degrees can reflect shifts in market sentiment, with each degree capturing the psychology of various participant groups. Higher degrees, such as Grand Supercycle and Cycle, reflect the actions of long-term investors, whereas lower degrees like Minute or Minuette capture the behaviour of short-term traders and intraday participants.
- Sentiment Across Degrees: For example, when a Cycle degree impulse aligns with a corrective wave on a lower degree, it may show that long-term sentiment is bullish, while short-term sentiment is temporarily bearish. This alignment offers insight into market psychology, suggesting whether the current correction is likely to be brief or extended.
- Market Confidence Across Degrees: When multiple degrees trend in the same direction, market sentiment is usually strong, while misalignment of degrees (e.g., one degree trending up while a lower degree trends down) can indicate mixed sentiment or an impending reversal.
5. Degree Expansion and Contraction in Volatile Markets
During high volatility, wave degrees can expand or contract more rapidly than usual. This shift affects how quickly waves unfold, with some degrees completing faster during volatility spikes, particularly in corrective waves.
- Accelerated Degrees in Volatility: In volatile markets, lower-degree waves, such as Minuette and Minute, often complete within a condensed timeframe, reflecting rapid sentiment changes. Higher degrees might also unfold quicker than expected if the volatility represents a major trend shift.
- Contraction During Low Volatility: In low volatility periods, degrees contract and may take longer to develop. Understanding the pace at which degrees unfold helps traders adjust expectations for timeframes and avoid premature entries or exits.
6. Degree Counting and Practical Application in Multi-Timeframe Analysis
Multi-timeframe analysis is essential in Elliott Wave Theory, especially when dealing with degrees. By observing multiple degrees on different timeframes (e.g., daily, weekly, and monthly charts), traders can identify confluences that strengthen wave counts and improve prediction accuracy.
- Top-Down Analysis: Traders often start by identifying the largest degree on a higher timeframe, such as the monthly chart, and then drill down to lower timeframes to confirm smaller-degree counts. This approach provides a cohesive view of the market’s position across all degrees.
- Degree Discrepancy: Sometimes, degrees may not perfectly align across timeframes, leading to varying interpretations. In these cases, traders often focus on the clearest degree counts and use them as a primary guide.
7. Guidelines for Correct Degree Labelling
Accurately labelling wave degrees is critical in Elliott Wave analysis. Degree mislabelling can lead to incorrect wave counts and flawed predictions, so Elliotticians adhere to specific guidelines for consistency.
- Maintaining Proportionality: Each wave degree should respect the proportionality of time and price relative to adjacent degrees. For instance, a Minor degree impulse should not be longer than an Intermediate degree impulse within the same trend.
- Avoiding Degree Overlaps: Degree overlaps occur when two degrees of waves are too similar in time and scale, leading to confusion. Analysts generally separate degrees clearly, ensuring that each degree wave represents a distinct phase within the larger structure.
Elliott Wave Examples
TMDX – Daily Timeframe
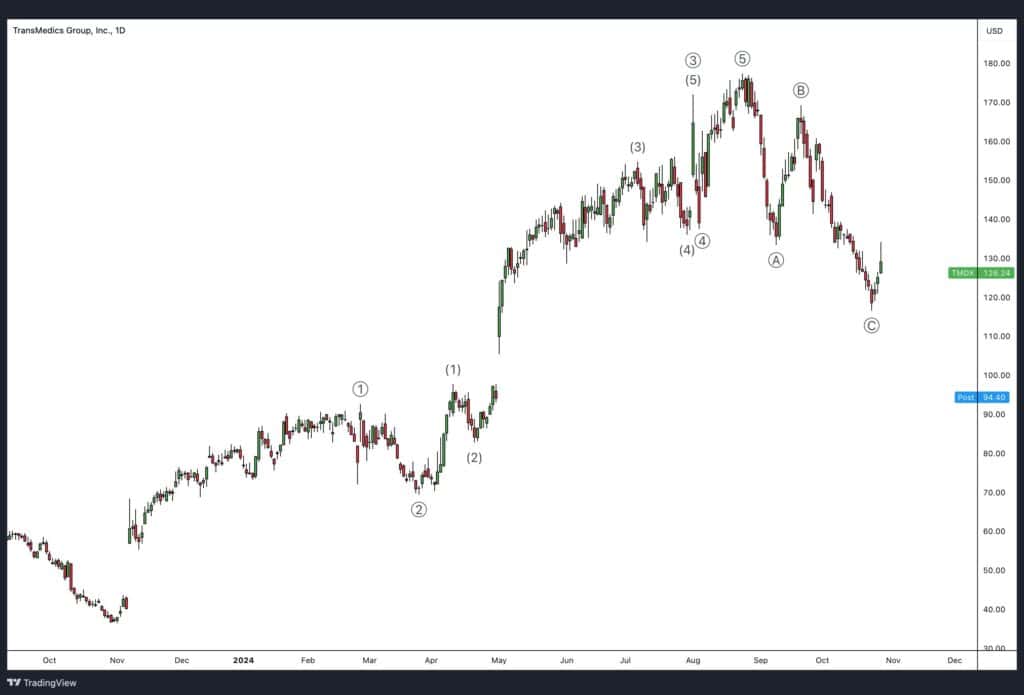
In this example, we can observe two degrees of trend—Primary and Intermediate—each displaying classic Elliott Wave patterns like impulses and corrections.
- Primary Degree: The overall trend is a five-wave impulse labelled ((1)) through ((5)), which signifies a bullish trend at the Primary degree level. This structure shows the market’s larger uptrend. Following the completion of this five-wave impulse, a corrective A-B-C pattern unfolds, signalling a Primary degree retracement after the trend’s exhaustion.
- Intermediate Degree: Within each Primary wave, we see Intermediate degree patterns that provide further insight into the internal structure. For instance:
- Wave ((3)) of the Primary degree uptrend is composed of a five-wave impulse structure at the Intermediate degree, labelled 1, 2, 3, 4, and 5, marking it as the strongest part of the trend.
- Wave (4) of ((3)) forms a sideways flat pattern at the Intermediate degree, signalling a period of consolidation before the final wave up in wave (5) of ((3)).
USD/JPY – Weekly Timeframe
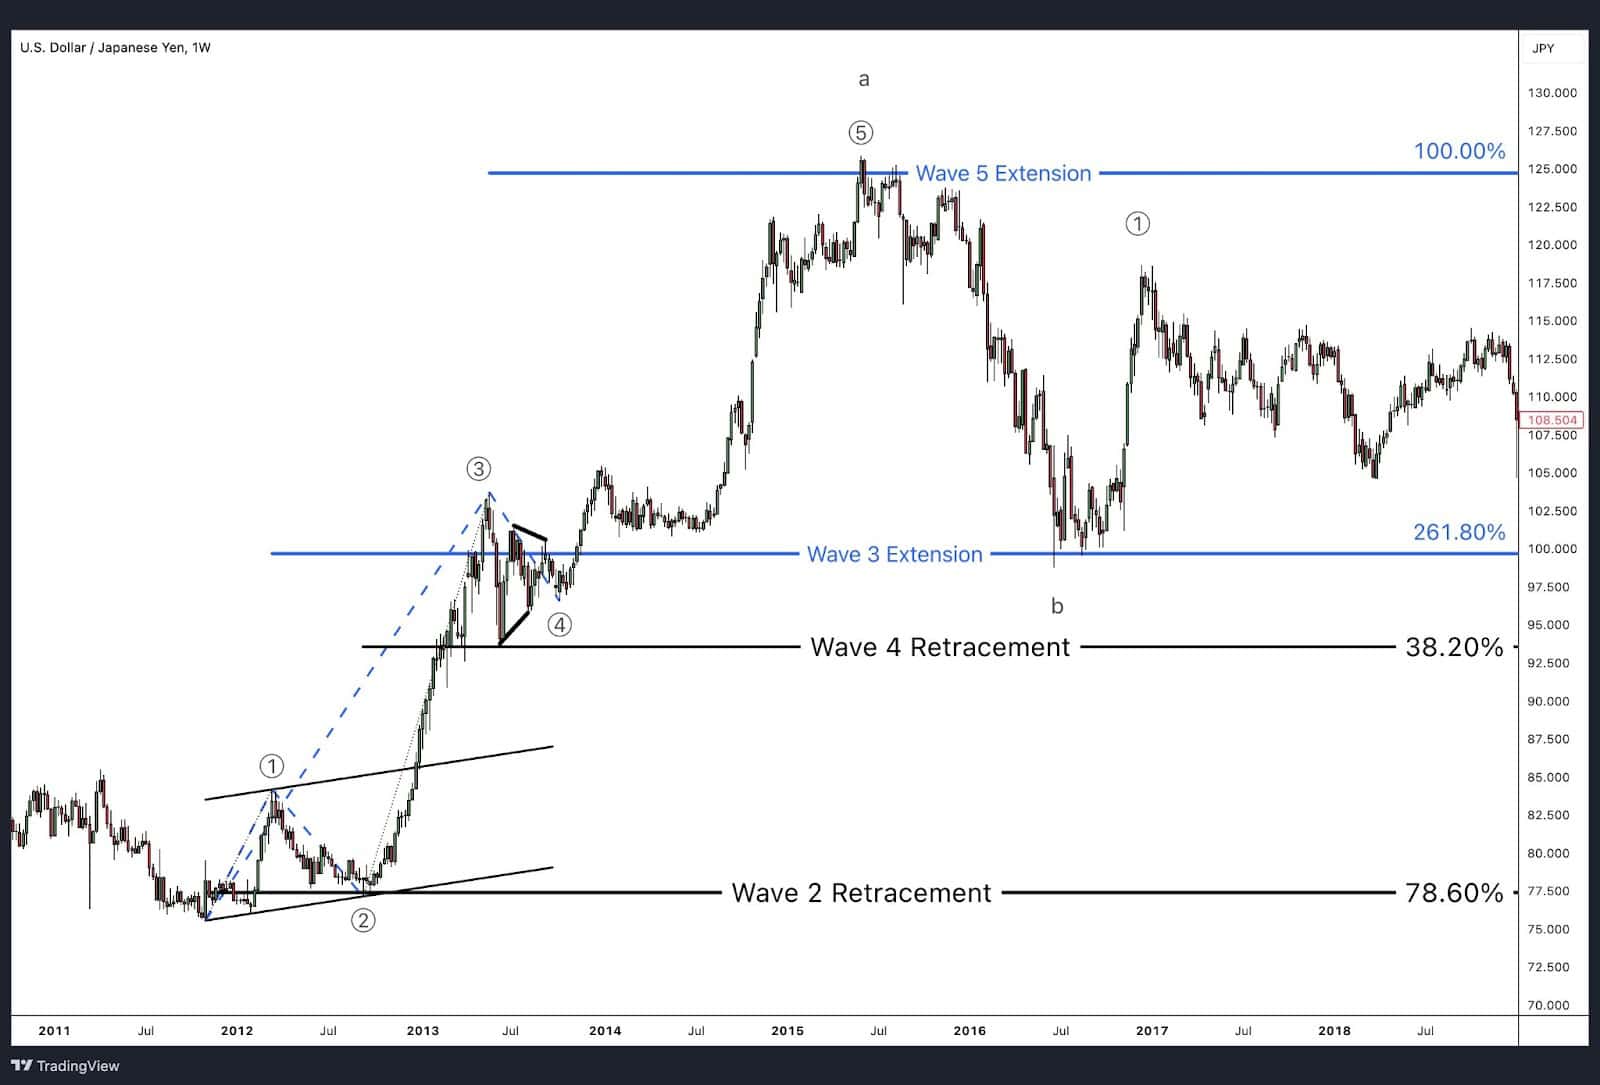
In this example, we observe two degrees of trend that illustrate a complete five-wave impulse sequence. Here’s a breakdown of the key features:
- Wave 2 retraced 78.6% of Wave 1, taking the form of a zigzag, which is typical for deeper corrections early in an impulse.
- Wave 3 extended just beyond a 2.618% Fibonacci extension of Wave 1, highlighting its strength and marking it as the most powerful wave in the sequence.
- Wave 4 unfolded as a symmetrical triangle, a common structure in fourth waves, and retraced 38.2% of Wave 3, showing a shallow correction before the final push higher.
- Wave 5 completed at a 100% extension of the distance from Wave 1 through Wave 3, signifying symmetry in the overall structure and exhaustion in the trend.
This example demonstrates how Fibonacci extensions and retracement levels align with Elliott Wave structures, providing clear targets and retracement zones for each wave. Fibonacci Ratios will be discussed further below.
Elliott Waves Strategies
Elliott Wave Theory provides a powerful framework for understanding and predicting future price movements by analysing repetitive wave patterns. Traders apply various strategies within this framework, utilising different degrees of trend and integrating technical indicators to enhance their analysis.
These strategies are versatile, as Elliott Wave Theory’s fractal nature allows it to adapt to different timeframes and trading styles, from long-term investments to intraday trading.
Elliott Wave for Day Trading
Because Elliott Wave Theory is fractal in nature, traders have the flexibility to analyse and trade on lower degrees of trend, which is particularly suitable for day trading. For those who prefer shorter holding periods—ranging from a few hours to mere minutes—Elliott Waves can be applied on intraday charts, including 1-minute, 5-minute, and 15-minute timeframes.
The ability to count waves on smaller timeframes allows day traders to take advantage of Elliott Wave structures within a single trading session. However, Elliott Wave Theory does not dictate which timeframe to trade, instead, it provides a framework that traders can adapt based on their strategy, risk tolerance, and market environment. By observing wave formations on lower timeframes, day traders can identify short-term trends, patterns, and potential reversals, maximising opportunities in quick-moving markets.
Predictions Based on Wave Patterns
Elliott Wave Theory enables traders to predict potential price movements by analysing wave patterns across multiple degrees of trend. By observing two to three degrees simultaneously, traders can identify key levels, including invalidation points, targets, and potential reversal zones, based on Elliott Wave rules and guidelines. This multi-degree analysis helps traders form a primary wave count while allowing for flexibility if market conditions change.
For example, if Wave 2 appears to be forming as a zigzag and approaching its completion, traders may expect Wave 3 to begin soon. However, if Wave 2 extends into a double zigzag, the flexibility of Elliott Wave Theory allows traders to adjust their analysis accordingly. This adaptability provides a backup plan if the primary count doesn’t unfold as expected, ensuring that the secondary count is ready to accommodate any variations in market behaviour. Thus, Elliott Wave Theory allows traders to have a clear prediction for the next probable pattern while staying prepared for alternative scenarios.
Elliott Wave with MACD
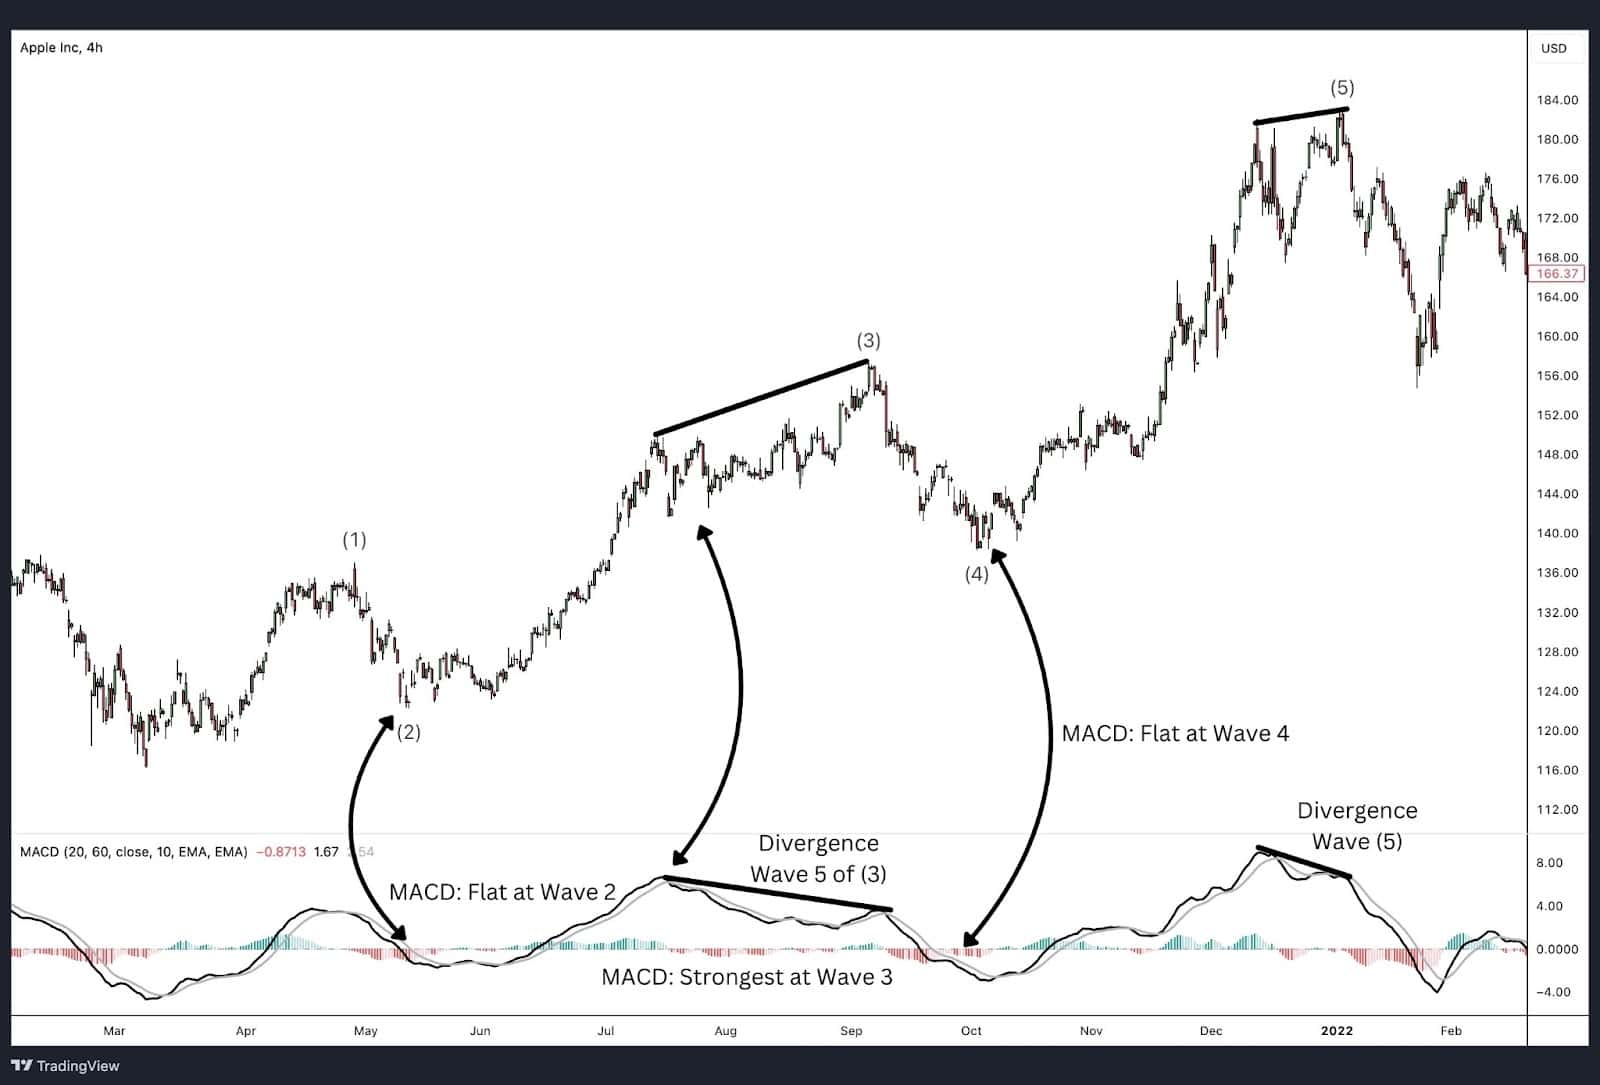
The Moving Average Convergence Divergence (MACD) indicator can be used to complement Elliott Wave analysis, particularly by confirming wave momentum and trend strength. The MACD provides valuable insights during impulsive and corrective phases, allowing traders to align Elliott Wave counts with momentum shifts in the market.
Here’s how traders commonly use MACD alongside Elliott Waves:
- Confirming Wave 3: Wave 3 is typically the strongest wave in an impulse, marked by high momentum. When counting Elliott Waves, a strong MACD reading that diverges widely from its signal line can confirm the presence of a powerful Wave 3.
- Identifying Wave 5 Divergence: As the trend approaches its final stages in Wave 5, the MACD often shows divergence—where price makes a new high (or low) but MACD fails to do so. This divergence indicates a potential reversal or correction, aligning with Elliott Wave Theory’s expectation of trend exhaustion in Wave 5.
- Spotting Corrective Patterns: During corrective waves (such as Wave 2 or Wave 4), MACD readings tend to flatten or cross back and forth over the signal line, indicating a lack of momentum. This behaviour is consistent with Elliott Wave’s identification of corrective waves, helping traders validate wave counts.
Using MACD in conjunction with Elliott Waves provides an additional layer of confidence in wave counts by aligning momentum signals with expected wave patterns.
Elliott Wave Oscillator
The Elliott Wave Oscillator (EWO) is another tool often paired with Elliott Wave Theory, designed to help traders visually identify wave counts and momentum. The EWO typically uses the difference between a 5-period and 34-period moving average, plotted as a histogram.
Key applications of the Elliott Wave Oscillator include:
- Identifying Wave 3: The EWO often reaches its highest peak during Wave 3, helping confirm that Wave 3 is the most powerful wave in an impulse sequence.
- Spotting Wave 4: During Wave 4, the oscillator usually retraces to the zero line or close to it, signalling a corrective phase before the final push of Wave 5.
- Divergence in Wave 5: As with the MACD, the EWO often displays divergence in Wave 5, where price reaches a new high (or low) but the oscillator does not. This divergence can signal the end of the trend.
While the Elliott Wave Oscillator provides useful information, it is less commonly used by experienced Elliotticians, as it may lack the adaptability of other indicators. It exists as an aid to validate wave counts, though many traders rely on other tools and manual analysis for greater flexibility.
How to Start Counting Elliott Waves
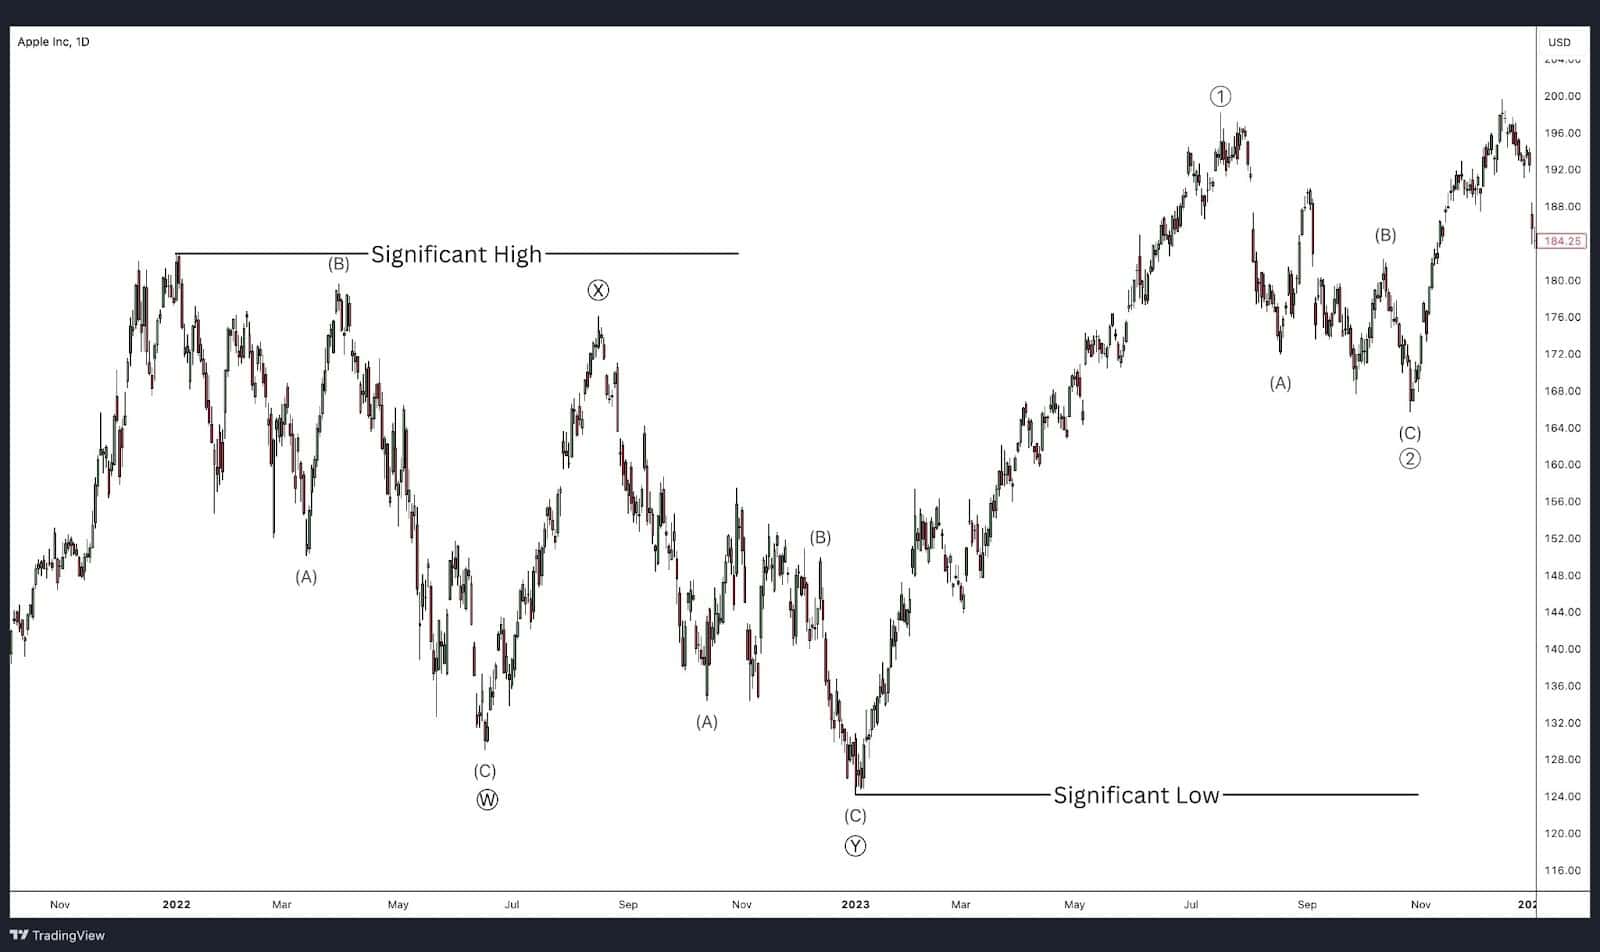
The most common practice in Elliott Wave analysis is to begin counting from the most significant low or high in the relevant degree of trend. This starting point represents the beginning of a new impulse or corrective structure, making it essential to establish an accurate count from a major turning point.
For example:
- In an uptrend, the count would start from the most significant low on the chart, and each subsequent wave would be labelled following the five-wave impulse or three-wave corrective structure.
- In a downtrend, the count would begin from the highest peak, following the same process in reverse.
By starting at the clearest high or low point, traders avoid mislabeling subwaves and maintain coherence within the wave structure, ensuring that each degree is consistent with Elliott Wave rules and guidelines. Starting with a clear point of reference also aids in maintaining accurate counts across multiple timeframes, allowing for a reliable multi-degree analysis as the trend progresses.
Market Predictions Based on Elliott Wave Patterns
Elliott Wave Theory offers a structured approach to predicting future price movements based on repetitive wave patterns. Developed by Ralph Nelson Elliott in the 1930s, the theory was revolutionary in its insight that market price movements are not random but follow identifiable, repeating cycles. Elliott observed that these cycles, or “waves,” form due to the collective psychology of market participants, moving between optimism and pessimism. This oscillating behaviour manifests as impulse waves in the direction of the trend and corrective waves moving against it.
One of the most fascinating aspects of Elliott’s discovery was its fractal structure. Elliott noted that each wave could be broken down into smaller waves, and those smaller waves could be further divided, all following the same rules and patterns regardless of their scale. This fractal nature of the market allows for wave counts across any degree of trend, from long-term cycles to minute-by-minute price movements. Although Elliott recognised this fractal structure in the markets as early as the 1930s, it wasn’t until decades later that scientists formally identified and demonstrated fractals mathematically, thanks to the work of mathematicians like Benoît Mandelbrot.
The Predictive Power of Wave Patterns in Real Markets
Elliott Wave Theory’s fractal, rule-based approach makes it one of the few tools that provides a probabilistic framework for wave structure clarity. By identifying wave structures and applying guidelines, traders can anticipate price movements with more confidence and position themselves accordingly.
For instance:
- End of a Wave 5: When a five-wave impulse completes, Elliott Wave Theory suggests that a corrective three-wave sequence is likely to follow. This knowledge allows traders to anticipate potential pullbacks or reversals after a strong uptrend.
- Pattern of Corrective Waves: When a corrective pattern like a flat or zigzag is unfolding, traders can anticipate the next likely direction once the correction completes. This is particularly valuable for identifying reentry points in the direction of the larger trend.
Overall, Elliott Wave Theory’s ability to adapt to different market conditions and timeframes makes it a versatile approach to predicting future price movement. By combining pattern recognition, fractal analysis, and adherence to strict rules, traders can gain an edge in understanding the flow of market psychology and positioning themselves ahead of key turning points.
Advantages of Elliott Wave Theory
Elliott Wave Theory offers unique insights into market behaviour by applying a fractal structure and psychological perspective to price movements. Here are some of the main advantages that make it a popular tool among traders and analysts.
- Predictive Power Across Timeframes
One of the primary advantages of Elliott Wave Theory is its adaptability across all timeframes. Due to its fractal nature, the theory can be applied on any chart, from minute-by-minute intervals to long-term historical data. This flexibility allows both day traders and long-term investors to identify trends and make predictions about future price movements based on the current wave structure.
- Understanding Market Psychology
Elliott Wave Theory is rooted in understanding the psychology of market participants. By identifying waves of optimism and pessimism, it provides insight into the underlying investor sentiment driving price action. This psychological aspect helps traders anticipate potential reversals, peaks, and troughs, giving them a deeper understanding of market dynamics beyond pure price data.
- Defined Rules and Guidelines
Elliott Wave Theory provides wave structure clarity. It is structured around specific rules and guidelines, which provide a clear framework for analysing waves. These rules, such as Wave 3 never being the shortest and Wave 4 not overlapping with Wave 1, ensure that wave counts adhere to a consistent standard. These well-defined rules provide wave structure clarify and help improve accuracy in forecasting future price movement. The rules also act as filters for confirming or invalidating wave patterns.
- Identifying High-Probability Entry and Exit Points
By understanding wave structures, Elliott wave trading helps traders identify high-probability entry and exit points. For instance, the completion of Wave 2 in an impulse wave offers an opportunity to enter the trend early, while the peak of Wave 5 suggests a potential reversal or correction. Elliott wave trading helps traders position themselves at key moments in the market, improving the potential for profitable trades.
- Flexible and Adaptable Analysis
Elliott Wave Theory allows for primary and alternate wave counts, providing flexibility when the market does not follow the expected pattern. This adaptability means that if the primary wave count is invalidated, traders can quickly shift to an alternative scenario, allowing them to stay aligned with market dynamics and remain objective in their analysis.
- Complements Other Technical Analysis Tools
Elliott Wave Theory can be used alongside other technical indicators, such as MACD and Fibonacci retracements, to confirm trends and wave counts. This multi-indicator approach helps traders enhance the accuracy of their analysis, increasing confidence in their predictions. For example, Fibonacci levels are often used to predict retracements in corrective waves, which aligns naturally with the structure of Elliott Waves.
Disadvantages of Elliott Wave Theory
Despite its advantages, Elliott Wave Theory is not without its limitations. Some critics argue that the theory’s complexity and subjectivity can lead to inconsistent results. Here are some key disadvantages.
- Subjectivity in Wave Counting
One of the primary criticisms of Elliott Wave Theory is the judgement error of the analyst or trader involved in counting waves. Different analysts may interpret the same price movement differently, leading to varying wave counts and conclusions. This subjectivity can cause confusion, as traders may struggle to reach a consensus on the correct wave structure, especially in complex or overlapping corrective patterns.
- Complexity and Steep Learning Curve
Elliott Wave Theory is complex and requires in-depth knowledge of wave structures, rules, and guidelines. Beginners may find the theory challenging to understand and apply accurately, particularly when identifying smaller wave degrees within larger trends. The theory’s steep learning curve often requires time, study, and experience to develop proficiency.
- Difficulty in Real-Time Application
While Elliott Wave Theory is powerful for analysing historical price movements, applying it in real-time trading can be challenging. Market patterns can evolve unpredictably, and the primary wave count may need frequent adjustments. This unpredictability makes it hard to apply the theory with absolute confidence in fast-moving markets, where quick decisions are crucial.
- Limited Use in Isolation
Elliott Wave Theory is most effective when used in conjunction with other technical analysis tools. Relying solely on wave counts without considering other indicators or market conditions can lead to inaccurate predictions. This dependence on complementary analysis can be a disadvantage for traders who prefer simpler, stand-alone methods.
- Rare Pattern Recognition and Adjustment
Certain patterns, like expanding diagonals or triple zigzags, are rare and hard to identify accurately in real time. Often, these formations are only recognized in hindsight, limiting the theory’s practicality in some market scenarios. Additionally, the need to switch between primary and alternate wave counts to adapt to rare patterns can add to the complexity and time investment required.
- Over-Reliance on Interpretation and Bias
Elliott Wave Theory can sometimes lead to over-interpretation of minor price movements, resulting in analysis paralysis or excessive adjustments to the wave count. Traders may develop a bias toward their wave count, which can cloud judgement and affect decision-making. This tendency to “fit” waves into expected patterns can be a drawback, especially in volatile or ambiguous markets.
Use of Fibonacci Ratios in Elliott Wave Theory
Fibonacci ratios play a foundational role in Elliott Wave Theory, helping traders identify potential reversal points, extensions, and targets for each wave within a trend. Ralph Nelson Elliott, the creator of Elliott Wave Theory, observed that price movements within financial markets often follow predictable wave structures that align closely with Fibonacci ratios.
Elliott recognised that these Fibonacci ratios could also be applied to market price movements, which often oscillate between points of expansion and contraction. In Elliott Wave Theory, these ratios help define the boundaries of corrective and impulsive waves, guiding traders on when to expect pullbacks, the depth of corrections, and the likely extension of impulse waves. Over time, the relationship between Fibonacci ratios and Elliott Waves has become an essential tool for technical analysts seeking to predict market behaviour with greater accuracy.
Fibonacci Retracements within Elliott Waves
Fibonacci retracement levels are used within Elliott Wave Theory to anticipate how far a wave may pull back before the trend resumes. These retracements serve as rough guidelines, not strict rules, providing traders with probable zones where corrections might end.
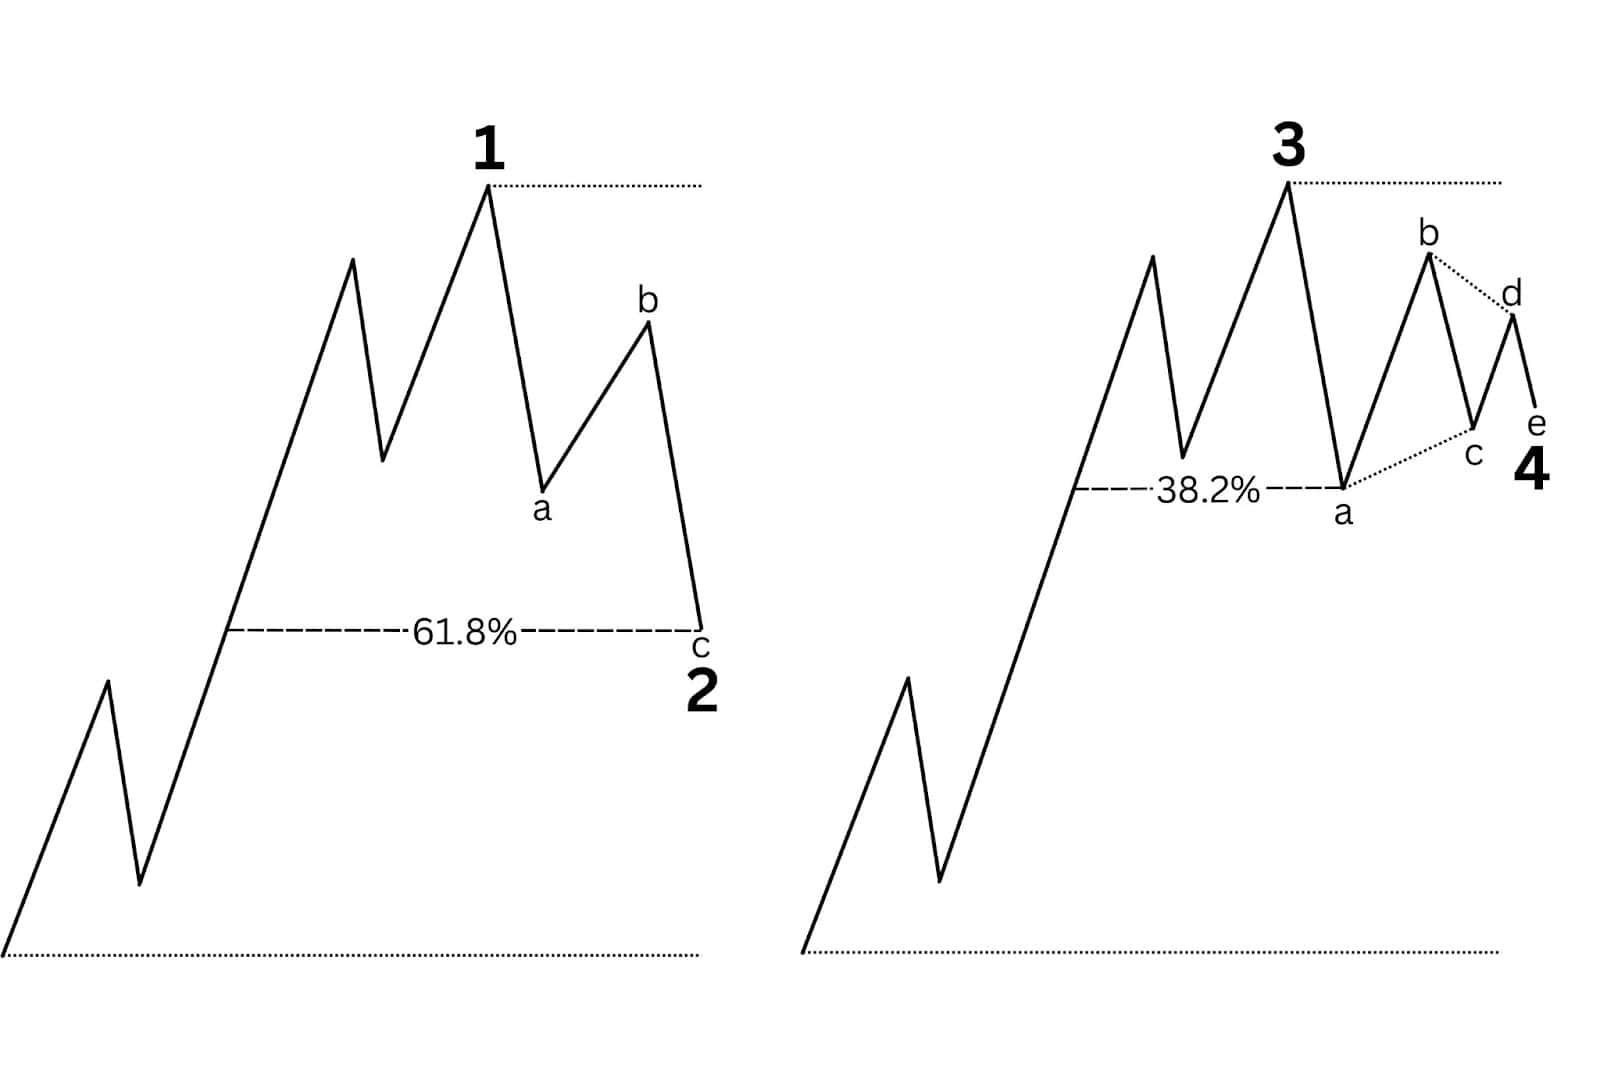
- Wave 2 Retracement: Wave 2 typically retraces between 50% and 61.8% of Wave 1, often forming a deep correction as it reflects initial scepticism about the new trend. In some cases, Wave 2 can pull back as far as 78.6%of Wave 1. While there’s no absolute limit on the depth of Wave 2, it must not retrace past the starting point of Wave 1. Theoretically, Wave 2 could go as deep as 99.9% of Wave 1, provided it doesn’t breach this origin.
- Wave 4 Retracement: The average retracement level for Wave 4 is 38.2% of Wave 3. However, the depth of Wave 4 can vary depending on market momentum. If the trend is strong, Wave 4 may be relatively shallow, retracing less than 38.2%. Conversely, if momentum is fading, Wave 4 may pull back deeper, as long as it doesn’t enter Wave 1 territory. This guideline helps traders gauge the strength of the trend and prepare for the final push in Wave 5.
- Wave B Retracement in a Zigzag: In a zigzag correction, Wave B typically retraces around 50% of Wave A. However, just like with other corrective waves, this retracement level is a guideline rather than a rule. Wave B may retrace less or more than 50% of Wave A, adding flexibility to wave counts in real-time analysis.
Fibonacci Extensions within Elliott Waves
Fibonacci extensions help identify the probable length of impulsive waves, particularly Waves 3 and 5 in a five-wave structure. These extension levels provide guidance on how far an impulse wave may extend beyond previous waves, offering potential price targets for trend-following trades.
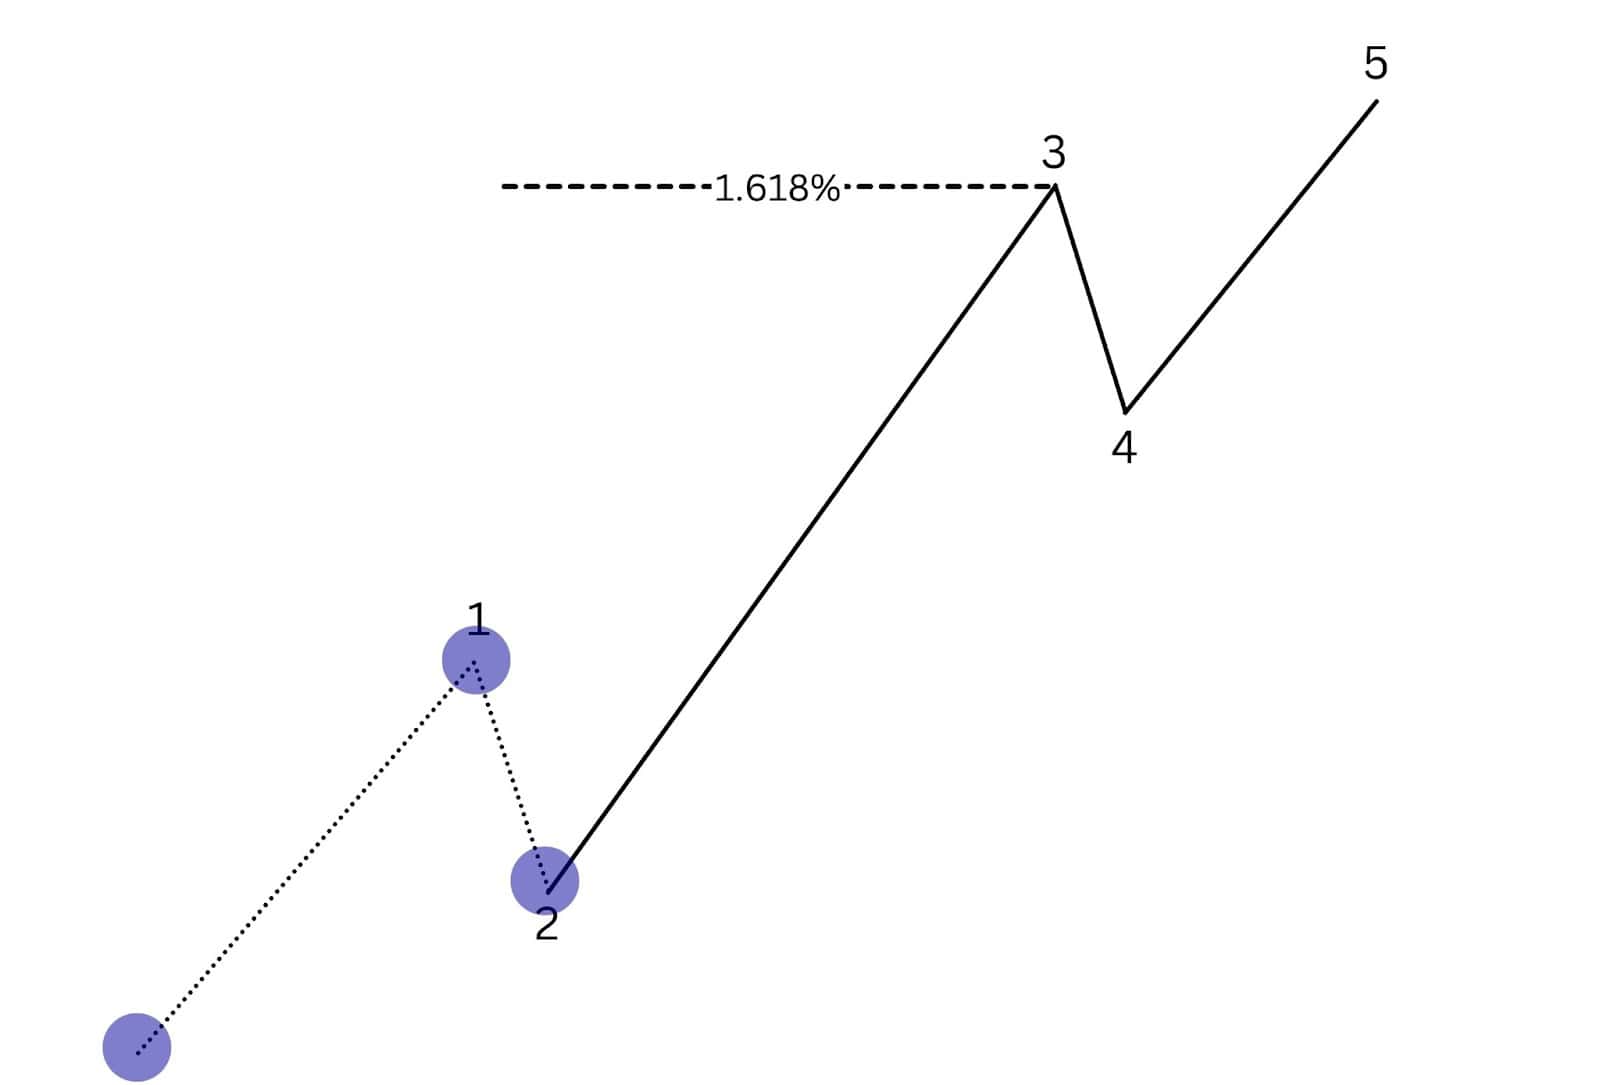
- Wave 3 Extension: Wave 3 is commonly the most extended and powerful wave in an impulse wave pattern, often reaching 1.618 to 2.618 times the length of Wave 1. However, there are no strict rules regarding its length. In some cases, Wave 3 may extend by 100% of Wave 1, or it may align with 1.272 of Wave 1. The only rule here is that Wave 3 cannot be the shortest of the three impulse waves, allowing it the flexibility to extend as market conditions dictate.
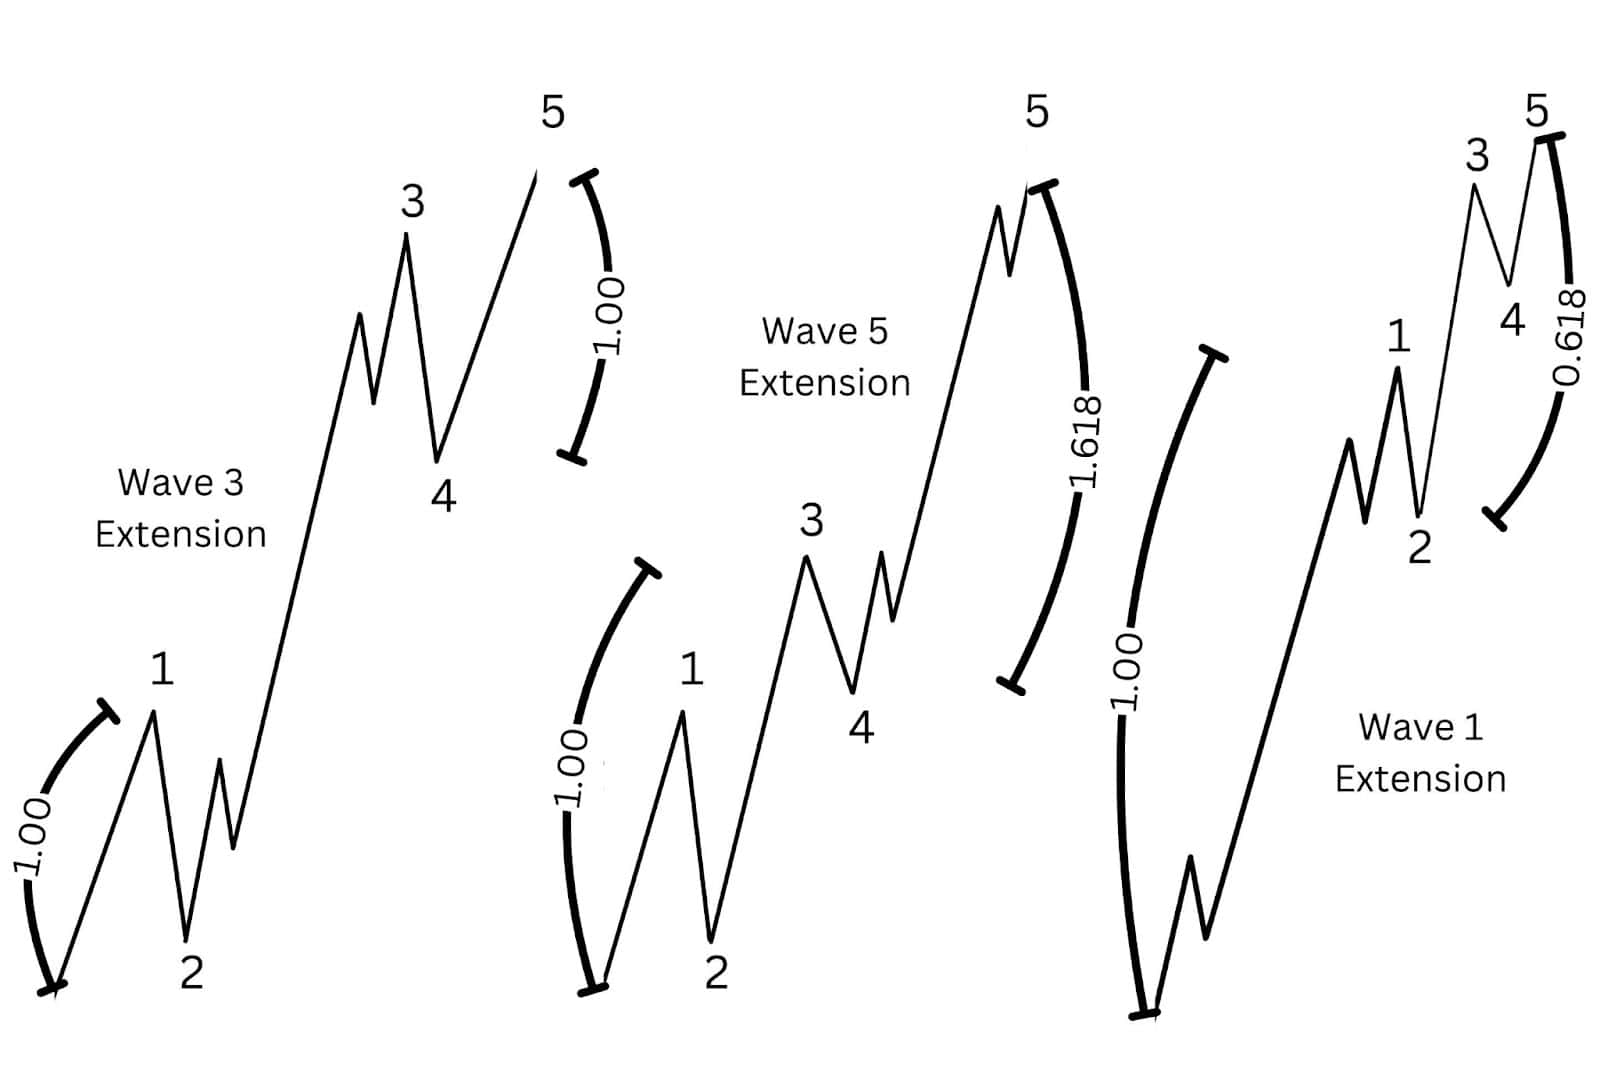
- Wave 5 Extension: Wave 5 frequently measures 100% of Wave 1 or 61.8% of the combined length of Wave 1 through Wave 3 or 161.8% extension depending on the extended wave as per the illustration. While this ratio serves as a common guideline, Wave 5 can extend higher or lower depending on market sentiment and conditions, as long as it unfolds in a five-wave sequence. Wave 5 extensions are typically seen when market euphoria or panic reaches its peak, adding volatility to the final wave.
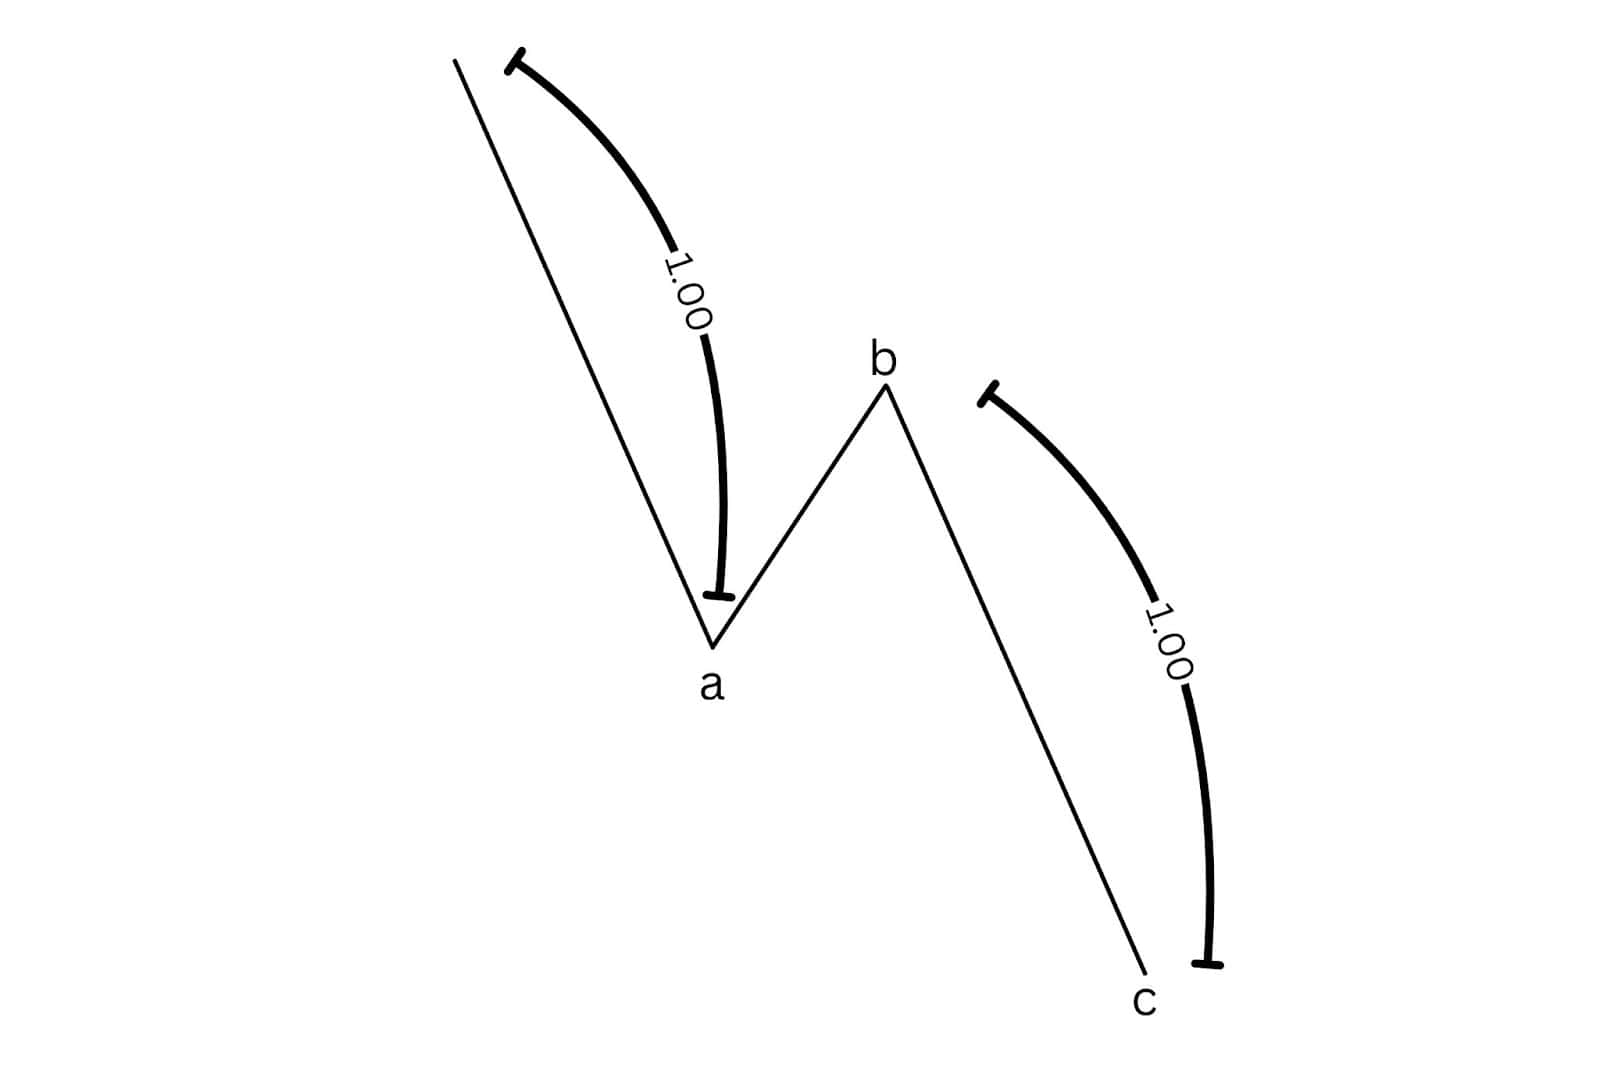
- Wave C in a Zigzag: In a zigzag corrective pattern, Wave C often has a relationship based on equality with Wave A, meaning that Wave C may extend by the same length as Wave A. While this is a common guideline, there’s no strict rule that requires Wave C to match Wave A’s length exactly. In cases of high volatility or extended corrections, Wave C may surpass or fall short of Wave A’s length.
Relation Between Fibonacci and Elliott Wave Theory
The connection between Fibonacci ratios and Elliott Wave Theory reflects the natural harmony observed in market movements. Elliott’s discovery of fractal structures in price waves mirrors the Fibonacci sequence’s presence in natural phenomena, making these ratios an ideal fit for technical analysis. Fibonacci ratios help define the structure of impulsive and corrective waves, providing traders with key levels for potential reversals and extensions.
In practical terms, Fibonacci retracements and extensions give Elliott Wave Theory a more measurable framework, allowing traders to apply mathematical precision to an otherwise abstract concept of market psychology. This fusion of Fibonacci mathematics with Elliott Wave Theory enables traders to estimate the likely depth and extent of each wave, turning wave analysis into a more quantitative approach that still respects the underlying human emotions driving market prices. By integrating Fibonacci ratios with Elliott Wave Theory, traders gain a disciplined method to predict market cycles, making it one of the most robust tools in technical analysis.
Elliott Wave Theory with Other Indicators
Combining Elliott Wave Theory with other technical indicators can enhance the accuracy of wave counts and provide additional confirmation for trade entries and exits. Indicators like the Relative Strength Index (RSI), moving averages, and volume can strengthen trading signals by helping traders understand the underlying momentum, trend strength, and participation levels in each wave. Below, we explore how these indicators complement Elliott Wave Theory and align with specific wave characteristics.
Relative Strength Index (RSI)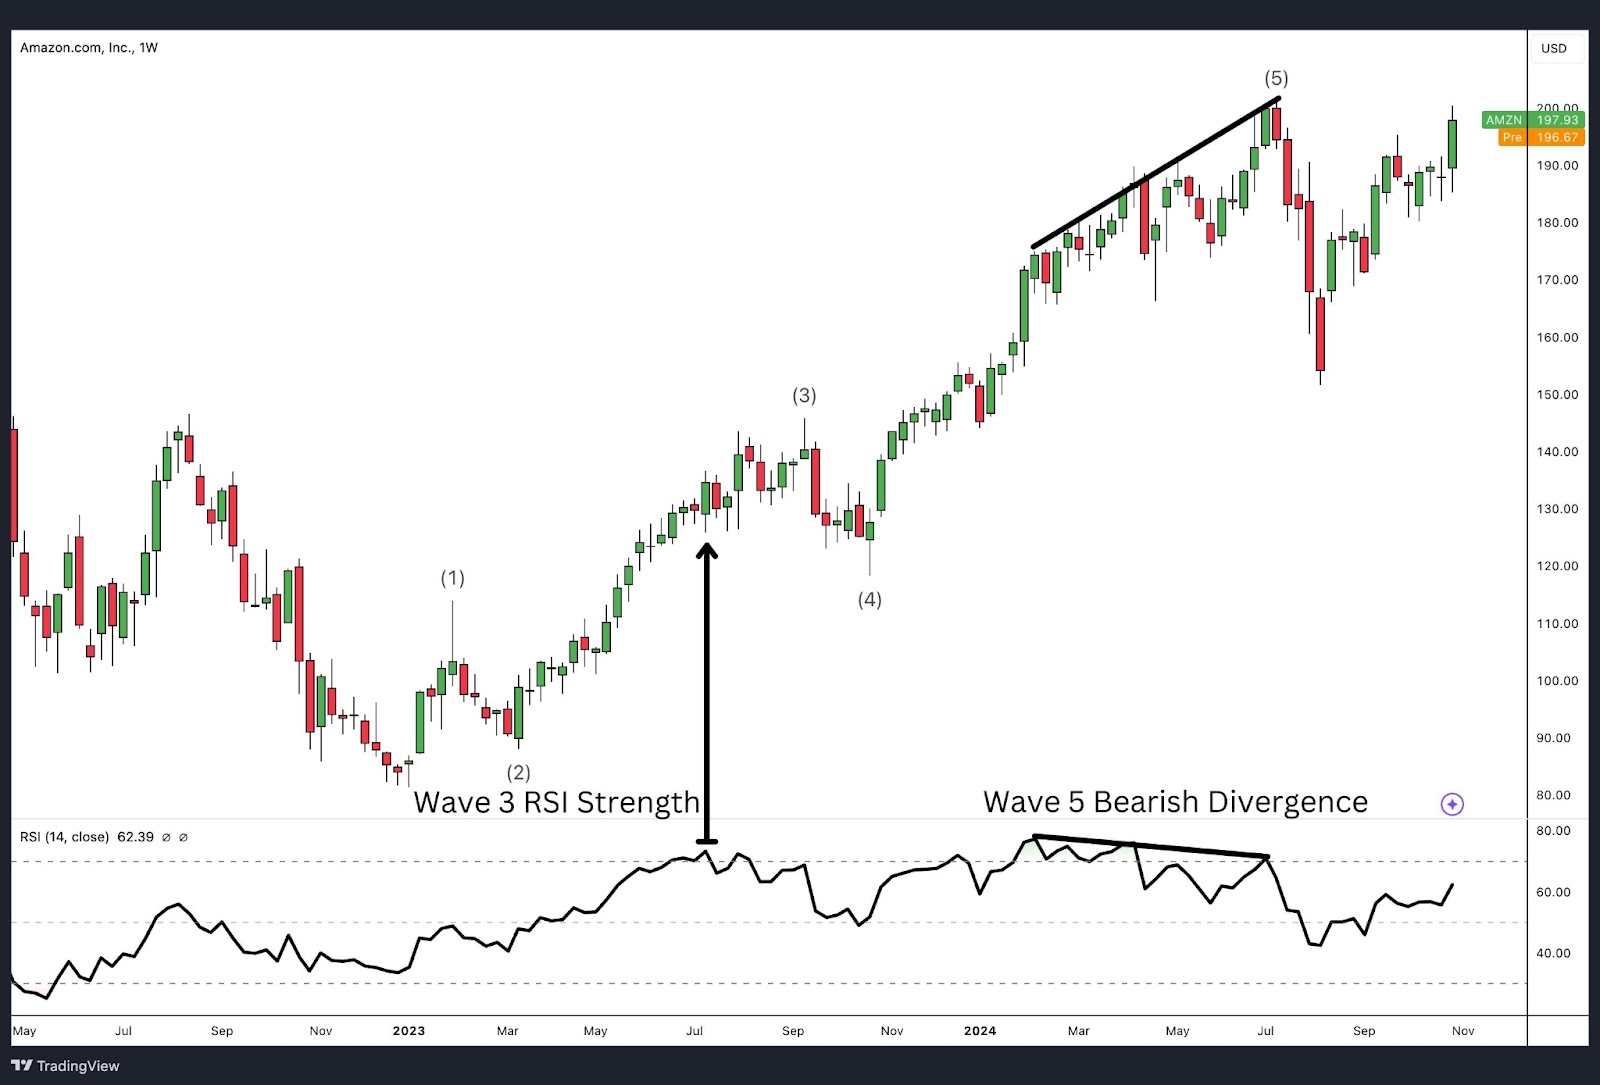
The Relative Strength Index (RSI) is a momentum oscillator that measures the speed and change of price movements, typically ranging between 0 and 100. RSI is particularly useful in Elliott Wave analysis for identifying overbought or oversold conditions, which can help pinpoint potential reversal points in the wave structure.
- Wave 3: Wave 3 is generally the strongest and most powerful wave in an impulse wave pattern, often characterised by high momentum. During Wave 3, the RSI usually shows strong readings in the overbought region (above 70 in an uptrend), reflecting strong buying momentum. A high RSI reading in Wave 3 supports the wave count, confirming that the trend is accelerating.
- Wave 5: In Wave 5, RSI can show a phenomenon known as bearish or bullish divergence. For example, in an uptrend, prices may make new highs, but the RSI fails to reach new highs, indicating that momentum is weakening. This divergence often signals the end of the impulse wave, suggesting a potential reversal or corrective phase is near.
By using RSI alongside Elliott Wave Theory, traders can confirm wave counts and anticipate reversals at key points in the cycle, adding another layer of confidence to their analysis.
Volume Indicator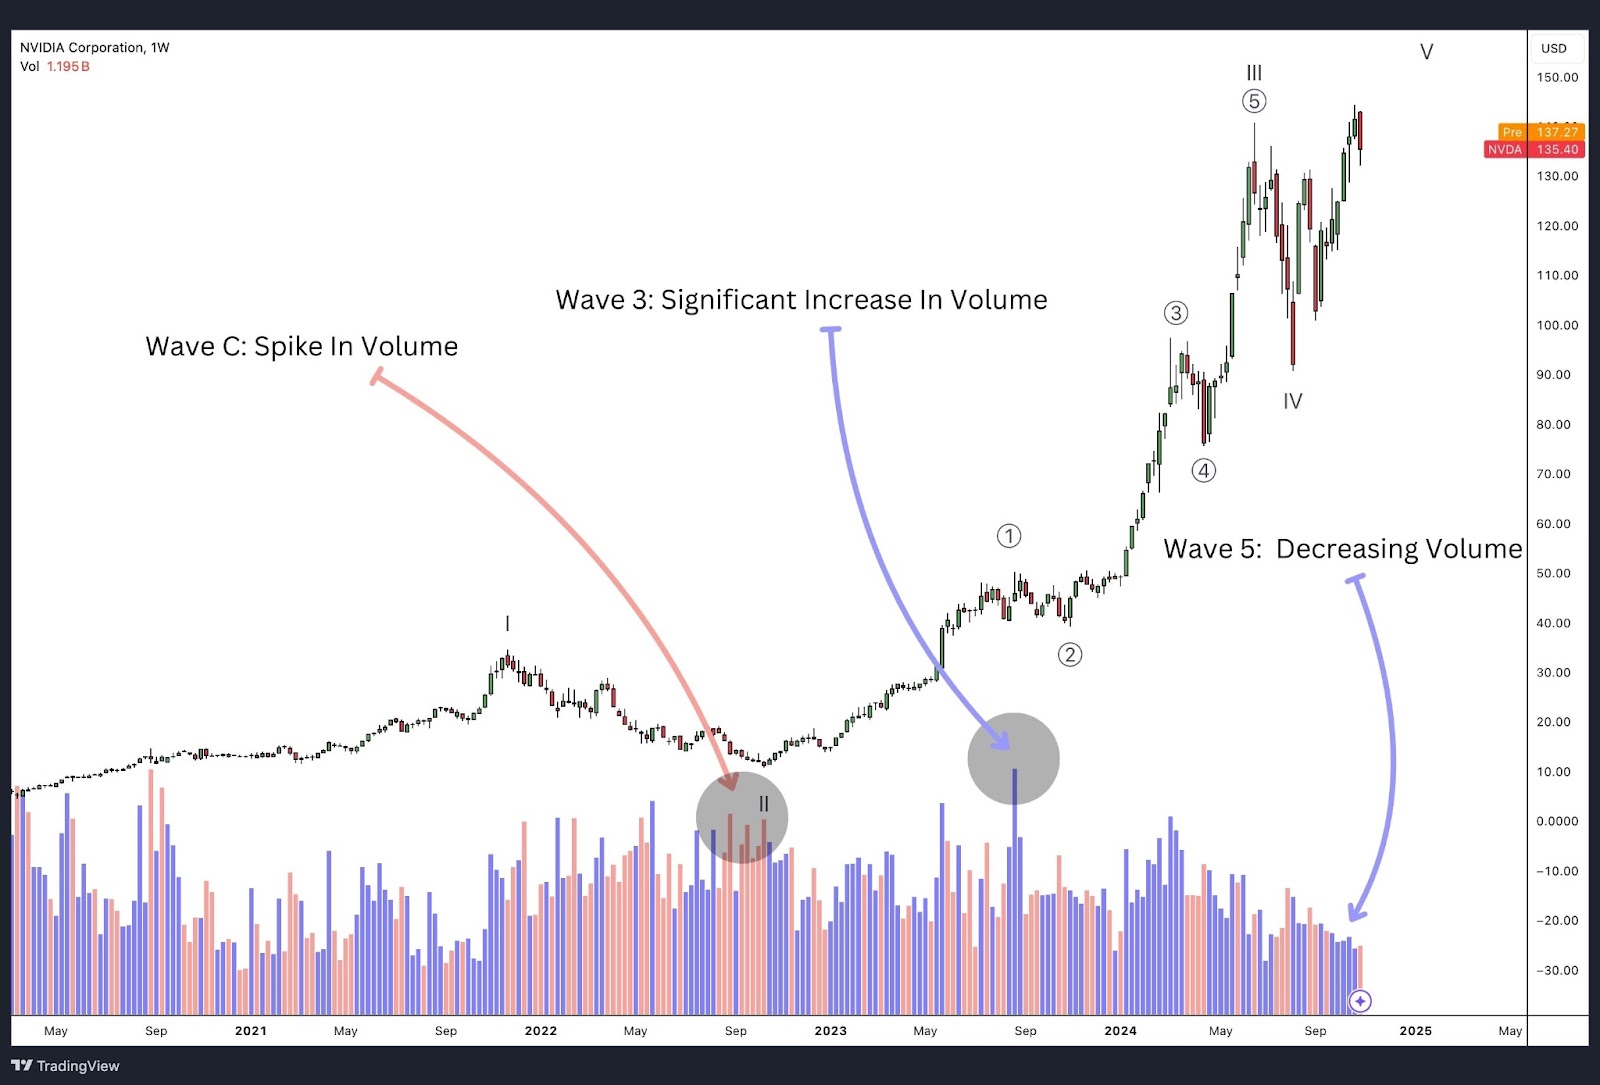
Volume is a critical indicator in Elliott Wave Theory, as it provides insights into the strength and commitment of market participants in each wave. Volume patterns vary between impulse and corrective waves, helping traders identify valid wave counts and anticipate potential reversals.
- Impulse Waves (Wave 3): Wave 3 is typically the most powerful wave in an impulse wave pattern, and it is usually accompanied by a significant increase in volume. High volume during Wave 3 confirms strong market participation and trend conviction, making it a reliable indicator of wave strength. If volume rises significantly in Wave 3, it aligns with the expectation of strong momentum, reinforcing the wave count.
- Wave 5: While Wave 5 completes the impulse sequence, volume is often lower compared to Wave 3. Decreasing volume during Wave 5 can signal a weakening trend, indicating that the impulse may be reaching exhaustion. If Wave 5 shows price divergence (as seen with RSI) along with declining volume, it’s a strong signal of an impending reversal or corrective phase.
- Corrective Waves (Waves A and C): Volume in corrective waves typically declines, reflecting weaker market participation as traders take profits or sit out of the market. However, in Wave C of a corrective pattern (like a zigzag or flat), there can be a spike in volume, especially if it represents a final push in the correction. Higher volume in Wave C may confirm that the correction is reaching completion and is likely to reverse soon.
By analysing volume alongside wave counts, Elliott wave traders can gauge the strength and validity of impulse waves and identify potential trend reversals, particularly at the end of Wave 5 or the completion of Wave C.
Common Mistakes to Avoid When Using Elliott Wave Theory
Elliott Wave Theory can be a powerful tool for analysing and predicting market trends, but it requires strict adherence to its principles and a disciplined approach. Here are some common mistakes traders make when applying Elliott Wave Theory, along with tips on how to avoid them.
1. Misidentifying 3-Wave and 5-Wave Moves
One of the most common mistakes is forcing a 5-wave sequence onto a structure that is actually a 3-wave move. Elliott Wave Theory distinguishes between impulsive 5-wave sequences and corrective 3-wave structures, each with specific characteristics. Misinterpreting one for the other can lead to incorrect predictions and missed opportunities. To avoid this, ensure that the internal structure aligns with either a true 5-wave or 3-wave pattern and avoid trying to force patterns where they don’t naturally fit.
2. Rushing to Complete Triangles
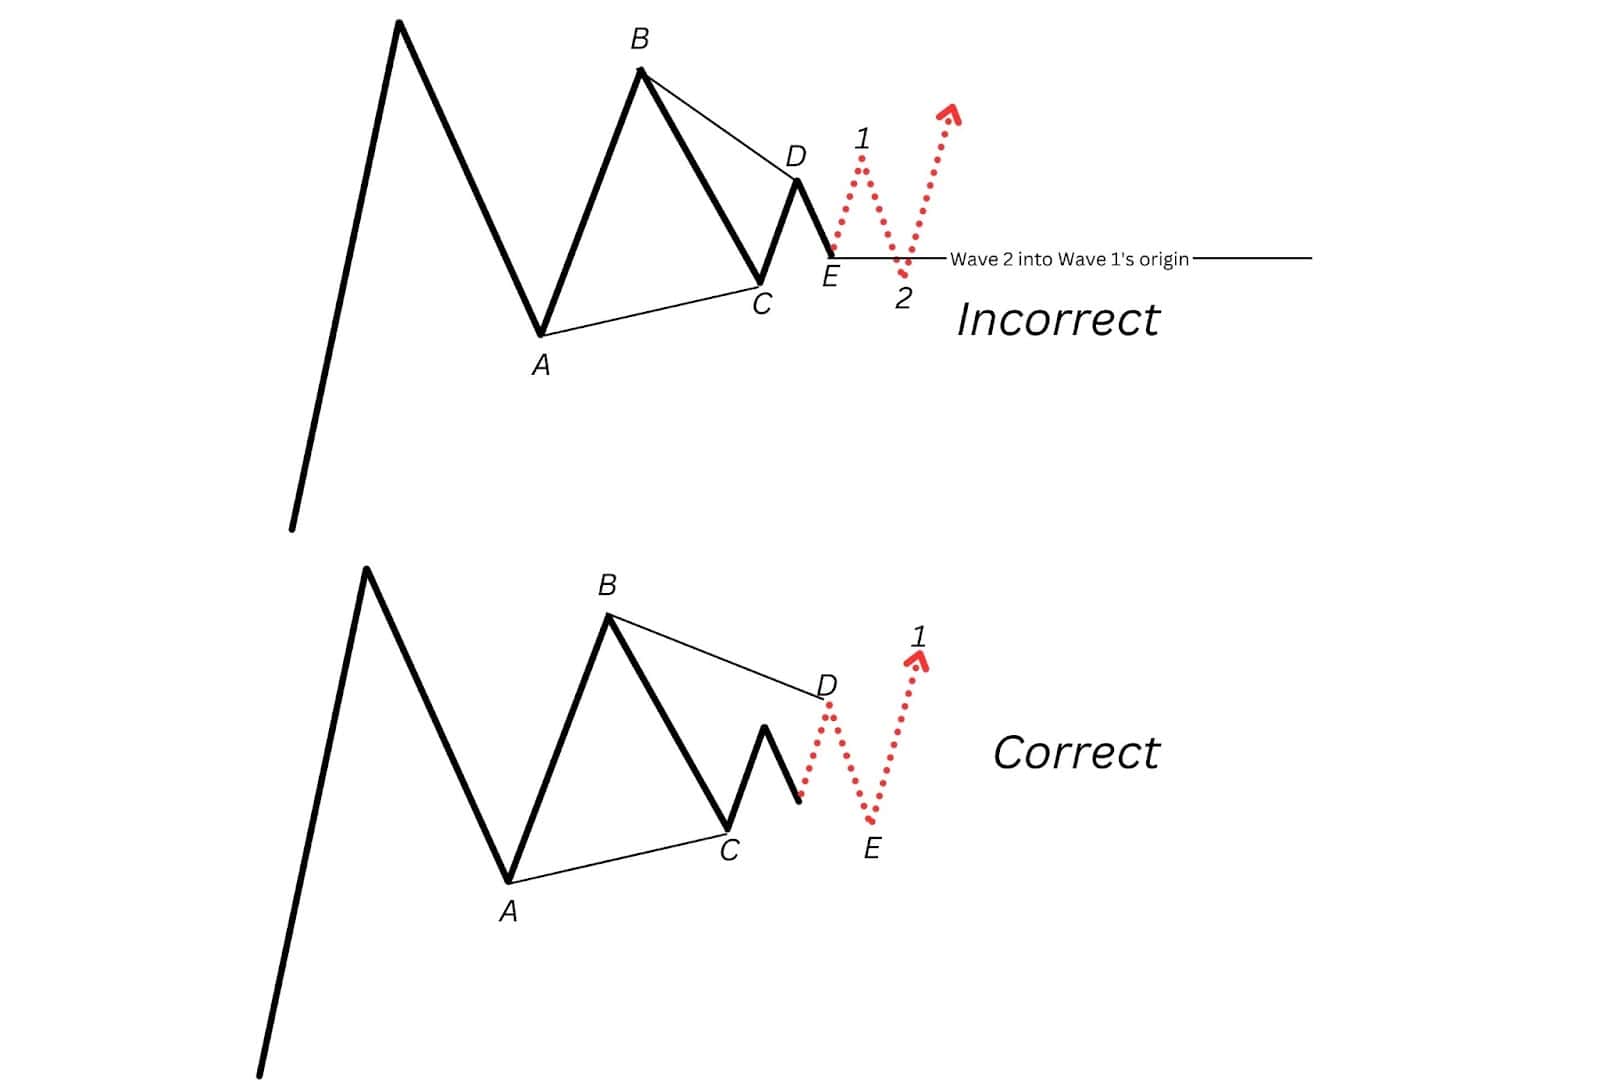
Triangles are complex patterns, and a common mistake is rushing to complete them without allowing Waves D and E to play out fully. This impatience can lead to prematurely labelling a triangle as complete when it still has further waves to unfold. A properly completed triangle typically has five clear waves labelled A-B-C-D-E. To avoid this mistake, be patient and wait for each part of the triangle to form, ensuring that Wave D and Wave E establish themselves significantly before calling the triangle complete.
3. Failing to Align Multiple Degrees of Trend
For a more reliable analysis, it’s essential to align at least two, ideally three degrees of trend that support your Elliott Wave count. Focusing on a single degree can lead to a narrow perspective that misses the broader market context. When multiple degrees align, they reinforce the wave count and make the predicted trend more robust. Ensure that your primary wave count aligns with higher and lower degrees of trend to confirm the accuracy of your analysis.
4. Not Preparing Alternative Counts
Elliott Wave Theory is based on probabilities, not certainties. Additionally, it provides wave structure clarity and deduces potential patterns down to a small number of options. It’s crucial to have alternative counts as backup scenarios in case the primary count doesn’t play out. Market conditions can change unexpectedly, and having alternative counts ensures that you’re prepared for different outcomes. Being flexible and ready to switch to an alternative wave count keeps you responsive and objective in the face of unexpected price action.
5. Not Counting from Significant Lows and Highs
Elliott Wave counts should start from significant lows or highs in the relevant degree of trend. Starting from a minor pivot can lead to an incorrect structure and misaligned wave count. Always begin counting from the most prominent high or low that marks the beginning of a new trend. This approach establishes a solid foundation for the wave count, allowing for more accurate identification of wave structures.
6. Bending the Rules
Elliott Wave Theory has three strict rules that must be followed for any valid wave count:
- Wave 2 must not retrace beyond the start of Wave 1.
- Wave 3 cannot be the shortest of the three impulse waves (1, 3, and 5).
- Wave 4 must not overlap Wave 1’s territory in an impulse (except in diagonals).
Traders sometimes bend these rules to make a wave count fit their analysis, but this compromises the integrity of the count. Stick to these rules strictly; violating them invalidates the wave structure.
7. Misunderstanding Wave Characteristics
Each wave in Elliott Wave Theory has unique characteristics, and misinterpreting these can lead to inaccurate counts. For instance:
- Wave 3 is typically the steepest and most powerful wave in an impulsewave pattern.
- Wave 4 is often choppy, sideways, and marked by consolidation or a complex correction.
Failing to recognise these traits can result in mislabeling waves and misjudging the trend’s strength. By understanding and respecting the personality of each wave, you can improve your wave counts and anticipate market behaviour with more accuracy.
The New Elliott Wave Principle – What is Changing in Today’s Market
In today’s rapidly evolving financial markets, Elliott Wave Theory is being reinterpreted to adapt to modern dynamics, particularly due to the rise of algorithmic and computer-based trading. Traditional Elliott Wave analysis was developed in a market dominated by human traders, whose emotional responses contributed to the formation of predictable wave patterns.
The Rise of Algorithmic and Computer-Based Trading
However, with the increasing dominance of algorithms and automated trading systems, market movements can now be heavily influenced by programmed strategies, high-frequency trading, and quantitative models.
These changes have led to more frequent and unpredictable short-term price fluctuations, sometimes disrupting the natural rhythm of waves. For example, algorithms may trigger buy or sell orders at key technical levels, amplifying certain waves or even causing unexpected extensions and corrections. This phenomenon often creates erratic and sudden moves that may not align with traditional Elliott Wave expectations, especially on smaller timeframes.
Despite these shifts, the core principles of Elliott Wave Theory—driven by crowd psychology and the fractal nature of markets—remain relevant. Analysts and traders are adapting by focusing on higher degrees of trend and combining Elliott Wave counts with modern technical tools and data-driven insights. This approach helps to filter out the “noise” caused by algorithmic trades while maintaining the broader market patterns that Elliott originally observed.
It’s Complicated – How to Study the Practical Part of the Elliott Wave Analysis?
Learning Elliott Wave Theory is a journey, and it’s essential to approach it patiently, step by step. Start with the basics and focus on mastering each individual wave—understanding the characteristics of Wave 1, Wave 2, and so on. Take your time to truly absorb how each pattern behaves within different market contexts. Avoid rushing into wave counting or making financial decisions too soon; instead, develop a feel for the market’s rhythm and patterns.
Study with passion, not solely for profit. Passion for the process will build a deeper understanding over time, and ultimately, it will pay off in your trading. Elliott Wave Theory is complex, and it’s perfectly normal for it to take years to fully grasp. Don’t hesitate to revisit certain concepts or sections repeatedly as you refine your skills. Mastery in Elliott Wave Theory is a gradual process, so embrace the learning curve and stay committed to continuous improvement.
How to Read Elliott Wave Charts
Reading Elliott Wave charts involves identifying and labelling the wave patterns according to the basic structure of Elliott Wave Theory. Here’s a straightforward guide to get started:
- Understand the Basic Wave Structure
Begin by familiarising yourself with the core components: the five-wave impulse wave pattern and the three-wave corrective pattern. An impulse wave pattern (moving in the direction of the main trend) consists of five waves, labelled 1, 2, 3, 4, and 5. Corrective patterns (moving against the trend) typically have three waves, labelled A, B, and C. Recognising these structures is fundamental to reading any Elliott Wave chart. - Identify the Starting Point
Start from a significant high or low in the chart, as this marks the beginning of a potential new trend. This starting point should ideally be the most prominent turning point within the timeframe you’re analysing. - Label the Waves
Follow the price action and begin labelling each wave in sequence, keeping in mind the rules. - Check for Patterns and Sub-Waves
Elliott Wave charts are fractal, meaning each wave can be divided into smaller sub-waves that follow the same pattern. For example, in a larger Wave 1, you may find five smaller waves that make up that entire wave. Understanding this fractal nature allows you to drill down into lower degrees (smaller waves within larger ones) or zoom out to observe higher degrees (larger waves that contain smaller patterns). - Apply Fibonacci Ratios
Use Fibonacci retracement and extension tools to estimate where each wave might end. For example, Wave 2 often retraces between 50% and 61.8% of Wave 1, while Wave 3 commonly extends to around 1.618 times the length of Wave 1. These ratios help confirm wave counts and provide price targets. - Use Multiple Degrees of Trend
A good Elliott Wave chart will show at least two degrees of trend—such as a primary degree and an intermediate degree—to confirm the analysis. Ensure that the larger and smaller wave patterns align to create a cohesive structure. - Look for Wave Characteristics
Each wave has a unique personality. Wave 3 is often the most powerful and steep, while Wave 4 is generally choppy and sideways. Understanding these personalities helps to confirm wave positions within the pattern. - Validate with Other Indicators
To strengthen your analysis, cross-reference your wave counts with indicators like RSI, moving averages, or volume. High volume and momentum on Wave 3, or divergence in Wave 5, can validate your wave count and signal potential reversals.
Elliott Wave Theory Glossary
This is not an exhaustive list, but it covers some of the most common terms used in Elliott Wave Theory.
- Impulse Wave Pattern: A five-wave structure that moves in the direction of the main trend.
- Corrective Wave: A three-wave structure that moves against the main trend, labelled A-B-C.
- Wave 1: The first wave in an impulse sequence, marking the start of a new trend.
- Wave 2: A corrective wave that retraces part of Wave 1 but does not go beyond its origin.
- Wave 3: The strongest wave in an impulse wave pattern, usually extending beyond 1.618 times the length of Wave 1.
- Wave 4: A corrective wave that often retraces up to 38.2% of Wave 3 but does not overlap with Wave 1.
- Wave 5: The final wave in an impulse sequence, often showing signs of trend exhaustion.
- Wave A: The first wave in a correction, moving against the previous impulse.
- Wave B: The second wave in a correction, usually retracing a portion of Wave A.
- Wave C: The third wave in a correction, often equal in length to Wave A.
- Zigzag: A sharp, three-wave corrective pattern (A-B-C) where Wave A and Wave C move in the same direction.
- Flat: A sideways, three-wave corrective pattern (A-B-C) where all waves are roughly equal in length.
- Triangle: A five-wave corrective pattern (A-B-C-D-E) that moves sideways and typically appears in Wave 4 or Wave B.
- Double Three: A complex corrective pattern composed of two simple corrections connected by an X wave.
- Triple Three: A complex corrective pattern composed of three simple corrections, with two X waves acting as connectors.
- Diagonal: A pattern resembling a wedge, which can appear as either an ending or leading structure.
- Fibonacci Retracement: A level used to identify potential support or resistance within corrective waves, often at 38.2%, 50%, or 61.8%.
- Fibonacci Extension: A projection level for impulse waves, with common targets like 1.618 or 2.618 times the preceding wave.
- 1-2, 1-2 Pattern: A nested setup indicating a strong trend, where the initial wave subdivides into two smaller degrees of 1-2 waves.
- Alternation: A guideline suggesting that Wave 2 and Wave 4 in an impulse sequence will have different corrective patterns.
- Fractal: The concept that Elliott Wave patterns repeat at different degrees of trend.
- Degree of Trend: A classification of wave size, such as Grand Supercycle, Supercycle, Cycle, Primary, Intermediate, etc.
- Wave Count: The process of labelling and identifying waves within a market to predict future movements.
- Invalidation Level: A price level that, if reached, invalidates the current wave count.
- Right Look: Ensuring that the wave count visually aligns with Elliott Wave rules and guidelines.
- Extension: An unusually long wave within an impulse, typically seen in Wave 3 or Wave 5.
FAQ
What do the critics say about Elliott Wave Theory?
Critics argue that Elliott Wave Theory is overly subjective, as wave counts can vary depending on the analyst, making it difficult to apply consistently. They also claim that wave patterns are often only clearly identifiable in hindsight, which limits the theory’s reliability for forward-looking predictions. However, with the proper training, Elliott wave can used to forecast based on the current pattern in development.
Is the Elliott Wave Theory reliable?
Elliott Wave Theory can be reliable when applied correctly, particularly with strict adherence to its rules and guidelines. However, it requires experience and can be prone to misinterpretation. Many traders use it as one tool among others rather than relying on it exclusively.
Which is more reliable, Elliott Waves or Candlestick Patterns?
Both have their strengths. Elliott Waves provide a comprehensive framework for understanding market cycles and trends, while candlestick patterns are simpler and can be effective for spotting immediate price action signals. The two methods can complement each other when used together.
How important is Elliott Wave Theory?
Elliott Wave Theory is highly regarded in technical analysis for its ability to offer insights into market psychology and trends. It’s especially valuable for long-term market forecasting and for traders looking to understand underlying wave structures in price movements.
How often do traders use Elliott Wave Theory for analysing stock market prices?
While not every trader uses Elliott Wave Theory, it is popular among those focused on technical analysis, particularly swing and long-term traders. It’s often used in conjunction with other tools to strengthen market forecasts.
Is Elliott Wave Theory bullish or bearish?
Elliott Wave Theory itself is neutral; it provides a framework for analysing both bullish and bearish trends. Its structure identifies the progression of trends and corrections, allowing traders to interpret both upward and downward movements.
What is the history of Elliott Wave Theory?
Ralph Nelson Elliott developed Elliott Wave Theory in the 1930s after studying 75 years of market data. His observations on recurring patterns in market psychology led to a predictive model for financial markets. In 1935, Elliott famously used his theory to predict a stock market bottom. Today, Elliott Wave International is the largest firm dedicated to this type of analysis.
What is the best indicator for Elliott Wave?
The best indicators to use with Elliott Wave Theory include RSI, MACD, Elliott Wave Oscillator (EWO), and volume. RSI helps spot overbought/oversold conditions and divergence in Wave 5, signalling reversals. MACD reveals momentum shifts, confirming a strong Wave 3 and a weakening Wave 5. EWO aids in wave counting by marking peaks at Wave 3 tops, while volume supports wave strength, with high volume in Wave 3 and tapering volume in Wave 5 indicating possible trend exhaustion. Together, these indicators provide additional precision and confidence in wave analysis.


