Bearish
- November 26, 2024
- 20 min read
Tweezer Top Trading Guide
What is a Tweezer Top Candlestick Pattern?
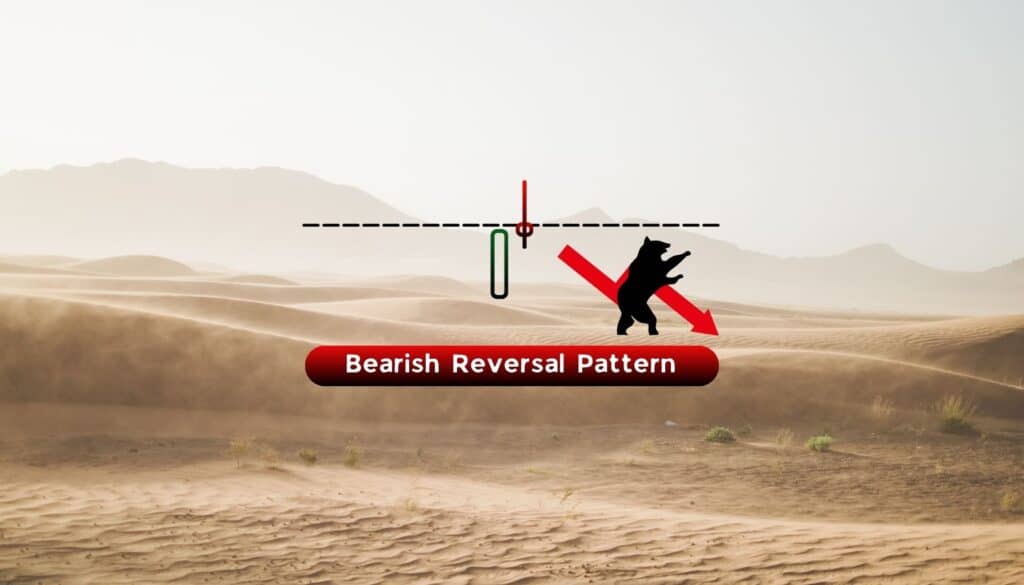
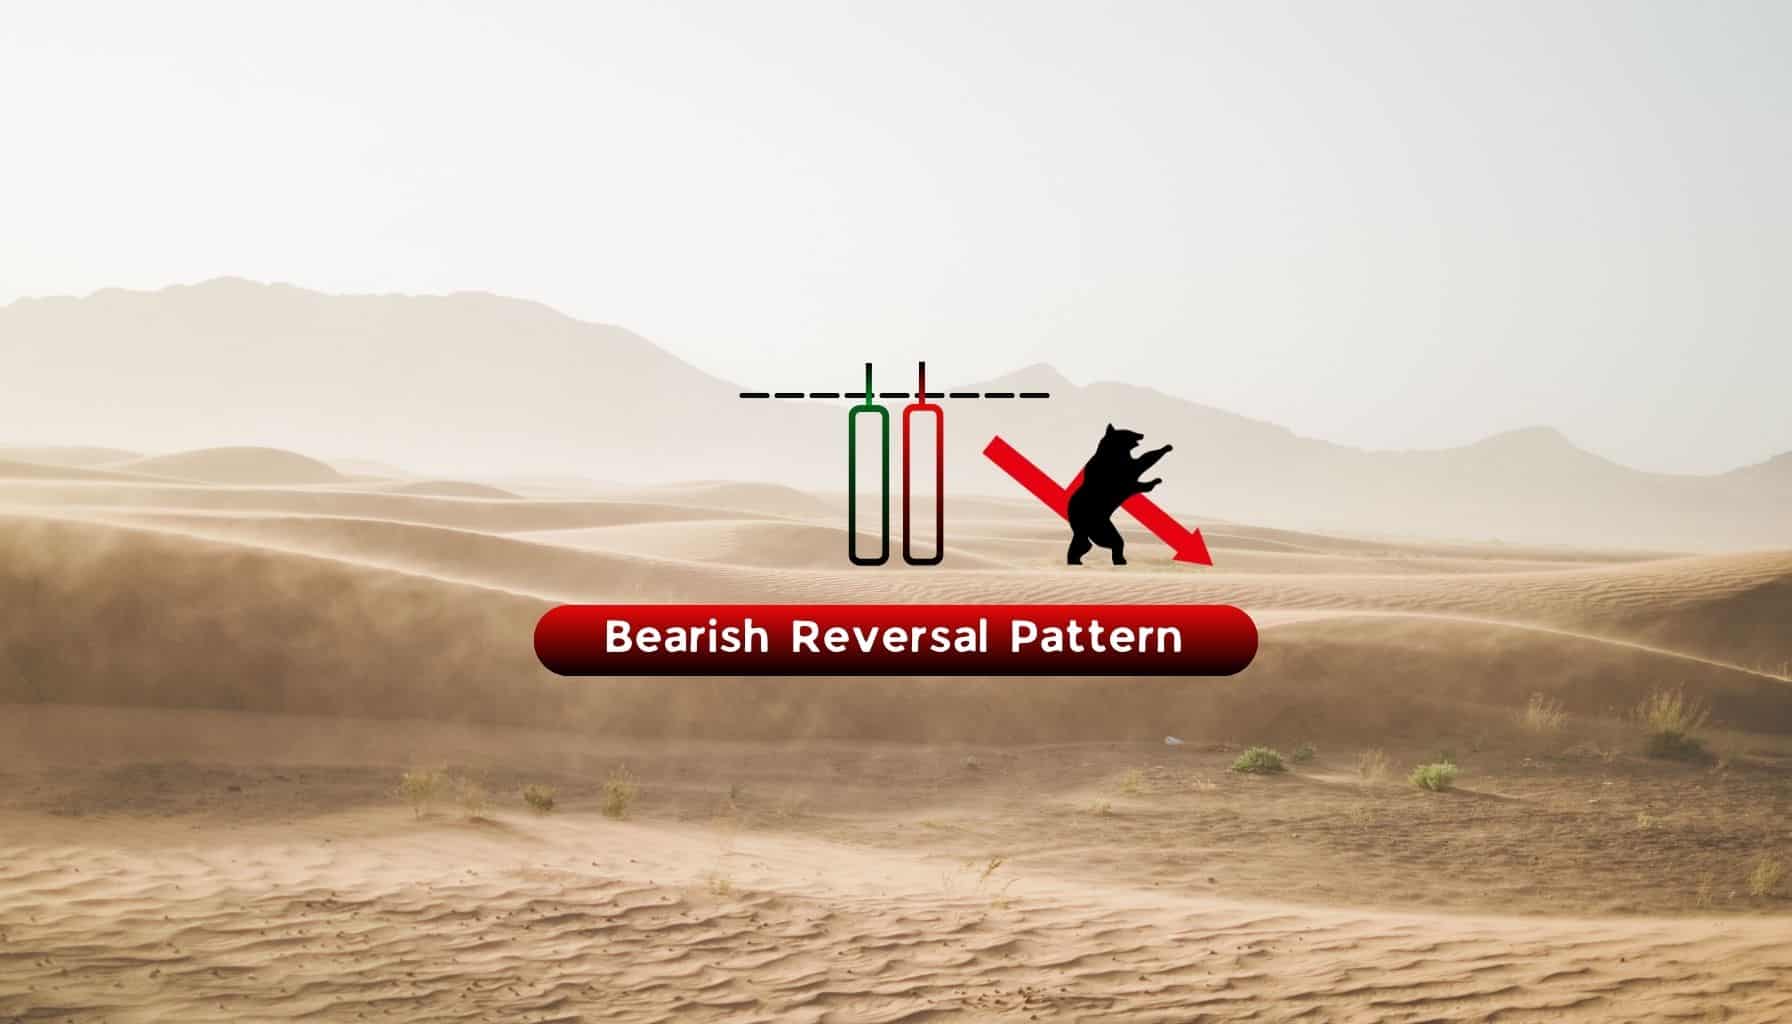
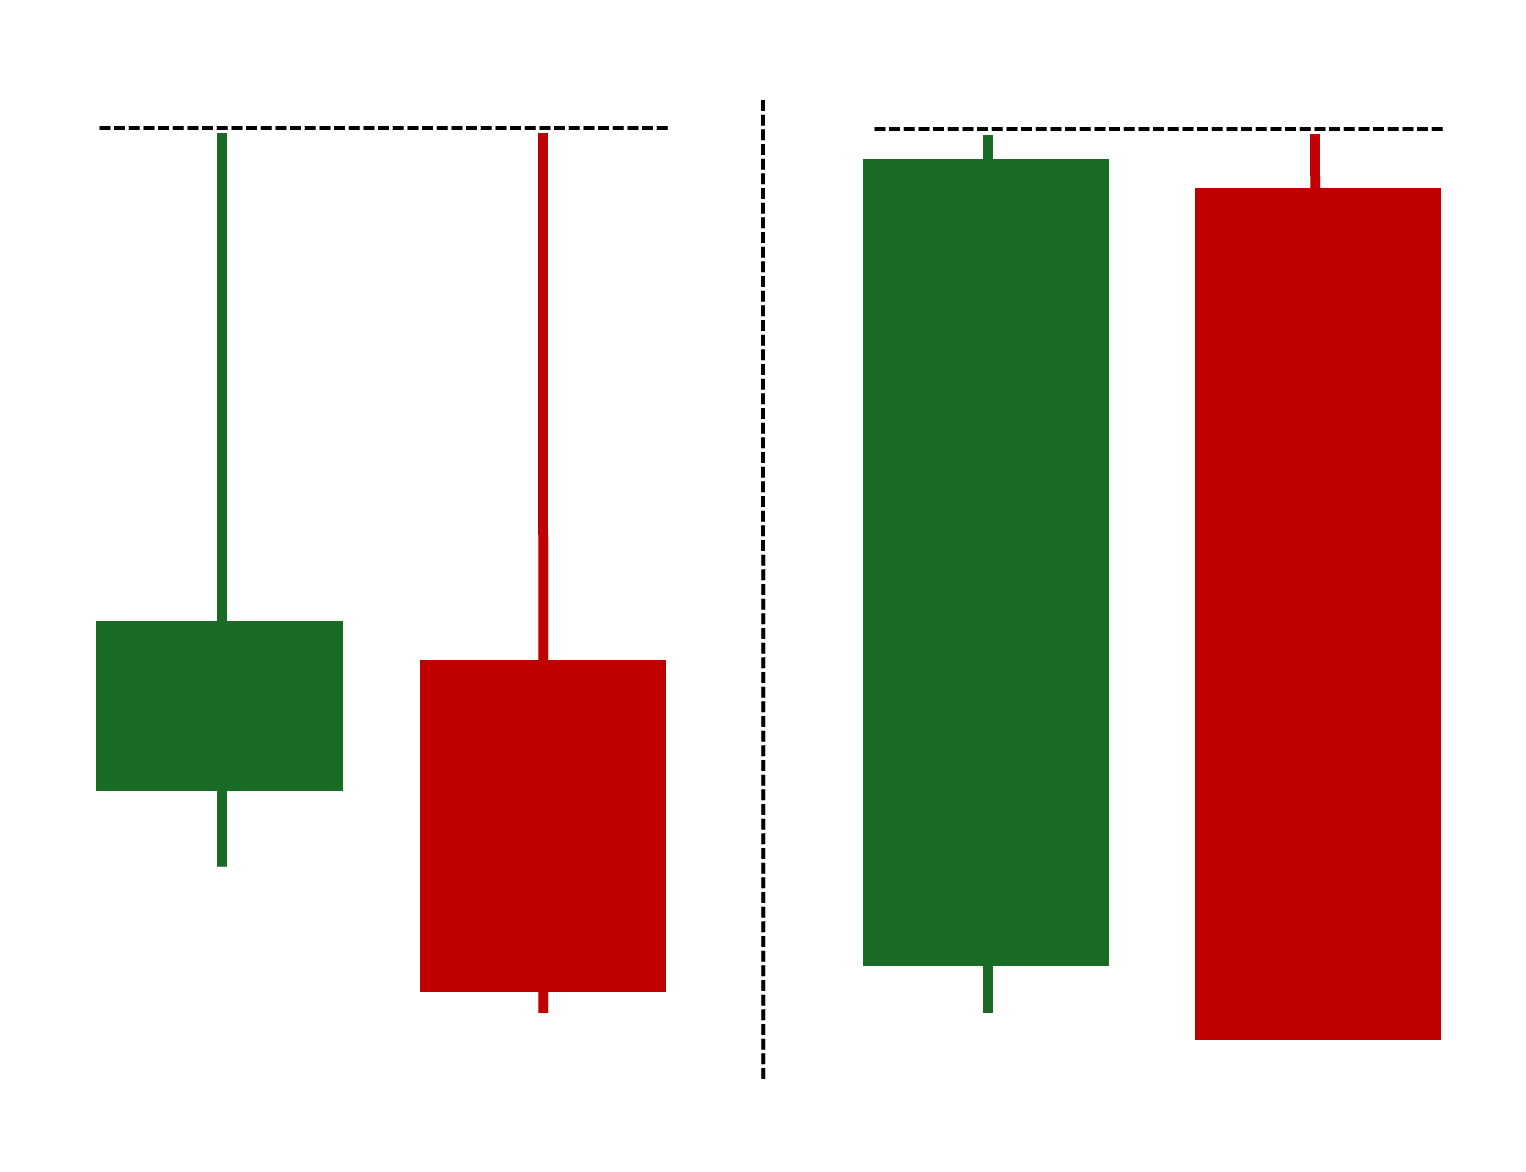
A tweezer top, also known as a bearish tweezer, is a two-candlestick bearish reversal pattern where the top of both candles are identical, or nearly identical in price. The pattern indicates a possible end to an ongoing uptrend (upward price trend). When the bearish tweezer appears either at the asset’s highest price level during an uptrend or at the end of a bullish move (retracement) within a downtrend, it can signal a bearish reversal. Essentially, this pattern acts as a “ceiling” price point that may eventually trigger a sharp reversal from the prior upward move to the downside.
What Does the Tweezer Top Candlestick Pattern Tell You?
The tweezer top illustrates how overall market sentiment is shifting against the bullish momentum needed to keep the uptrend intact (i.e., drive the price further upward). This occurs due to increasing selling pressure at elevated price levels, which forms a significant resistance that prevents further bullish advance. This build-up of selling pressure (i.e., bearish momentum) can then initiate a countermove to the downside—which is why this tweezer pattern is labeled as bearish reversal patterns.
How to Identify the Tweezer Top Candlestick Pattern?
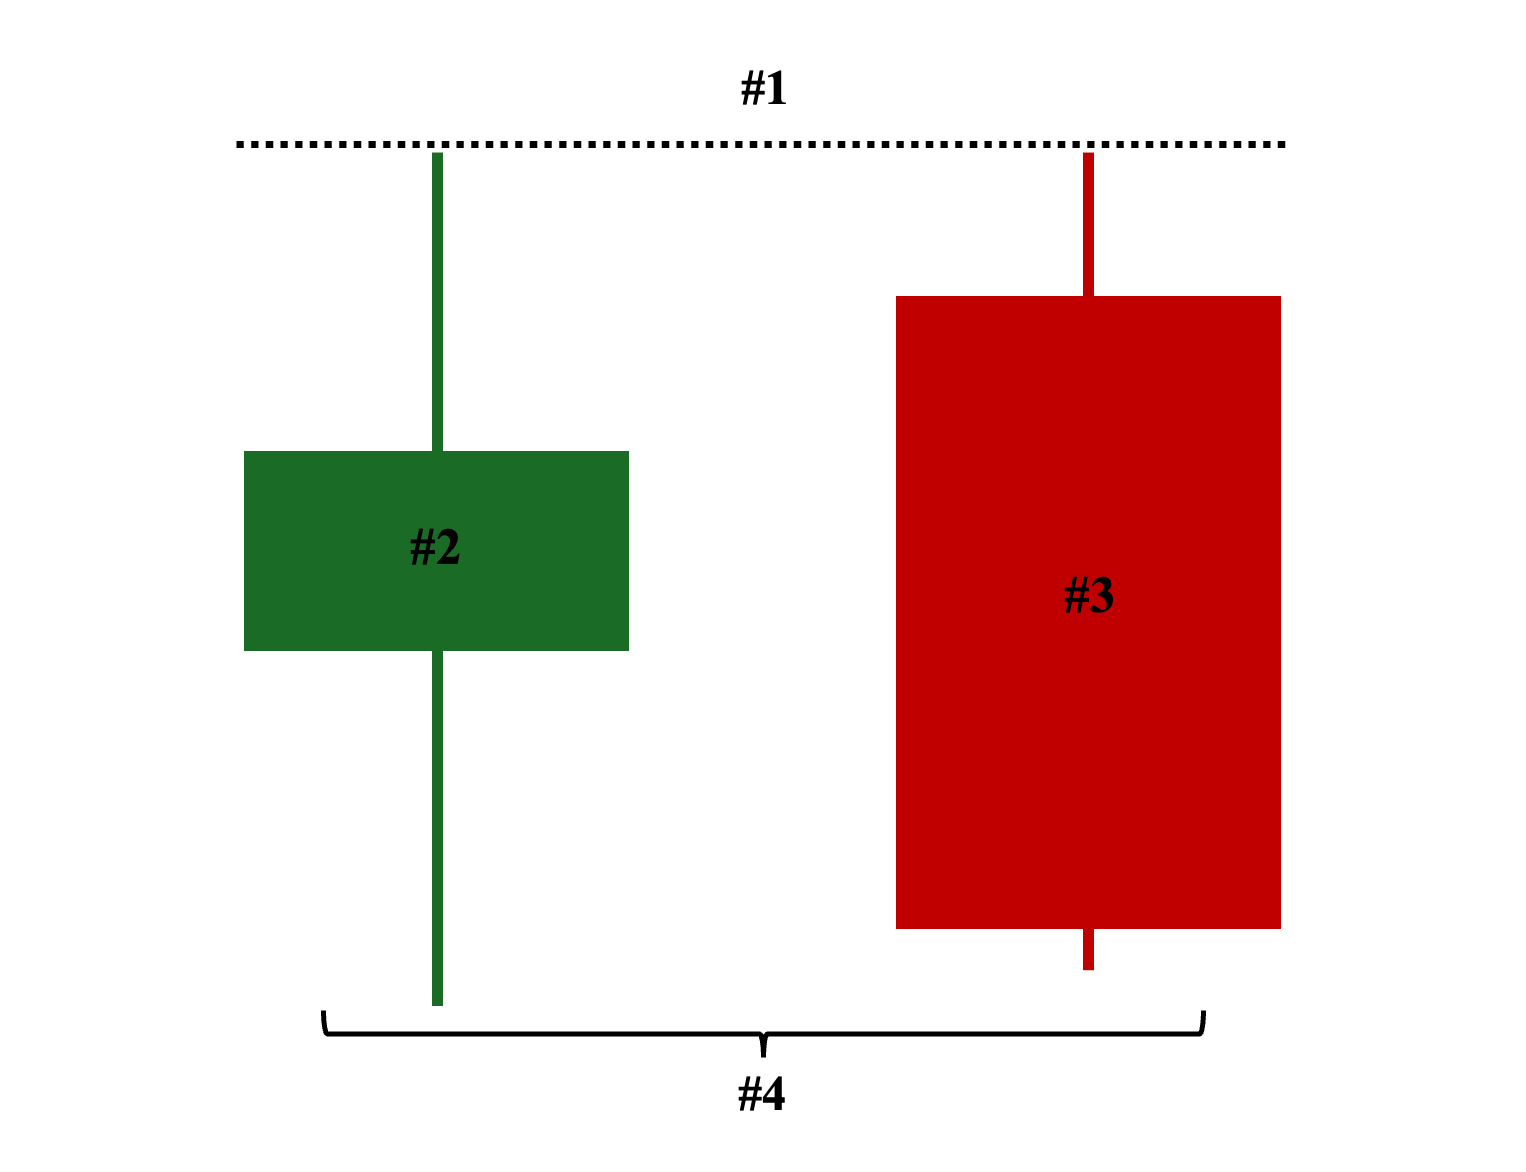
Here are the four crucial criteria for pinpointing a valid tweezer top pattern on a price chart:
- Price Level: The two candlesticks must have identical or near-identical highs.
- First Candle: It must be a bullish candle—to signify that it is still part of the upward move.
- Second Candle: Ideally, a bearish candle (a neutral candle remains valid but less ideal)— to denote the starting point of a shift in market sentiment.
- Chart Position: The two consecutive candles must appear at the highest point of an ongoing uptrend or during a major retracement or bounce in a downtrend.
Variants of the Tweezer Top Candlestick Pattern
Here are the different variants of tweezer candles you are most likely to encounter on an actual price chart (with unique chart patterns):
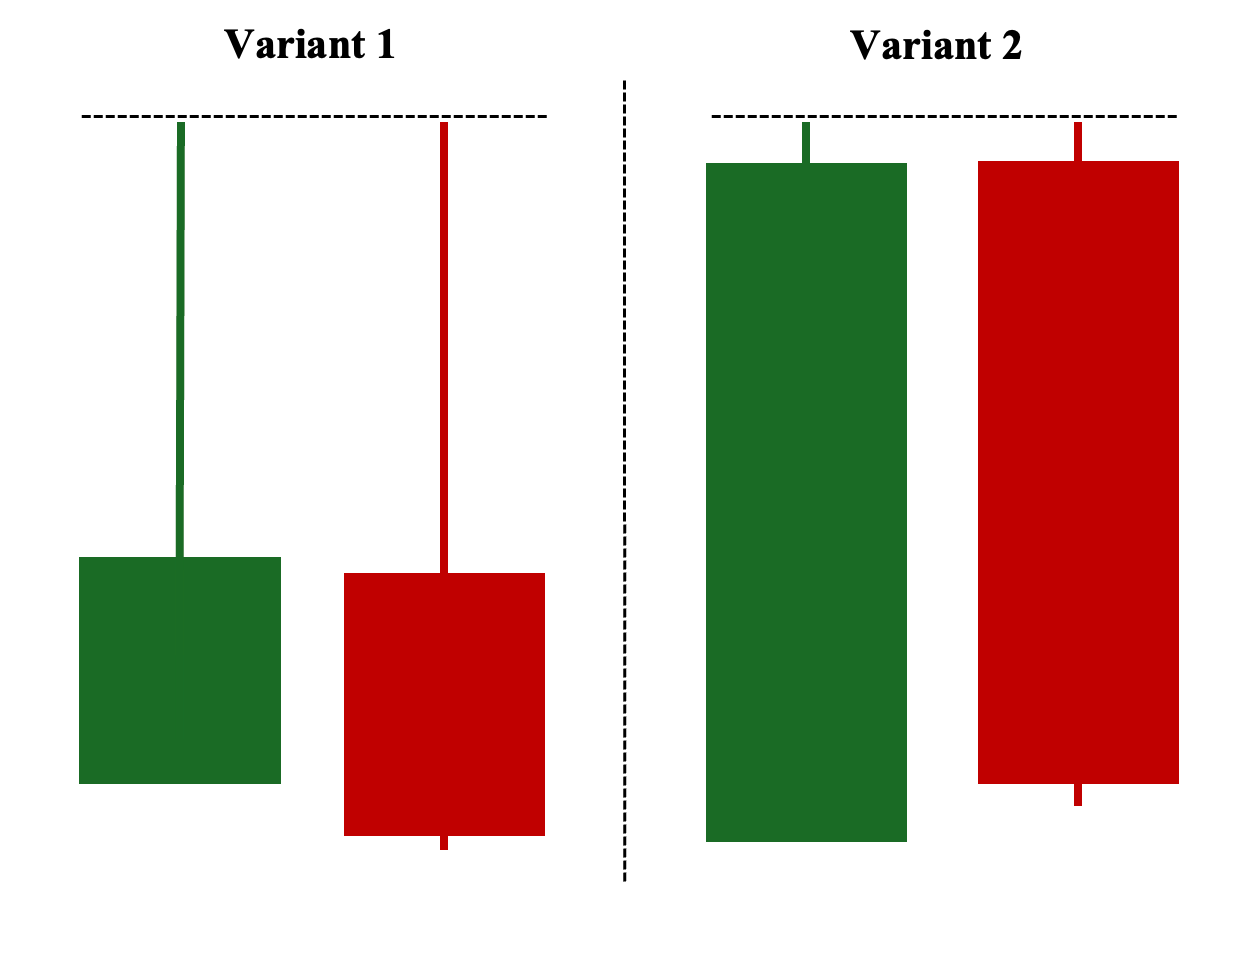
Shown above are the two standard variants of tweezer tops. The first variant consists of two consecutive candlesticks, both having long shadows and relatively shorter real bodies. In contrast, the second variant consists of two consecutive candles with long real bodies but much shorter shadows. Nevertheless, despite both variations being considered valid formations, the first variation arguably provides a much stronger signal for upward trend reversals. This is because the long top shadow from the first bullish candle already indicates strong selling pressure, pushing the price to close lower.
Then, the second bearish candle attempts once again to break this area of strong selling pressure but fails. The first variant illustrates two attempts and rejections at the high. Hence, this signals a likely start of a bearish reversal, compared to the second variant, which does not clearly show a strong area of selling pressure.
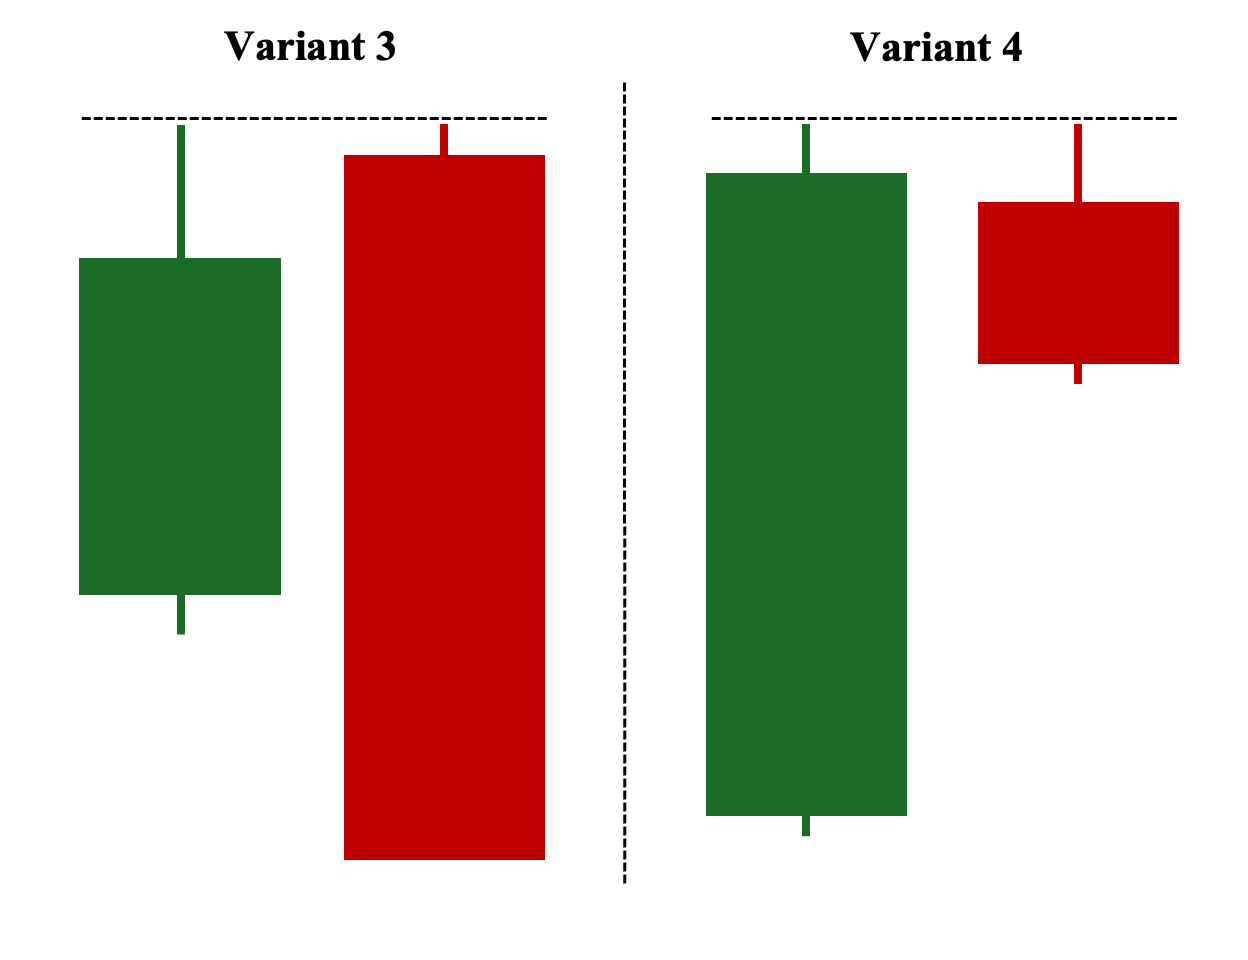
Here, the third variant is also considered a bearish engulfing pattern—where the entire range of the first bullish candlestick is engulfed or covered by the second bearish candlestick, demonstrating the strength of the second candle’s selling pressure. This makes it an even stronger pattern for potential trend reversals.
On the other hand, the fourth variant is considered an inside bar, where the first candlestick covers the entire range of the second (often much shorter) candle. On its own, an inside bar signifies indecision about the trend’s next move and requires a confirmation candle to validate whether it’s a reversal or continuation pattern. However, when the inside bar’s two consecutive candlesticks’ pattern forms a similar high, then it reinforces a possible reversal signal.
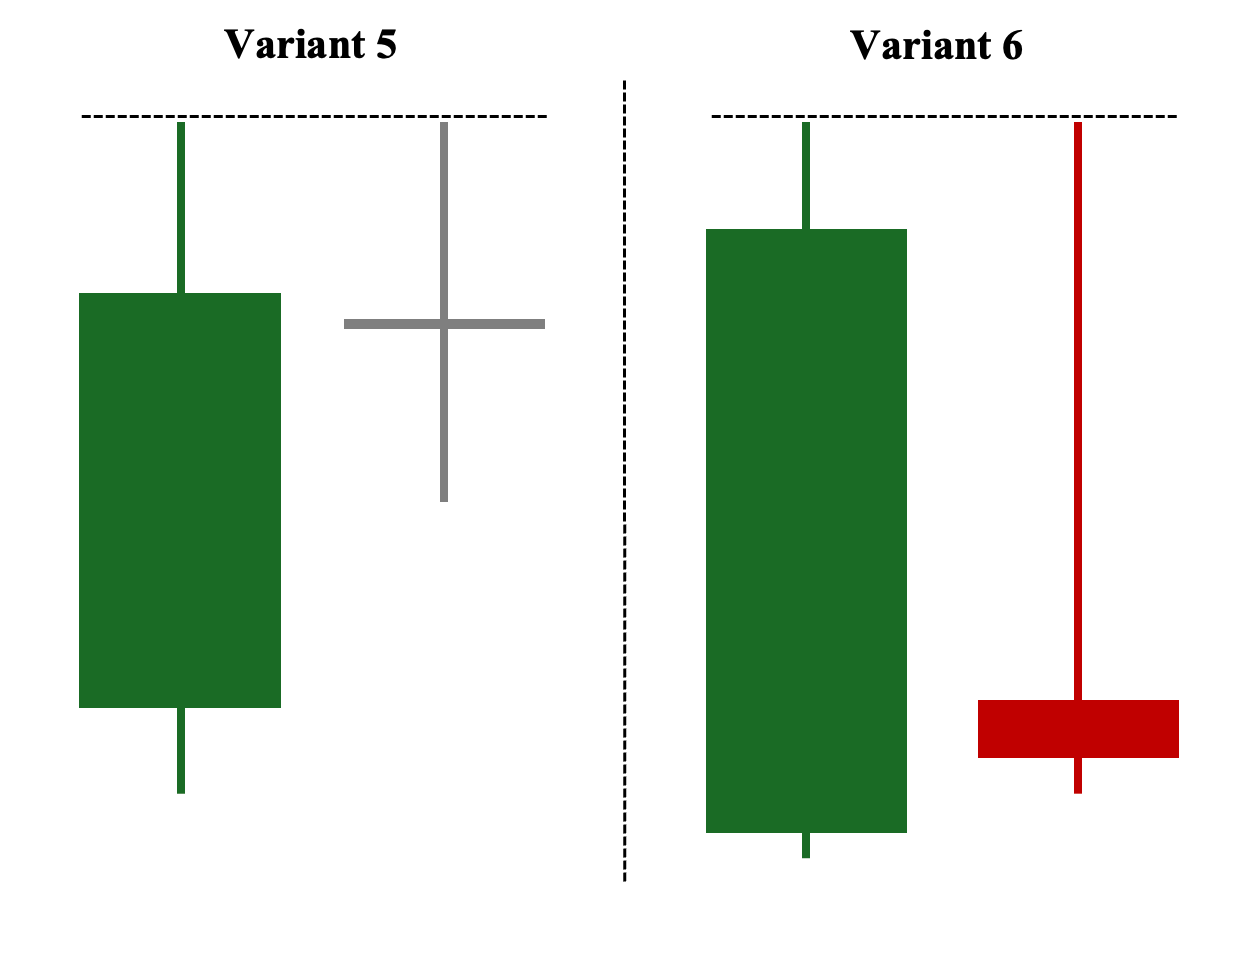
The fifth variant of tweezer tops features a neutral candle or some variation of a doji. While this remains a valid tweezer top pattern, it is generally considered a less reliable signal for trend reversals. This is because, unlike a bearish candlestick, a doji may simply indicate a pause rather than an outright reversal. Also, even if we look at the volume—regardless of whether it is below or above average—it does not confirm a clear direction.
Lastly, the sixth variant consists of a bullish candlestick followed by a one-candlestick reversal formation known as an inverted hammer or bearish pin bar as the second candle. Essentially, it signals a rejection of higher prices, as evidenced by the long upper shadow. Nevertheless, the second candle must have above-average volume, as low volume could mean only a temporary pause before the upward move resumes.
Tweezer Top Candlestick Pattern Examples
Here are three different responses from the market to a tweezer top candlestick pattern:
Example #1: Successful Trend Reversal Play Scenario (Uptrend to Downtrend)
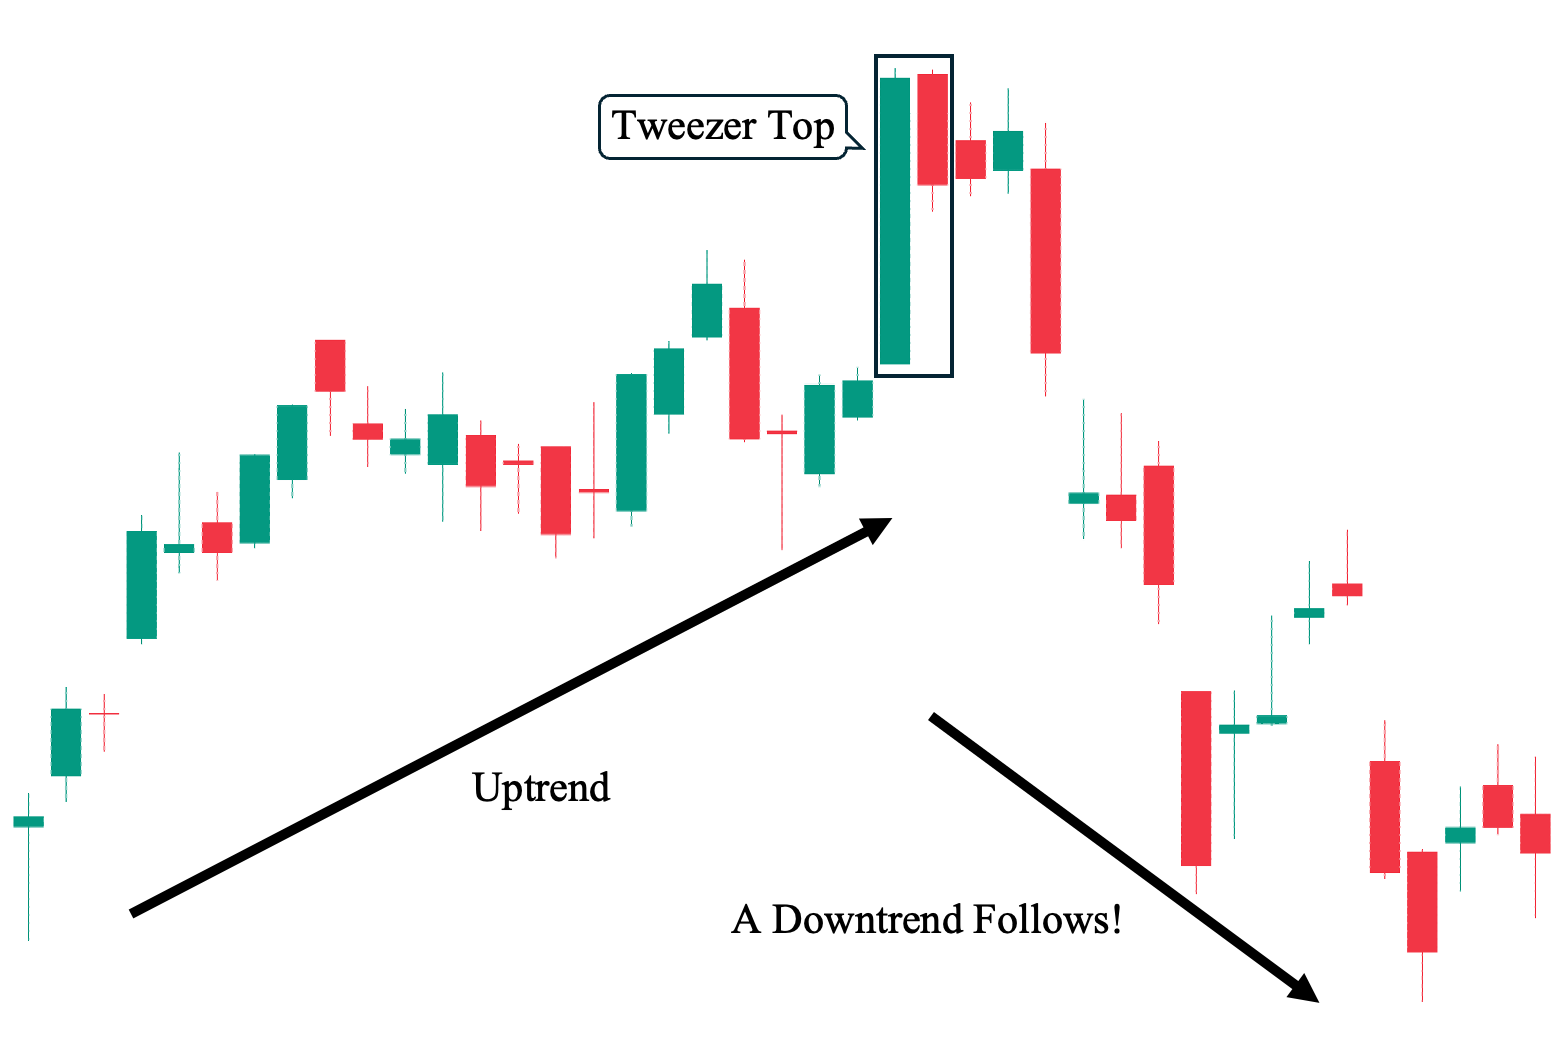
As shown, there was a clear upward trend before the tweezer top pattern forms. As discussed in the earlier sections, the two candlesticks meet the criteria of having nearly identical highs. It then successfully served as a bearish reversal signal, as we can see a downtrend that eventually followed. Nevertheless, this is the best-case scenario when using tweezer tops to guide any of your trading decisions.
Example #2: Failed Trend Reversal Scenario (Uptrend Continues)
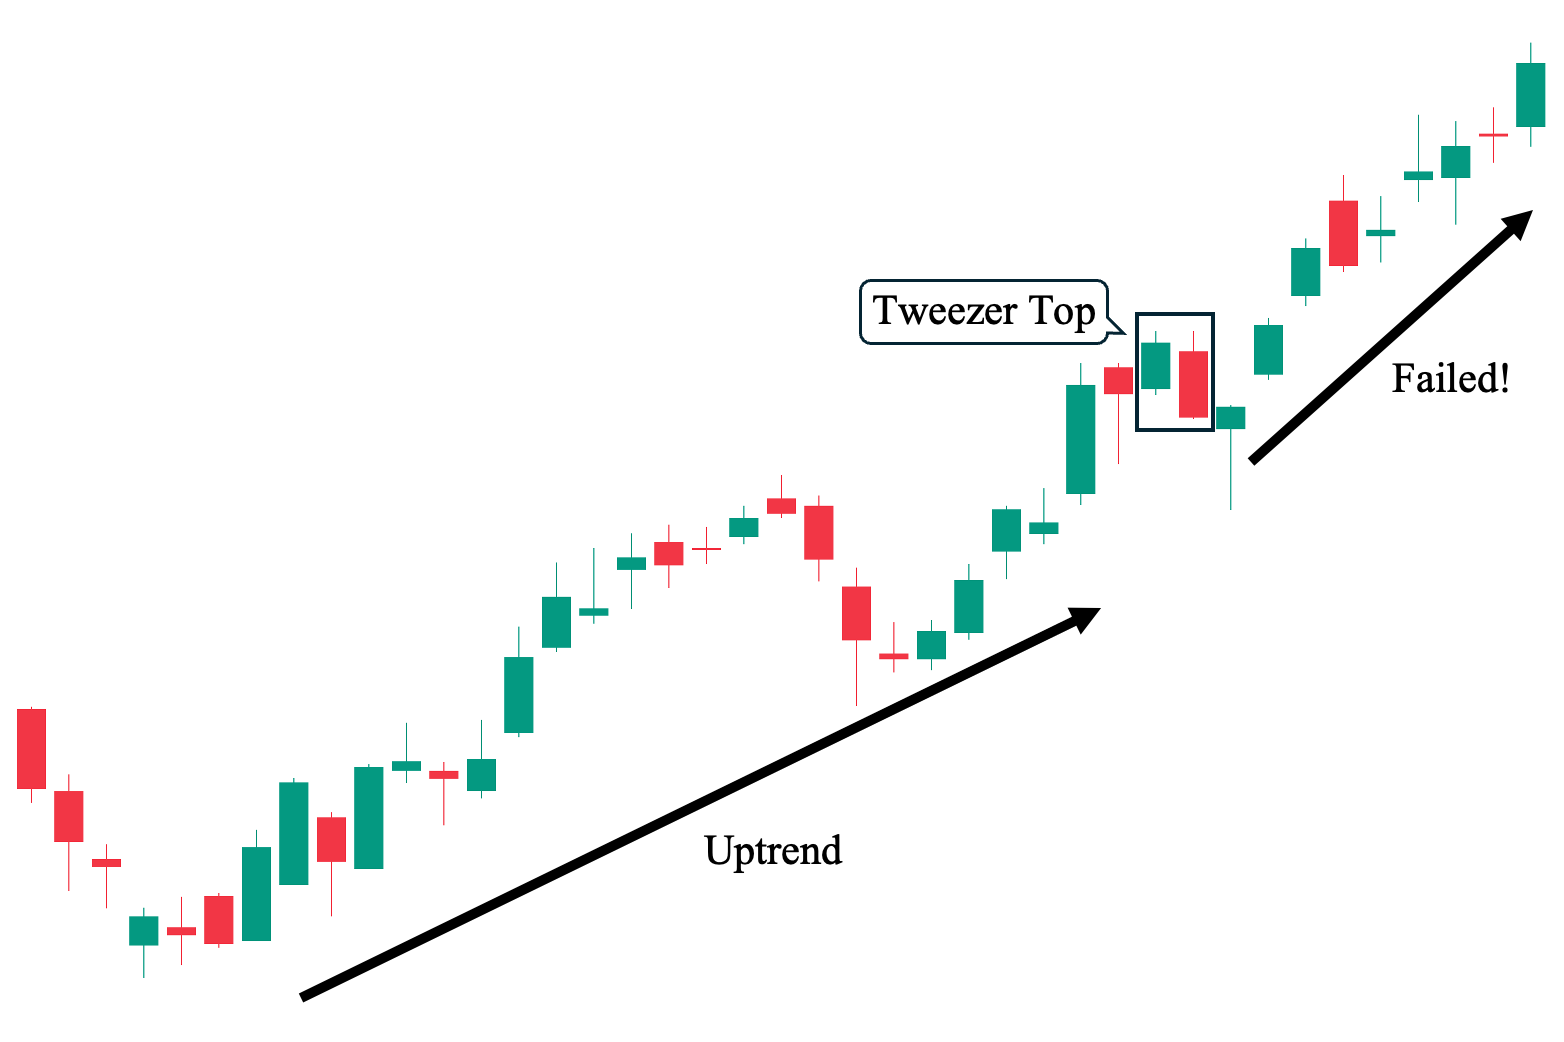
In sharp contrast to our first example, while we can also observe a prior upward price trend before the tweezer top pattern forms, it did not successfully serve as a reversal signal. This is despite the fact that the two candlesticks technically satisfied the pattern’s validity requirements. This represents our worst-case scenario and demonstrates that this candlestick pattern is imperfect and, in fact, can often fail, especially without considering the entire market context—which we will discuss in the following sections.
Example #3: Indecisive Outcome Scenario (Uptrend to Sideways)
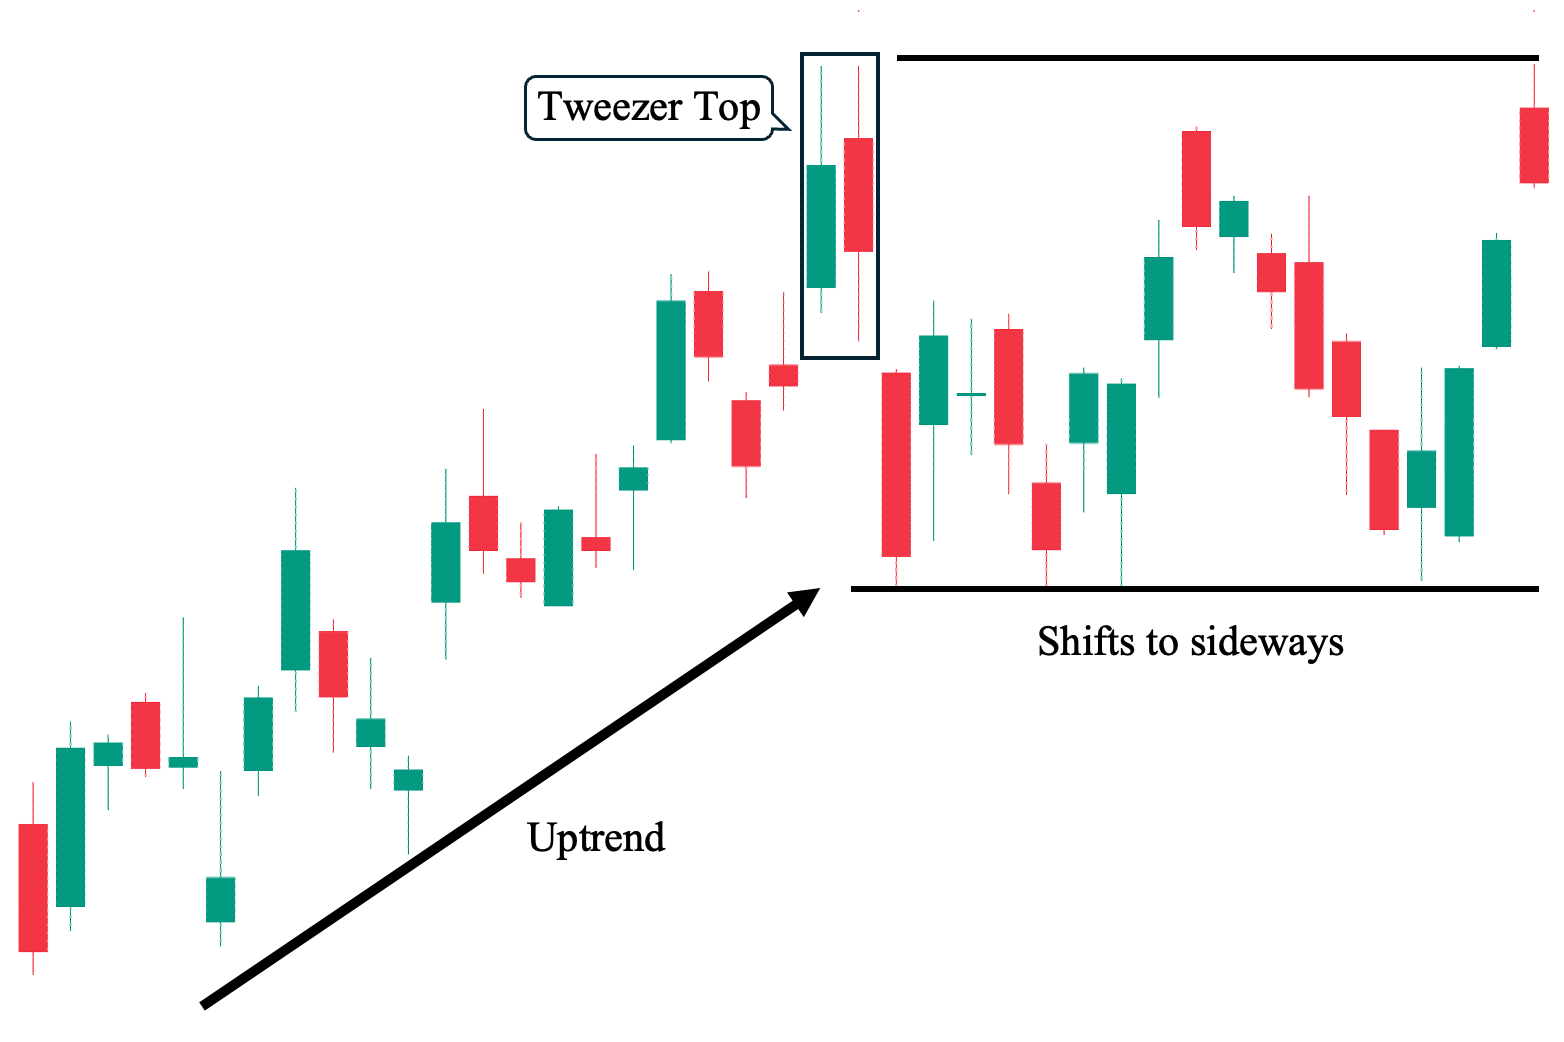
Our third likely scenario is when the pattern does not lead to either an uptrend or a downtrend. As shown, there was a prominent upward price trend before the formation of the tweezer top pattern (notice the same high price of the two candlesticks). Nevertheless, it resulted in a sideways price movement, establishing a clear support and resistance area, with the tweezer top’s high serving as the new resistance.
Tweezer Top Forex Example 4
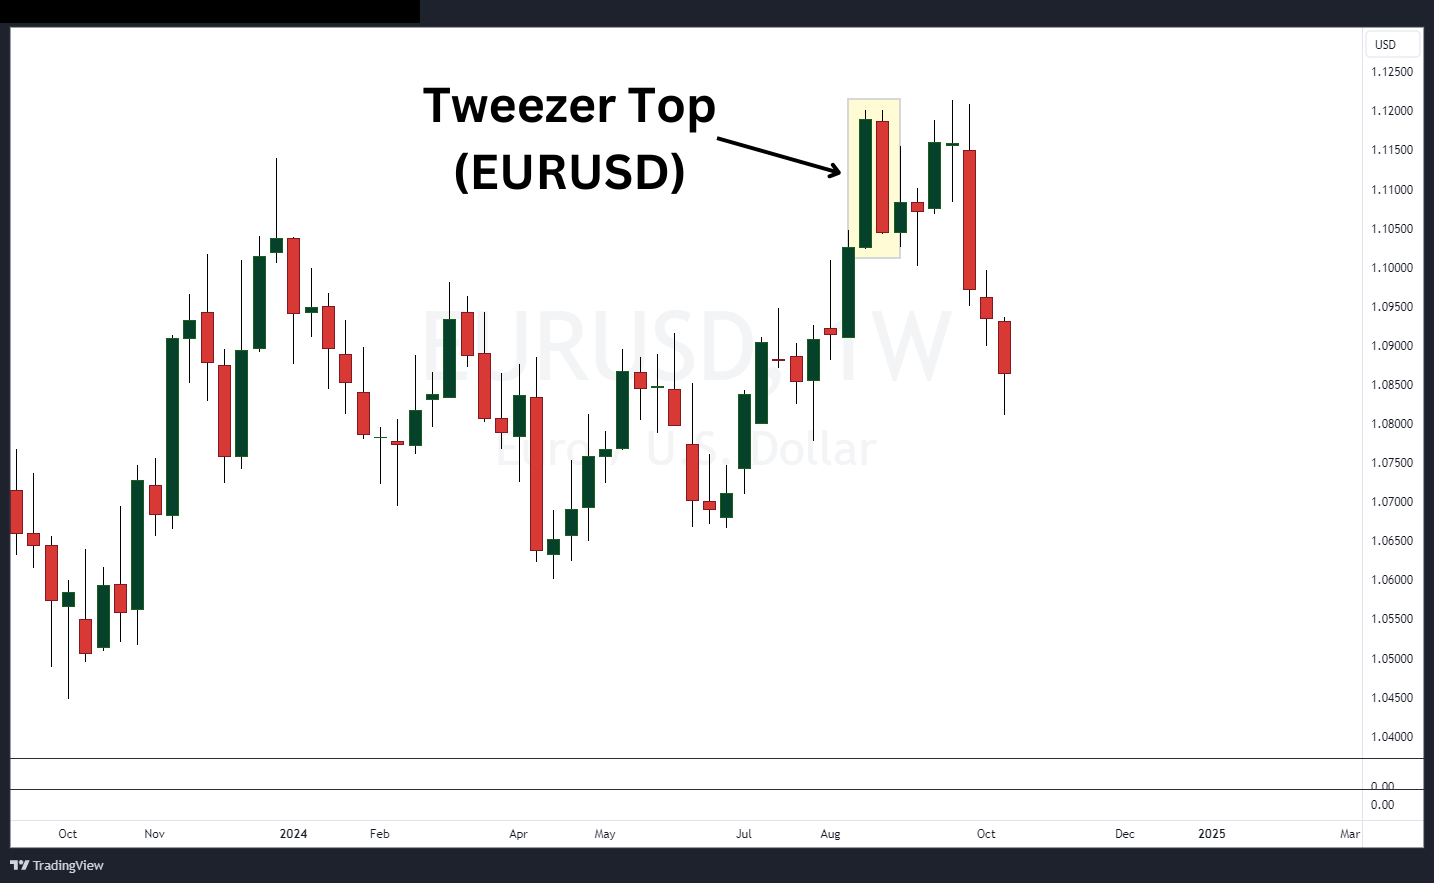
Tweezer tops appear frequently within the forex market.
Above, we see EURUSD on a weekly chart. For two weeks in a row, two long-range candles stopped at the same price high. After some sideways consolidation, EURUSD retested those same highs again. After another failed attempt to break, prices began to fall again.
Part of the reason tweezer top forex is common is due to the 24 hour continuous trading that forex offers. When a resistance level forms, oftentimes the price will have a hard time punching through the resistance. Breakouts tend to be more volatile forex when there is a shift in interest rate expectations or uncertain market conditions. Otherwise, forex can be a very technical market and respect support and resistance levels.
Tweezer Top Candlestick Pattern Trading Strategies
The following are the different ways to incorporate a tweezer top candlestick pattern with other technical analysis tools (e.g., technical indicators) under the following market trends:
Retracement (Bounce) On Naked Charts
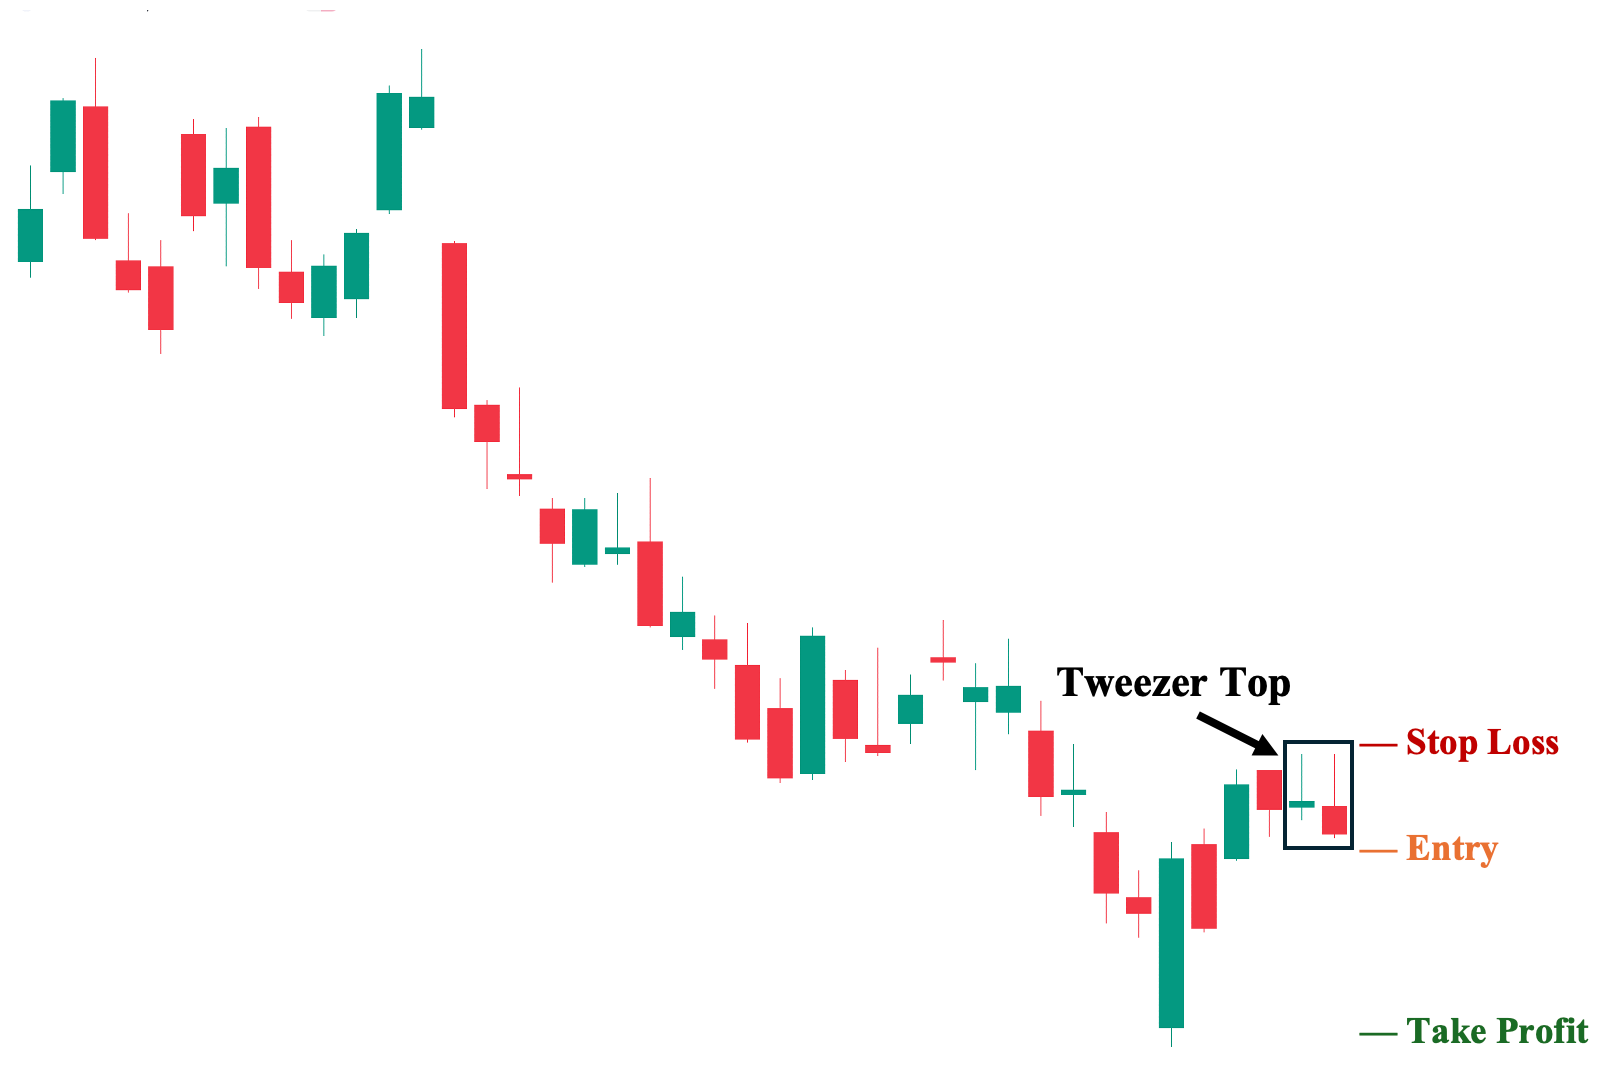
First, you can utilize the tweezer top on a pure candlestick chart. Here, you use the candlestick charts themselves as your sole technical analysis tool. As shown in the illustration, we can observe a prior downtrend before hitting a low, where the price bounced back. This short-term bullish rally paved the way for the tweezer top pattern, which may signal the end of this short-lived pullback (retracement) and a continuation of the downward move.
1. Entry Point: A few ticks below the second candle’s low.
2. Stop Loss Points: Set your stop loss a few ticks above the second candle’s high.
3. Take Profit (TP) Level: Set your TP a few ticks above the nearest key structural support level. In this case, the previous low of the downtrend.
4. Risk-Reward Ratio: The risk/reward ratio must be at least 1:1. We do not recommend taking trades with a ratio below this in any trading situation. The higher the potential reward relative to the risk, the better. However, make sure you use an objective approach when setting your TP and SL levels rather than inflating them artificially.
Trading The Tweezer Top With Key Structural Levels
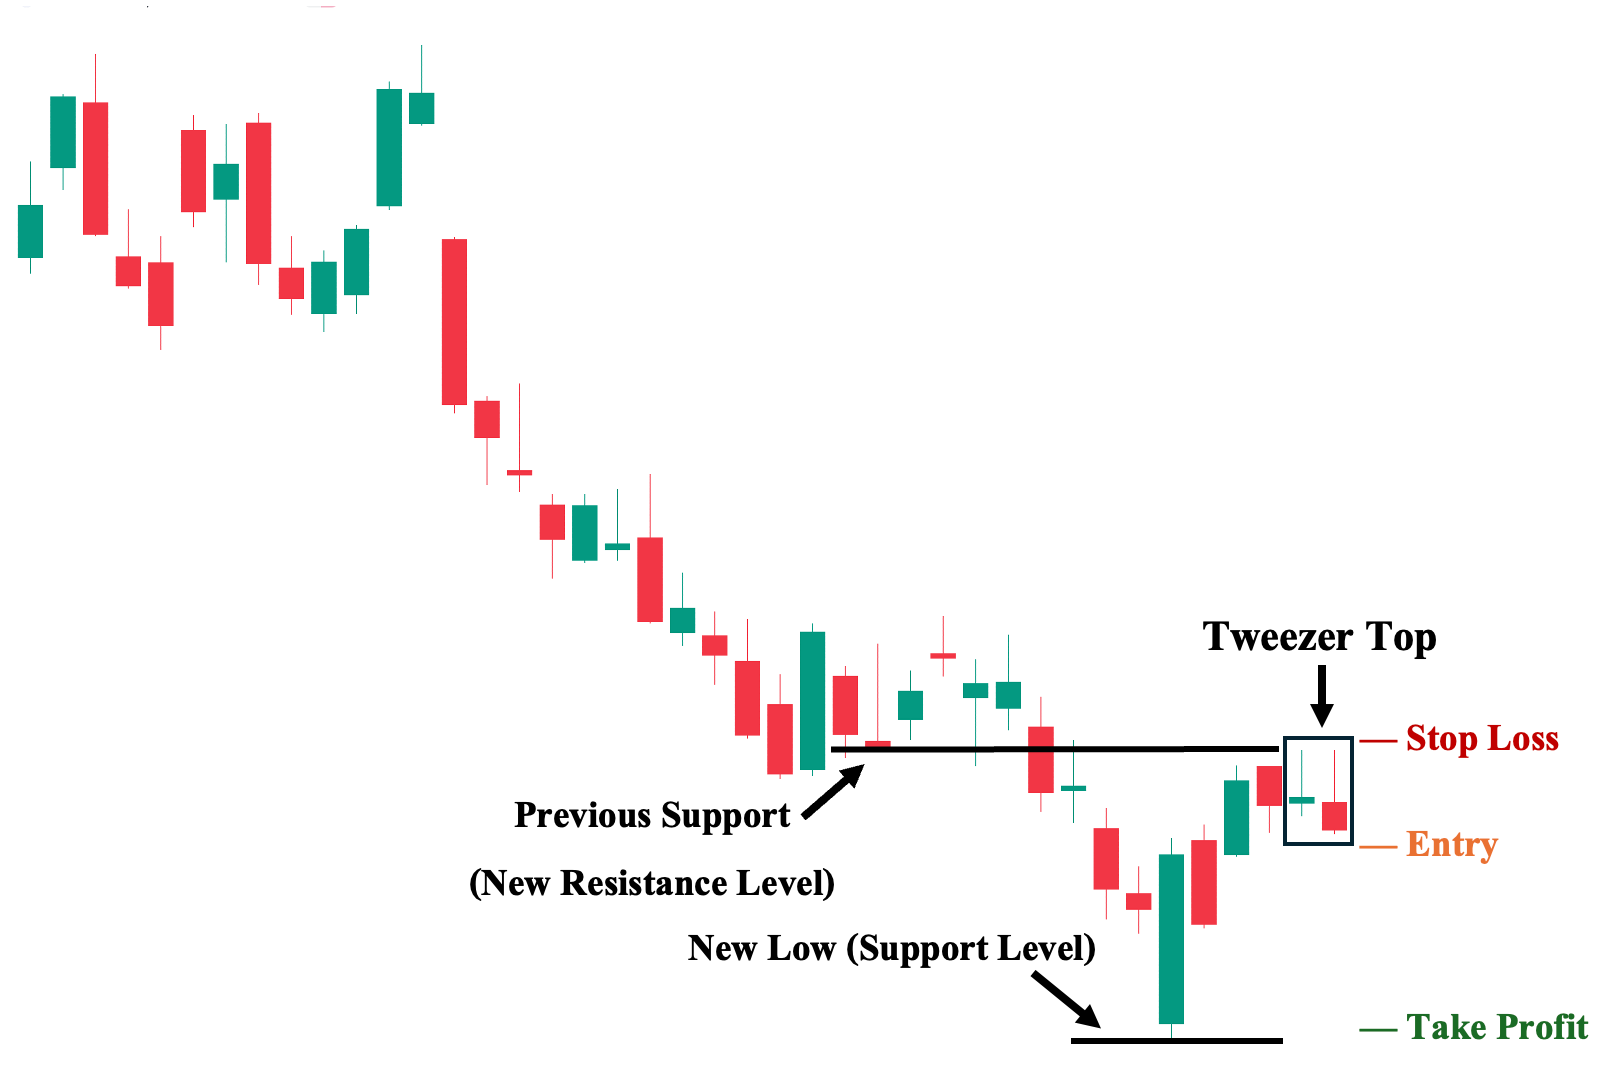
We can employ the tweezer top’s trend reversal signal in a price structure analysis. As shown, we use the same chart from our previous illustration to identify key structural price levels. Here, we can observe that the tweezer candlesticks’ high coincides with the downtrend’s previous (now broken) support level, which makes it a new resistance level. This gives us confirmation that—unless the price closes above this level—the tweezer top pattern may indeed signal the end of the bullish move.
1. Entry Point: A few ticks below the second candle’s low.
2. Stop Loss Points: Set your stop loss a few ticks above both the second candle’s high and the nearest resistance level. In this case, the downtrend’s previous support now serving as the new resistance level.
3. Take Profit (TP) Level: Set your TP a few ticks above the nearest key structural resistance level. In this case, the previous low of the downtrend.
4. Risk-Reward Ratio: The risk/reward ratio must be at least 1:1. We do not recommend taking trades with a ratio below this in any trading situation. The higher the potential reward relative to the risk, the better. However, make sure you use an objective approach when setting your TP and SL levels rather than inflating them artificially.
Trading The Tweezer Top With Moving Averages (MAs)
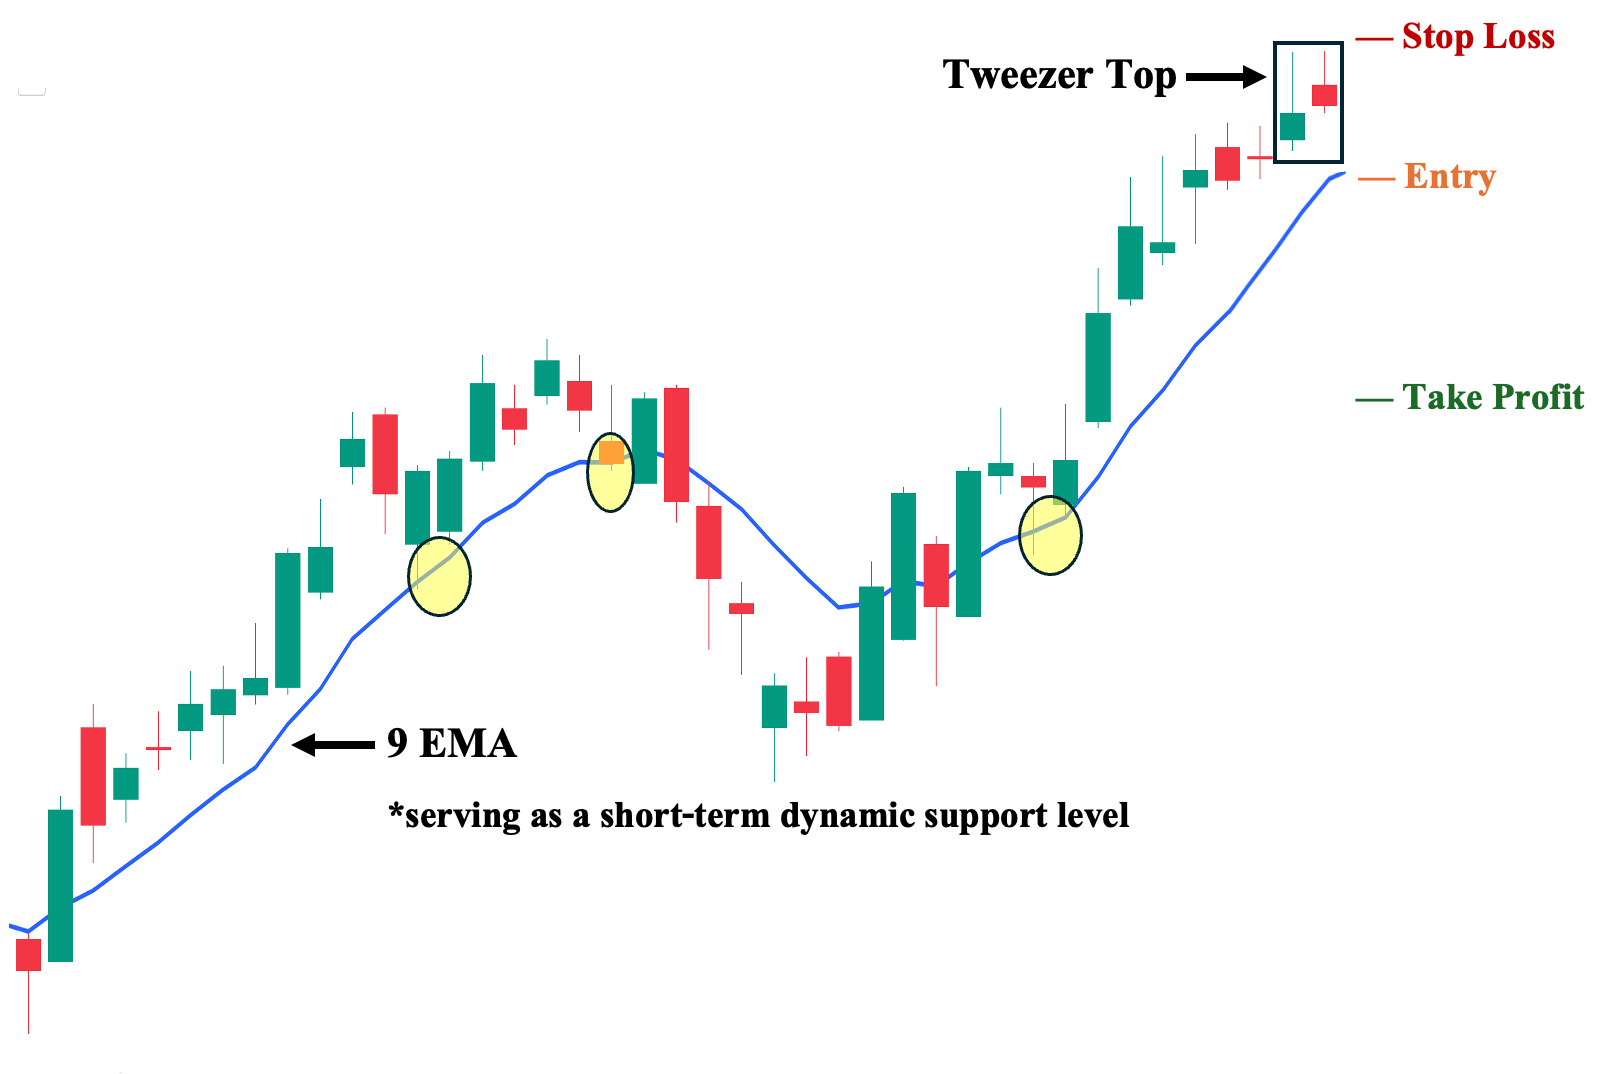
One of the most commonly used technical analysis tools, the moving average (MA), can serve a flexible function—from setting a potential entry to marking a profit target. In this illustration, we use the 9-period exponential moving average (9 EMA), a commonly used momentum indicator. As shown, the 9 EMA has supported the previous price movement (highlighted in yellow), acting as a dynamic support level. Therefore, in addition to the tweezer top pattern, we look to see if the price breaks below the 9 EMA as an added confirmation before we take a short position.
1. Entry Point: A few ticks below the 9 EMA (the price must close below this moving average, which serves as the moving support level).
2. Stop Loss Points: Set your stop loss a few ticks above the second candle’s high.
3. Take Profit (TP) Level: Set your TP a few ticks above the nearest structural support level, which, in this case, is the uptrend’s broken previous resistance level.
4. Trailing Stop: Sell if the price breaks above the 9 EMA before reaching your target price.
5. Risk-Reward Ratio: The risk/reward ratio must be at least 1:1. We do not recommend taking trades with a ratio below this in any trading situation. The higher the potential reward relative to the risk, the better. However, make sure you use an objective approach when setting your TP and SL levels rather than inflating them artificially.
Trading The Tweezer Top With Relative Strength Index (RSI) Divergence
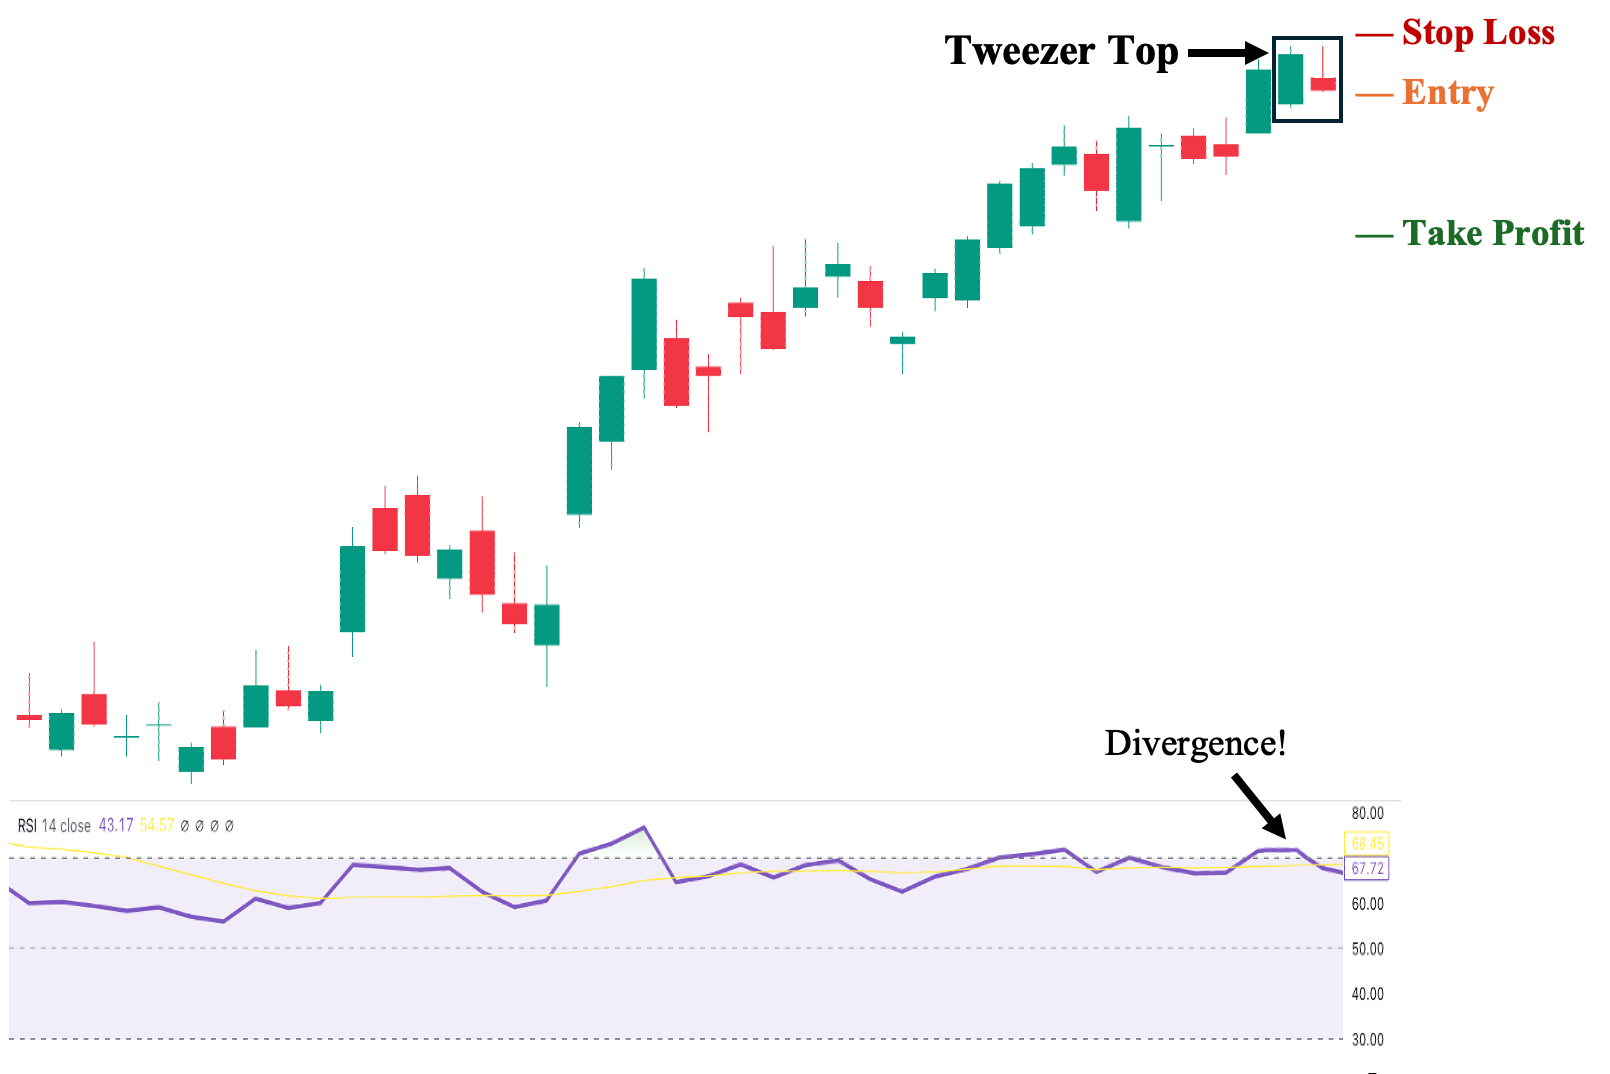
Compared to other technical indicators—which are generally lagging in nature—the Relative Strength Index (RSI) sets itself apart as a potential leading indicator by serving as a divergence tool. As shown, the RSI already flatlines on the tweezer top’s first candle. This creates bearish RSI divergence, as the price was still going up when the RSI flatlined. The first candle is then followed by the second candle with the same high, ultimately forming a tweezer top. Hence, in this scenario, the candlestick pattern served as the confirmation of RSI’s advance reversal signal.
1. Entry: A few ticks below the second candle’s low.
2. Stop Loss Points: Set your stop loss a few ticks above the second candle’s high.
3. Take Profit (TP) Level: Set your TP a few ticks above the nearest structural resistance level, which, in this case, is the uptrend’s broken previous resistance level.
4. Trailing Stop: Sell if the price and RSI diverge once again (RSI starts to point downwards).
5. Risk-Reward Ratio: The risk/reward ratio must be at least 1:1. We do not recommend taking trades with a ratio below this in any trading situation. The higher the potential reward relative to the risk, the better. However, make sure you use an objective approach when setting your TP and SL levels rather than inflating them artificially.
Trading The Tweezer Top With Fibonacci (Fib) Retracements
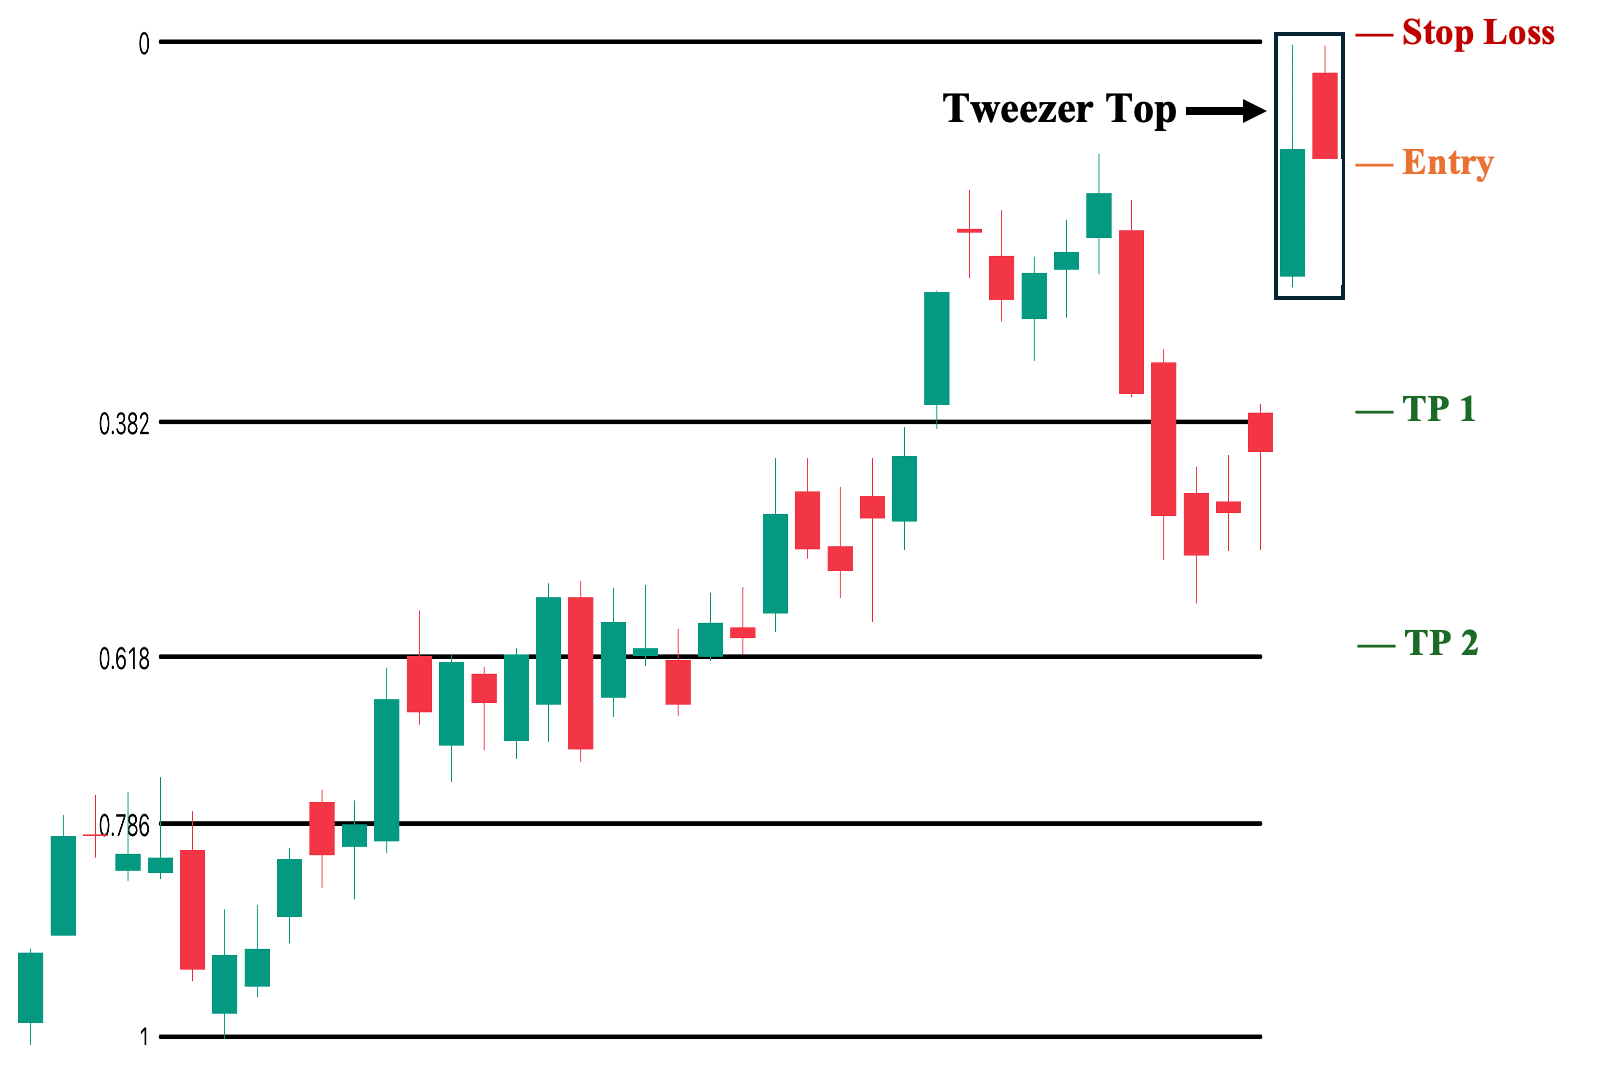
One of the most prominent technical analysis tools, the Fibonacci retracement tool (Fib), identifies possible key price levels where the price will likely ‘retrace’ or bounce back if the original trend remains intact. This is useful information, as we cannot guarantee a successful trend reversal following a tweezer top.
In fact, as shown in our “Examples” section, the pattern may lead to sideways movement after hitting a key price level. Moreover, Fib levels that coincide with key structural levels are especially noteworthy, as these are likely points of contention between buyers and sellers.
1. Entry: A few ticks below the second candle’s low.
2. Stop Loss Points: Set your stop loss a few ticks above the second candle’s high.
3. Take Profit (TP) Level: Consider setting your first TP a few ticks above the nearest Fib level. In this case, the 0.382 level. Then, you can set an optional second TP (if your trading strategy involves selling in tranches) a few ticks above the 0.618 level.
4. Risk-Reward Ratio: The risk/reward ratio must be at least 1:1. We do not recommend taking trades with a ratio below this in any trading situation. The higher the potential reward relative to the risk, the better. However, make sure you use an objective approach when setting your TP and SL levels rather than inflating them artificially.
Trading The Tweezer Top With Pivot Points
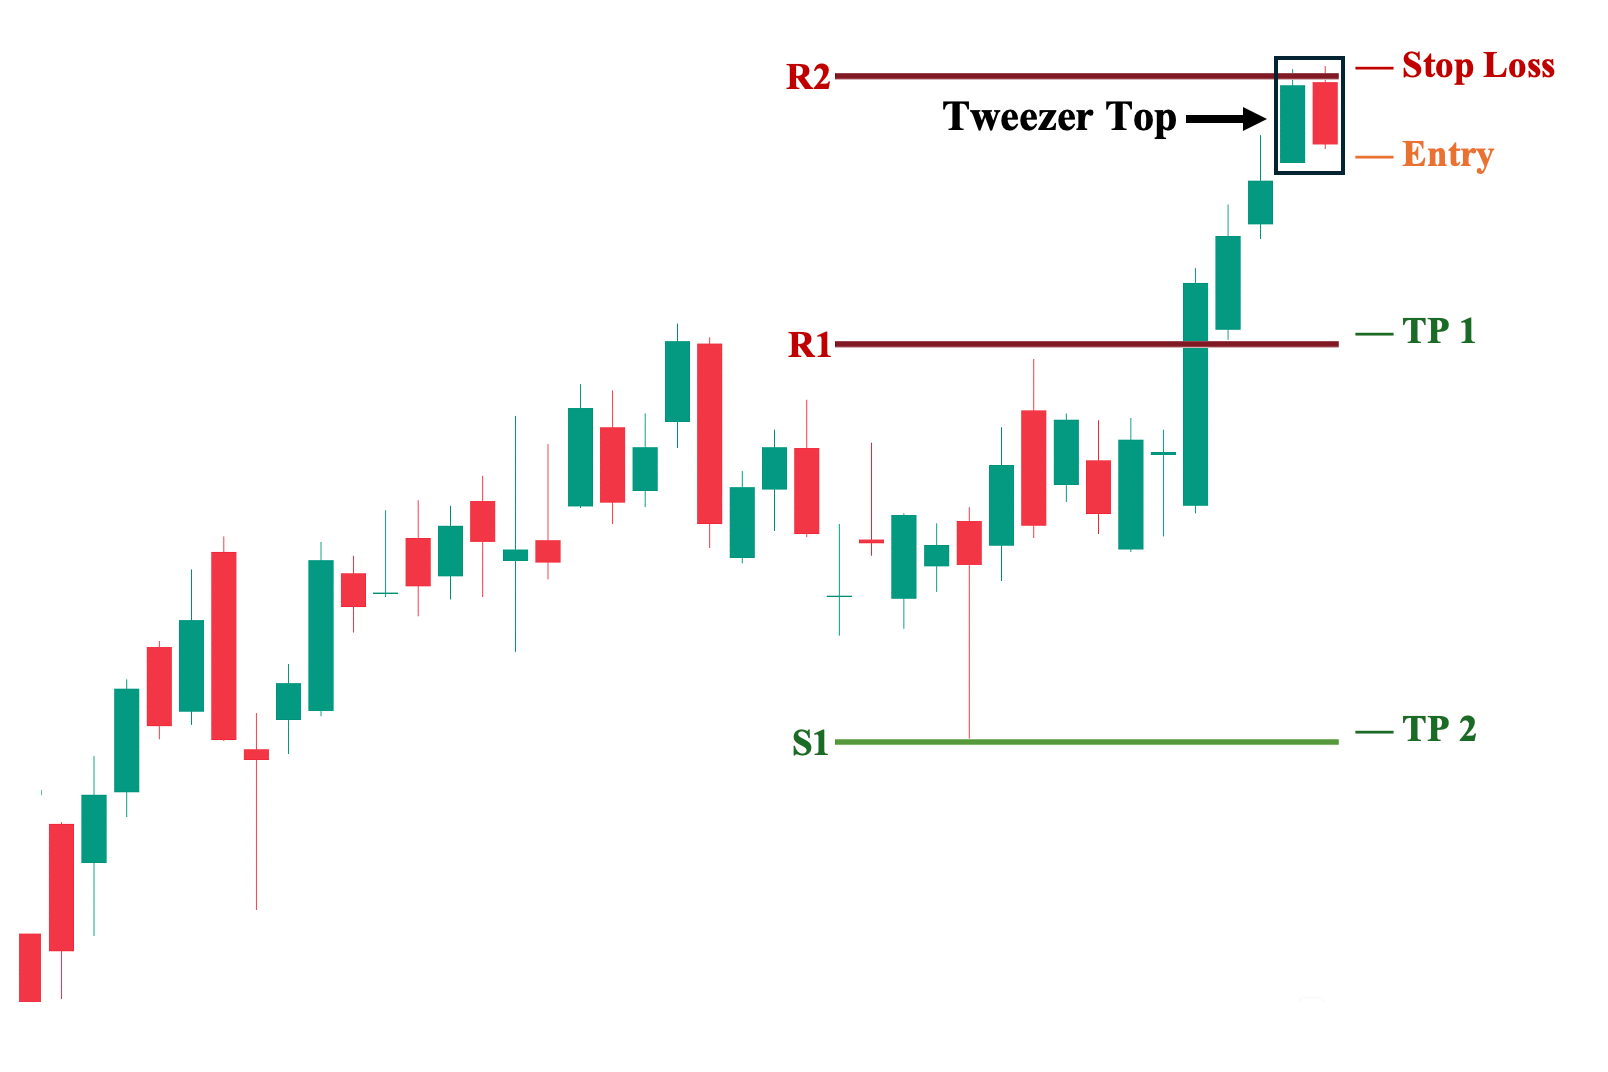
Pivot points are one of the more unique technical analysis tools that automatically identify possible key price levels where the price may ‘pivot,’ hence the name. As shown, three pivot points are generated, and all of them can be consequential to price action.
For example, in the illustration, we can use R2 as our risk management basis (i.e., where we place our stop loss). Also, notice how S1 shares the same low as the candle with long lower shadows, signifying that this may be a key price level.
1. Entry: A few ticks below the second candle’s low.
2. Stop Loss Points: Set your stop loss a few ticks above the R2 line.
3. Take Profit (TP) Level: Set your TP a few ticks below the next pivot level. In this case, the R1. Then, you can set an optional second TP (if your trading strategy involves selling in tranches) a few ticks above the S1 level.
4. Risk-Reward Ratio: The risk/reward ratio must be at least 1:1. We do not recommend taking trades with a ratio below this in any trading situation. The higher the potential reward relative to the risk, the better. However, make sure you use an objective approach when setting your TP and SL levels rather than inflating them artificially.
Trading The Tweezer Top With Moving Average Convergence Divergence (MACD)
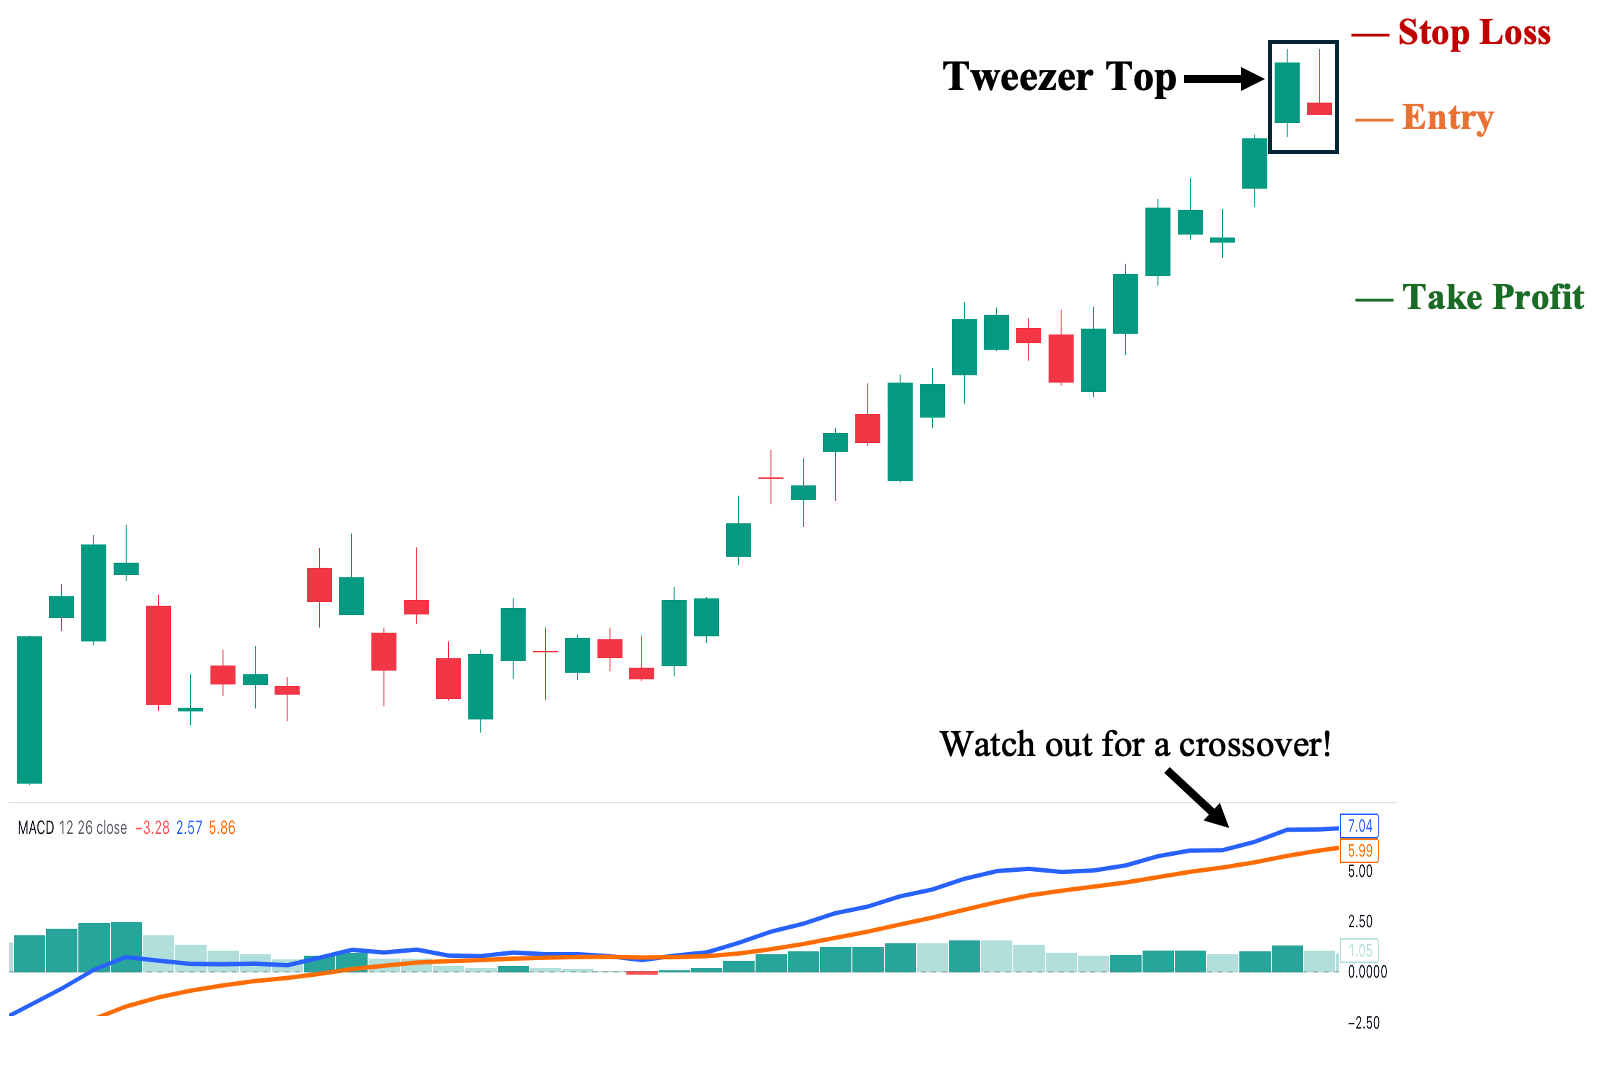
Compared to other technical indicators (such as pivot points, which can serve as a risk management tool), MACD primarily measures market sentiment and the validity of a trend. In this illustration, we can observe the MACD (blue) line consistently moving above the signal (orange) line, which occurs when the price is in an uptrend. When the blue line finally crosses down over the orange line, we get a bearish crossover, signifying a shift in market sentiment and confirming the tweezer top’s trend reversal signal.
1. Entry Points:
Aggressive Entry: Set your entry a few ticks below the second candle’s low
Conservative Entry: Only enter when the blue line crosses below the orange line.
2. Stop Loss Points: Set your stop loss a few ticks above the second candle’s high.
3. Take Profit (TP) Level: Set your TP a few ticks above the nearest structural resistance level, which, in this case, is the uptrend’s broken previous resistance level.
4. Trailing Stop: Sell if the blue line crosses above the orange line before hitting your TP.
5. Risk-Reward Ratio: The risk/reward ratio must be at least 1:1. We do not recommend taking trades with a ratio below this in any trading situation. The higher the potential reward relative to the risk, the better. However, make sure you use an objective approach when setting your TP and SL levels rather than inflating them artificially.
Trading The Tweezer Top With Bollinger Bands
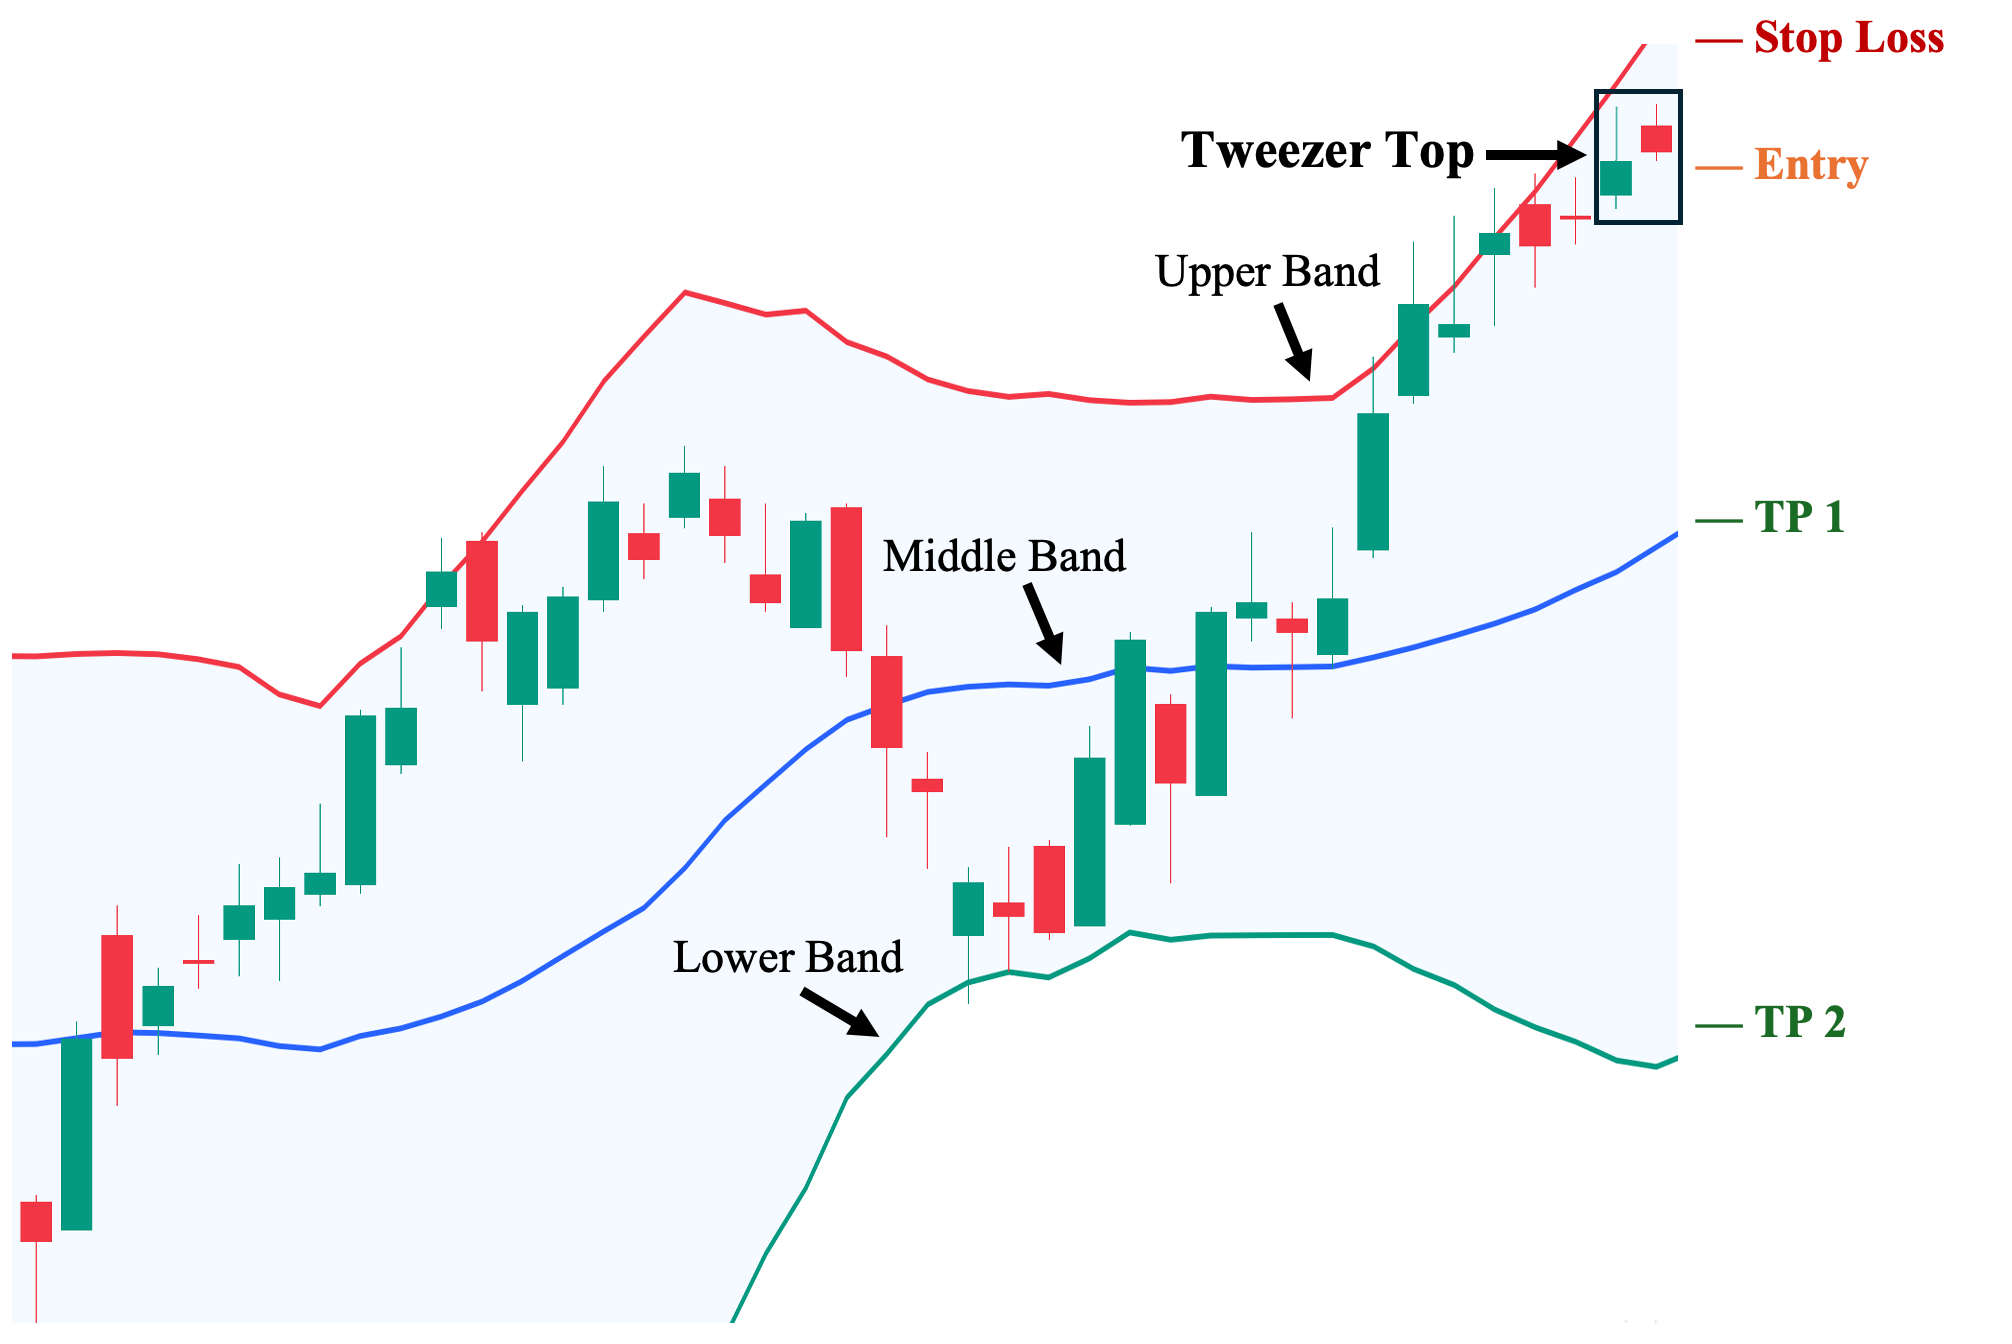
Lastly, we can also utilize the Bollinger Bands®, which essentially combine the functions of other technical analysis tools into a single indicator. As shown, there are three dynamic lines on the chart—the green line is the ‘lower band,’ the blue middle line is a moving average and is the ‘middle line,’ and the red line is the ‘upper band.’
These lines can serve different purposes depending on the market context. For example, the upper band can act as a risk management tool (stop-loss point), while the middle and upper bands can serve as support levels where we can place our profit targets.
1. Entry: A few ticks below the second candle’s low.
2. Stop Loss Points: Set your stop loss a few ticks above the upper Bollinger band line.
3. Take Profit (TP) Level: Set your TP a few ticks above the middle moving average line. Then, you can set an optional second TP (if your trading strategy involves selling in tranches) a few ticks above the lower Bollinger band line.
4. Risk-Reward Ratio: The risk/reward ratio must be at least 1:1. We do not recommend taking trades with a ratio below this in any trading situation. The higher the potential reward relative to the risk, the better. However, make sure you use an objective approach when setting your TP and SL levels rather than inflating them artificially.
Advantages of Trading the Tweezer Top Candlestick Patterns
Here are the key advantages of using the tweezer top candlestick patterns:
1. Versatile in Multiple Market Conditions
First, unlike other candlestick patterns that are limited to specific market conditions, the tweezer top pattern is highly flexible. It can serve as a bearish reversal signal when it occurs in an uptrend or mark the end of a bullish pullback (retracement) during a downtrend. In fact, it can also be effectively used in sideways-moving markets, provided it appears at a structural resistance level.
2. Precision in Identifying a Possible Key Resistance Area
Second, the two candles forming the pattern can play a unique role in establishing a potential resistance area. This occurs because the second candle “tests” and confirms the resistance’s validity by failing to make a higher high. Therefore, regardless of whether the pattern results in a bearish reversal or merely a sideways market, the area may likely develop into a zone of increased selling pressure (i.e., resistance).
3. Complement Divergence Strategies
Third, due to its nature as a bearish reversal signal typically forming at the end of a prolonged bullish move, the pattern becomes more reliable and valuable when it coincides with a divergence from another technical indicator, such as the MACD or Stochastic.
Disadvantages of Trading the Tweezer Top Candlestick Patterns
The following are the three downsides of using tweezer candlestick patterns:
1. Unreliable on Shorter Time Frames
First, tweezer candlestick patterns are among the candlestick patterns that tend to lose their reliability and significance in shorter time frames (i.e., time frames shorter than a day). This is because the pattern becomes much more frequent in lower time frames, regardless of market conditions.
2. Low Requirement for Validity
Second, compared to other candlestick formations, this pattern has one of the lowest requirements for validity. The tweezer top pattern’s two consecutive candlesticks only need to have the same or nearly identical highs, which is in sharp contrast to other patterns that require specific candlestick sizes or even a confirmation candle. As a result, its strength heavily depends on the appearance of these two candles. As discussed, the longer the wicks, the stronger the indication of price rejection at the top. Conversely, the formation becomes weaker when the two candles have little to no wick—as it does not clearly demonstrate this price rejection.
3. Reversal May Be Short-Lived
Third, as we illustrated in one of the examples above, the reversal may appear successful at first (i.e., the pattern is followed by bearish candles with lower lows), but this does not guarantee a sustained downward move. In some cases, it only leads to a minor pullback or a transition into prolonged consolidation or sideways movement. This makes the formation more challenging to incorporate into longer-term trading strategies (e.g., swing and position trading).
Tweezer Tops vs. Tweezer Bottoms
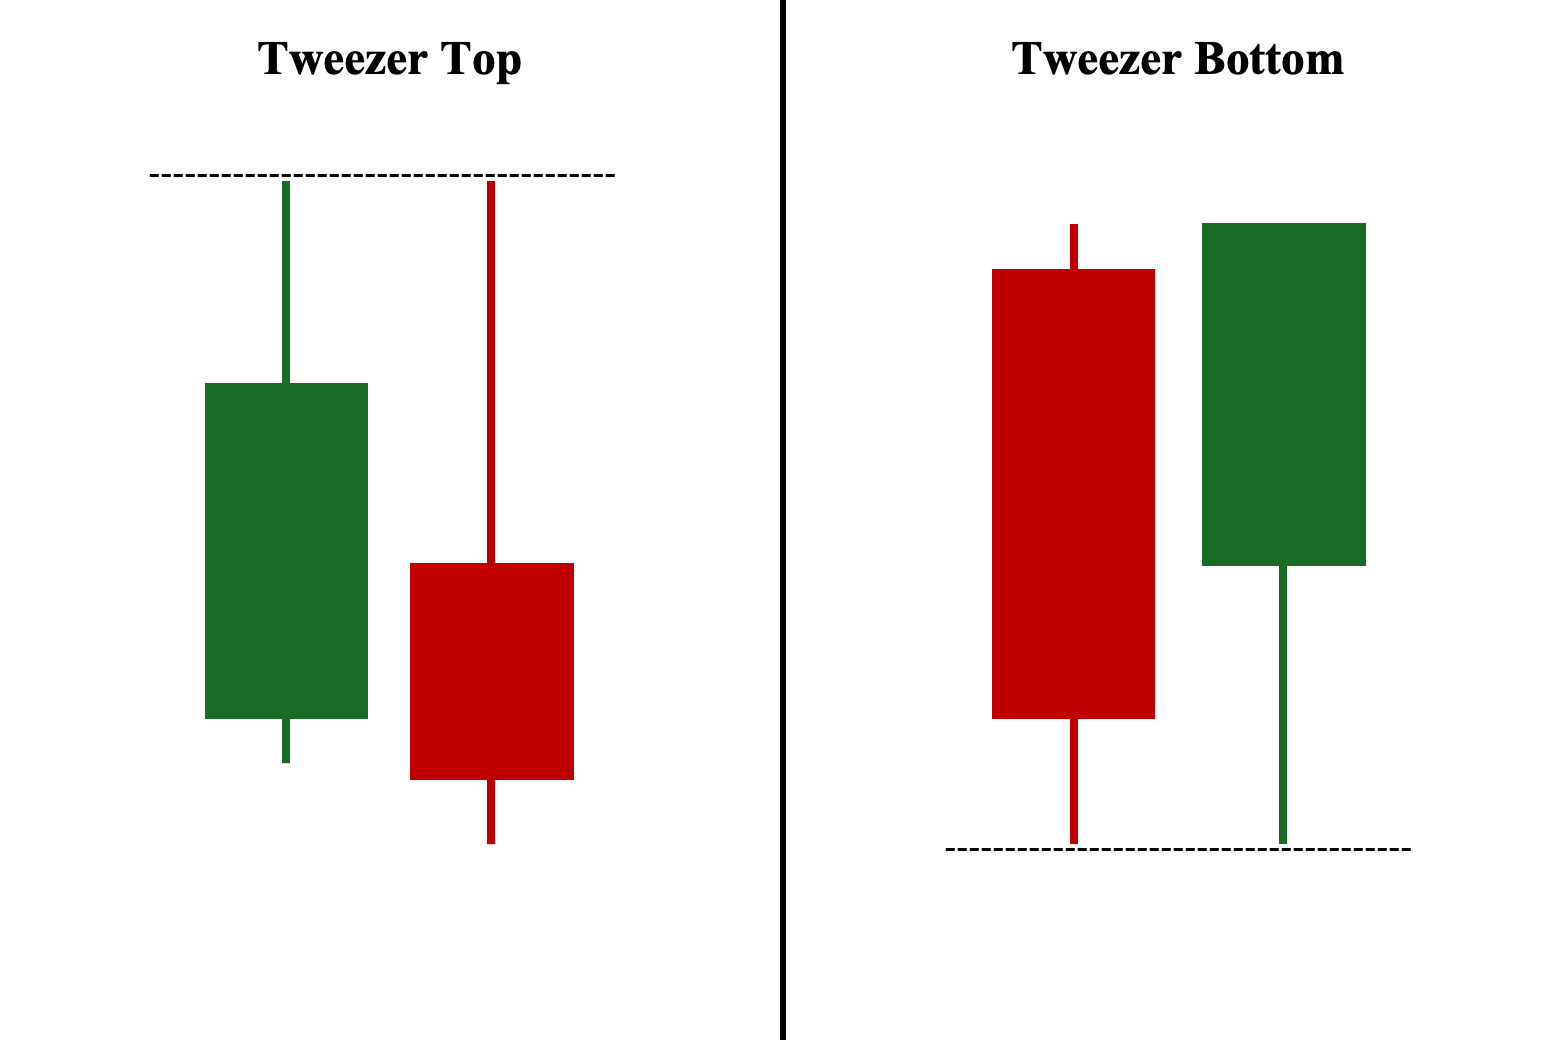
The two tweezer patterns—the tweezer top and the tweezer bottom pattern—are essentially mirror images of each other. The tweezer top consists of two candlesticks sharing identical highs and is considered a bearish reversal pattern. In contrast, the tweezer bottom pattern, also known as a bullish tweezer, consists of two candlesticks with the same low and is considered a bullish reversal pattern. You’ll notice the color order of the two candles flip between the tweezer top and bottom. The same low requirement for the tweezer bottom pattern refers to the likely end of the trend’s bearish move.
Tweezer Tops vs. Three Black Crows
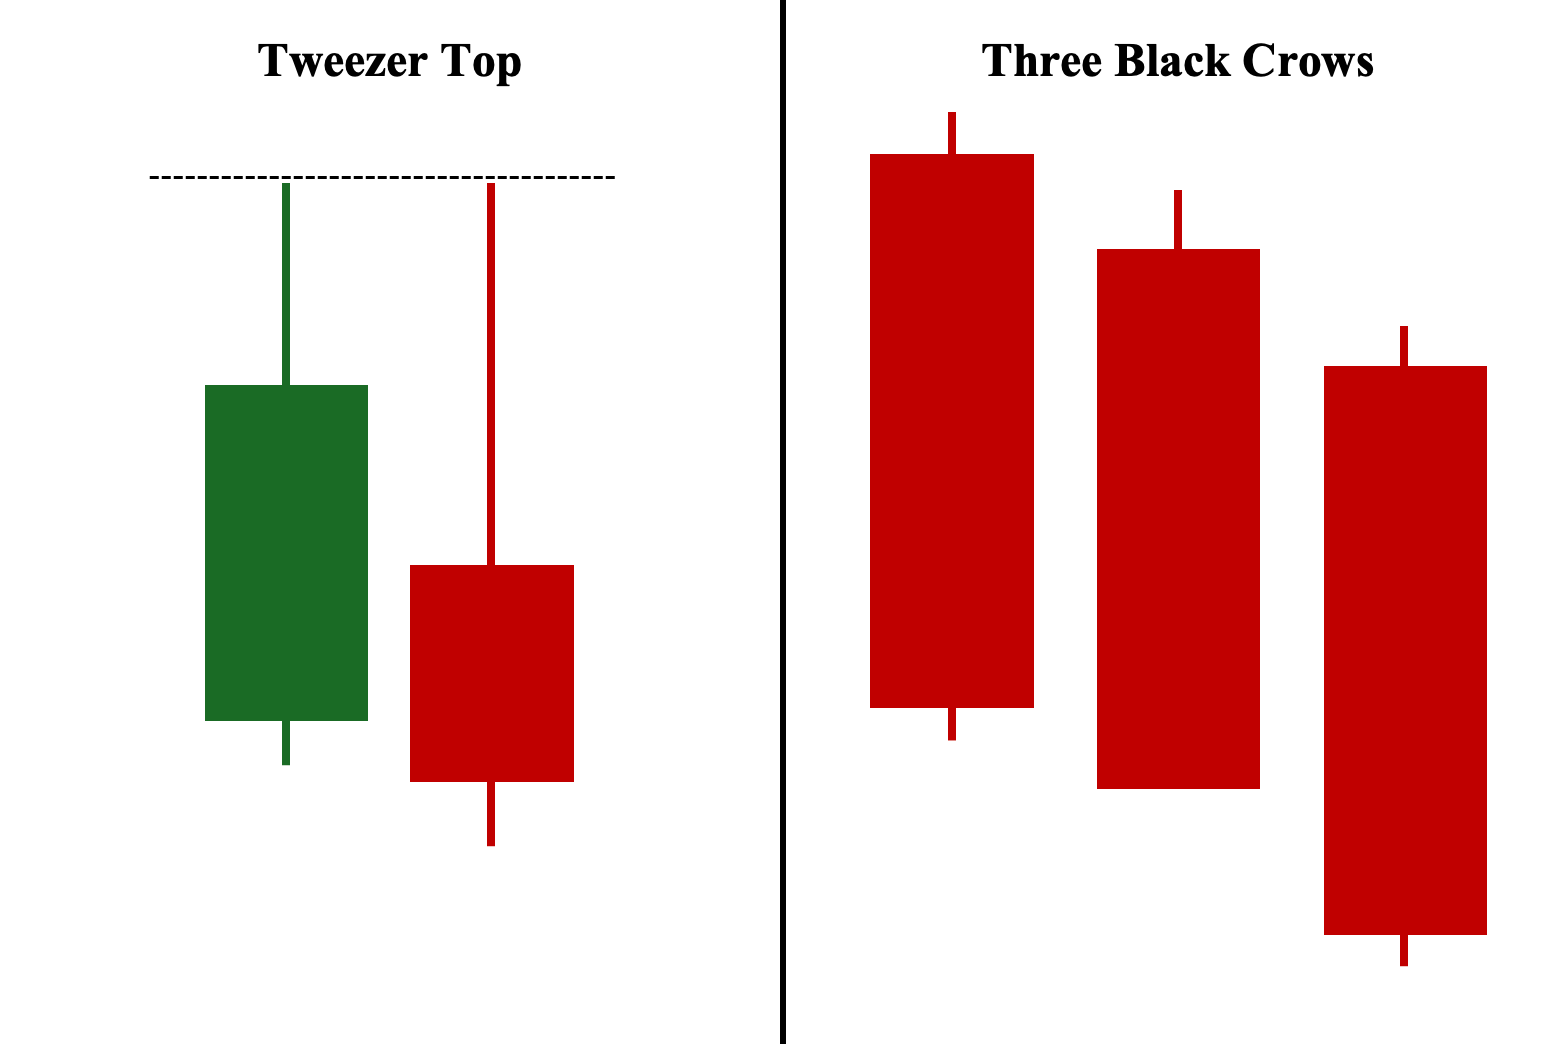
Similar to the tweezer top, the three black crows is also a bearish reversal pattern that appears at the end of a bullish move. While the tweezer top is composed of two candlesticks with the same high price, the three black crows is a three-candlestick formation composed of three long-bodied bearish candles that close progressively lower each time.
Tweezer Tops vs. Bearish Engulfing
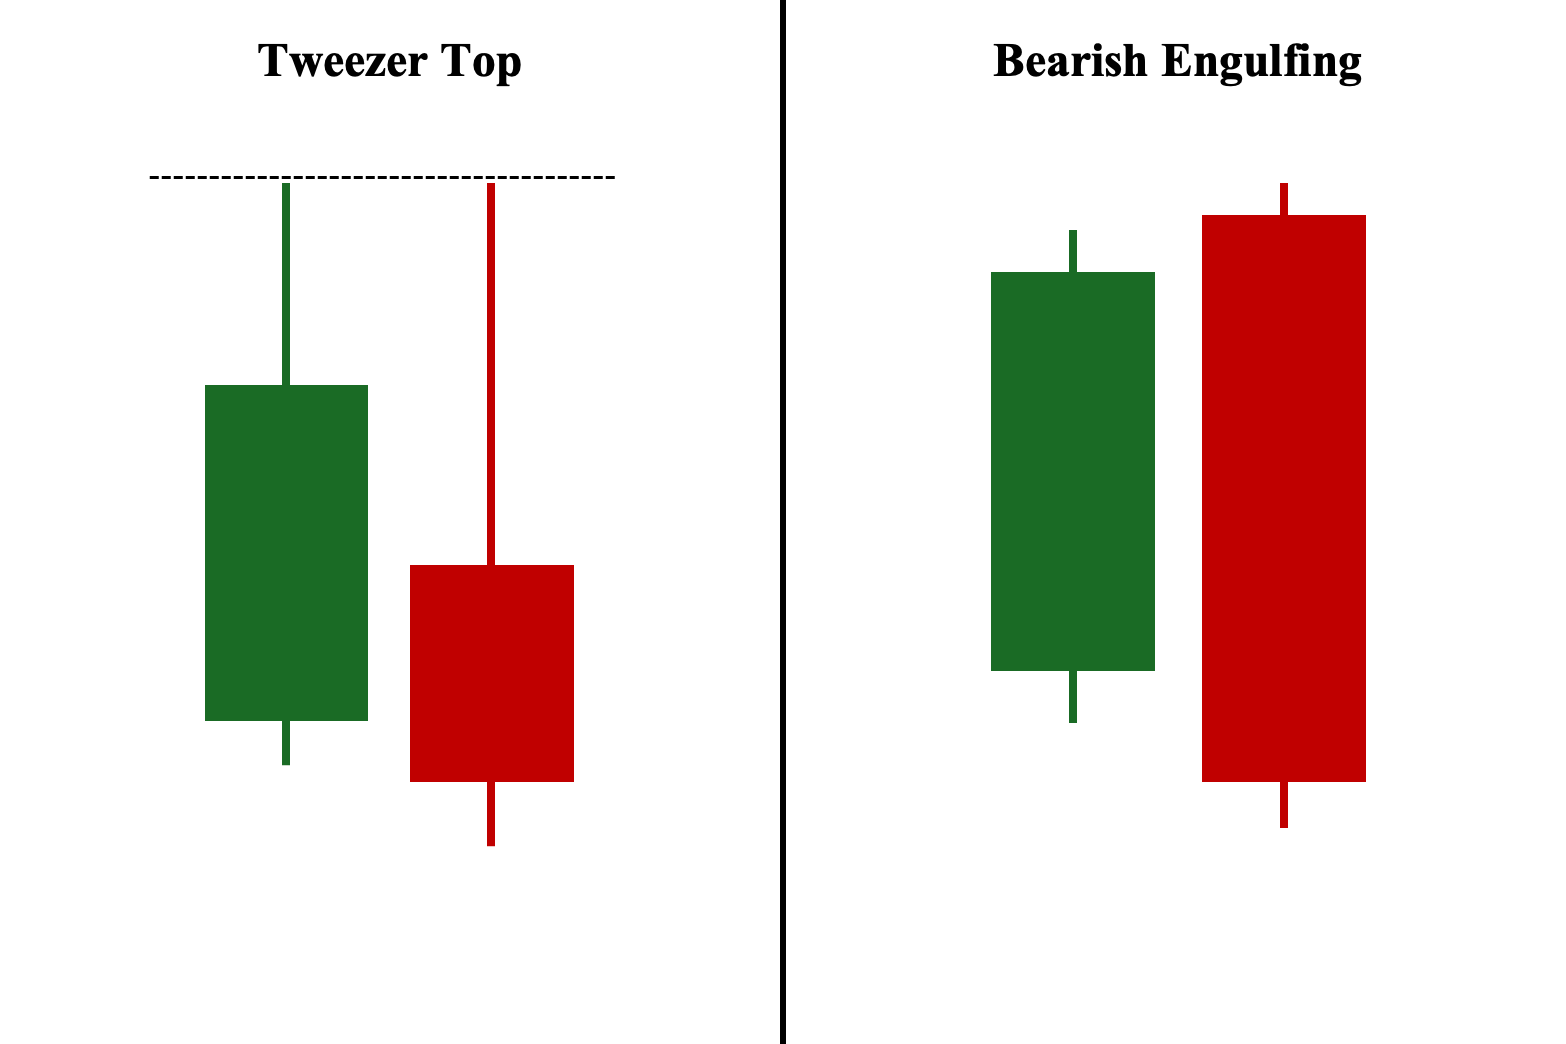
The tweezer top and bearish engulfing are both considered bearish reversal patterns. Both are composed of a bullish candlestick as the first candle, followed by a bearish second candle. The tweezer top requires two consecutive candlesticks with the same high price, while the bearish engulfing’s main condition is that the second candle must completely cover the first candle’s range. Nevertheless, as discussed in the Variants section, both candlestick formations can occur simultaneously.
Tweezer Tops vs. Shooting Star
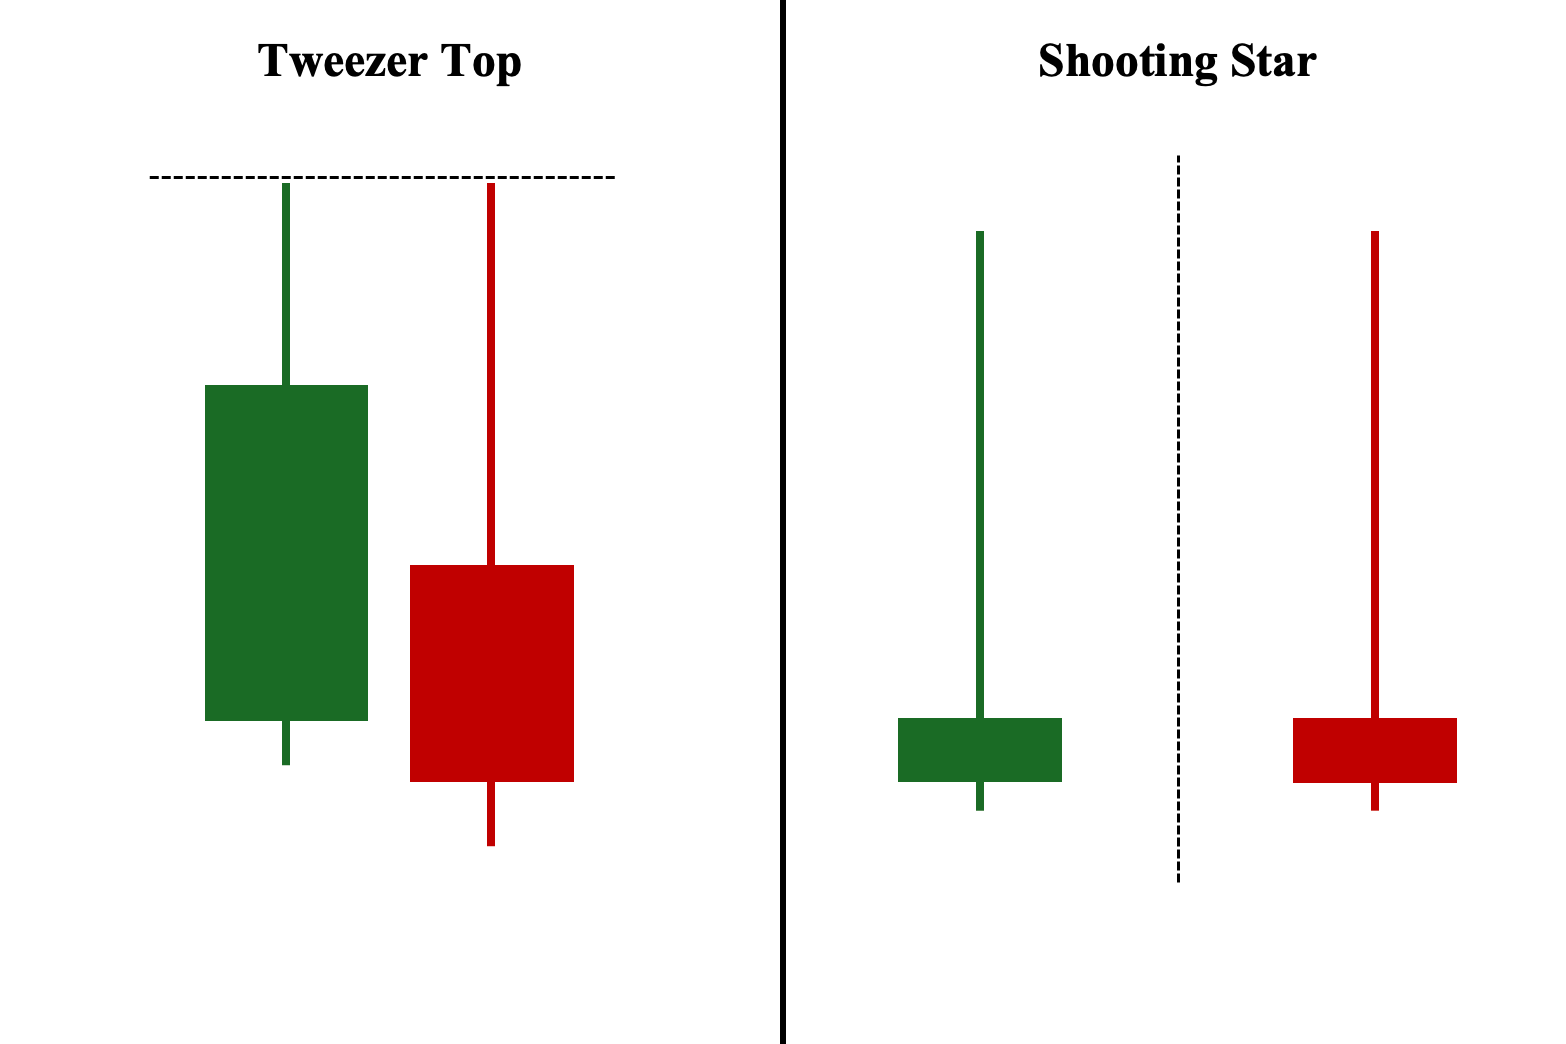
Both the tweezer top and shooting star are bearish reversal patterns. Similar to the tweezer top candlesticks, the shooting star candlestick pattern occurs at the end of a bullish move and signifies a potentially strong bearish sentiment. While the shooting star is only a one-candlestick formation, it can occur simultaneously as one of the tweezer top’s candles.
Tweezer Tops vs. Bearish Harami
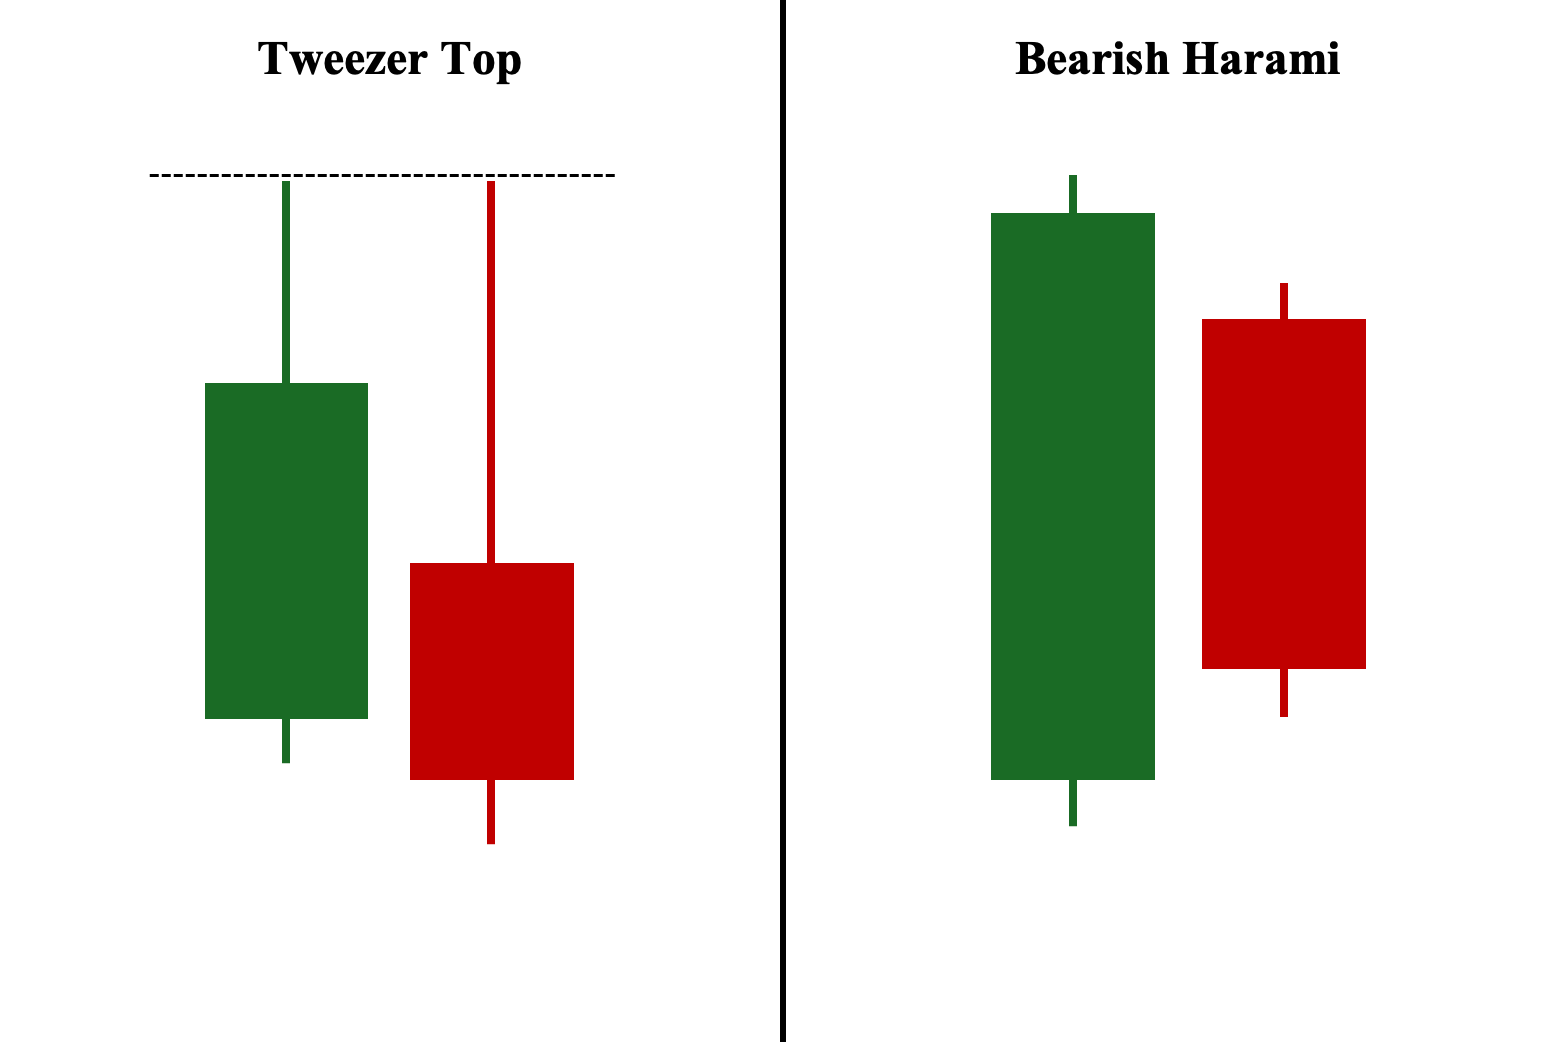
While the tweezer top must have two consecutive candlesticks with identical or nearly identical highs, the bearish harami’s primary condition involves its bearish second candle’s range being completely contained within the bullish first candle’s range, often creating a price gap (opening lower) in the process. Regardless, both the tweezer top and bearish harami are considered bearish reversal patterns.
Tweezer Tops vs. Dark Cloud Cover
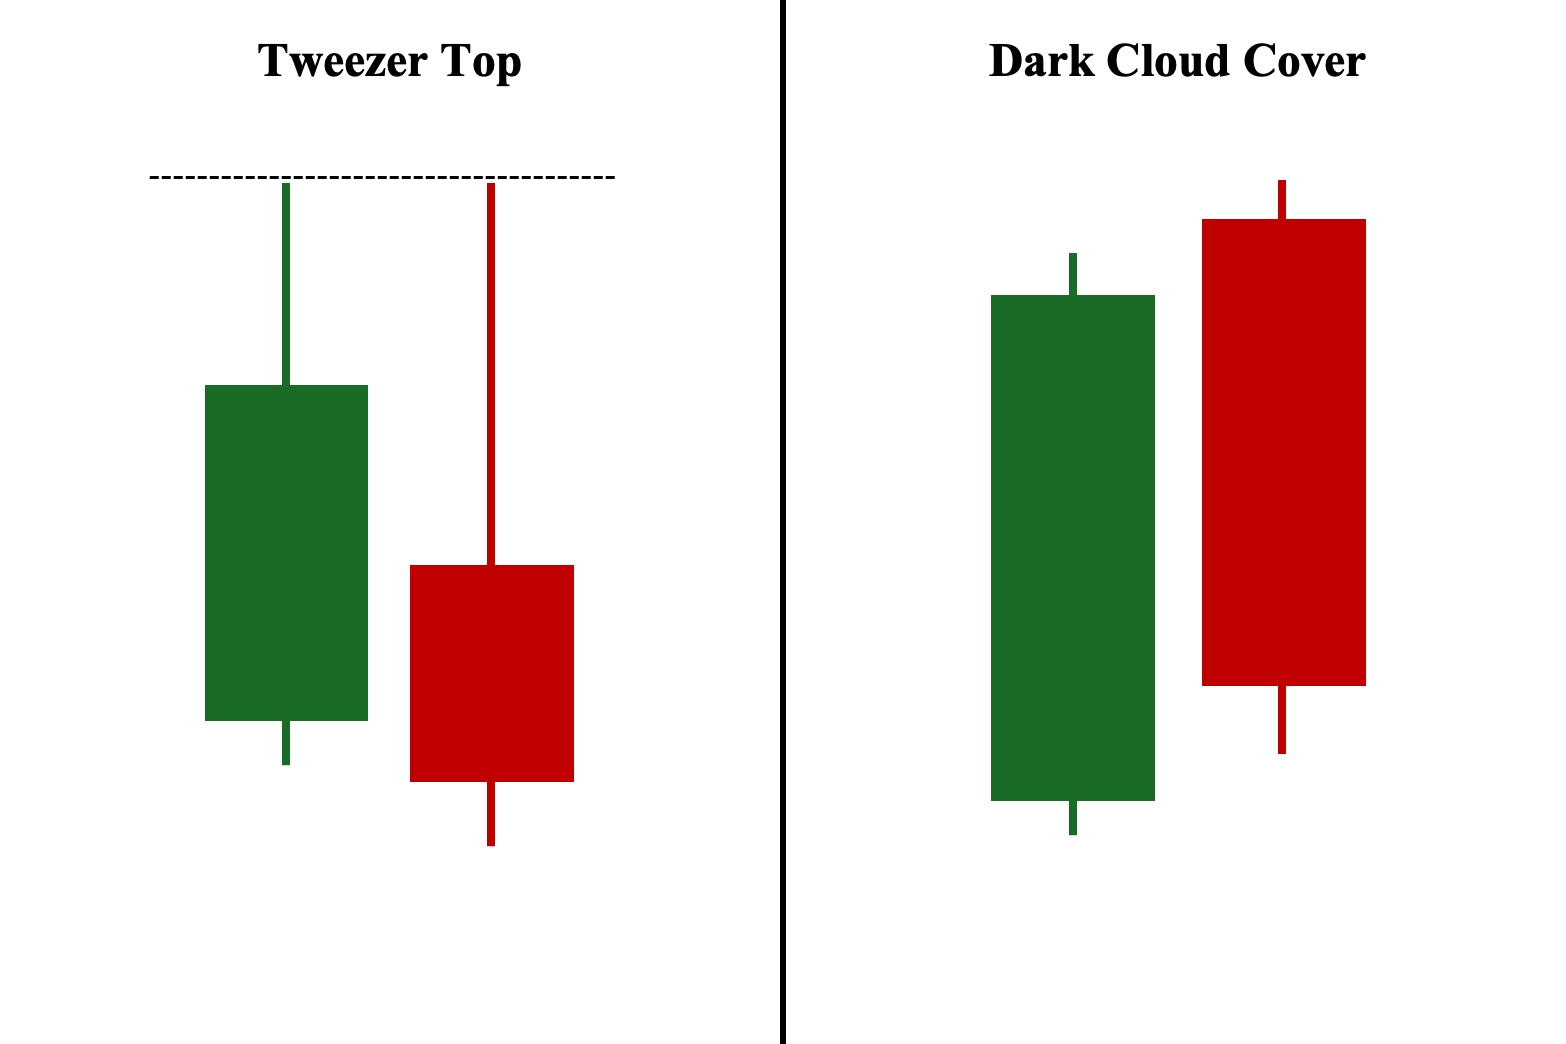
While the tweezer top is composed of two tweezer candlesticks that have the same high price, the dark cloud cover candlestick pattern occurs when a bullish first candle is followed by a bearish second candle, creating a price gap as it opens higher but ultimately closes below the 50% range of the first candle. Nevertheless, both candlestick formations are considered bearish reversal patterns.
Frequently Asked Questions (FAQs)
What is the best time frame for using tweezer tops?
Tweezer tops are more effective on longer time frames, especially daily charts, as they are the standard chart setting used by most retail and institutional traders and investors.
Who first identified the tweezer top?
Steve Nison brought most of the candlestick patterns we now have to the mainstream in the early 1990s through his book “Japanese Candlestick Charting Techniques,” including tweezer candlestick patterns—tweezer top and tweezer bottom.
How reliable is the tweezer top?
It depends. The tweezer candlestick pattern is considered much more reliable when utilized with other confirmation tools (e.g., volume, moving average, Fibonacci, etc.).
Is the tweezer top bullish or bearish?
Tweezer tops are considered bearish reversal patterns when they appear after a bullish move—either at the end of an uptrend or during a bullish pullback (retracement) in a downtrend.


