


Written by:

Reviewed by:


Neutral
- August 16, 2024
- 19 min read
Spinning Top Candlestick Pattern
What Is a Spinning Top Candlestick?
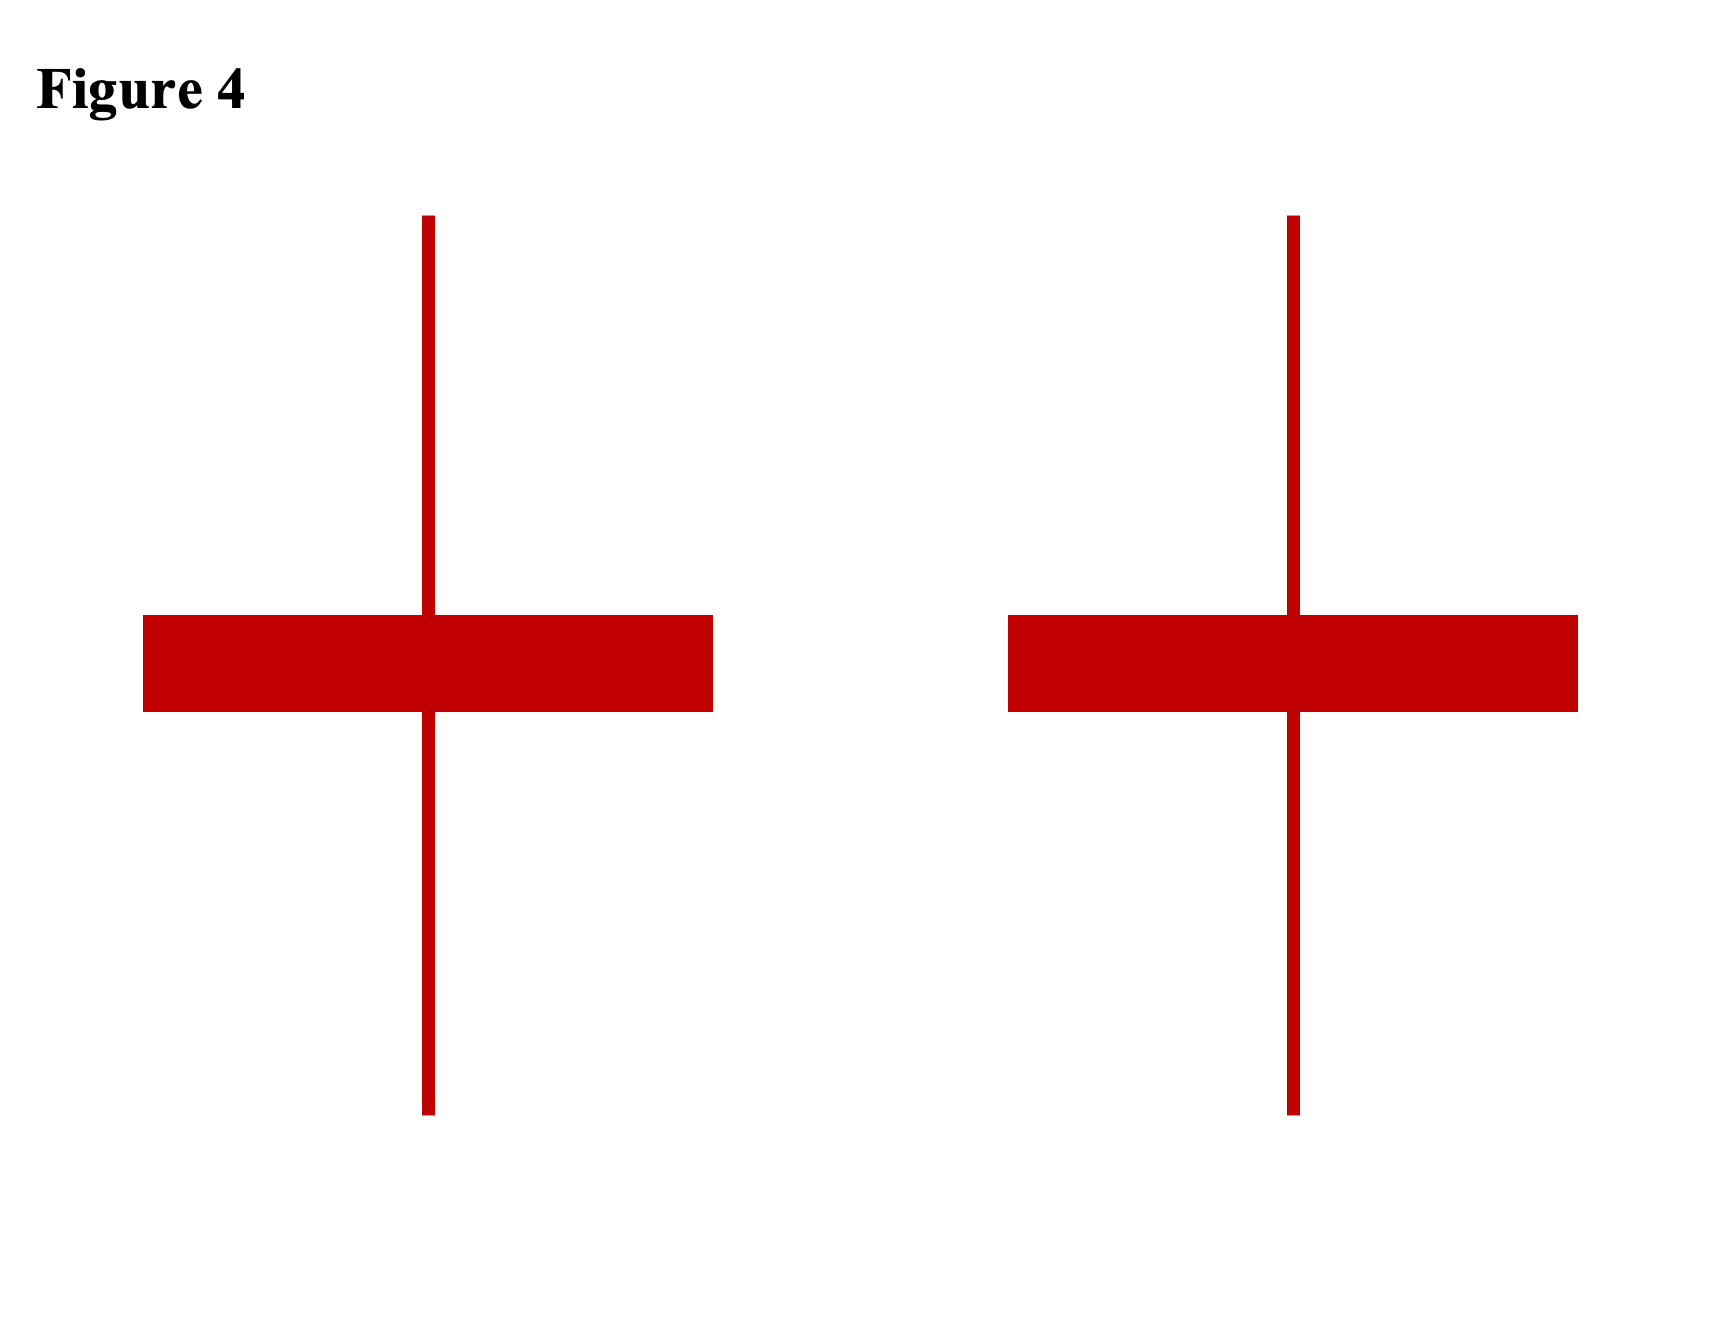
A spinning top is a neutral one-candlestick pattern used by traders that reflects market participants’ indecision and shows uncertainty about the asset’s future direction. As a candlestick, it displays a sudden shift in market control within the day—decisively moving in one direction and then making an aggressive countermove in the opposite direction before closing near near the same opening price. As a result, it forms a small real body with long upper and lower shadows or wicks.
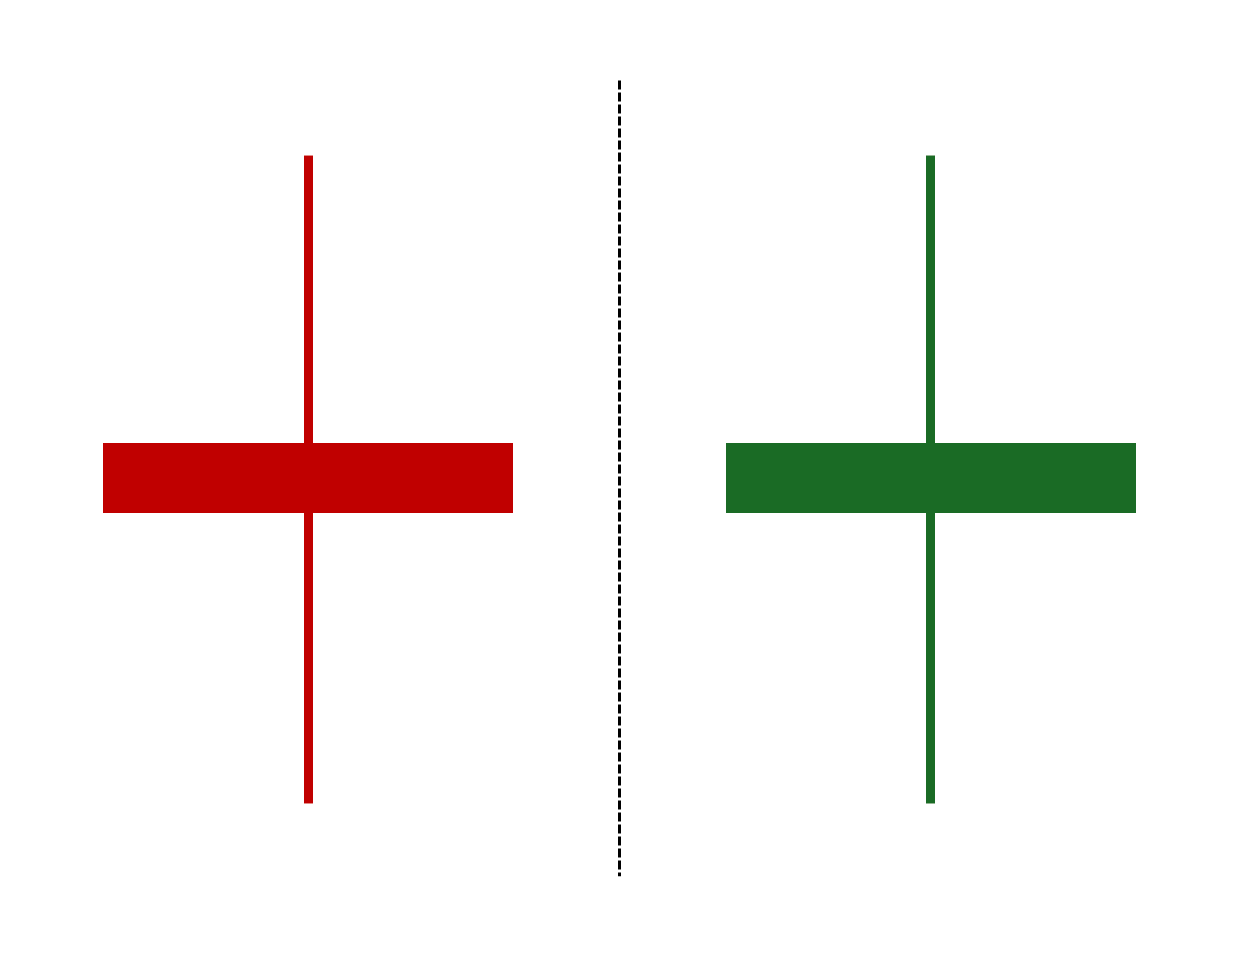
What Is a Bullish Spinning Top Candlestick?
A bullish spinning top candlestick is followed by a “confirmation” candle, which is a bullish candle closing either within the spinning top’s upper wick or above its high. These two candles then serve as a bullish price reversal pattern.
What Is a Bearish Spinning Top Candlestick?
In contrast, bearish spinning tops are also followed by a “confirmation” candle, which is a bearish candle closing either within the spinning top’s lower wick or below its low. These two candles then serve as a bearish price reversal pattern.
How Does a Spinning Top Candlestick Work?
Since a spinning top is a neutral candlestick pattern, it can lead to either a bullish or bearish trend. Hence, it is best interpreted with the following candle to confirm the asset’s likely direction — either confirming a potential reversal or simply a continuation of the prevailing trend.
What Does a Spinning Top Candlestick Tell You?
A spinning top candle marks a point of indecision about the asset’s future. It reveals that neither buyers nor sellers have active control over the price, and both are fighting to gain the position of power.
Note: A spinning top is far more useful for evaluating trending markets where a clear uptrend or downtrend can be observed. Conversely, indecisive candles such as spinning tops are prevalent and, in fact, expected in choppy or sideways-moving markets, as market sentiment remains unclear.
Spinning tops can be spotted on a variety of chart time frames from minutes to monthly. The more useful chart time frames are the Daily, Weekly, or Monthly time frame as there is more data going into the candle’s creation.
Some traders may look for spinning tops on minutes or hourly charts, but there isn’t a lot of important information gleaned. Therefore, if you spot a spinning top candle on the minute or hourly chart, it may be best to wait for the next candle to provide more insight into the market’s trend.
Double Spinning Top Candlesticks
A double spinning top is simply two spinning tops forming consecutively. This shows an even higher degree of uncertainty, as another indecisive candle forms instead of being followed by either a trend reversal confirmation candle or a trend continuation candle. This market condition reflects a prolonged battle between buyers and sellers to gain control of the price.
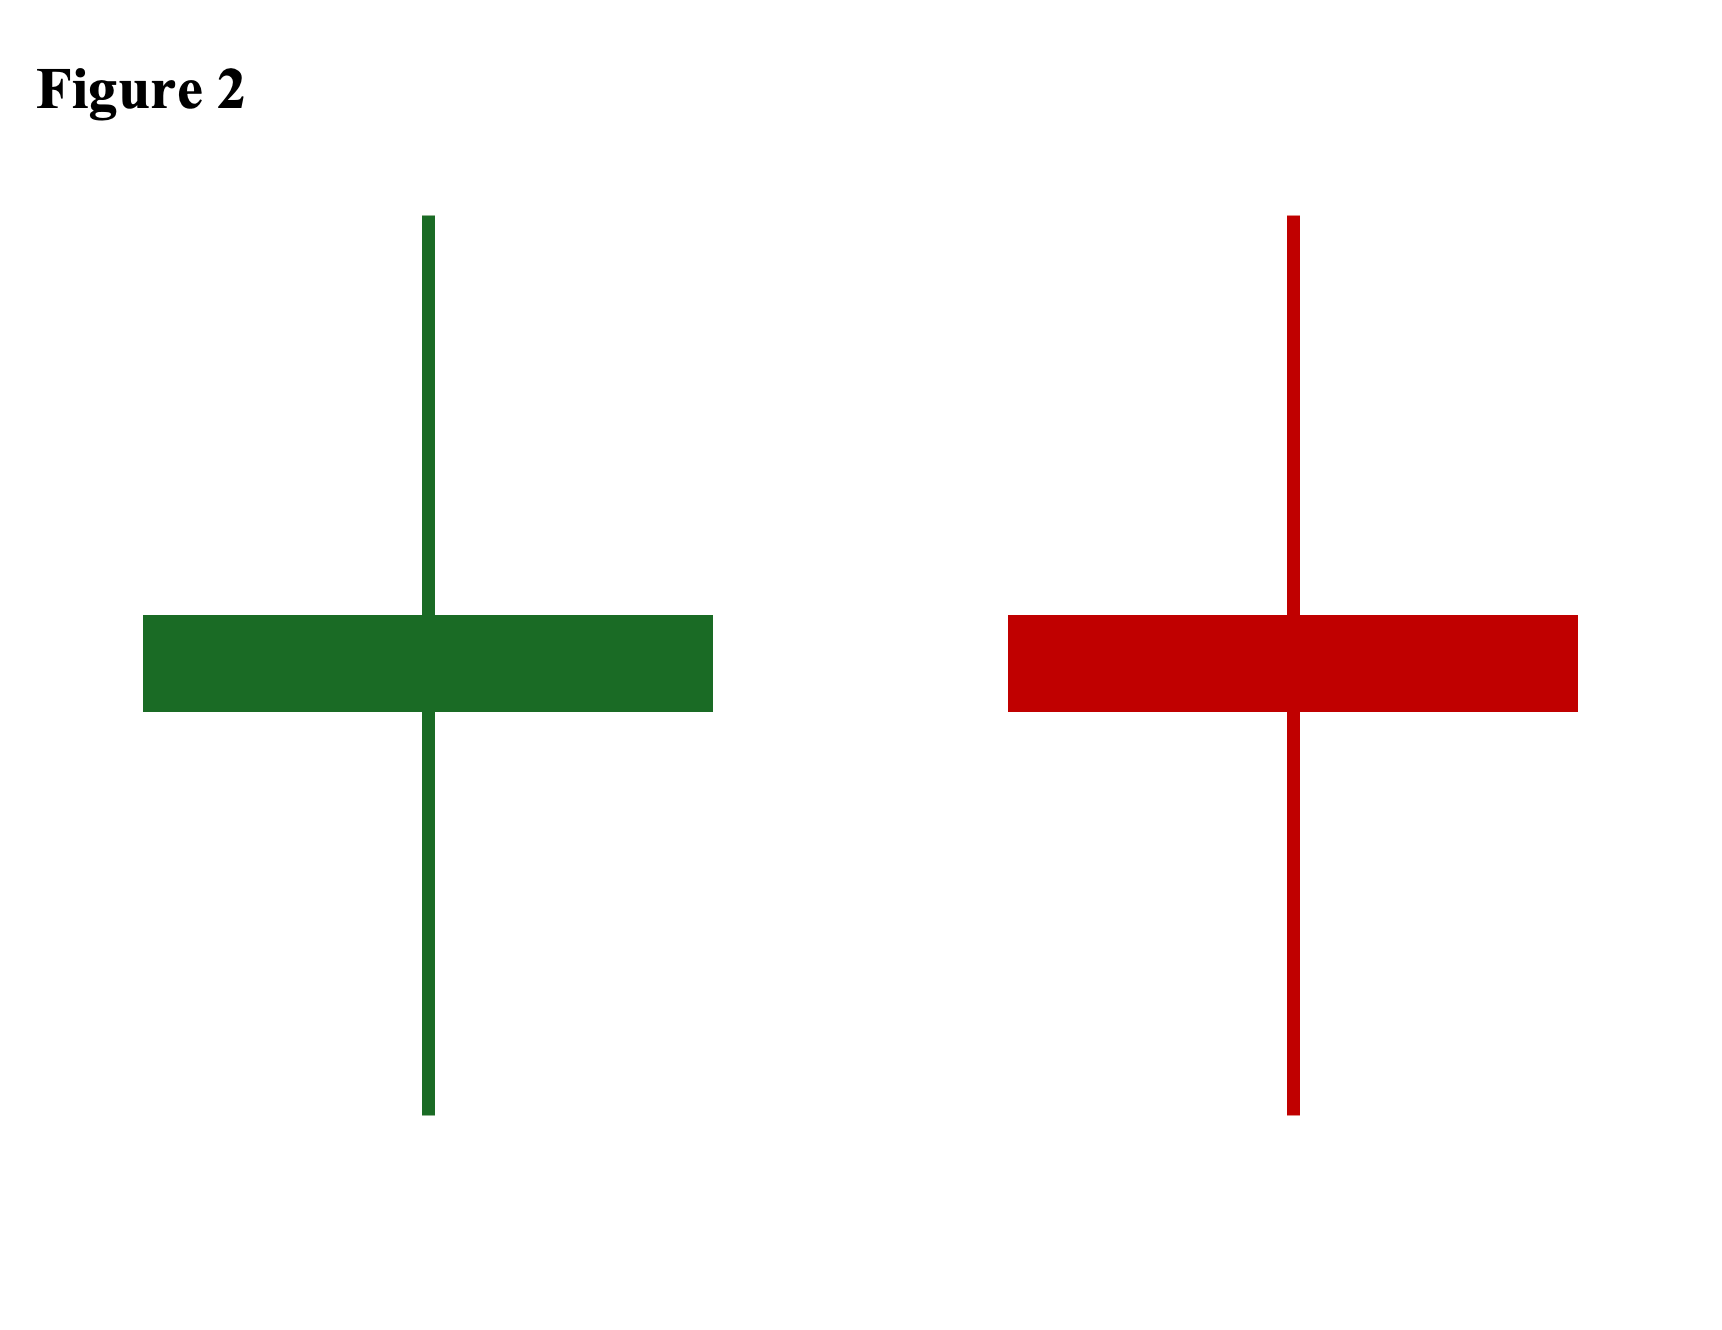
The following are the four variations of a double spinning top:
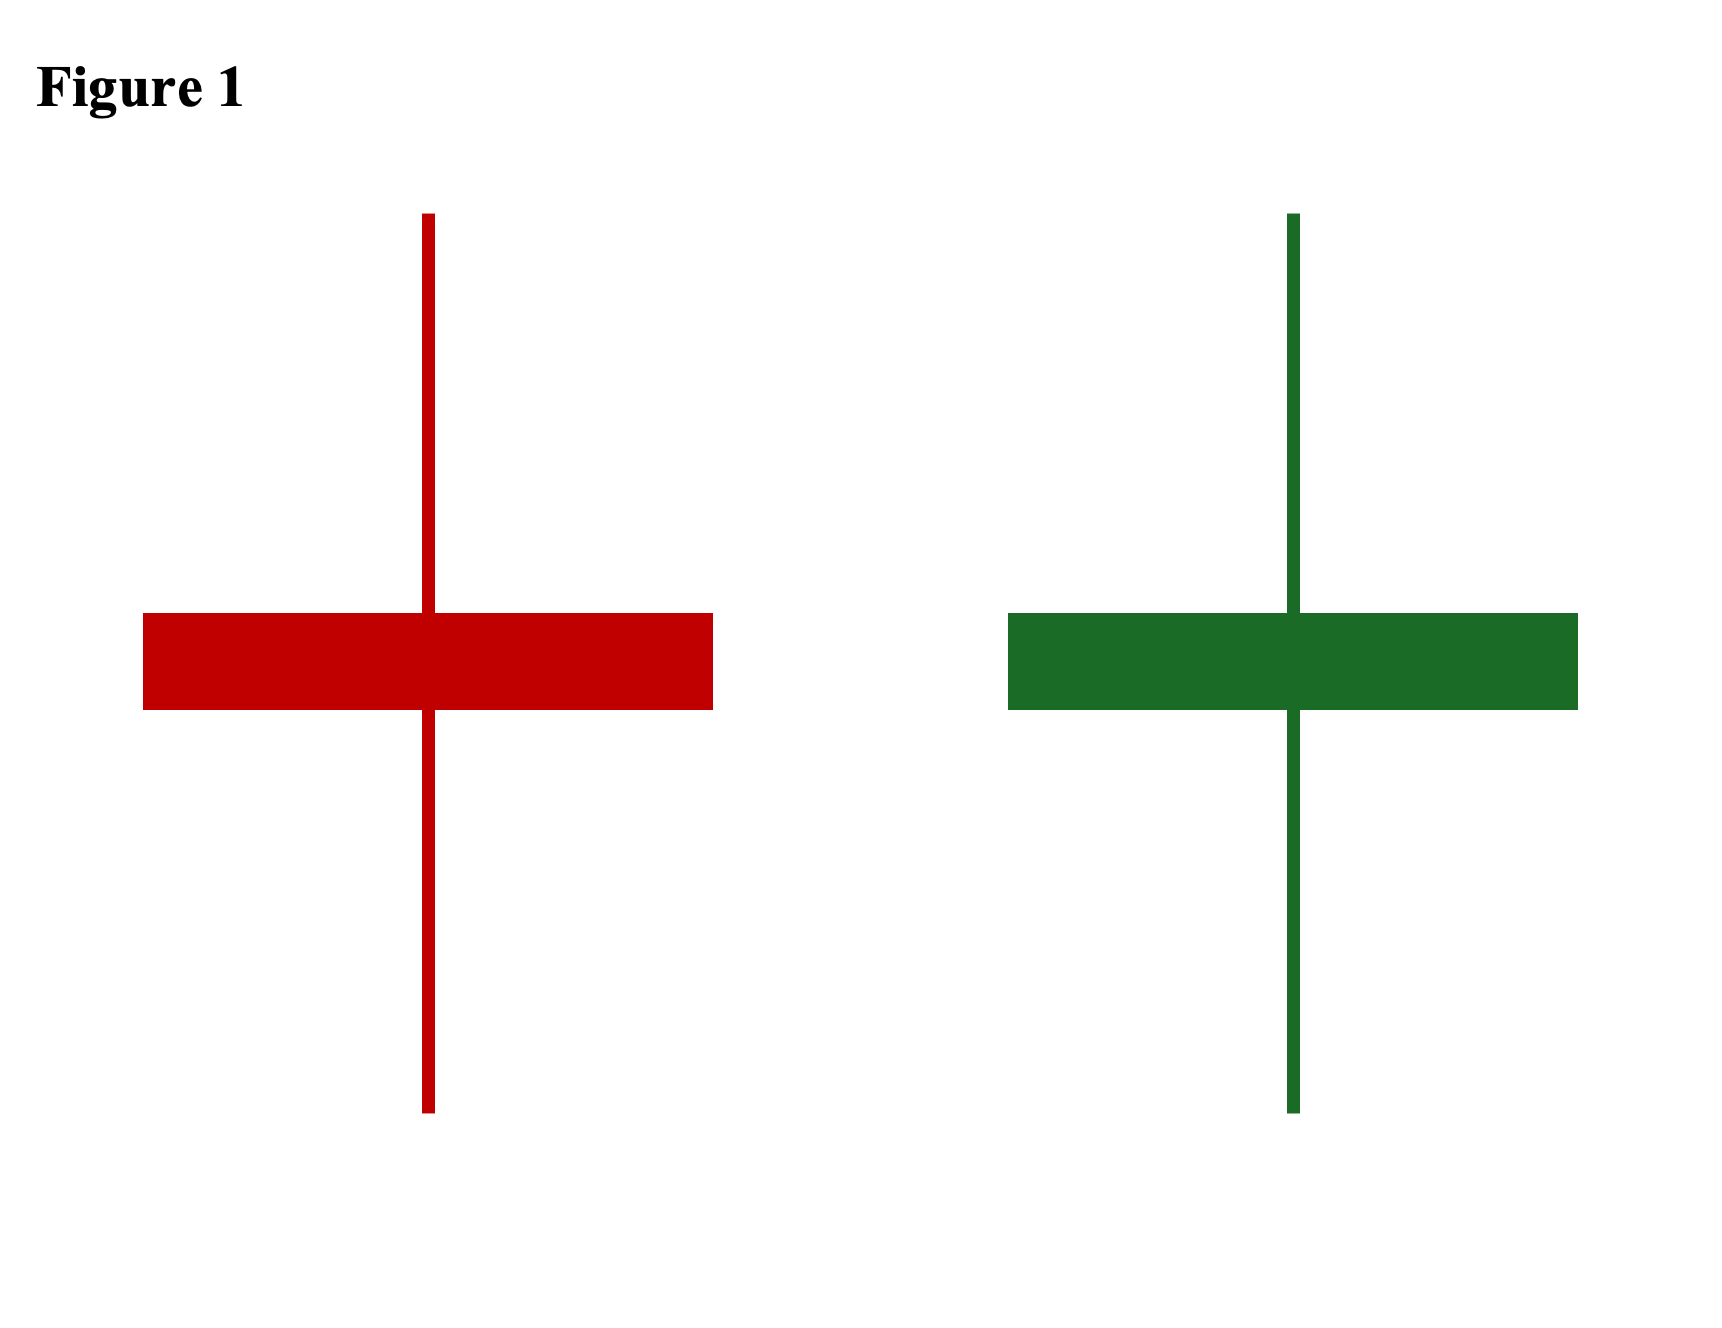
The first variation above shows a bearish-colored spinning top followed by a bullish-colored spinning top candle.
The second variation shows a bullish-colored spinning top followed by a bearish-colored spinning top candle.
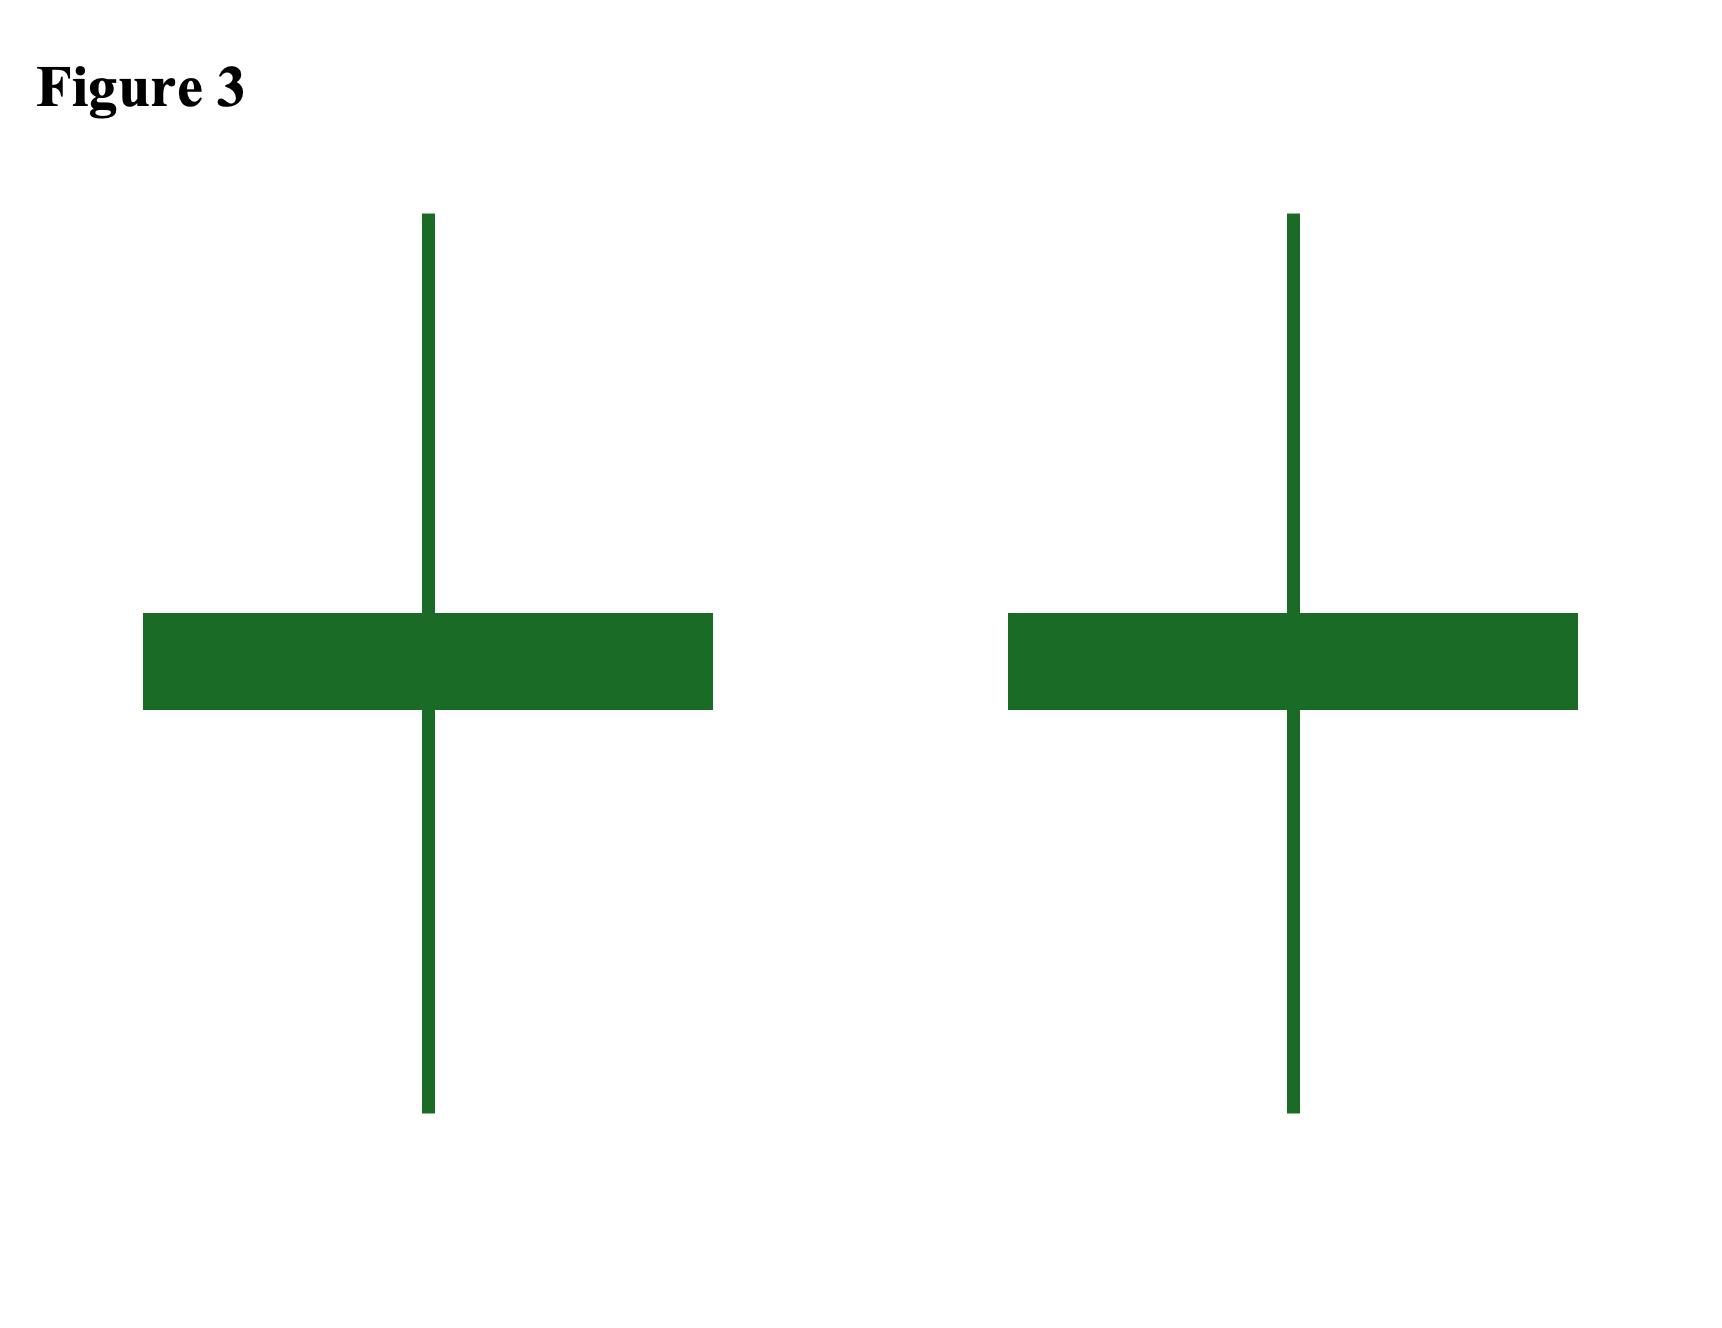
The third variation shows two consecutive bullish-colored spinning top pattern.
Finally, the fourth variation shows two consecutive bearish spinning top patterns.
Spinning Top Candlestick Examples
The following are five distinct scenarios where the spinning top candlestick pattern could occur:
Scenario #1: During an Uptrend – Followed by a Confirmation Candle
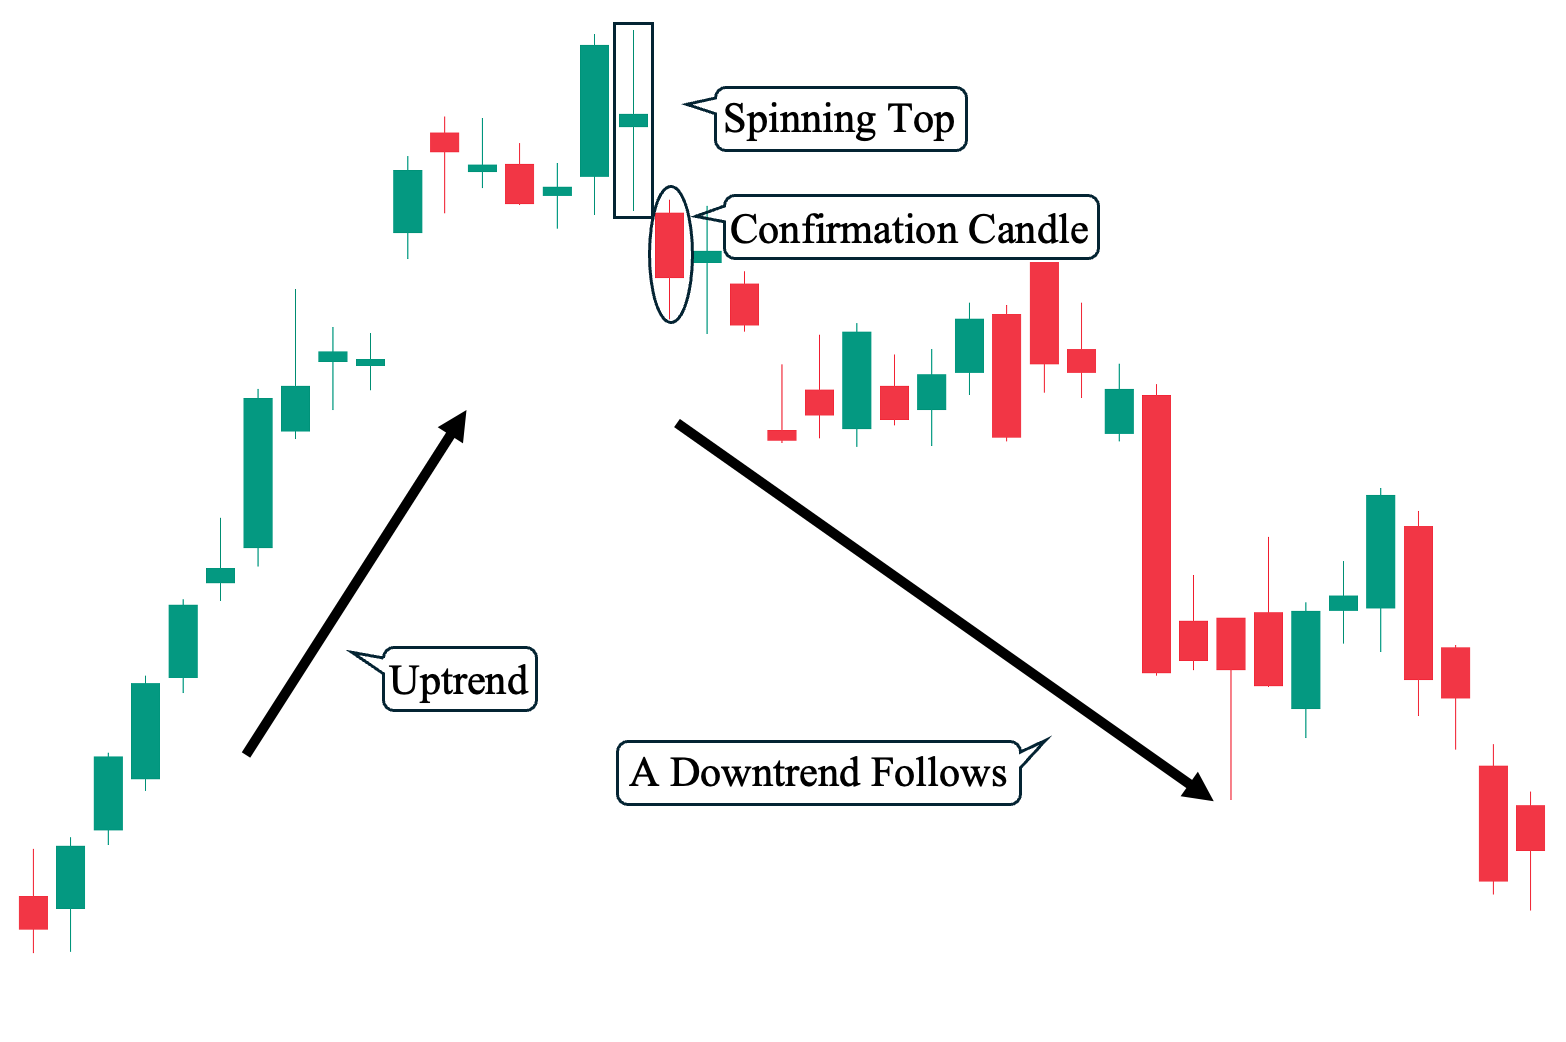
In this example, we can observe a clear uptrend before the spinning top candle occurred. Afterward, the spinning top candle is followed by a confirmation candle that signifies a shift in market sentiment from bullish to bearish—ultimately resulting in the downtrend that soon followed.
Scenario #2: During an Uptrend – Followed by a Continuation Candle
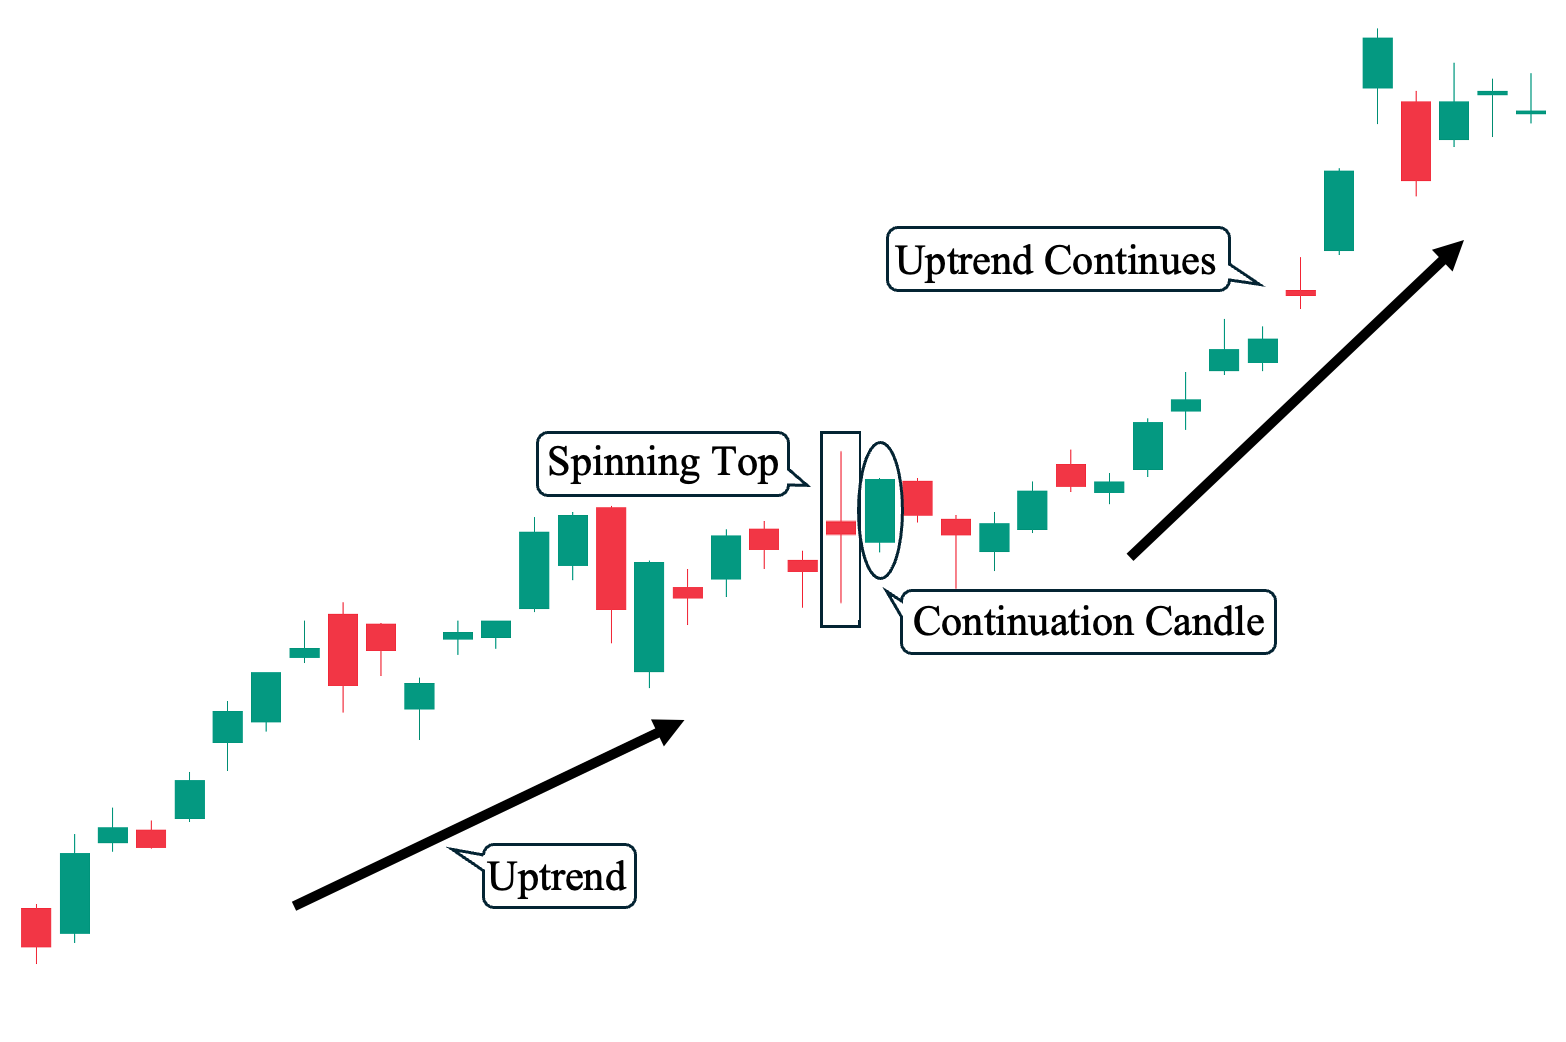
Similar to example #1, we can see a clear uptrend leading to the spinning top candle. However, the spinning top candle was followed by a bullish candle that served as a continuation pattern—signifying that the bullish market sentiment remained intact. Hence, the uptrend continued.
Scenario #3: During a Downtrend – Followed by a Confirmation Candle
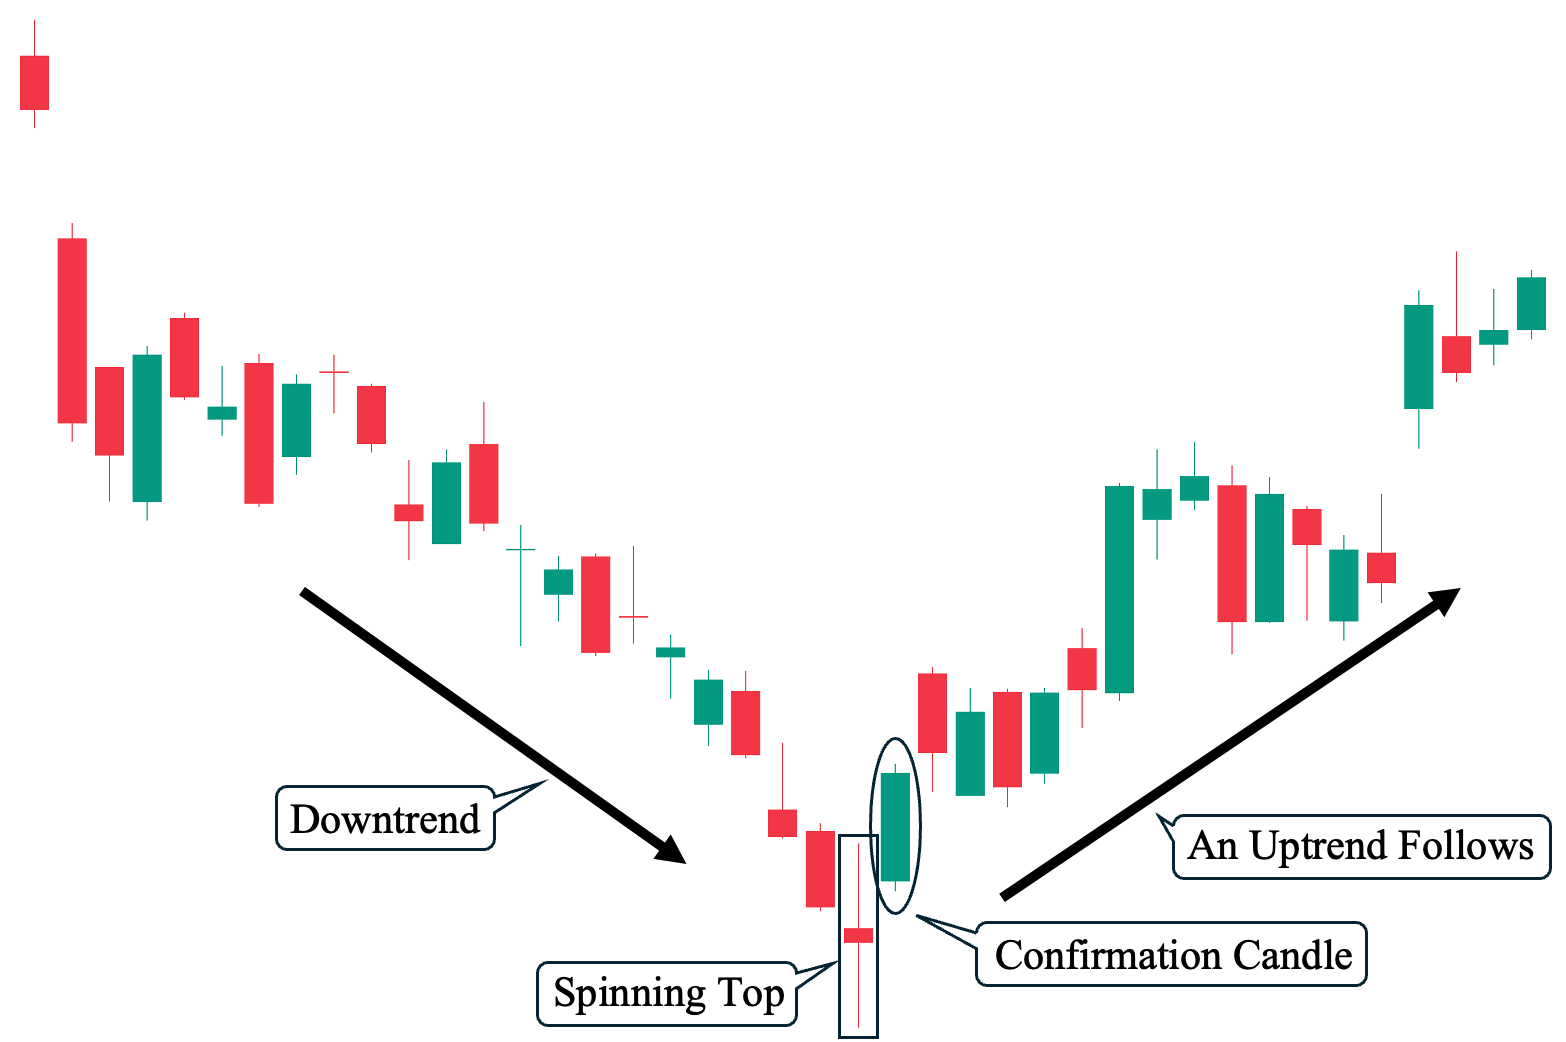
As shown, we can observe a downtrend before the spinning top candle occurred. The pattern was then followed by a bullish candle that served as a reversal—indicating that market sentiment had shifted from bearish to bullish. Eventually, an uptrend followed.
Scenario #4: During a Downtrend – Followed by a Continuation Candle
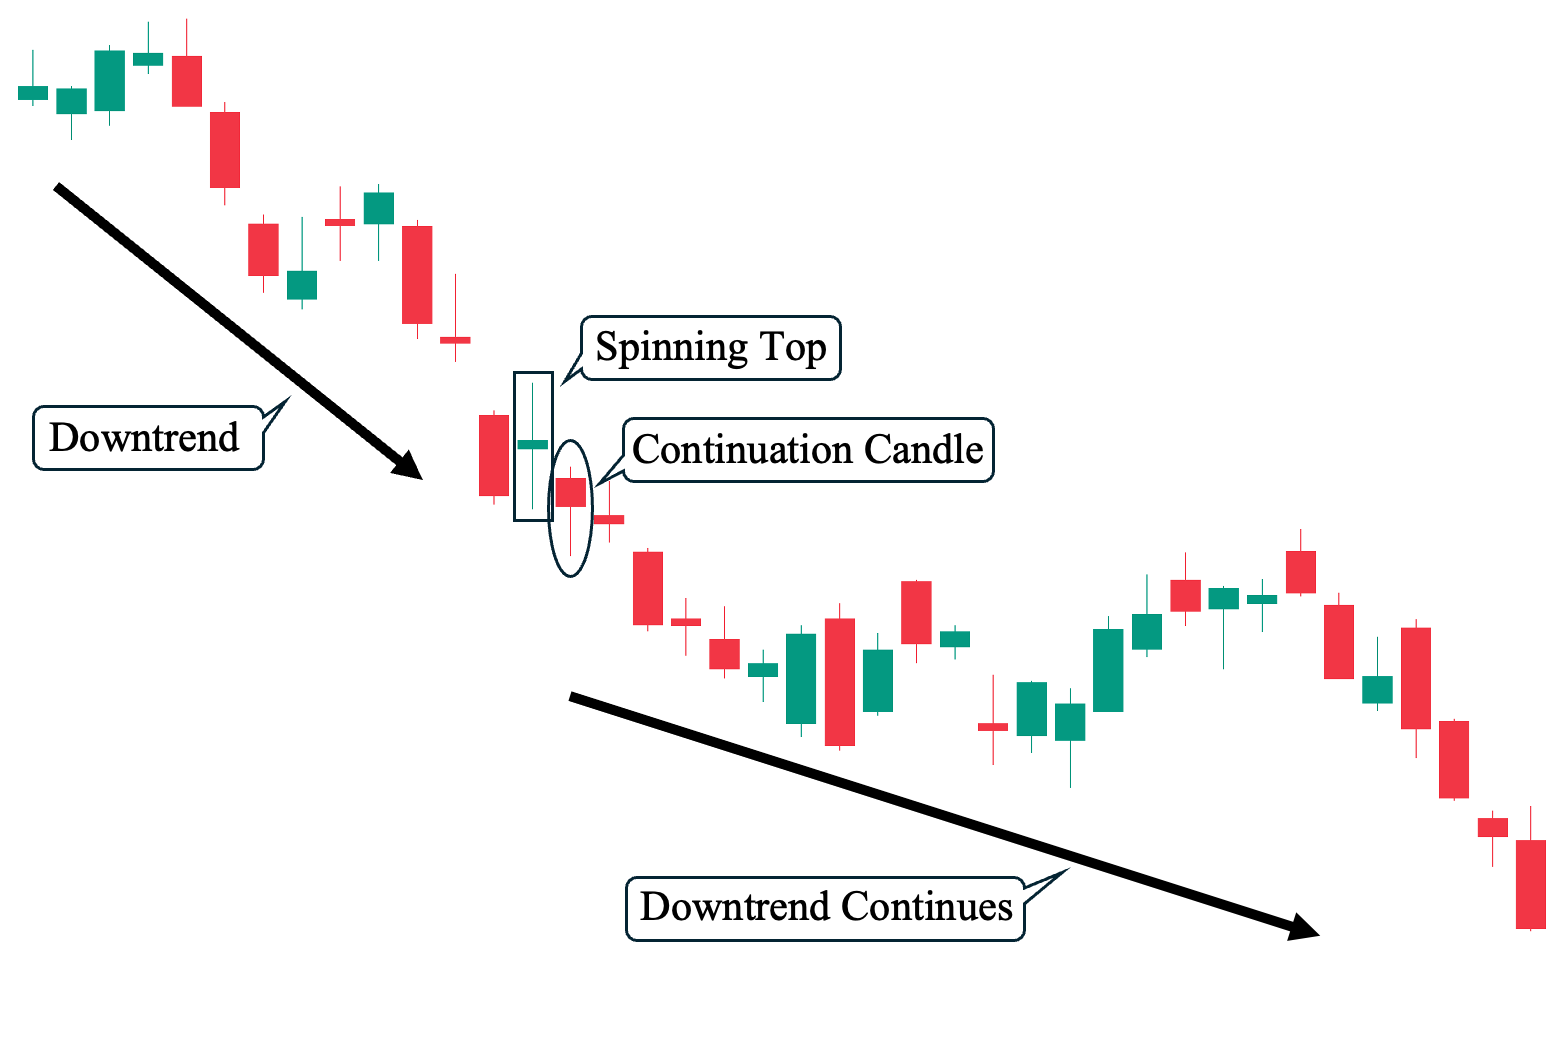
In contrast to example #3, despite a downtrend that also preceded the spinning top candle, it was followed by a bearish candle that served as a continuation candle and not a bullish candle, which could have served as a reversal confirmation candle. Hence, in this scenario, the downtrend eventually continued.
Scenario #5: Choppy Market or Consolidation Period
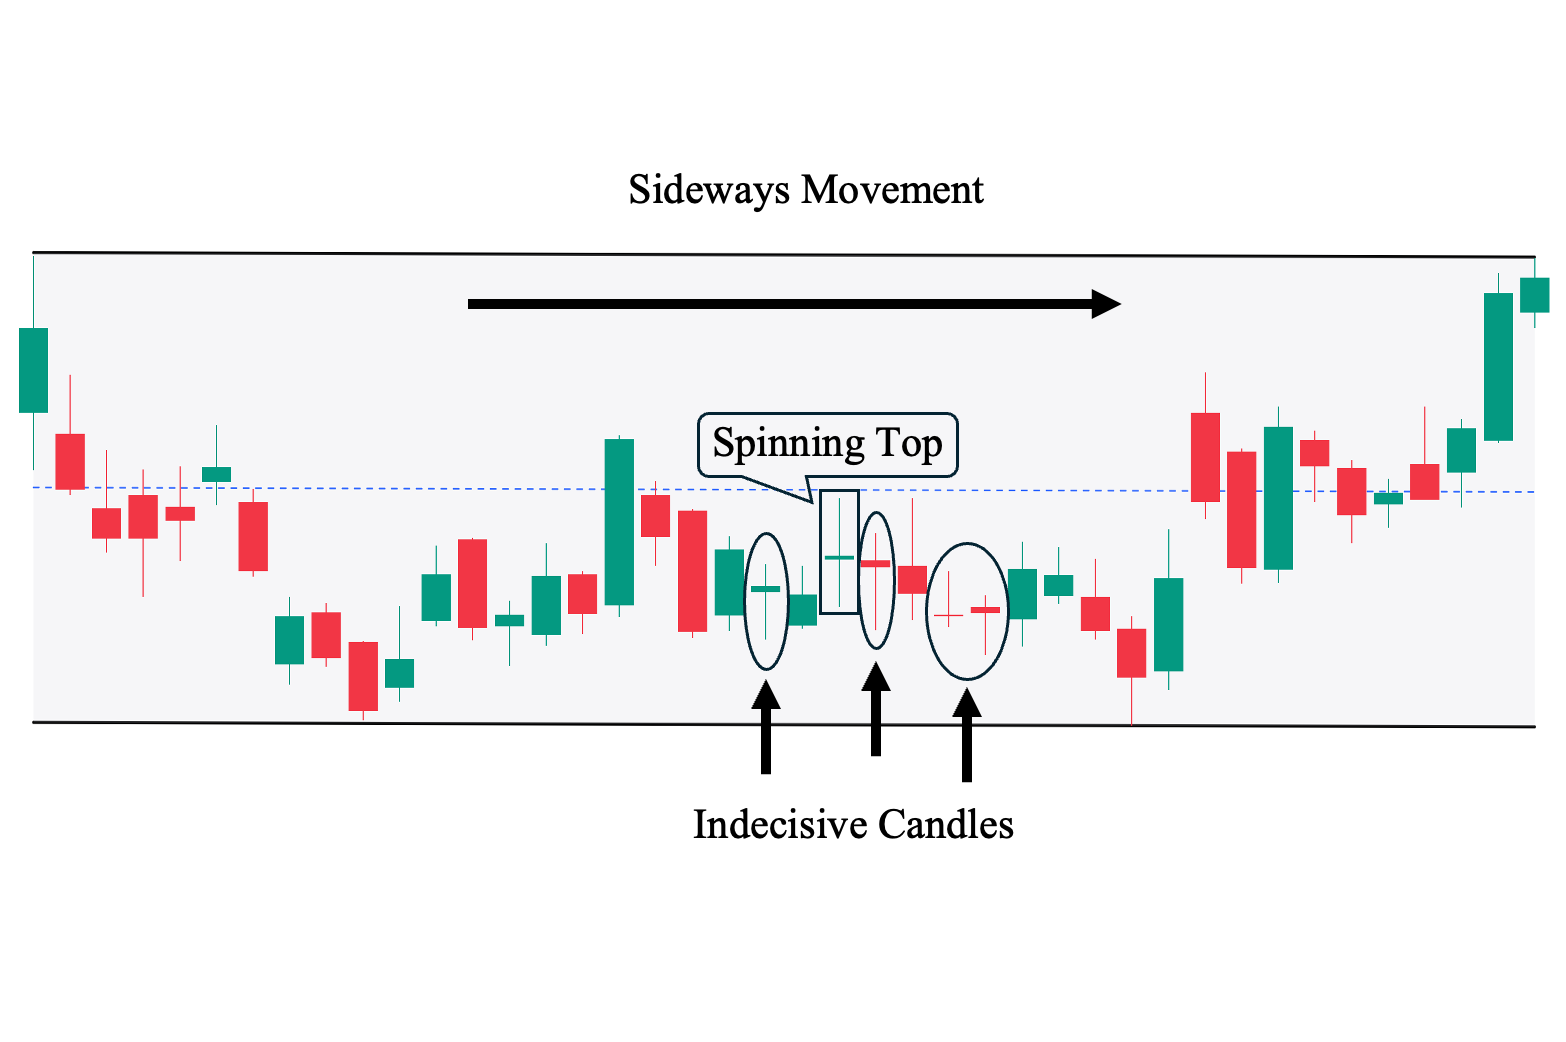
Finally, we would also like to show how prevalent indecisive candles—such as the spinning top—are in non-trending market conditions. In this example, we can see that there is no clear trend, and the price is bouncing back and forth within a set range. In this case, the spinning top does not serve any meaningful use, as market sentiment is already unclear and moving in a sideways manner.
Spinning Top Candlestick Pattern Trading Strategies
Moving on, here are the different ways to incorporate key technical analysis tools (including technical indicators) to trade a spinning top candlestick pattern when anticipating a potential trend reversal:
Spinning Top Candlestick with Relative Strength Index (RSI)
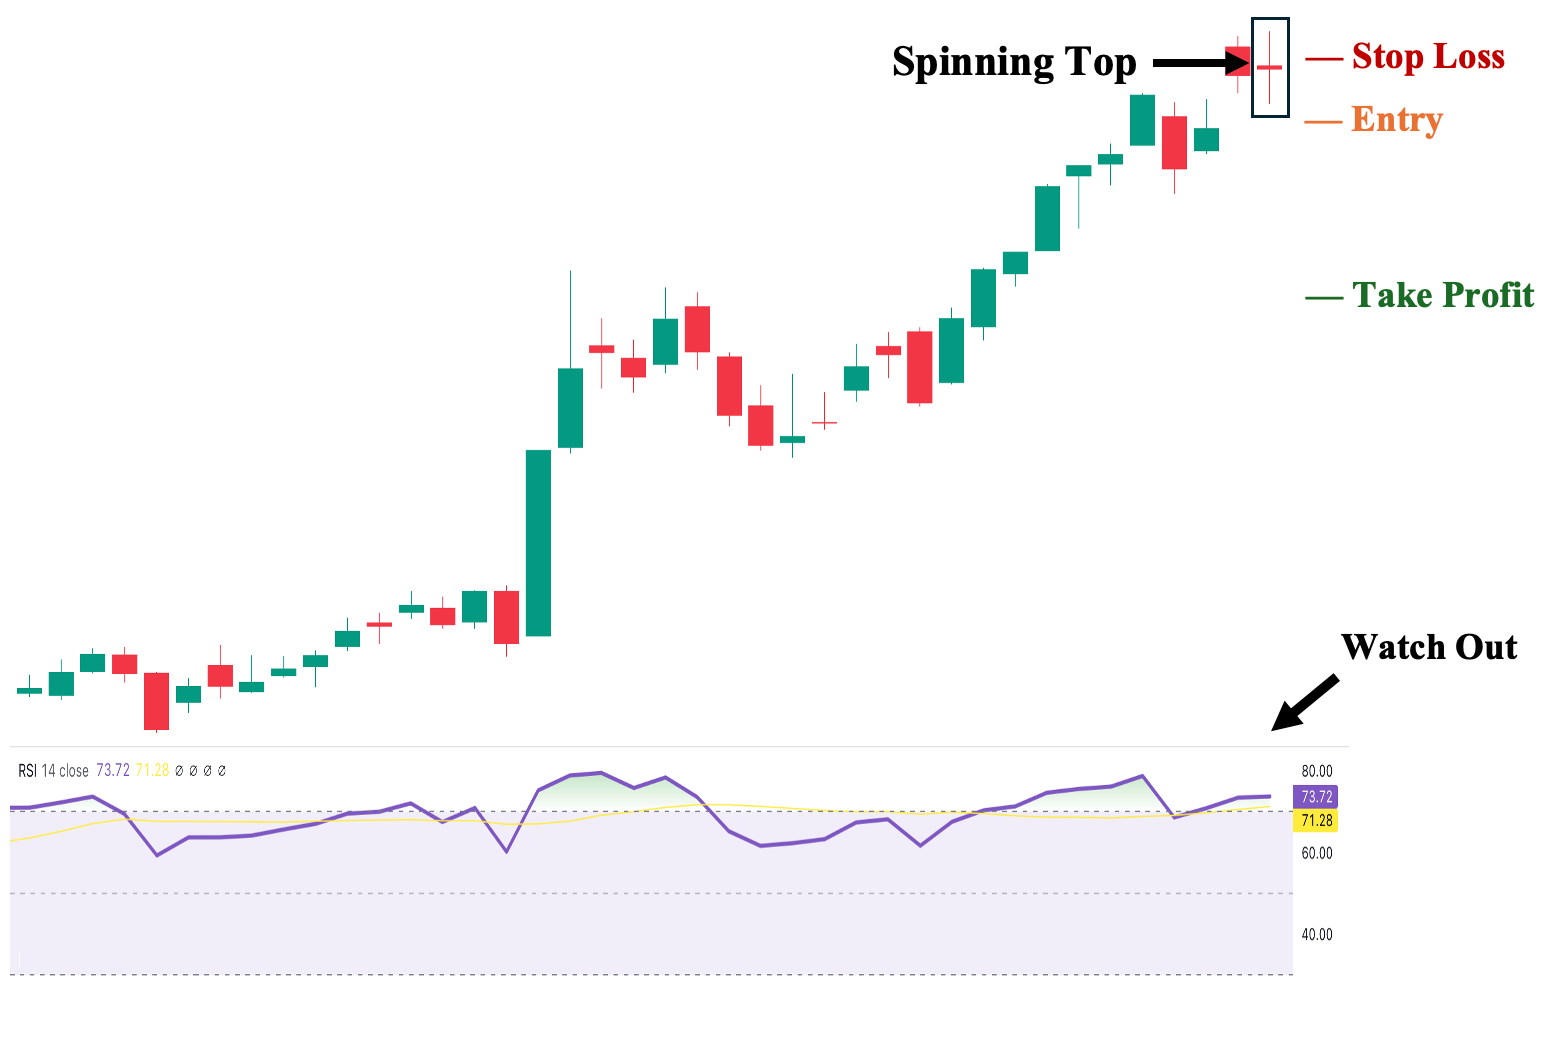
First, you can use the RSI indicator with the spinning top pattern to help you assess the trend’s strength. As a general rule, you want the RSI to be above 70 (overbought area) during uptrends and below 30 (oversold area) during downtrends. When the RSI is in these regions, either a possible reversal or trend continuation can be supported by sheer momentum.
Conversely, suppose the RSI is within the 30 to 70 range when the spinning top appears. In that case, the following candle may not effectively serve as a confirmation or continuation pattern as the trend has no meaningful momentum.
In addition, you can also use the RSI as a “divergence” tool to identify possible mismatches with price action. For example, suppose the spinning top is followed by a bearish candle, serving as a potential trend reversal for the ongoing uptrend and subsequently leading you to take a short position. Then, watch out when the RSI starts to point up, as it can serve as a leading indicator of a possible change in market sentiment.
- Suggested Entry: A few ticks below the low of the spinning top.
- Take Profit (TP) Level: Set your first TP a few ticks above the nearest structural support area of the previous uptrend. Then, use the RSI as a trailing stop by selling when it diverges from the price action (the price is going down, but the RSI is already pointing upward).
- Stop Loss Level: A few ticks above the closing price of the spinning top—as this will potentially invalidate the reversal set-up.
- Risk-Reward Ratio: At least 1:1. We highly recommend not taking trades with a risk/reward ratio lower than 1:1. The higher the potential reward compared to risk, the better.
Spinning Top Candlestick with Moving Average Convergence/Divergence (MACD)
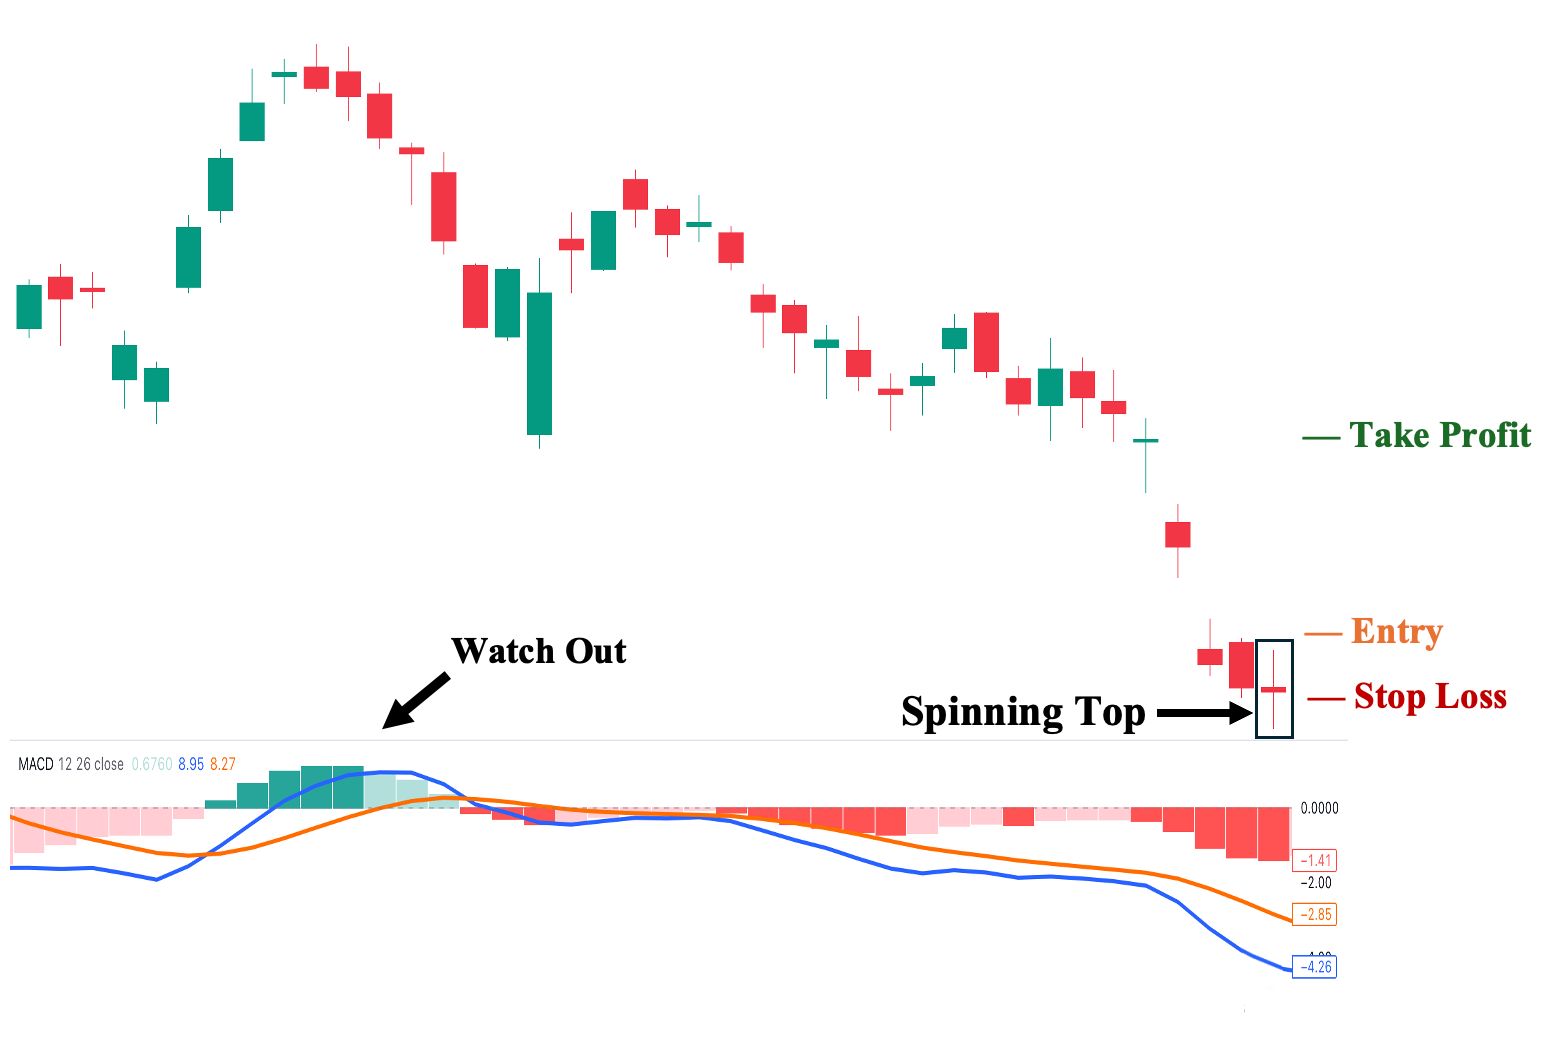
Second, like other technical indicators (notably, the RSI), you can also use the MACD to help you pinpoint specific points of market sentiment shifts. As shown, there are two primary lines—the blue (which is called the MACD line) and the orange (which is referred to as the ‘Signal’ line).
When the orange line is above the blue line, the market sentiment is overall bearish, while when the blue line is above the orange line, the market sentiment is generally bullish. Hence, there is usually a noteworthy price action movement when these two lines cross over, indicating a shift in market sentiment, and you can use this to guide your trailing stop decision.
- Suggested Entry: A few ticks above the high of the spinning top.
- Take Profit (TP) Level: Set your first TP a few ticks below the nearest structural resistance area of the previous downtrend. Then, use the MACD as a trailing stop (consider selling when a crossover occurs).
- Stop Loss Level: A few ticks below the closing price of the spinning top—as this will potentially invalidate the reversal set-up.
- Risk-Reward Ratio: At least 1:1. We highly recommend not taking trades with a risk/reward ratio lower than 1:1. The higher the potential reward compared to risk, the better.
Spinning Top Candlestick with Fibonacci Retracement Levels
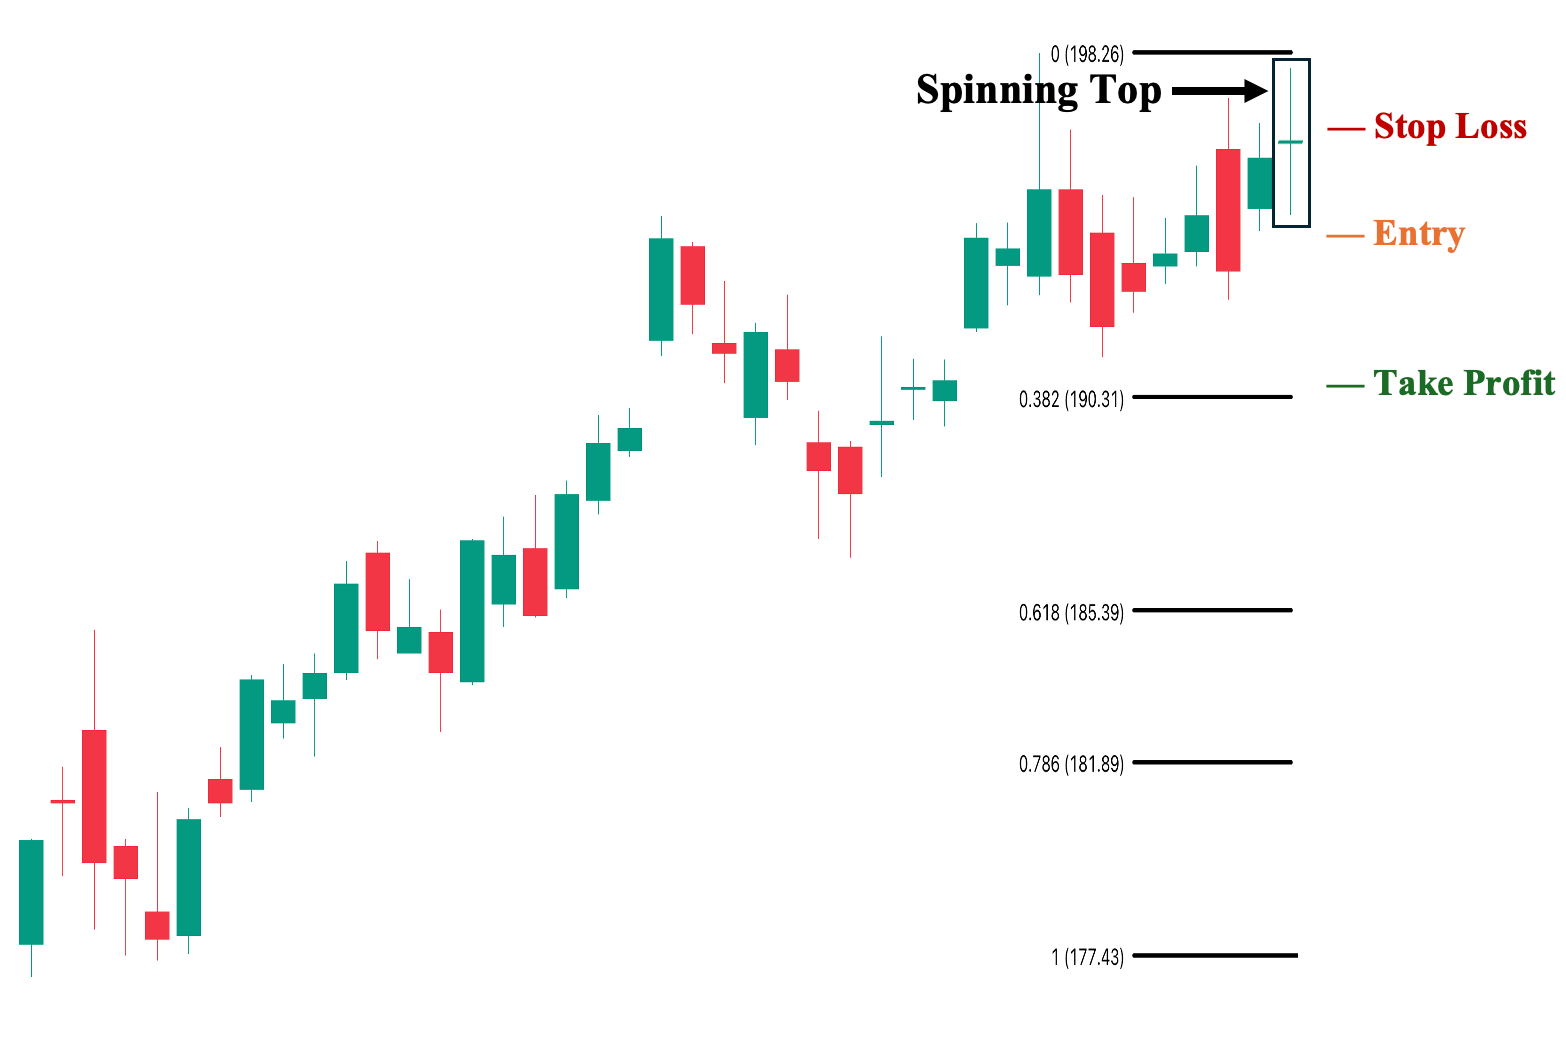
Third, you can use Fibonacci retracement (Fib) levels with the spinning top pattern to pinpoint key price levels where the asset or financial instrument may potentially “retrace” or pull back before continuing its move in the event of a trend continuation, or where the asset may encounter a price wall (major support or resistance levels) during a trend reversal. Therefore, Fib helps pinpoint valid target price levels and subsequent trailing stops. Moreover, Fib levels are stronger when they coincide with structural price (support and resistance) levels.
- Suggested Entry: A few ticks below the low of the spinning top.
- Take Profit (TP) Level: Set your first TP a few ticks just above the nearest key Fibonacci level, which in this case is the 0.382 level.
- Stop Loss Level: A few ticks above the closing price of the spinning top.
- Risk-Reward Ratio: At least 1:1. We highly recommend not taking trades with a risk/reward ratio lower than 1:1. The higher the potential reward compared to risk, the better.
Spinning Top Candlestick with Volume Indicator
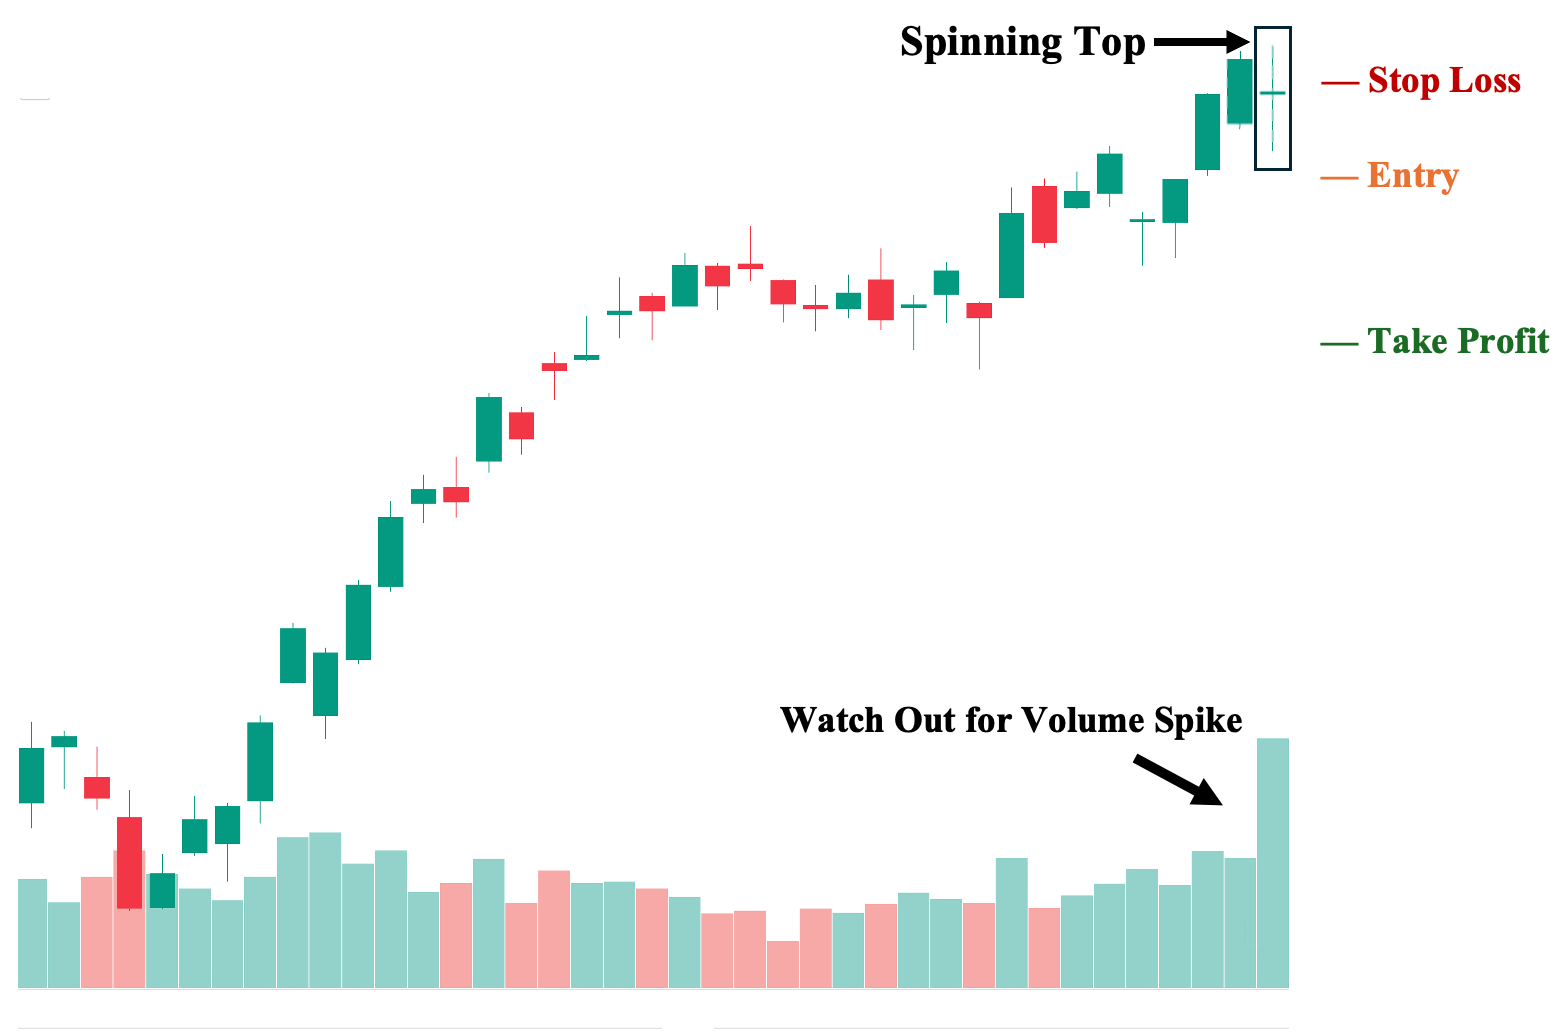
Fourth, using volume with price action is crucial in understanding the market context of the spinning top pattern. For instance, as we can see on the chart, the spinning top is backed by substantial volume, roughly twice the daily average. This can indicate that the upcoming move will likely be significant in either direction—further trend continuation or possible reversal. This is because, as a technical analysis tool, the volume reflects possible “selling at the top,” indicating a price ceiling and an eventual trend reversal, or potential “accumulation,” which can propel the price further. Upon seeing the potential reversal confirmation or continuation candle, we can take a position and closely watch the volume for any significant spike to guide our trailing stop.
- Suggested Entry: A few ticks below the low of the spinning top.
- Take Profit (TP) Level: Set your first TP a few ticks above the nearest structural support area. Then, watch for any substantial spike in daily Volume to guide your trailing stop.
- Stop Loss Level: A few ticks above the closing price of the spinning top.
- Risk-Reward Ratio: At least 1:1. We highly recommend not taking trades with a risk/reward ratio lower than 1:1. The higher the potential reward compared to risk, the better.
Advantages of Trading the Spinning Top Candlestick Pattern
1. Easy to Identify and Plan Around
Perhaps the most straightforward yet one of the most pressing advantages of the spinning top candlestick pattern is its simplicity—it’s just one candle with a short body and long wicks on both sides. Hence, even total beginners can identify this candle on a chart.
That said, due to its ease of identification, it also simplifies planning around it. For instance, when you are trading a trending asset—whether it is in an uptrend or a downtrend—you can set a condition that when you observe a spinning top, you will avoid making any trading decisions until the following candle—no ifs, ands, or buts.
2. Can Be Used to Track the Day’s Bias
Pro Tip: Despite technically being a neutral pattern that signifies uncertainty about the price’s direction, you can dissect this single candle to help you decipher where it will likely go the following day. This can be done by looking at a shorter time frame on your chart.
For instance, if the spinning top develops on the daily chart, you can lower your time frame to hourly to see how it formed during the day. If, for example, you notice that early in the day, it moved up aggressively, then suddenly shifted to the downside, hitting the candle’s eventual lowest point before going up to the middle, where it eventually settled at its closing price, you can infer that the bias is generally on the downside. That said, this cycle can actually happen more than once, particularly if the asset is highly volatile (with high volume).
This is useful when your trading strategy is intraday in nature (assuming your chart is set to daily) or when you want to dispose of your asset at the following day’s opening. However, this is not a substitute for the following candle to serve as a confirmation—which is much more reliable. We simply want to show that even “neutral” candles can have a bias toward a specific direction.
3. Provides Potential Entry During Parabolic or High Momentum Moves
A spinning top chart pattern can provide a possible entry point when utilizing a momentum trading approach. This is because highly volatile assets that reflect a high degree of interest from market participants tend to move fast and sharply over a short period of time. For instance, this can look like a major breakout from a prolonged sideways movement. When such a breakout occurs, it usually catapults the price, making substantially higher highs and higher lows in just a few trading sessions.
The tricky part in this scenario is entering the trade, as double-digit changes can occur each day, and it may not present a viable entry point with apparent cut-loss points and an attractive risk-reward ratio. In this case, a Spinning Top can indicate that the price is resting as it closes near where it opens (despite the wild price swings within the day that are reflected in the long wicks). Even better, you can choose to wait for the next candle or candles to present a potentially better entry, particularly if the price has normalized for the time being. This period is usually referred to as ‘pause days’ and is characterized by relatively shorter candles after a parabolic move and before the asset moves once again with high momentum.
Disadvantages of Trading the Spinning Top Candlestick Pattern
1. Lack of Clear Direction on Its Own and the Need for a Confirmation
As a neutral pattern, the most evident disadvantage of a spinning top pattern is its inability to indicate where the price is likely headed when used alone. Yes, it clearly shows indecisiveness and uncertainty, but indecisiveness is not a direction; it’s just a state during a point in time. Hence, a spinning top is usually analyzed with the following candle in mind to determine whether the asset is more likely to continue its trend or make a trend reversal. In fact, relying on the spinning top as a standalone tool to determine future price direction is simply irresponsible, especially for beginners.
2. Can Falsely Signal Indecision/Uncertainty During Long-Term Trends
This may sound counterintuitive, but if you utilize the spinning top during a long-term downtrend or uptrend (spanning over six months to a few years), while the asset may still technically be considered “trending” as there is still a clear presence of a trend, it may not be as strong as short-term and medium-term trending assets.
In this case, there are usually periods within this long-term downtrend or uptrend where the price is simply moving without momentum (e.g., days or weeks where it is moving sideways inside an uptrend/downtrend). During this period, indecisive candles may be more prevalent, including spinning tops and different types of doji candlestick pattern. The problem is that this period may not necessarily reflect indecision about where the asset is going (since it will most likely continue with its long-term trend) but may simply be a result of the low volume being traded during this period.
3. Can Simply Be a Result of Low Market Interest
Finally, in relation to the low volume during technically “trending” periods, indecisive candles—including the spinning top—may simply be a by-product of lower liquidity caused by low market interest. When market interest is low, the asset can be easily pushed between two price extremes on that specific day. Hence, this gives the appearance of a short body and long wicks. This is why analyzing this pattern together with the volume indicator is vital to pinpoint valid spinning tops to watch out for.
Spinning Top vs. Doji Candles
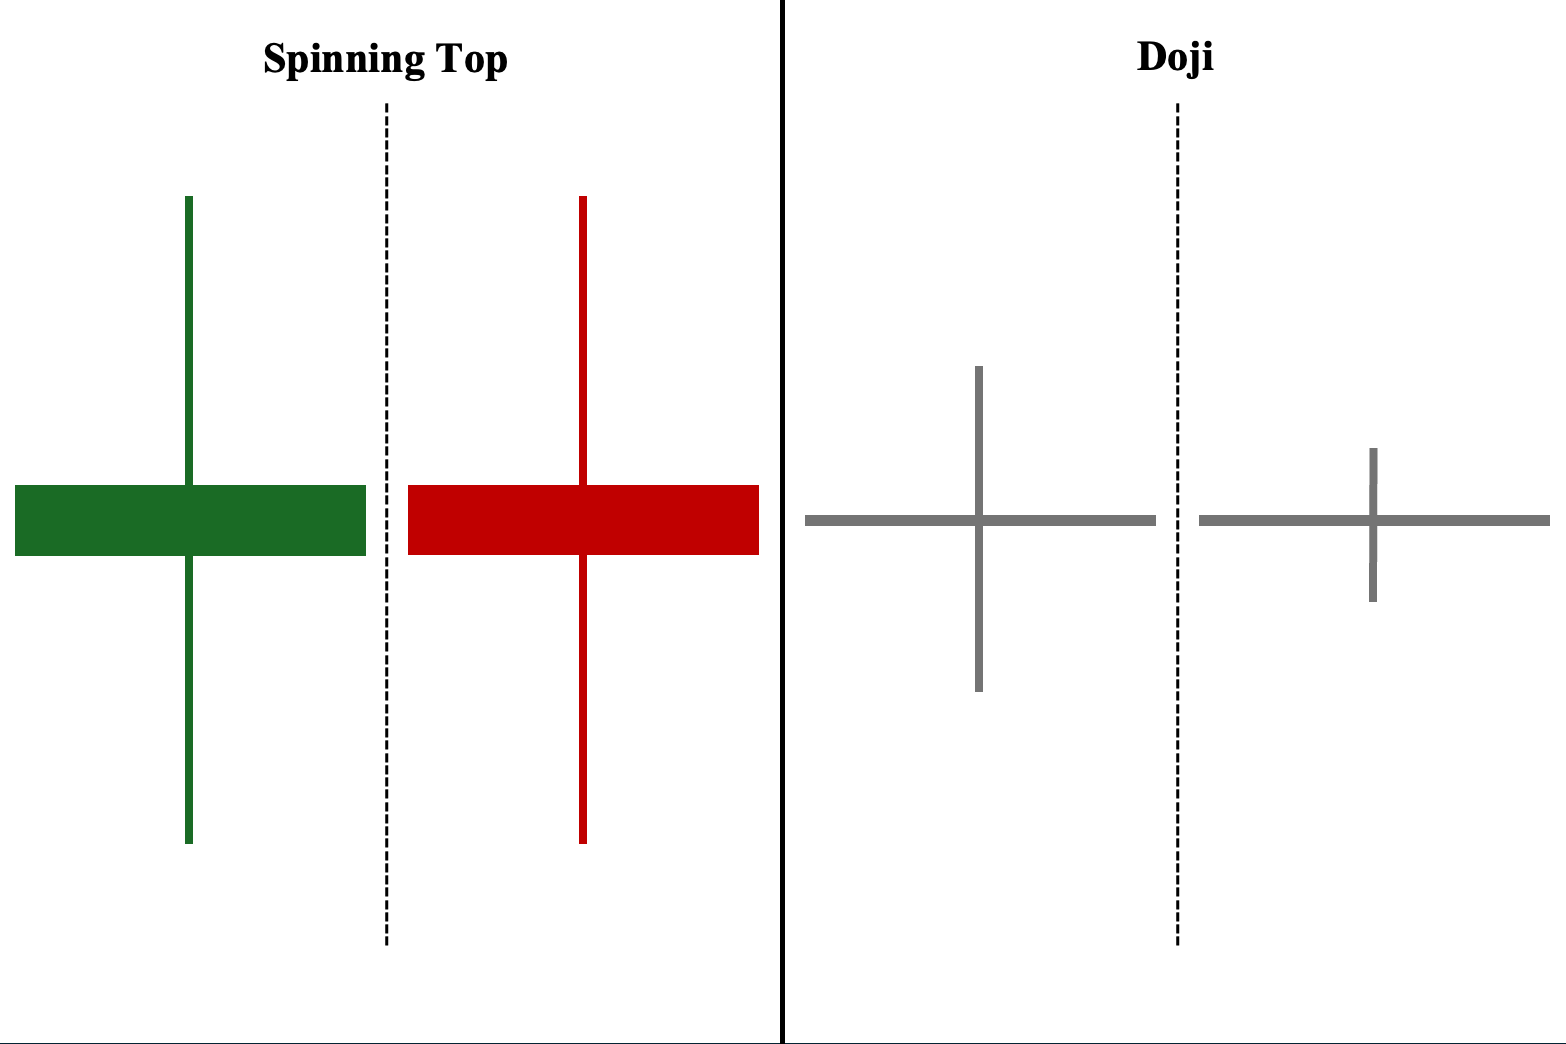
The spinning top and doji are both neutral one-candlestick patterns that signify indecisiveness and uncertainty about where the price is likely headed. The difference is that spinning top candlesticks usually have real bodies—despite how small they may seem—and much longer wicks on both sides.
In contrast, a doji candlestick pattern usually has no real body and relatively much shorter wicks. There is no difference in how both are used, as they can be used effectively in both uptrends and downtrends, except, of course, during non-trending periods.
Spinning Top vs. Hammer
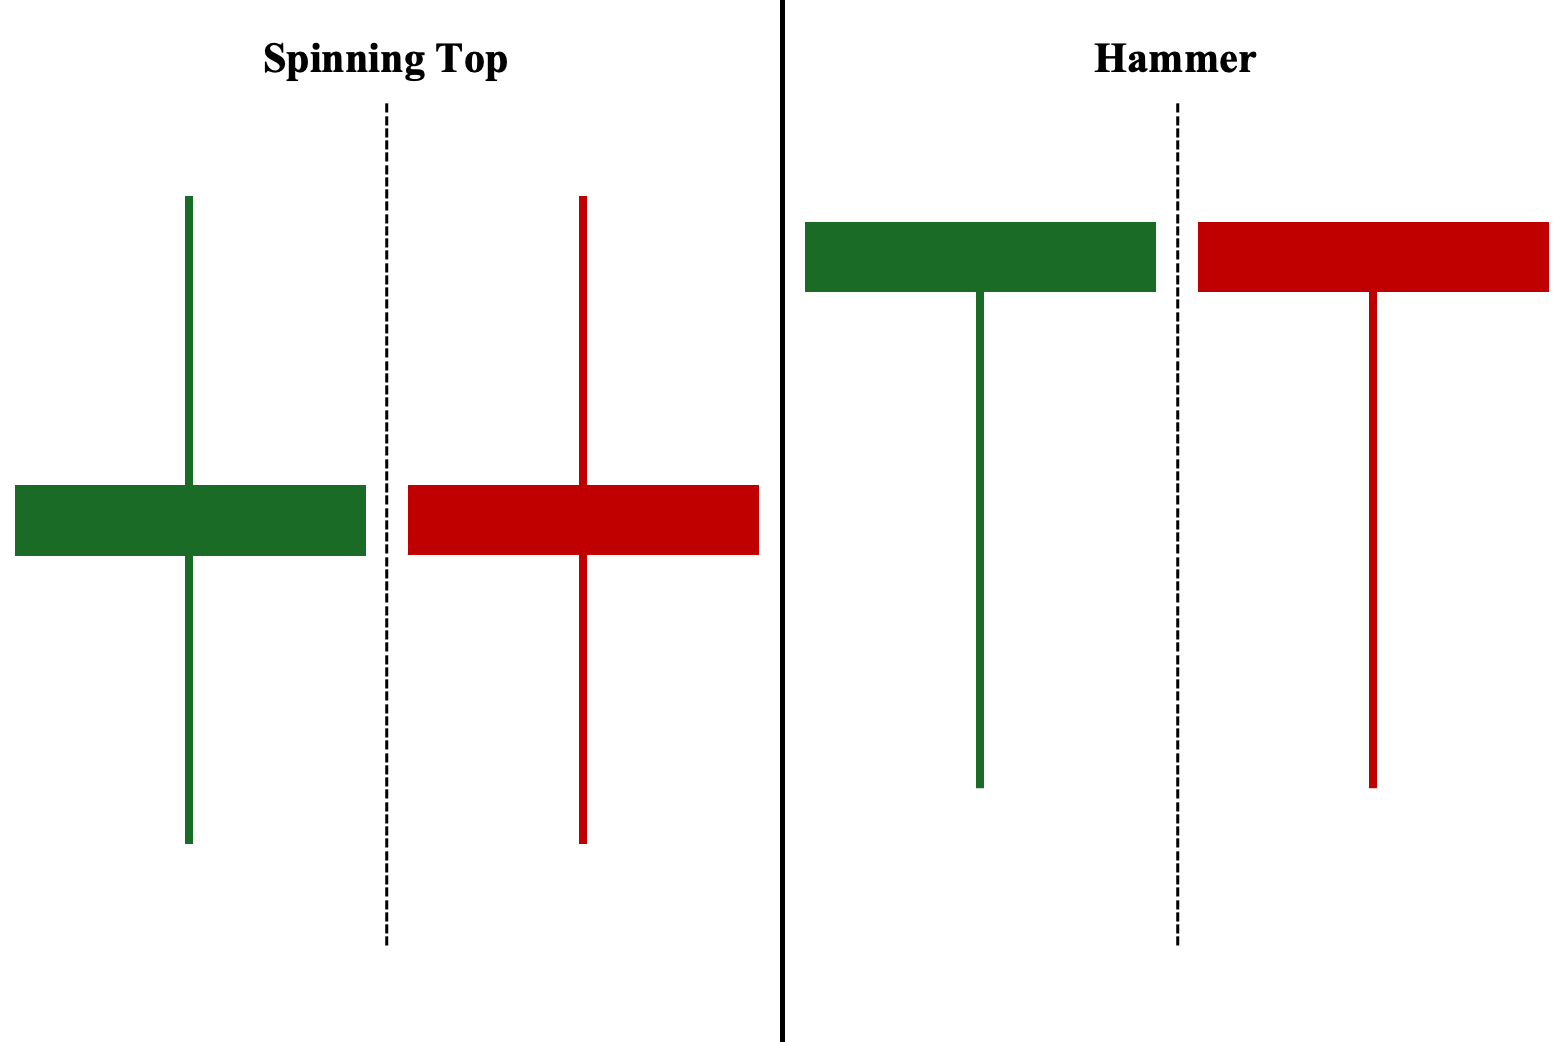
Both the spinning top and hammer are also one-candlestick patterns. However, unlike the doji candlestick pattern, the hammer pattern is mainly used as a bullish reversal pattern during downtrends.
The pattern (remember that the color is irrelevant) signals that there has been a substantial rejection of lower prices, due to its long lower shadows or wick. This can indicate that the asset has reached its lowest point or there was a substantial buying interest that prevented it from closing much lower and, therefore, may soon be due for a possible reversal to the upside.
Spinning Top vs. Pin Bar
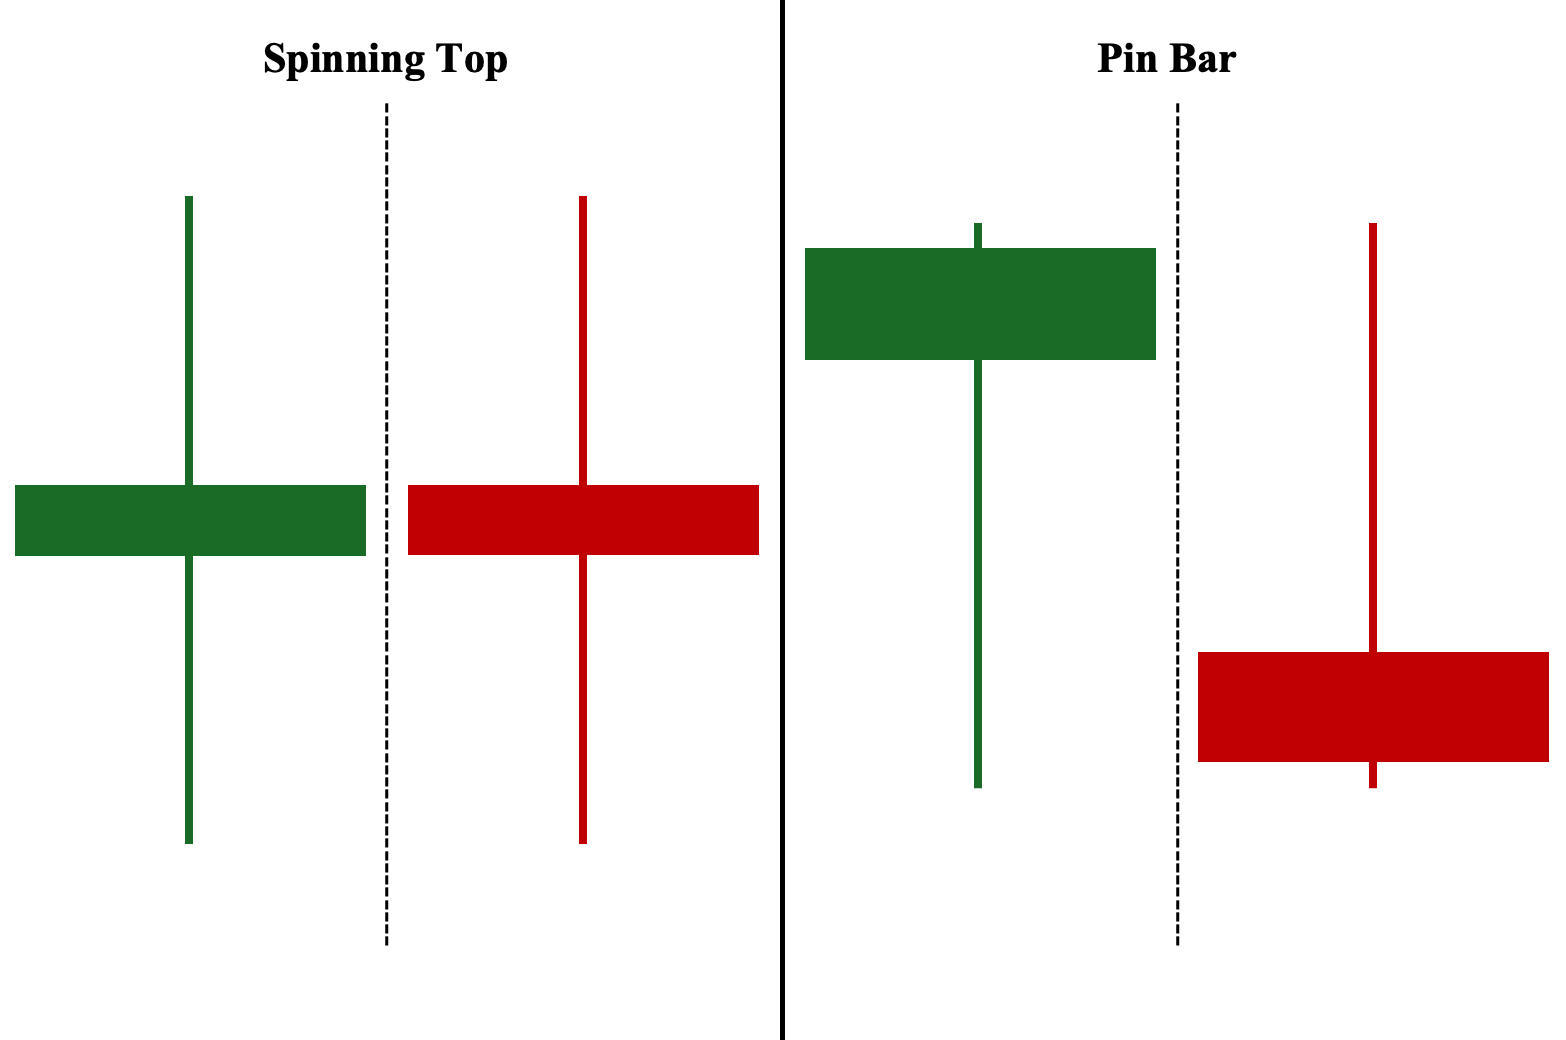
Both the spinning top and pin bar are one-candlestick patterns. Again, the color is irrelevant for the pin bar; the important aspect to look at is the shape. In fact, pin bars and hammers resemble each other. However, pin bars usually have relatively larger real bodies and a small wick at the opposite end of the candle’s long wick.
Based on their shape, pin bars are classified as either a bullish reversal pattern (during downtrends), or a bearish reversal pattern (during uptrends).
Spinning Top vs. Marubozu
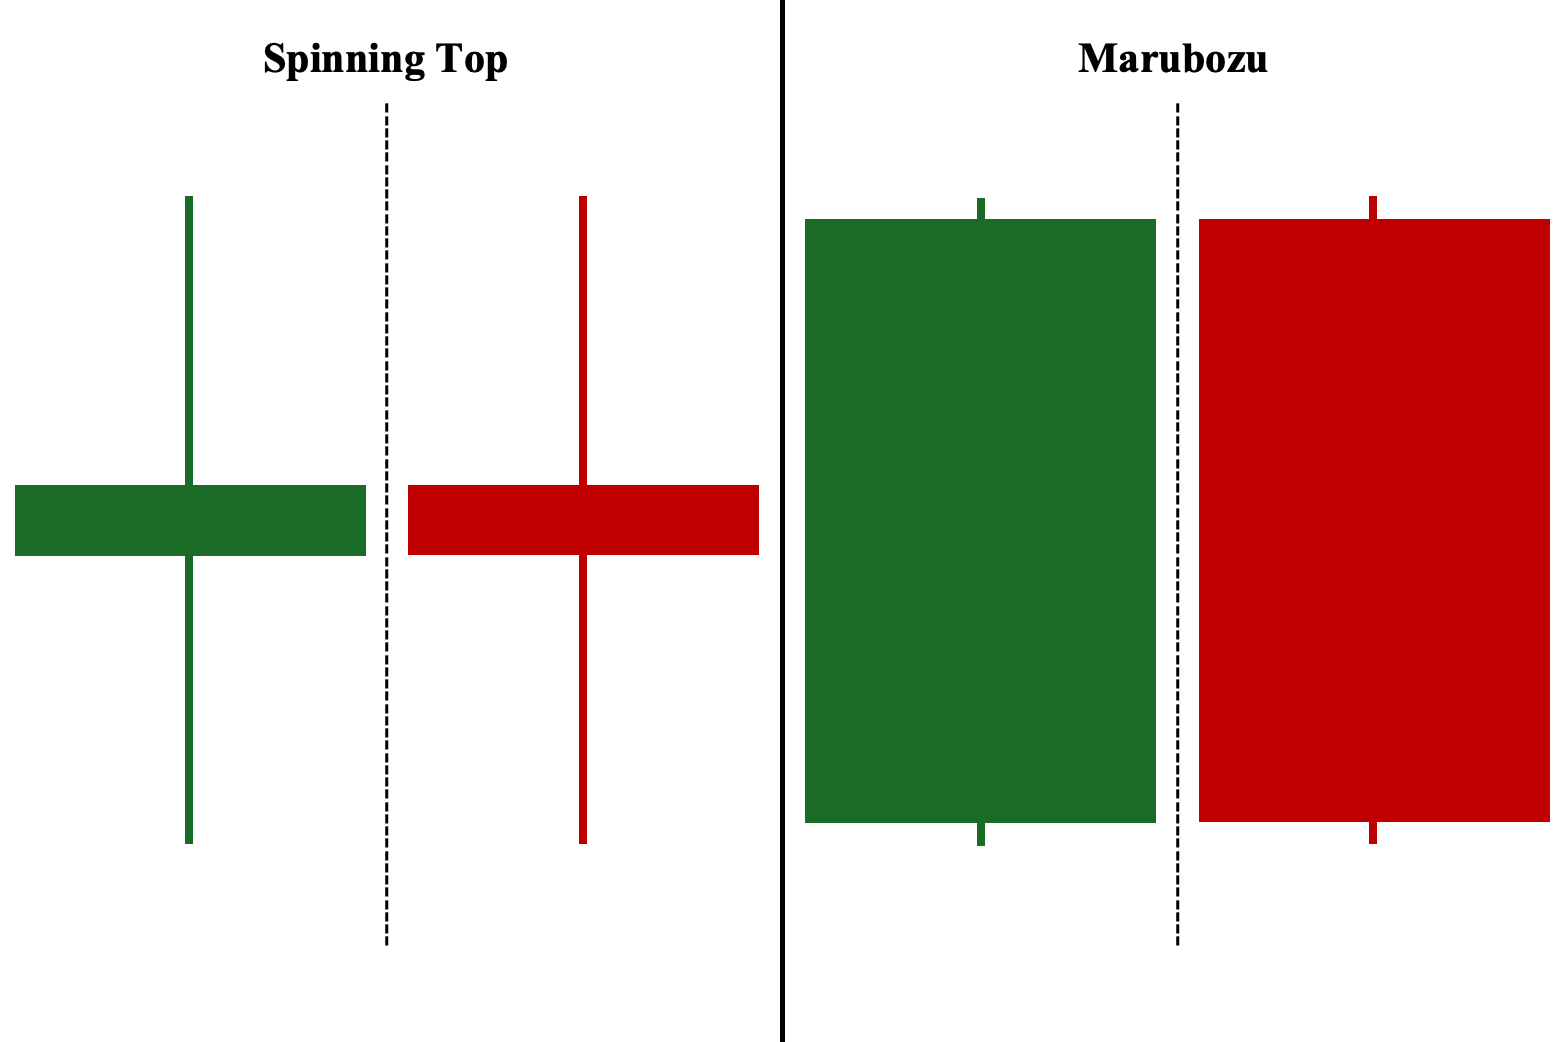
Both the spinning top and marubozu are one-candlestick patterns. However, their appearances are almost the complete opposite of each other. While the spinning top candlestick pattern has a short body and long wicks, the marubozu has a long body with little to no wicks.
In the case of the marubozu, the important aspect to look at is the color. A long green candle is considered a bullish candlestick pattern as it shows that the price has consistently increased since it opened that day. In contrast, a long red candle is regarded as a bearish candlestick pattern as it shows that the price has continued to go down since it opened that day.
Spinning Top vs. Dragonfly Doji Candle
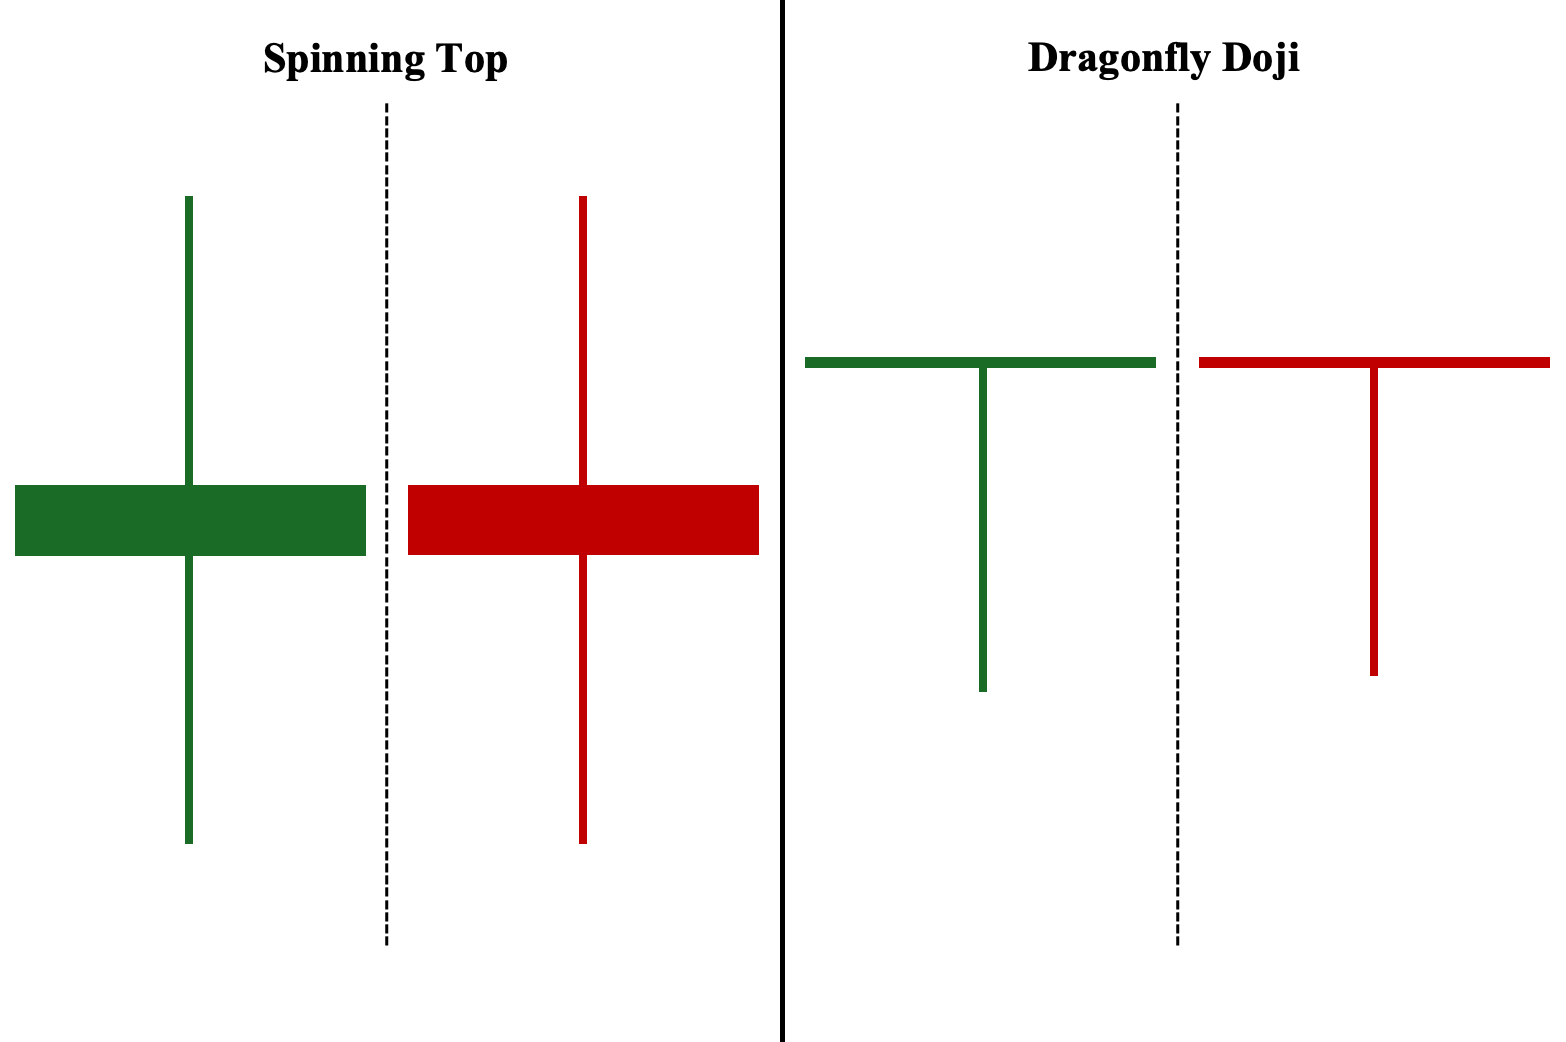
Finally, both the spinning top and dragonfly doji are also one-candlestick patterns. In terms of use case, dragonfly dojis are similar to the hammer and bullish pin bars. This is perhaps unsurprising considering the similarity in appearance of the three candlestick patterns.
The dragonfly doji’s distinct difference in appearance is its little to no real body coupled with relatively long lower shadows or wicks. Similar to the hammer and bullish pin bars, dragonfly dojis are also bullish reversal patterns that appear in downtrends.
Frequently Answered Questions (FAQs)
What is the best time frame to use for the spinning top candlestick pattern?
The general rule is this: the highest timeframe that applies to you is usually the most reliable. For example, if you buy an asset and hold it for a few days to a few weeks, then the daily timeframe may be more suitable rather than hourly or minute-based timeframes. However, the spinning top is verstaile and can be traded on chart time frames down to minutes.
What is the importance of the spinning top candlestick pattern?
A neutral candlestick pattern, such as a spinning top, illustrate the current indecisive market sentiment. This means there is no clear winner between buyers and sellers. The asset is neither bullish nor bearish, and the price is at or near equilibrium. Hence, this pattern can signify a “decision point” on whether the trend continues or if a reversal appears.
Is the spinning top bullish or bearish?
Neither. The spinning top is a neutral candlestick pattern representing indecision between buyers and sellers at that point in time. This is the case whether it appears in an uptrend or a downtrend. The spinning top is only a sign of uncertainty about whether the trend will continue or not. Therefore, the subsequent candle needs to be analyzed alongside the spinning top to determine whether this uncertainty leads to a continuation reversal of the trend.
Does a spinning top candlestick pattern guarantee a trend reversal?
No. The spinning top pattern does not guarantee a trend reversal. It is merely a sign of uncertainty about the trend’s direction. Moreover, no candlestick formation guarantees a trend reversal, not even a common candlestick pattern. The spinning top candlestick pattern represents indecision. Price movements can go in any direction and a candlestick pattern only reflects changing sentiment that has shown a tendency to reverse trends based on historical price behavior.
How reliable is the spinning top candlestick pattern?
Being a one-candlestick pattern, the spinning top candlestick is generally viewed as less reliable than two- and three-candlestick price patterns. This is because the spinning top appears more frequently on the chart during both trending and non-trending market environments. Hence, it is usually analyzed alongside the next candle to either confirm a trend reversal or a trend continuation.
Can a spinning top candlestick pattern occur in both uptrends and downtrends?
Yes, it can appear in any market condition (uptrend, downtrend, and non-trending/sideways). The spinning top is not exclusively used as a bullish reversal or bearish reversal. When analyzed with the subsequent candle, it can be effectively used in trending markets as a reversal or continuation tool.


