Bullish
- November 16, 2024
- 23 min read
Bullish Harami Pattern: A Comprehensive Trading Guide
What is a Bullish Harami Candlestick Pattern?

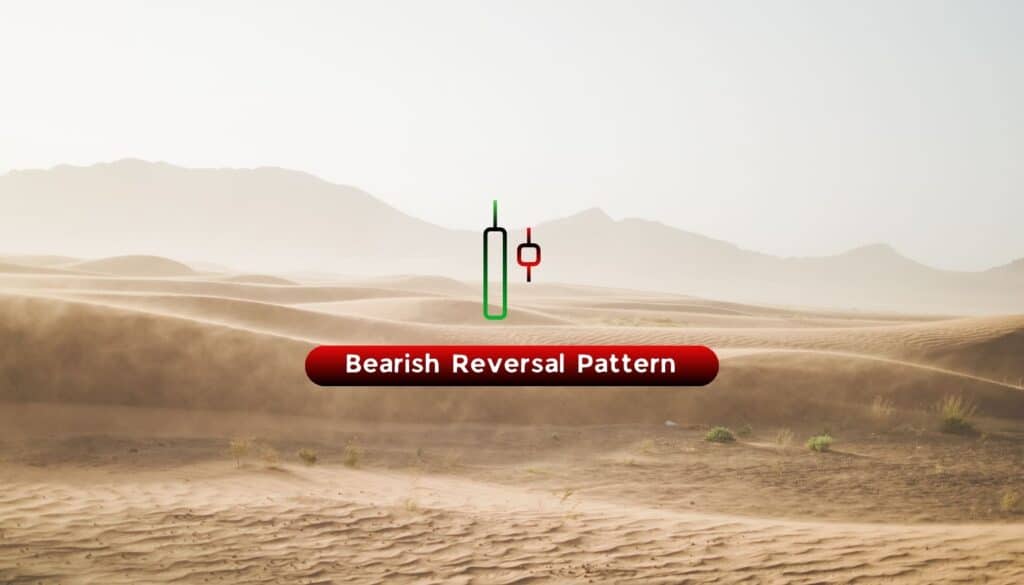
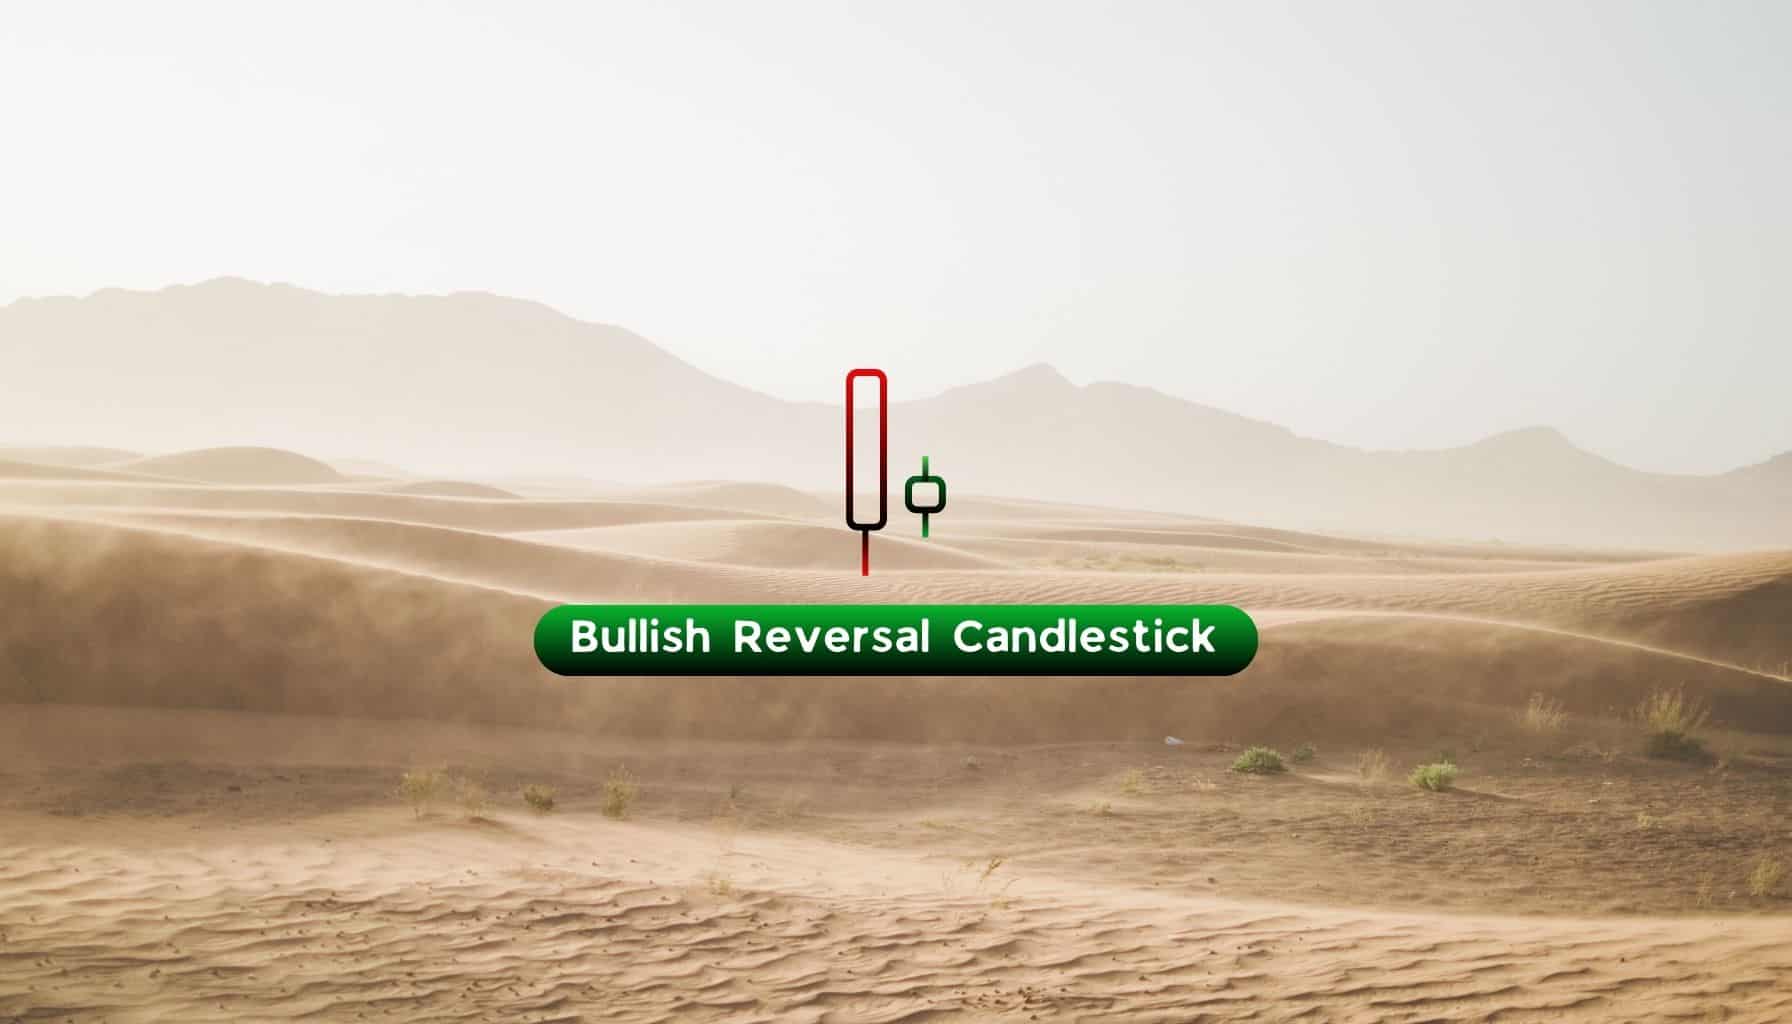
A bullish harami is a bullish reversal pattern that signifies a potential shift against the current downward price trajectory. It consists of two candlesticks: a large-range bearish candle (first candle) and a smaller bullish candle (second candle). In essence, the bullish harami formation suggests that the current downward selling pressure is weakening and that buyers are starting to take control. This is because, while the first candle still reflects clear downward momentum, the second candle abruptly halts this decline.
Etymology: The word “harami” is an old Japanese word that means “pregnant,” symbolizing the visual appearance of the pattern, where the first candle (the “mother”) has a much larger body that engulfs the second smaller candle, resembling the shape of a pregnant woman.
What is a Bullish Harami Cross?
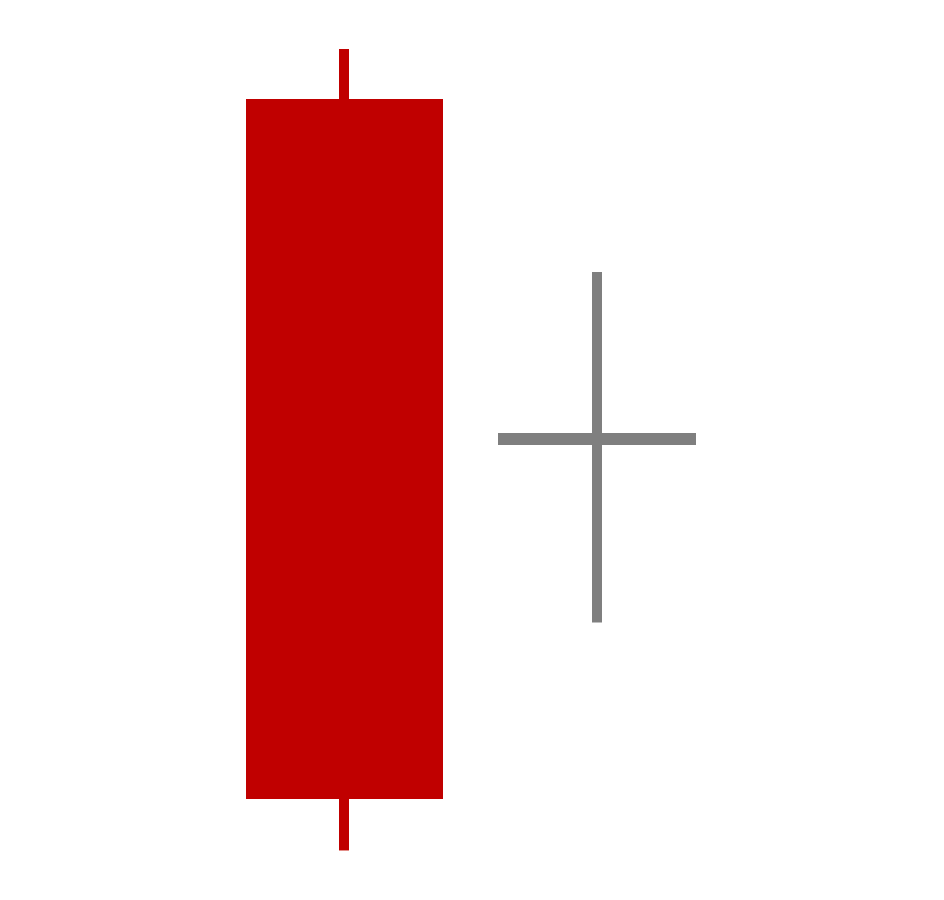
A bullish harami cross is a variant of the standard bullish harami formation. In this case, instead of a second bullish candle, it is replaced by a doji (which resembles a cross, hence the name). Depending on the relative location of the opening and closing prices of the second candle, the “cross” can appear:
a) grey if both prices are identical,
b) green if the closing price is slightly higher than the opening price,
c) or red if the close price is slightly lower than the opening price.
Regardless, the color is unimportant. That said, compared to standard bullish harami patterns, the variant’s second candle—resembling a cross—represents a state of price equilibrium or indecision regarding the future price direction. Nevertheless, this variant still signals a potential reversal, as it also abruptly halts the prevailing downward price trajectory.
What Does a Bullish Harami Tell You
The bullish harami candlestick pattern tells us that the market sentiment is changing and that price will likely follow. In a downtrend, this could mean a complete trend reversal towards an uptrend. Meanwhile, if this pattern appears during a pullback in an uptrend, it could mean the end of a corrective market decline, signaling a renewed bullish momentum and the resumption of the upward price trajectory.
How to Identify the Bullish Harami Pattern?
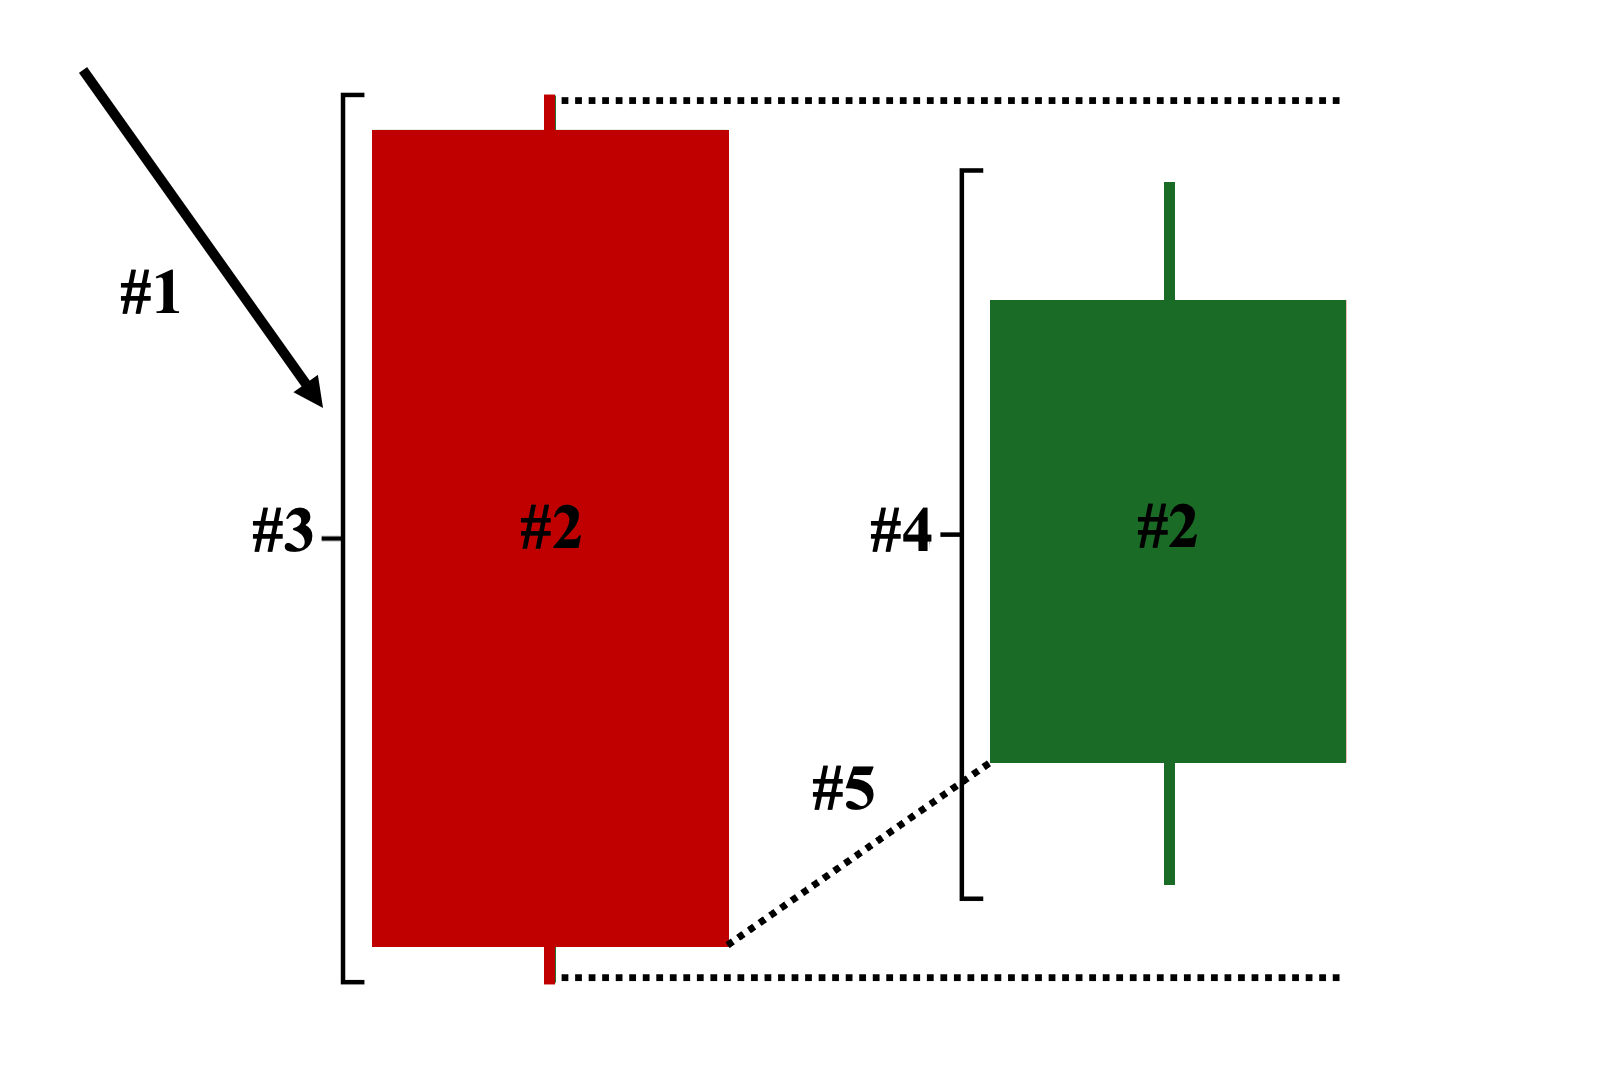
The following are the five key characteristics for identifying a valid bullish harami pattern on a price chart:
- Position on the Chart – The two candles must appear either during:a) an ongoing downtrend, or b) a pullback phase of an established uptrend.
- Color: Depending on your chart settings, the first candle must be red or black and the second candle must be green or white.
- 1st Candle: A long-bodied bearish candle that completely engulfed the range—body and wicks—of the 2nd candle.
- 2nd Candle: A smaller-bodied bullish candle that is entirely covered by the 1st candle.
- Gap Up: While not a strict requirement due to the continuous trading nature of some markets, the second candle typically opens higher compared to the closing price of the first candle, creating a noticeable gap in price.
Bullish Harami Candlestick Pattern Examples
Below are four examples of bullish harami patterns on a price chart, each with distinct outcomes:
Example 1: Successful Trend Reversal Scenario (Downtrend to Uptrend)
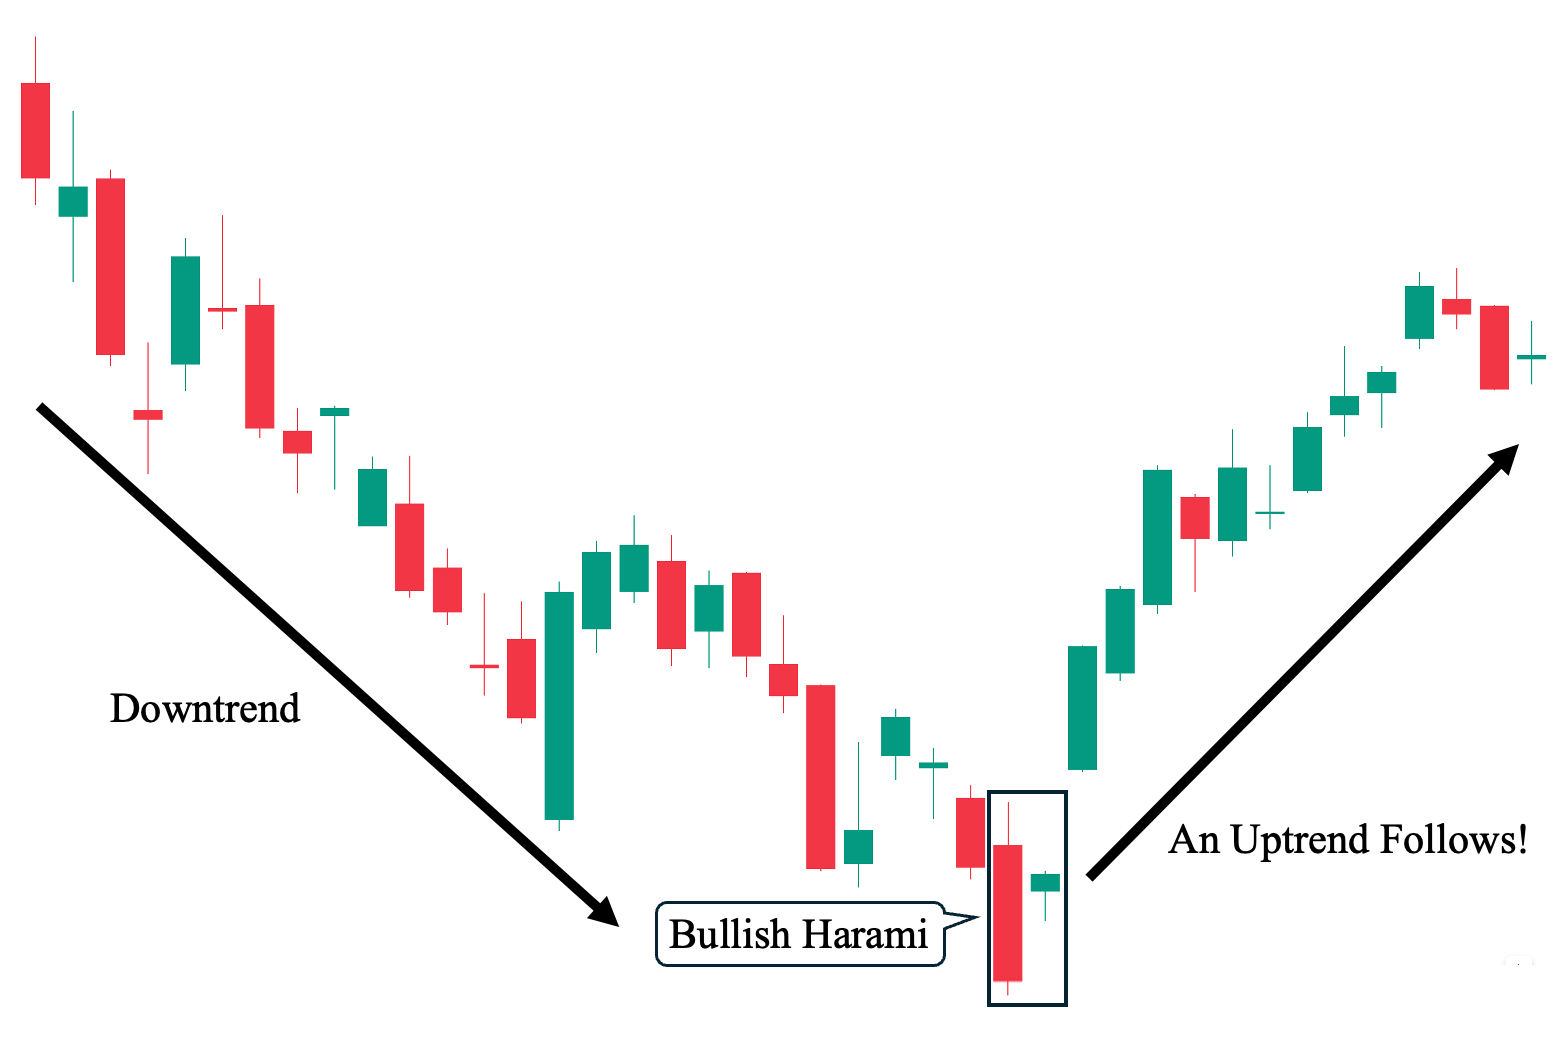
This candlestick chart shows the ideal scenario when trading the bullish harami candlestick pattern. As shown, there was a clear bearish trend (downtrend) before the bullish harami appeared. In fact, we can see that the harami pattern’s first candle—being a long-bodied bearish candle—still indicates strong selling pressure when it was then followed by a much smaller bullish candle that opened with a gap up (the opening price was significantly higher than the first candle’s closing price). The pattern then served as the starting point of the upcoming bullish trend (uptrend) that followed shortly after.
Example 2: Failed Trend Reversal Scenario (Downtrend Continues)
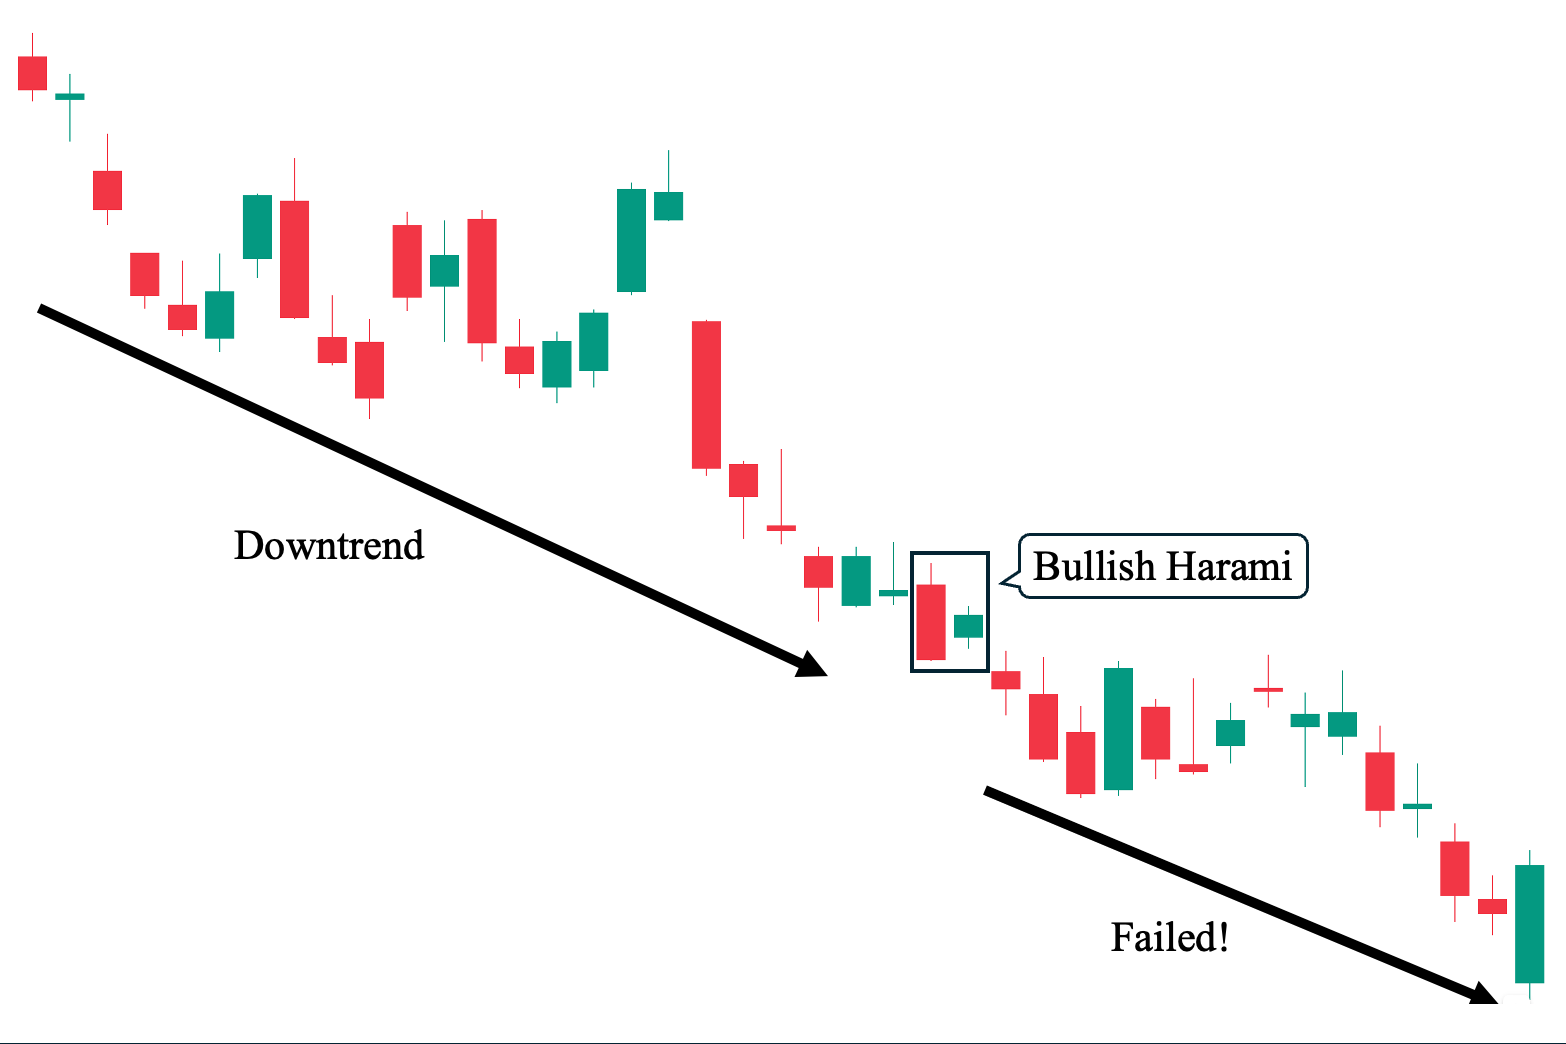
In contrast to our first example, this second chart shows how the bullish harami candlestick pattern, like any other candlestick pattern, can also lead to unsuccessful outcomes—in this case, serving as a potential bullish reversal pattern. Looking closely, we can observe how the bullish harami was also preceded by a bearish trend (downtrend).
Then, the harami pattern’s first candle—a long-bodied bearish candle—continued to make a lower low, while the second candle—a short-ranged bullish candle—gapped up, hinting at a possible shift in market sentiment (bearish to bullish). Unfortunately, the bullish trend (uptrend) failed to materialize, and the trend continued downward.
A big clue of a continuing downtrend was when the next candle gapped down below the low of the first candle of the harami.
Example 3: Marking the End of a Pullback (Uptrend Continues)
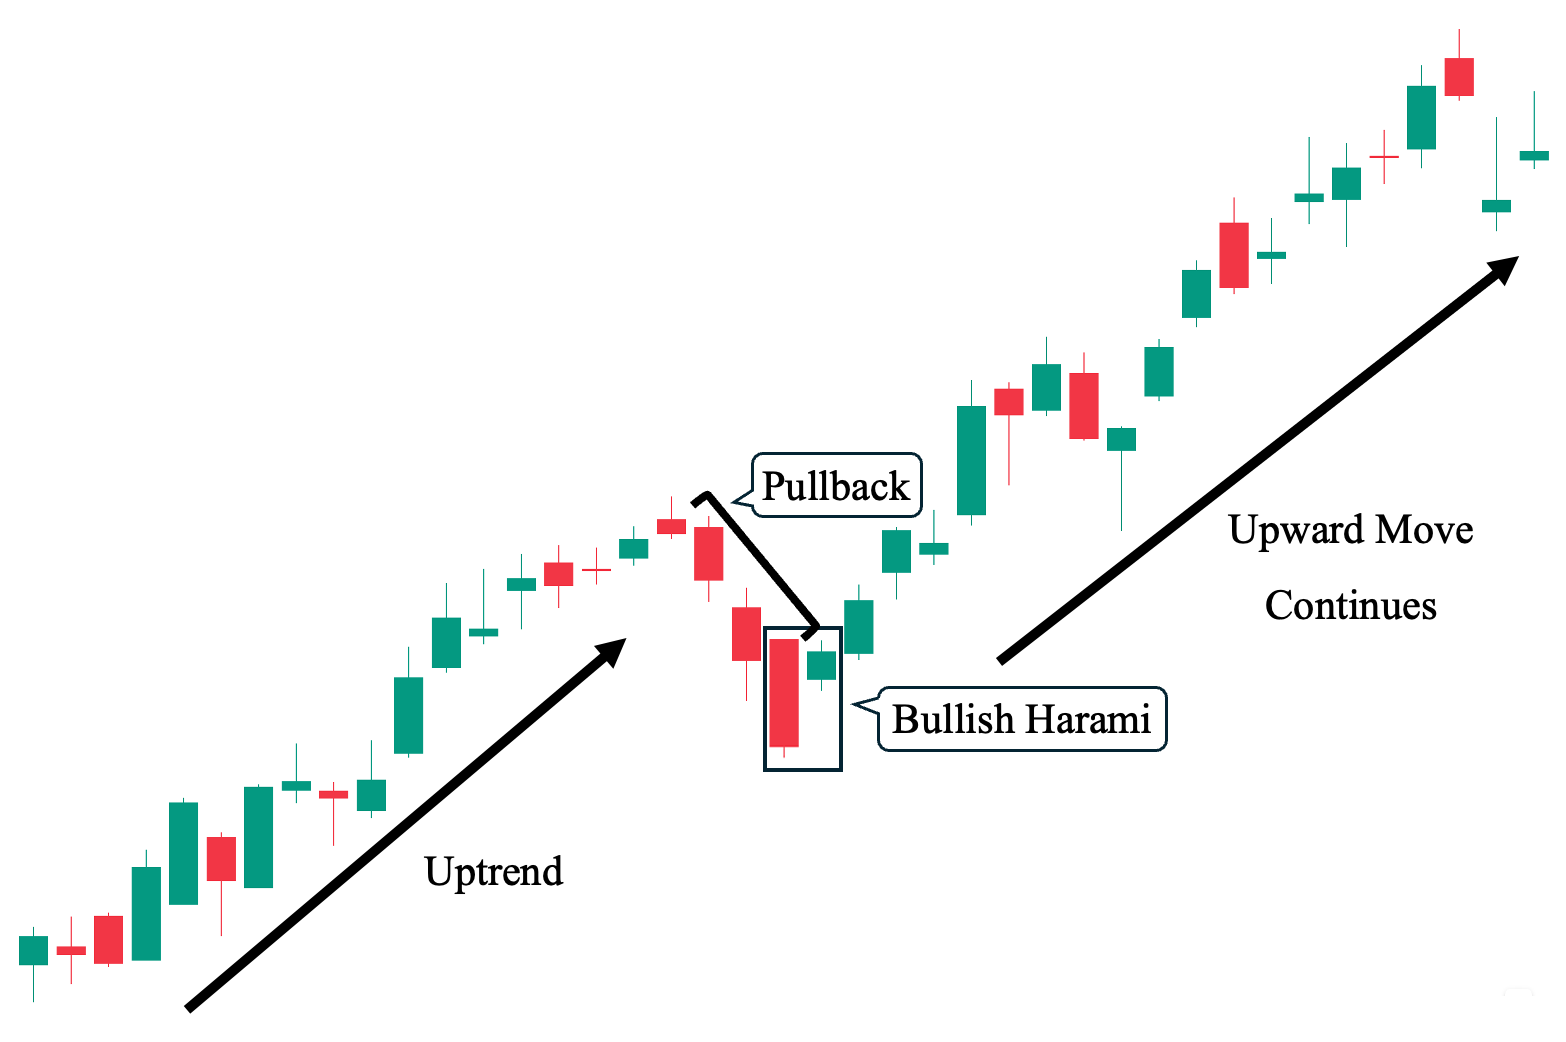
In this example, we can see how the bullish harami candlestick pattern can also be used during a pullback phase (a temporary decline) within an established bullish trend (uptrend). Looking at the chart, we observe a strong upward price trend followed by a sudden, continuous decline in price, represented by red candles making lower lows. Then, a short-bodied bullish candle gapped up after a long-bodied bearish candle, forming the bullish harami pattern. This pattern signaled the end of the pullback phase and the start of renewed bullish momentum as the upward price trajectory resumed.
Example 4: Indecisive Outcome Scenario (Shifts to Non-Trending)
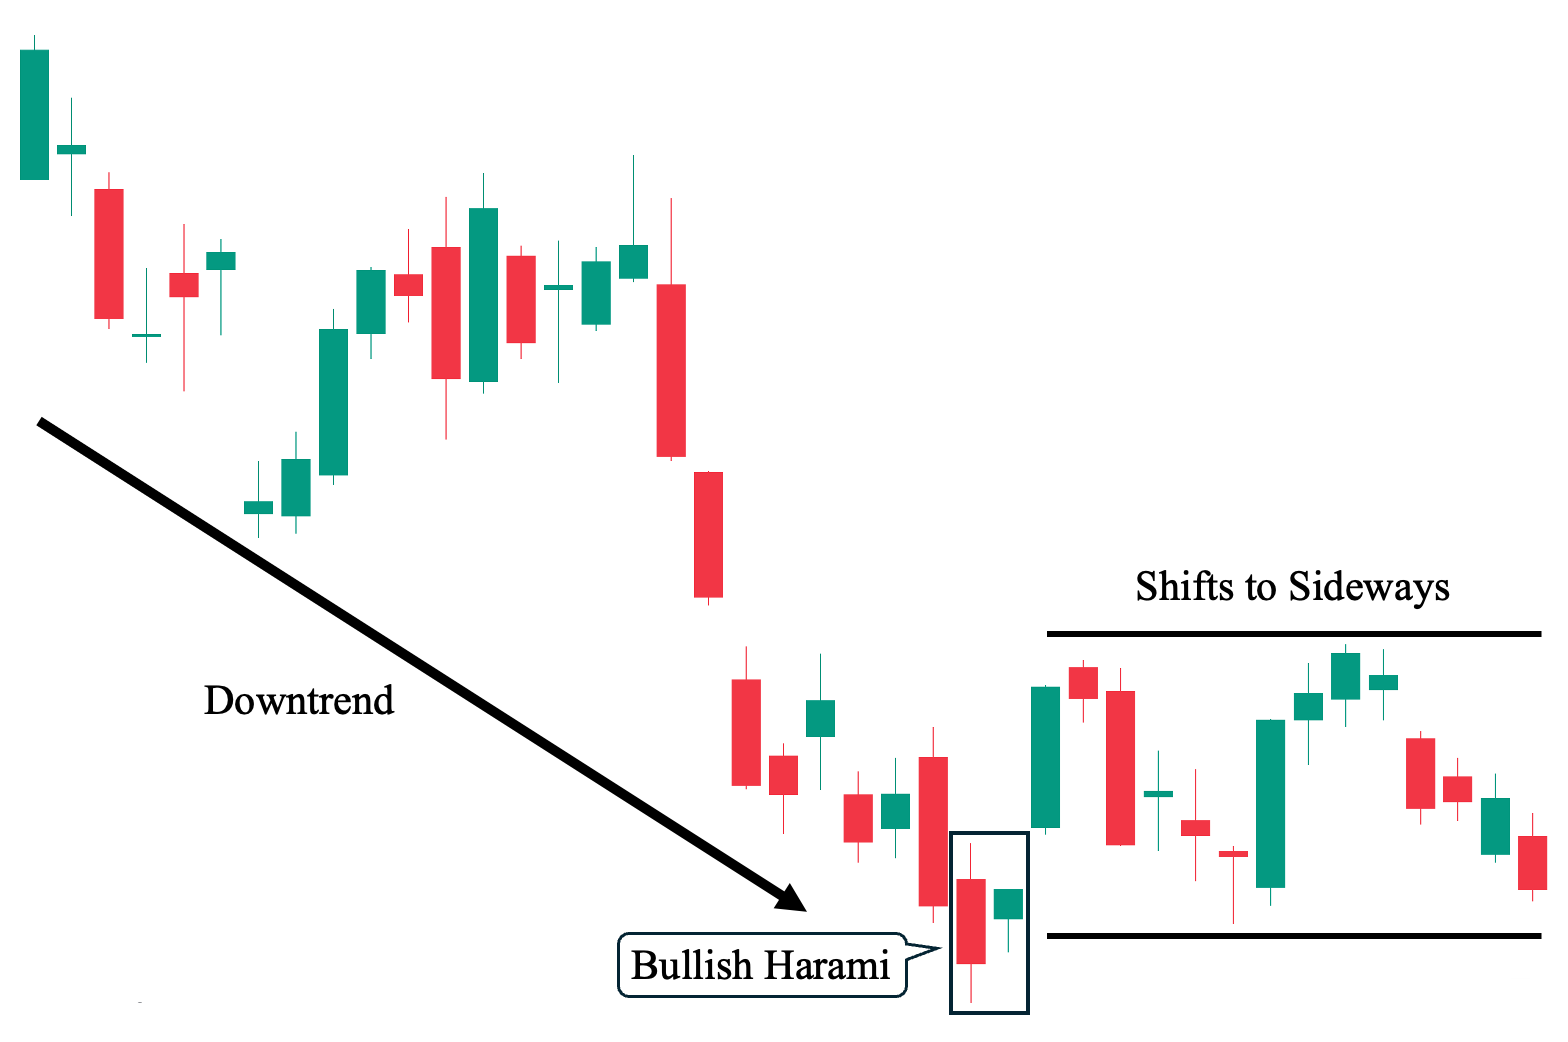
Finally, in this fourth example, we want to illustrate how the bullish harami candlestick pattern can also lead to an indecisive outcome (where it neither lead to a bullish or bearish trend). As we can observe, there was a clear downtrend that preceded the candlestick pattern—where its first bearish candlestick even made a new low (as part of this bearish trend).
Then, suddenly, it was gapped up by a smaller bullish candlestick. Yet, while the pattern seemed promising as it was also followed by a long bullish candlestick, it abruptly lost momentum and now moves sideways with no clear trend direction. This serves as a reminder that the market can move unpredictably, and we cannot perfectly forecast where the price will go, making proper trade management essential.
Bullish Harami Candlestick Pattern Trading Strategies
The following are different ways to incorporate a bullish harami candlestick pattern with various technical analysis tools (e.g., technical indicators) on a price chart:
Pullbacks On Naked Charts
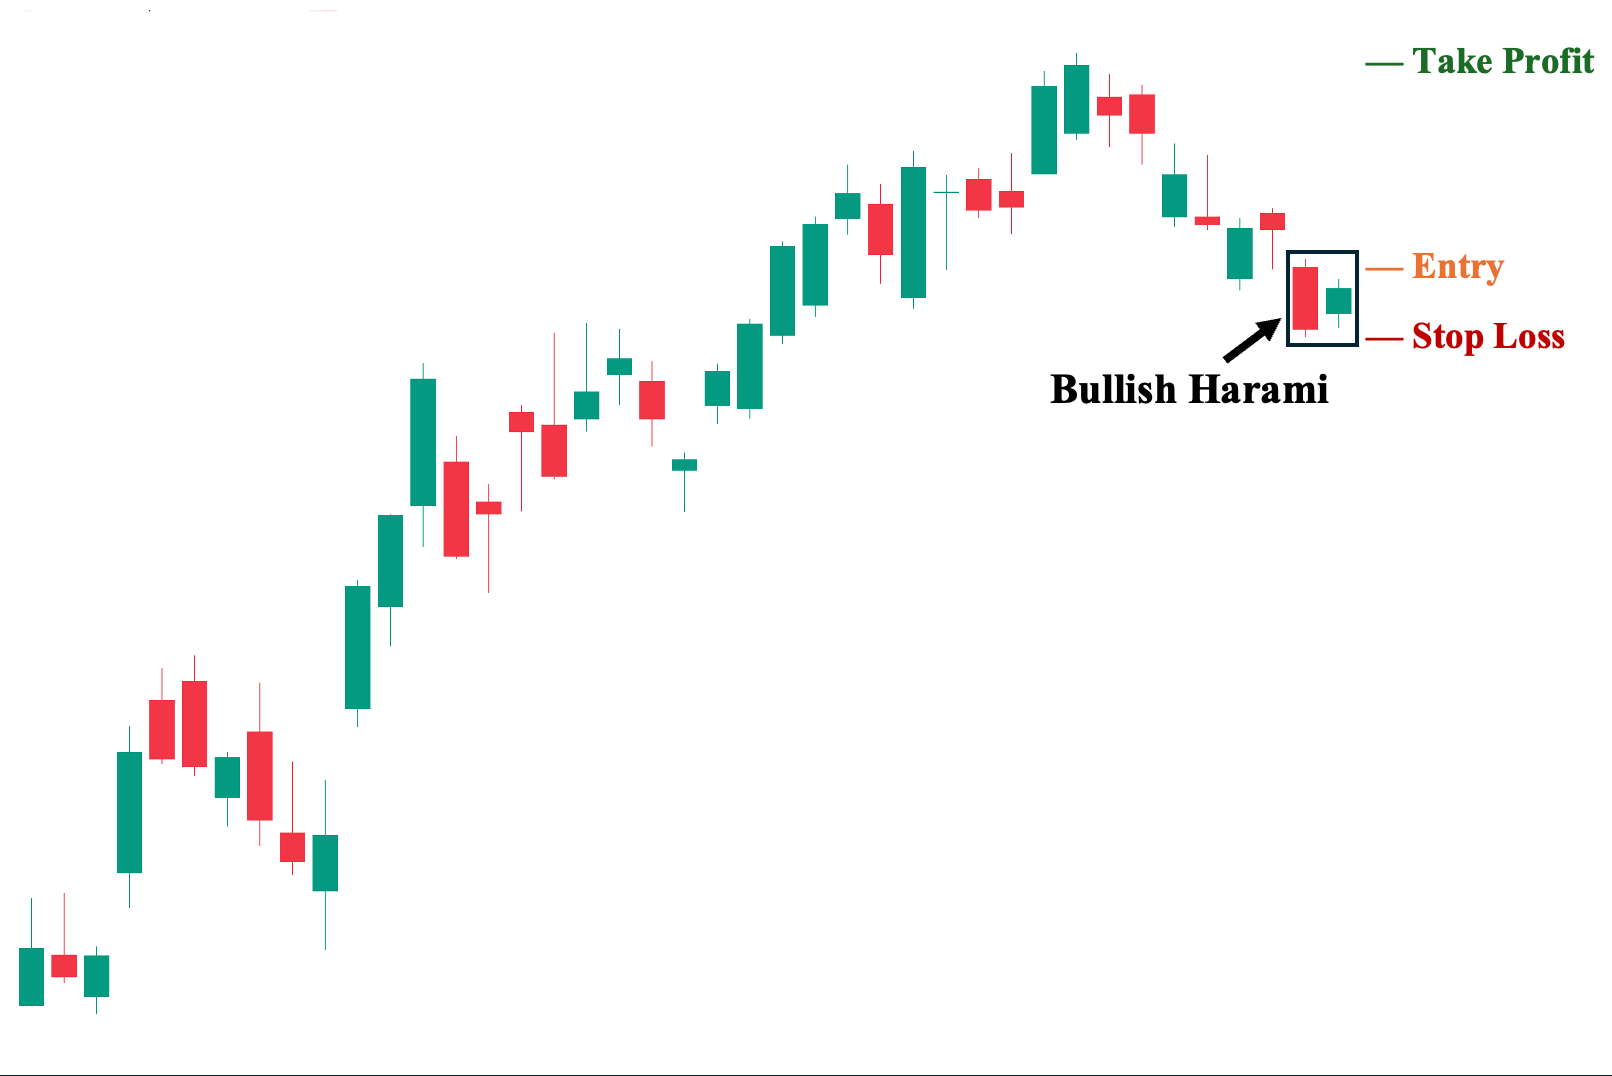
You can use the bullish harami candlestick pattern on bare candlestick charts with no other technical analysis tools except for the price chart itself. In this example, we can see that the bullish harami appears during the pullback phase of an ongoing bullish trend (uptrend). As such, we can consider taking a long position in anticipation of a potential upward rally that may follow.
1. Entry Point: A few ticks above the high of the second candle.
2. Stop Loss Points: Set your stop loss a few ticks below the low of the second candle.
3. Take Profit (TP) Level: Set your TP a few ticks below the nearest key structural resistance level. In this case, the previous high of the uptrend.
4. Risk-Reward Ratio: The risk/reward ratio must be at least 1:1. We do not recommend taking trades with a ratio below this in any trading situation. The higher the potential reward relative to the risk, the better. However, make sure you use an objective approach when setting your TP and SL levels rather than inflating them artificially.
Trading The Bullish Harami With Key Structural Levels
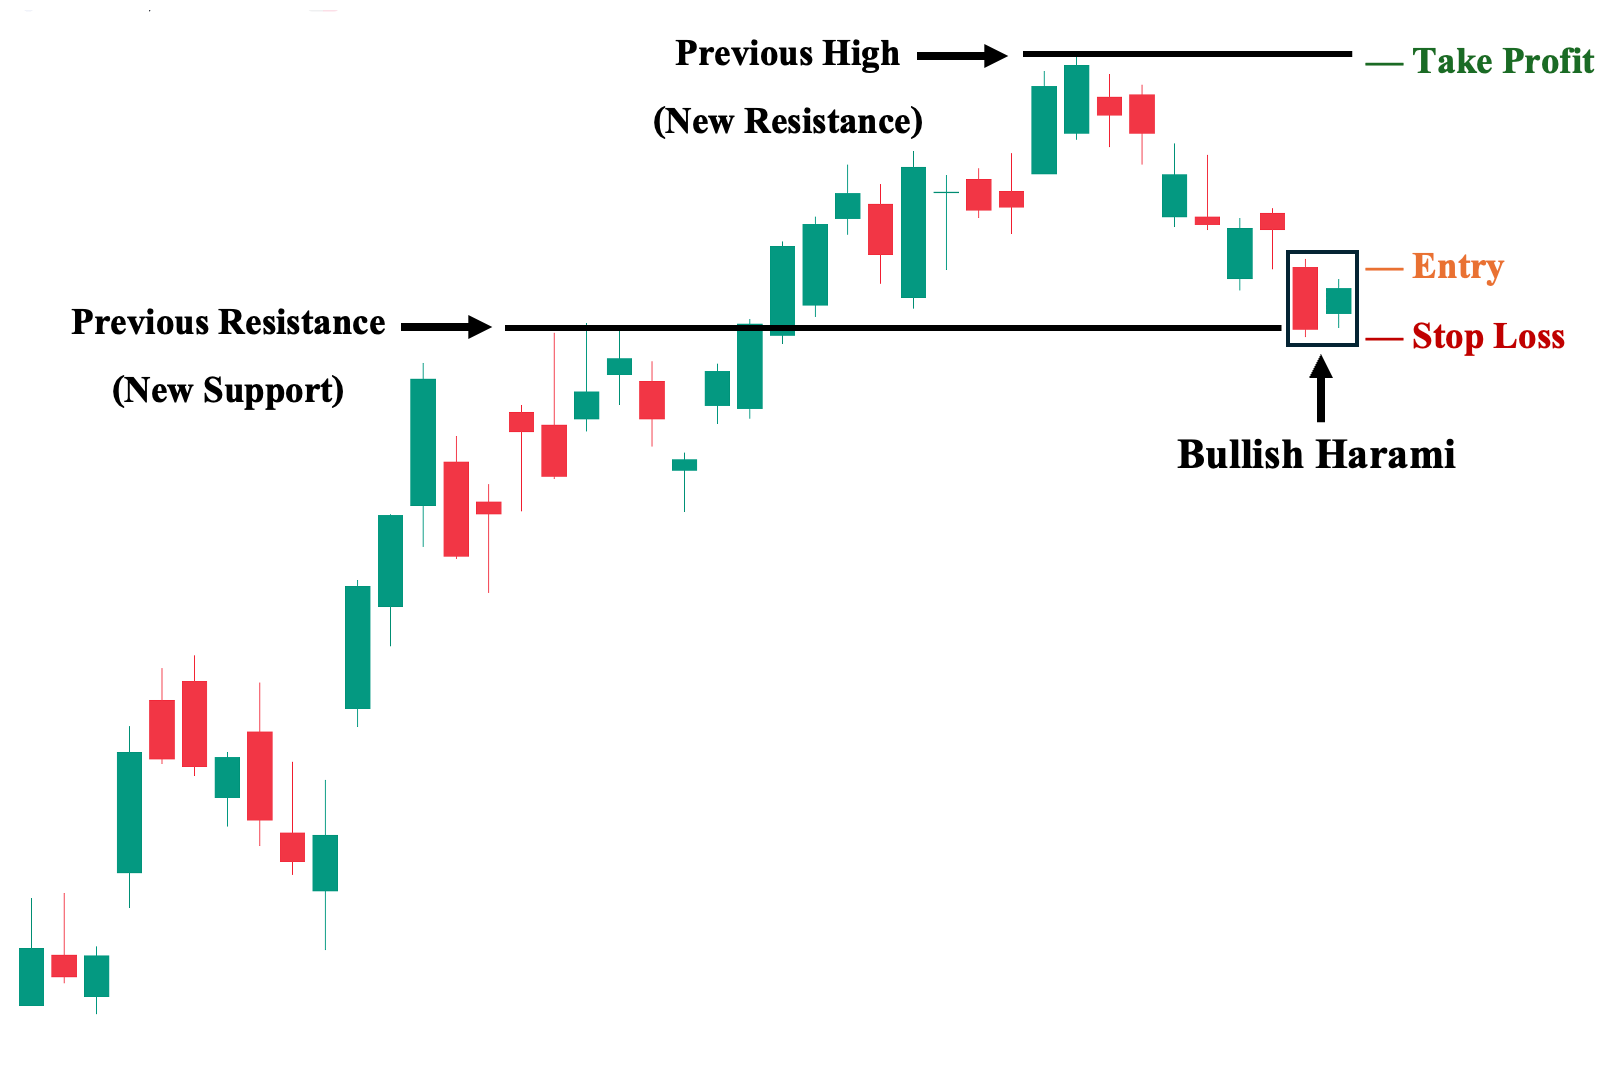
The next progression you can make is to analyze the bullish harami candlestick pattern in conjunction with key structural levels on your candlestick charts. To illustrate, let’s use the same chart from our first example but with identified structural levels.
Immediately, you can see that we now have a better understanding of the overall price context. The bullish harami pattern—both its first bearish candle and second bullish candle—appeared around a previous resistance level (which had been a struggle for price to break in the past), turning it into a significant support level, where there is a higher likelihood that the price will bounce. Hence, this makes it ideal for taking a long position.
1. Entry Point: A few ticks above the high of the second candle.
2. Stop Loss Points: Set your stop loss a few ticks below the low of the second candle and the nearest support level.
3. Take Profit (TP) Level: Set your TP a few ticks below the nearest key structural resistance level. In this case, the previous high of the uptrend.
4. Risk-Reward Ratio: The risk/reward ratio must be at least 1:1.
Trading The Bullish Harami Pattern with Relative Strength Index (RSI) Indicator
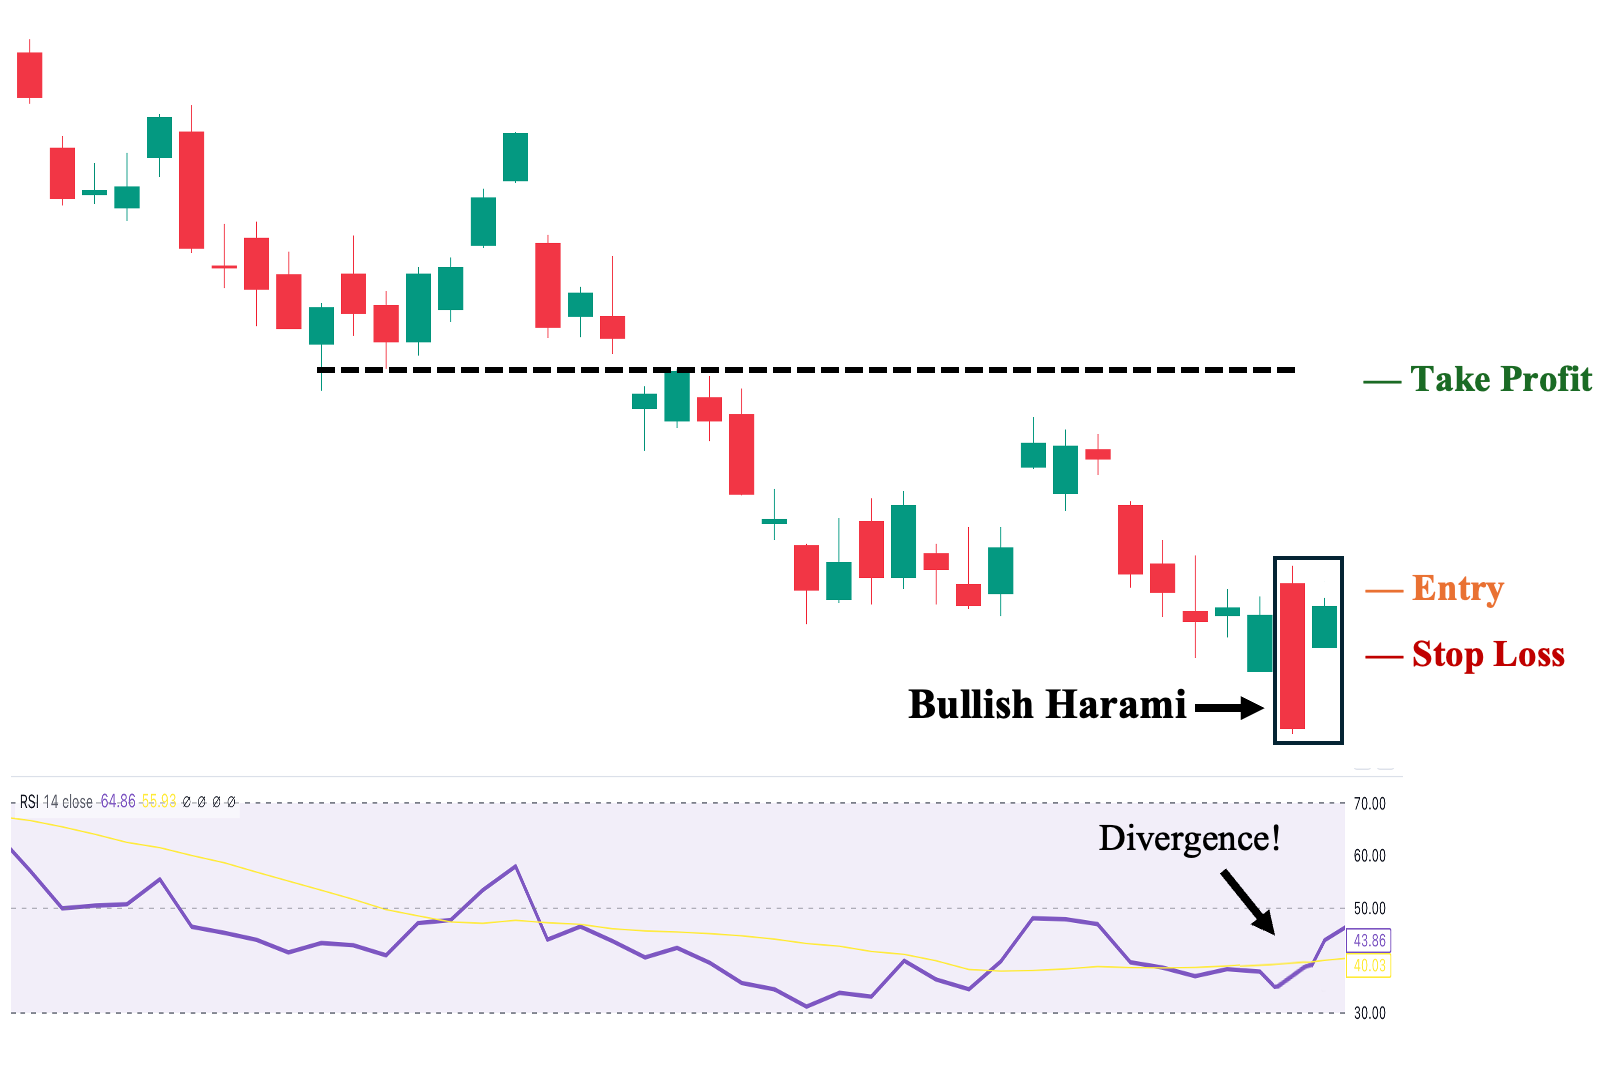
You can incorporate the Relative Strength Index (RSI) into your candlestick charts to help assess the quality of a bullish harami candlestick pattern. Unlike other technical indicators, RSI can act as a leading indicator when it diverges from price.
For example, if the price is still declining while the RSI begins to rise, the price will likely follow the RSI’s reversal signal. To illustrate, we observe a clear bearish trend (downtrend) preceding the pattern’s appearance. Then, the RSI rose despite the price hitting a new low (represented by the pattern’s first candle—a long-bodied bearish candle). This RSI divergence, therefore, supports the potential for a bullish reversal when the second candle—a much smaller bullish candle—gaps up above the first candle and completes the bullish harami pattern.
1. Entry Point: A few ticks above the high of the second candle.
2. Stop Loss Points: Set your stop loss a few ticks below the low of the second candle.
3. Take Profit (TP) Level: Set your TP a few ticks below the nearest structural resistance level.
4. Trailing Stop: Sell if the price and RSI diverge once again and RSI starts to point downwards.
5. Risk-Reward Ratio: The risk/reward ratio must be at least 1:1.
Trading The Bullish Harami Pattern with MACD Indicator
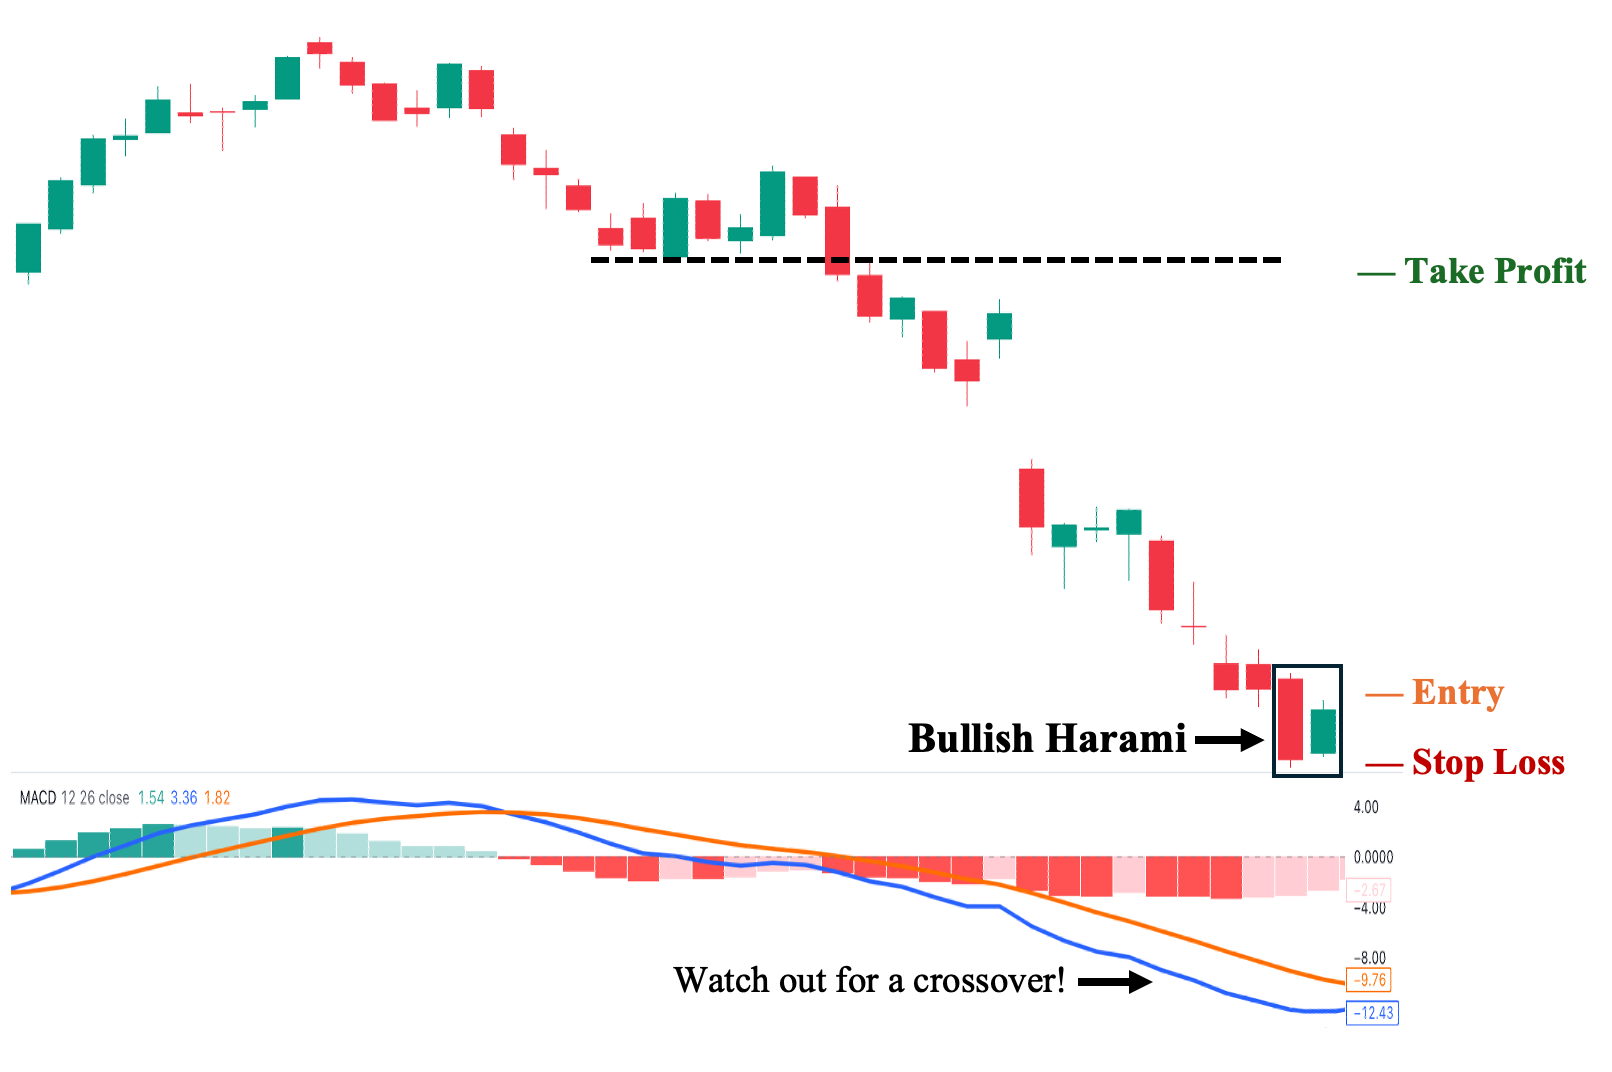
We can also use the Moving Average Convergence Divergence (MACD) indicator as a confirmation tool when considering a trade based on the bullish harami candlestick pattern. In this example, we can observe a strong bearish trend (downtrend) where the pattern appeared. We then wait for the MACD (blue) line to cross above the Signal (orange) line—known as a “bullish crossover”—which signals that the candlestick pattern will have a higher probability of being a successful bullish reversal signal.
1. Entry Point: A few ticks above the high of the second candle.
2. Stop Loss Points: Set your stop loss a few ticks below the low of the second candle.
3. Take Profit (TP) Level: Set your TP a few ticks below the nearest structural resistance level.
4. Trailing Stop: Sell if the orange line crosses above the blue line before hitting your TP.
5. Risk-Reward Ratio: The risk/reward ratio must be at least 1:1.
Trading The Bullish Harami Pattern with Stochastic Oscillator (STS)
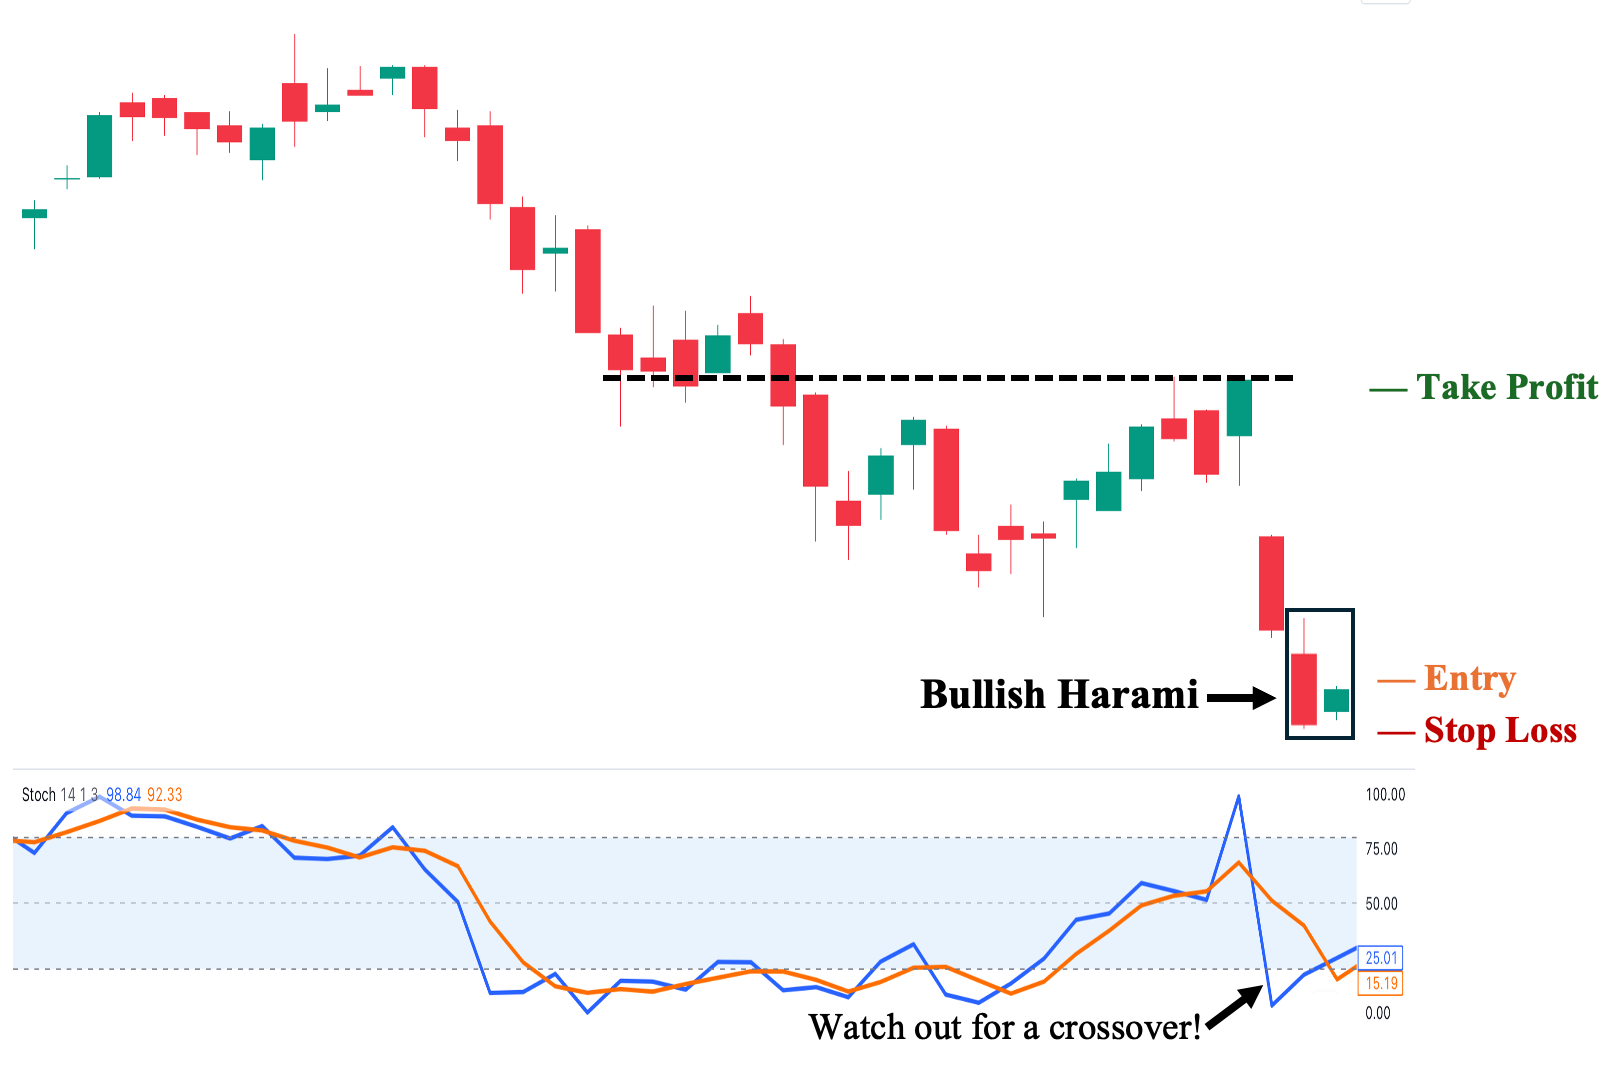
Stochastics (STS) is also used as a confirmation tool to validate the reversal signal provided by the bullish harami candlestick pattern in the chart. In this illustration, we can see a bearish trend (downtrend) that preceded the candlestick pattern. Similar to the Moving Average Convergence Divergence (MACD), a bullish signal occurs when the indicator’s Fast (blue) line crosses above its Signal (orange) line, indicating that buying pressure is gaining strength. Hence, when the STS confirms the bullish harami in this manner, it increases the pattern’s probability of successfully leading to a bullish reversal.
Note: STS is generally more sensitive than the MACD, which is why its lines tend to be more aggressive in their movements, while the MACD lines are much smoother. As a result, STS is usually preferred for short-term trades, whereas the MACD is favored for medium- to long-term trade positions.
1. Entry Point: A few ticks above the high of the second candle.
2. Stop Loss Points: Set your stop loss a few ticks below the low of the second candle.
3. Take Profit (TP) Level: Set your TP a few ticks below the nearest structural resistance level.
4. Trailing Stop: Sell if the orange line crosses above the blue line before hitting your TP.
5. Risk-Reward Ratio: The risk/reward ratio must be at least 1:1.
Trading The Bullish Harami Pattern with Fibonacci Retracements
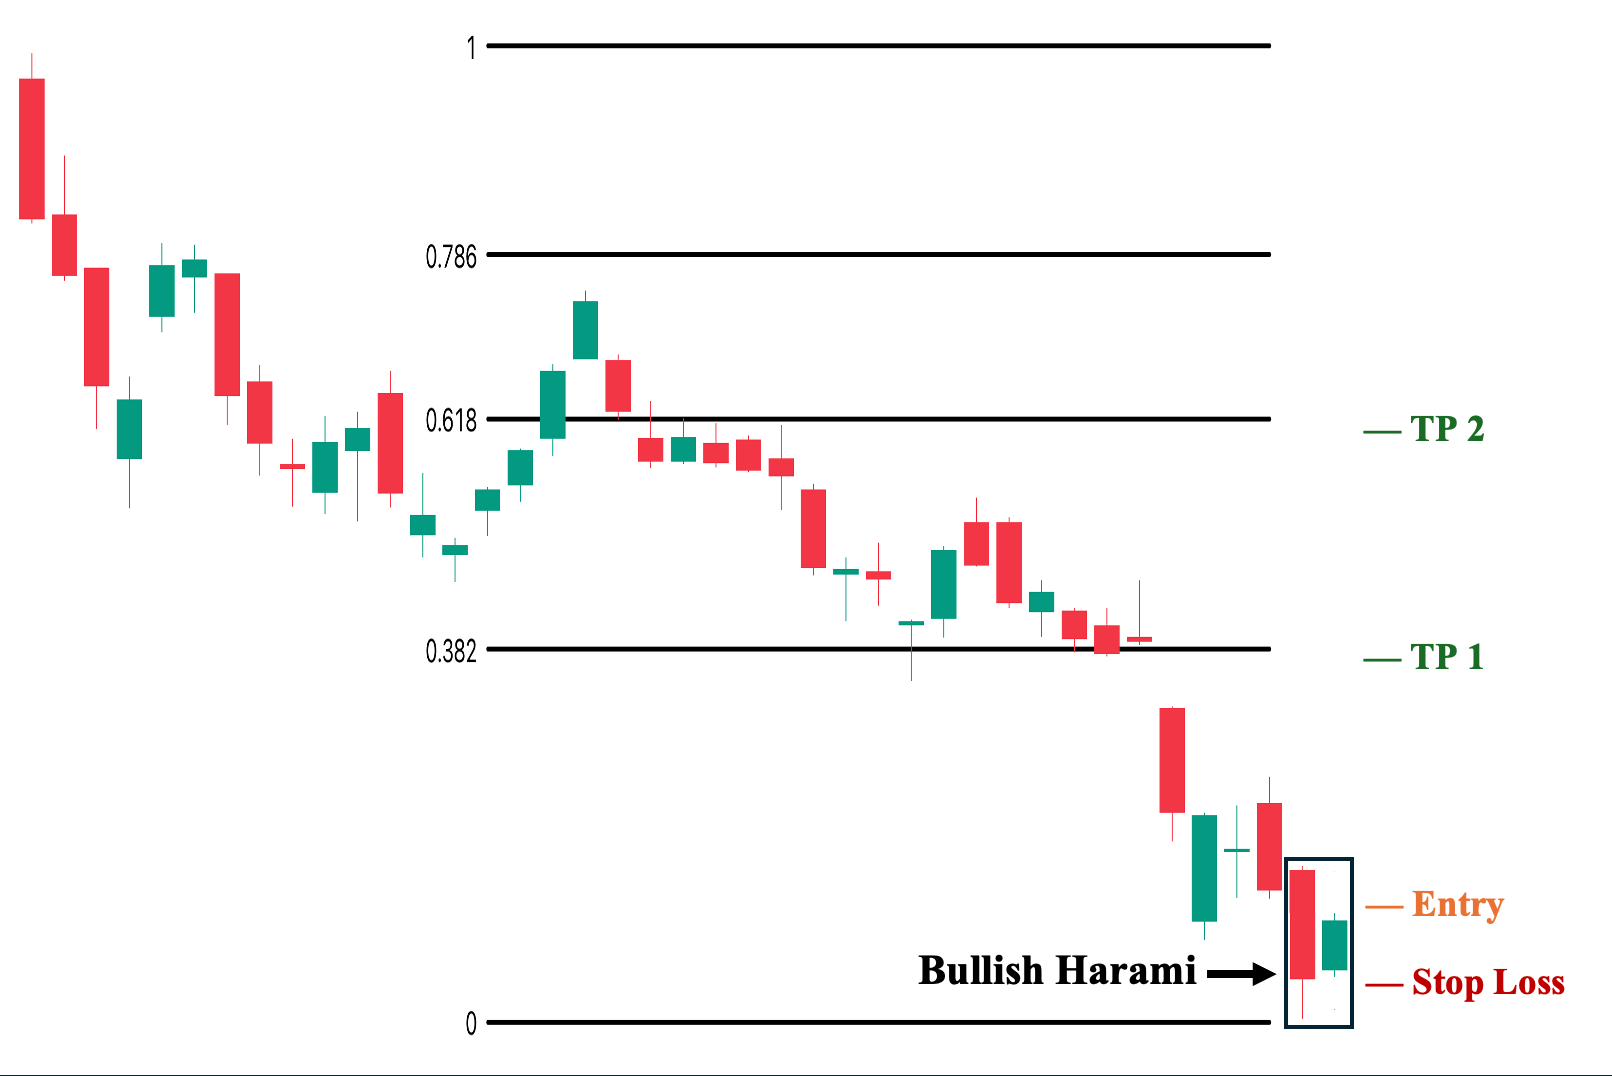
You can incorporate Fibonacci retracement (Fib) levels to help identify key areas where the price may face difficulty breaking through (i.e., potential resistance levels) once the bullish harami candlestick pattern materializes as a reversal pattern. In the illustration, we see a bearish trend (downtrend) reacting to key Fibonacci levels: 0.618 and 0.382. More specifically, we observe how the 0.382 level became a major support level, supporting the price before it was eventually broken as the downtrend continued. Hence, this key level becomes our nearest resistance level on the chart, where we can consider setting our target price.
1. Entry Point: A few ticks above the high of the second candle.
2. Stop Loss Points: Set your stop loss a few ticks below the low of the second candle.
3. Take Profit (TP) Level: If your strategy involves selling in tranches, you can set your first TP a few ticks below the nearest Fib level. In this case, the 0.382 level and your second TP below the 0.618 level.
4. Risk-Reward Ratio: The risk/reward ratio must be at least 1:1.
Trading The Bullish Harami Pattern With Moving Averages (MAs)
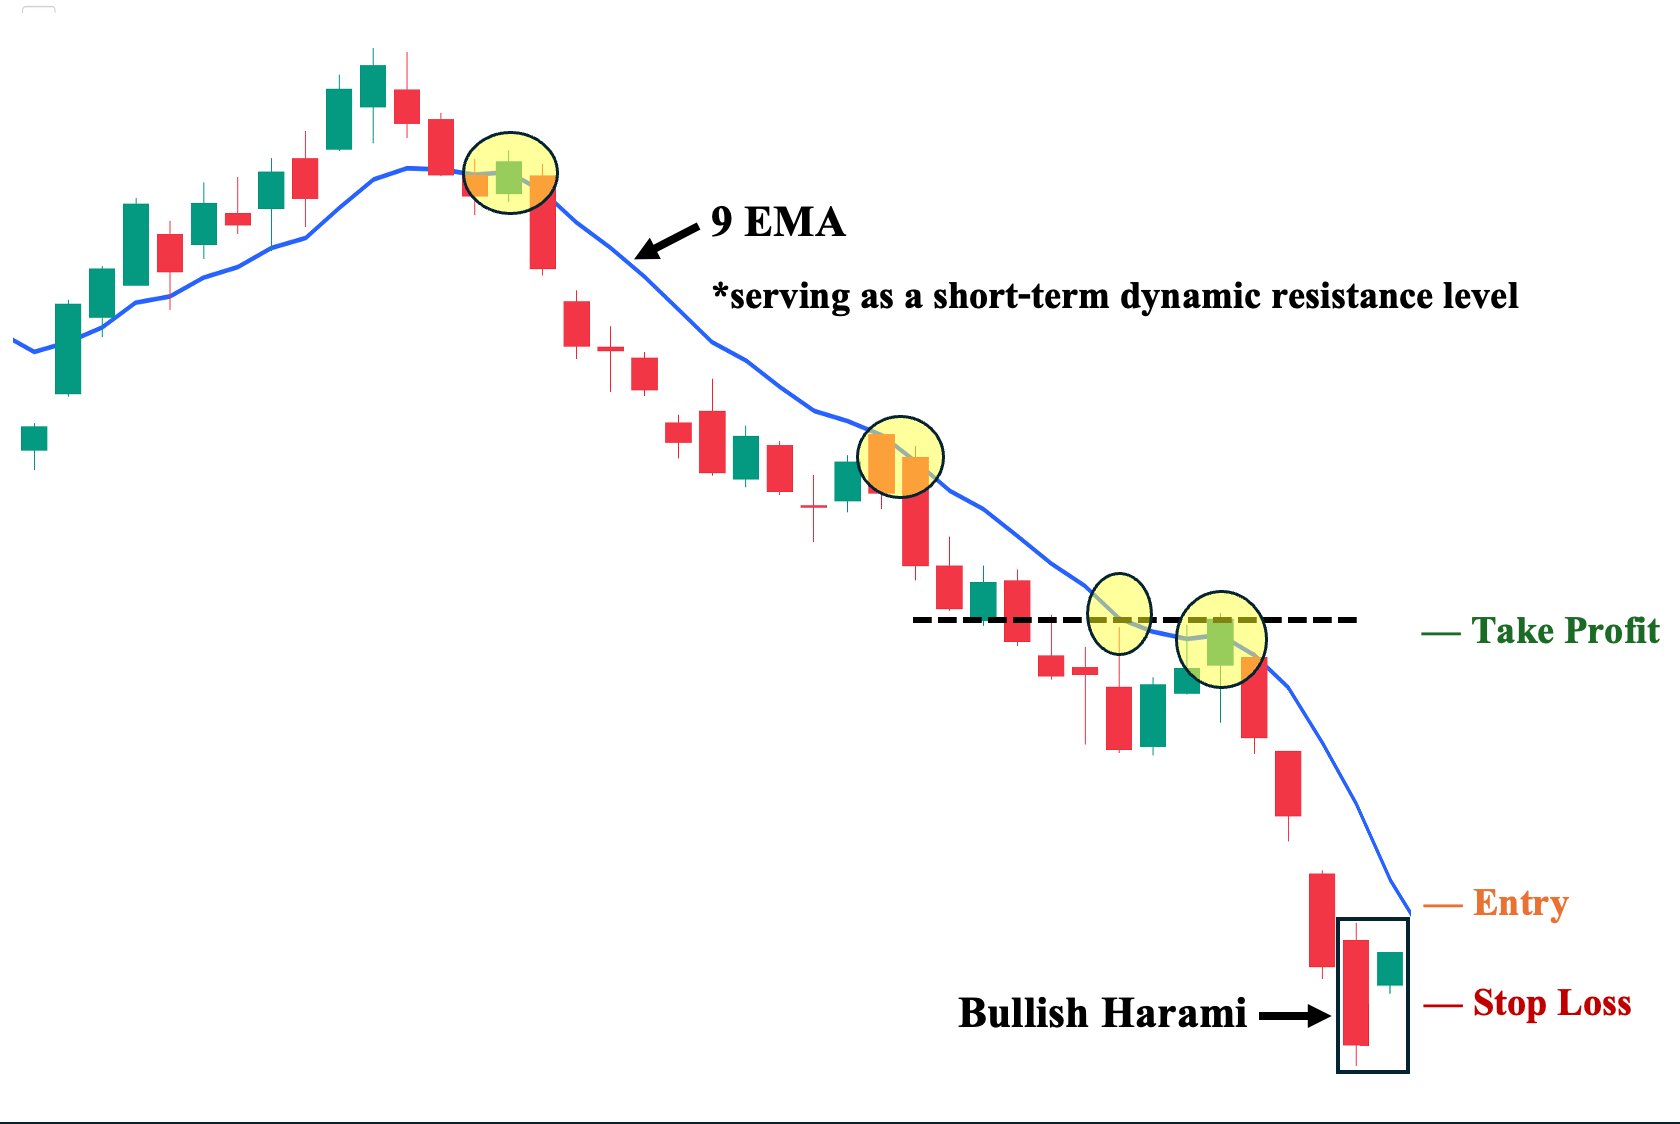
One of the most flexible indicators, moving averages, can serve multiple purposes when a bullish harami pattern appears on the price chart. To illustrate, we observe a bearish trend (downtrend) preceding the candlestick pattern. In this case, we use one of the most common short-term MAs, the 9-day Exponential Moving Average (9 EMA), as our dynamic resistance level.
Note: The primary reason for choosing 9 EMA is that the price has consistently failed to trade above this moving average in the past (highlighted in yellow), making it a reliable MA for this specific trade. Hence, after the bullish harami pattern develops, we wait for the price to trade above the 9 EMA before we even consider taking a long position.
1. Entry Point: A few ticks above the 9 EMA (the price needs to close above this resistance level first).
2. Stop Loss Points: Set your stop loss a few ticks below the low of the second candle.
3. Take Profit (TP) Level: Set your TP a few ticks below the nearest structural resistance level.
4. Trailing Stop: Sell if the price breaks below the 9 EMA before reaching your target price.
5. Risk-Reward Ratio: The risk/reward ratio must be at least 1:1.
Trading The Bullish Harami Pattern With Pivot Points
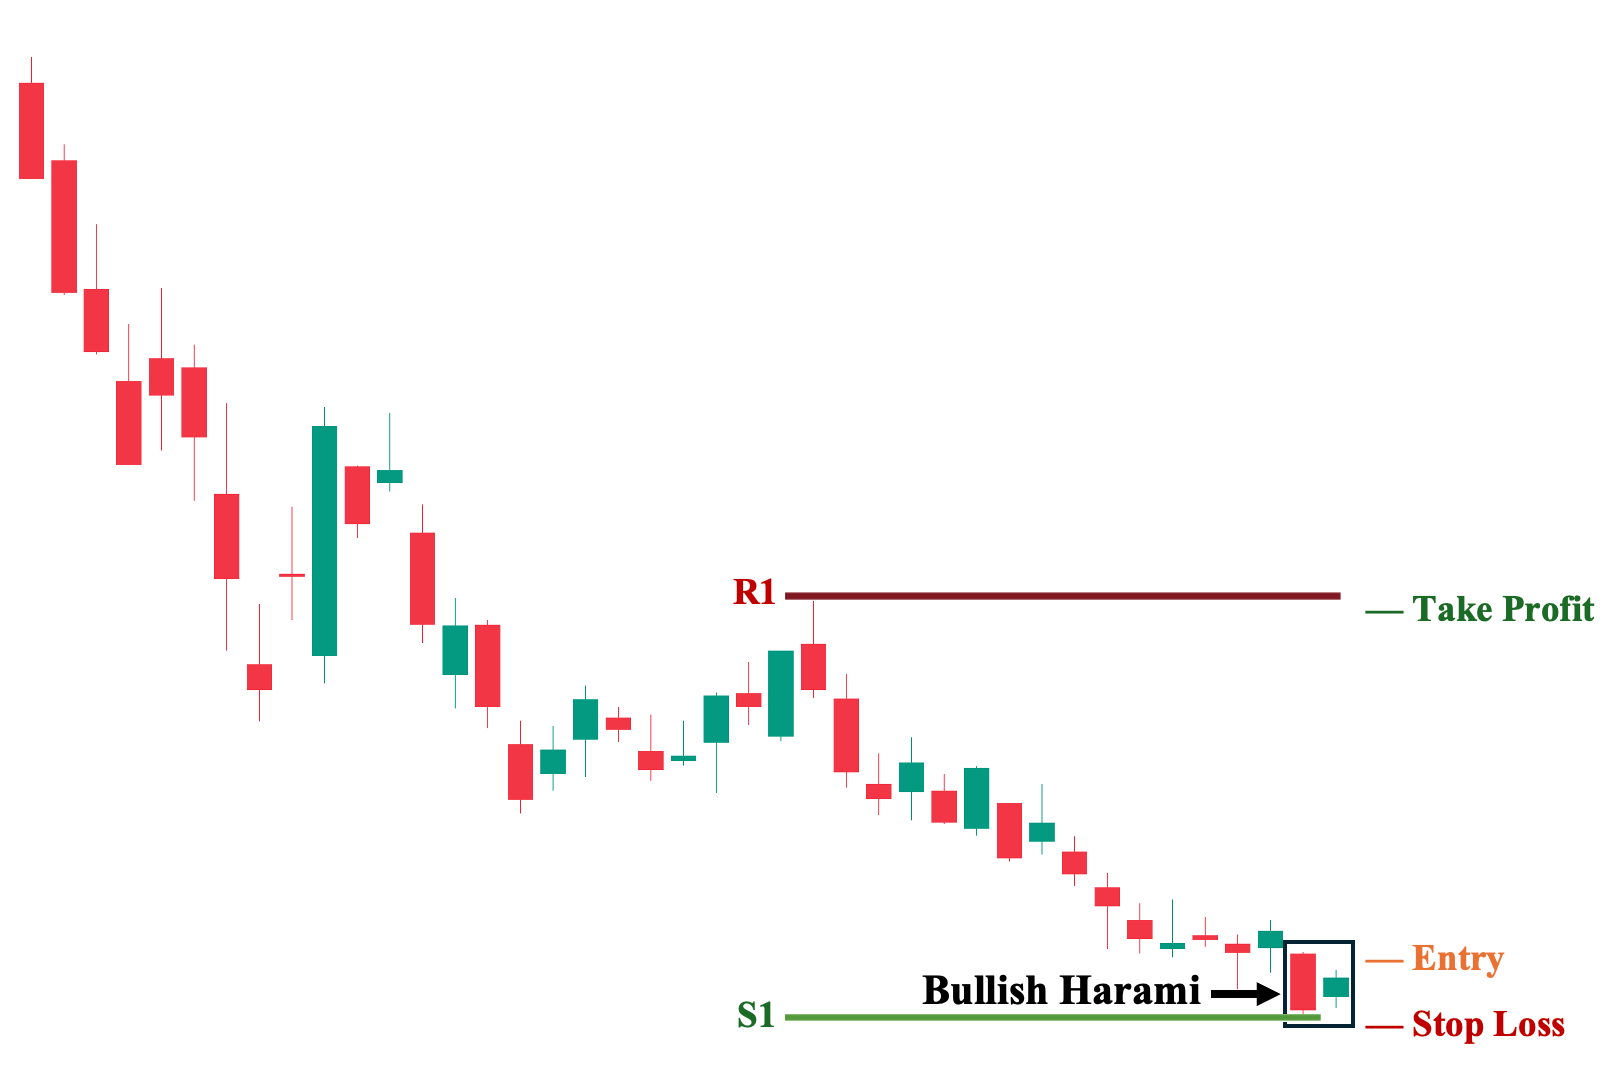
You can also use pivot points to automatically identify potential key price levels to monitor. In this illustration, we observe a bearish trend (downtrend) leading to the formation of a bullish harami pattern. By generating pivot points, we can identify the nearest suggested support level (S1) and resistance level (R1). We can then use these two levels to plan a potential long-position trade.
1. Entry Point: A few ticks above the high of the second candle.
2. Stop Loss Points: Set your stop loss a few ticks below the low of the second candle.
3. Take Profit (TP) Level: Set your TP a few ticks below the next pivot level. In this case, the R1.
4. Risk-Reward Ratio: The risk/reward ratio must be at least 1:1.
Trading The Bullish Harami With Volume Analysis
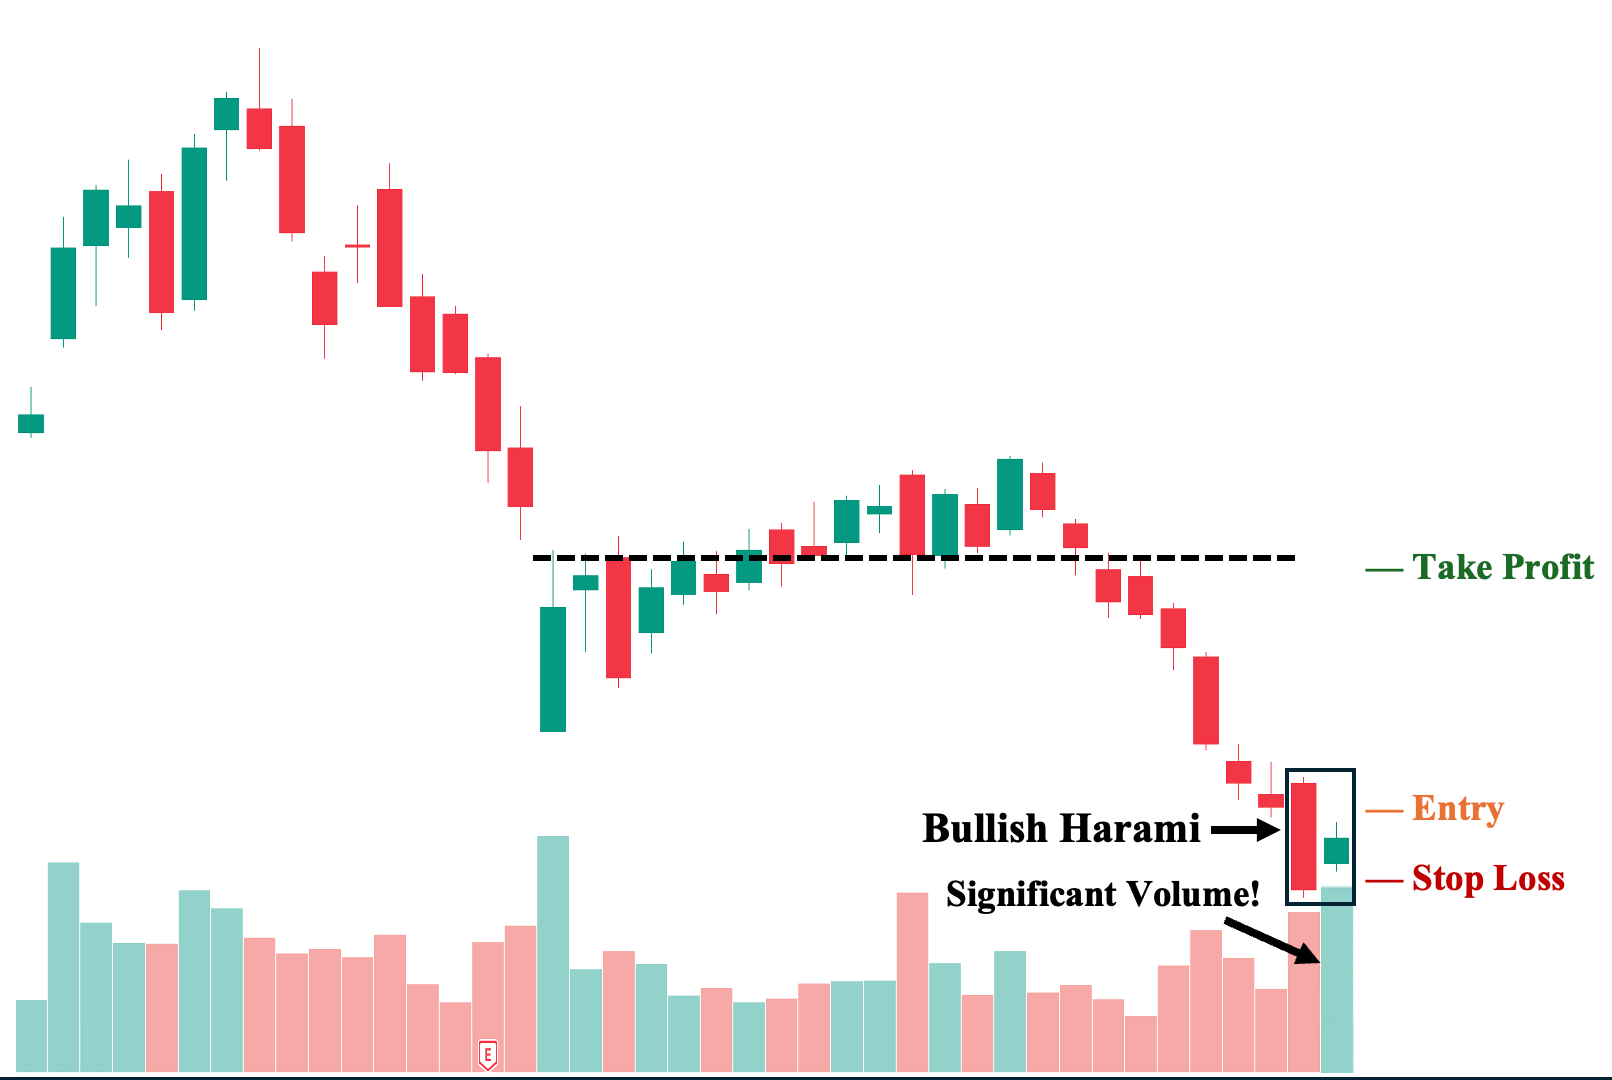
Volume is perhaps one of the most fundamental technical analysis tools you can use to increase your success rate in trading. Unlike other technical indicators that rely heavily on price, volume is independent of price, making it one of the most essential concepts to understand in trading. As a rule of thumb, when a bullish harami pattern occurs, we want to see above-average volume on the second candle (the small bullish candle), which is the case in this illustration. This is because the significant volume, coupled with the jump in price (gap up), shows that buyers are starting to gain control.
1. Entry Point: A few ticks above the high of the second candle.
2. Stop Loss Points: Set your stop loss a few ticks below the low of the second candle.
3. Take Profit (TP) Level: Set your TP a few ticks below the nearest structural resistance level.
4. Risk-Reward Ratio: The risk/reward ratio must be at least 1:1.
Trading the Bullish Harami with Bollinger Bands®
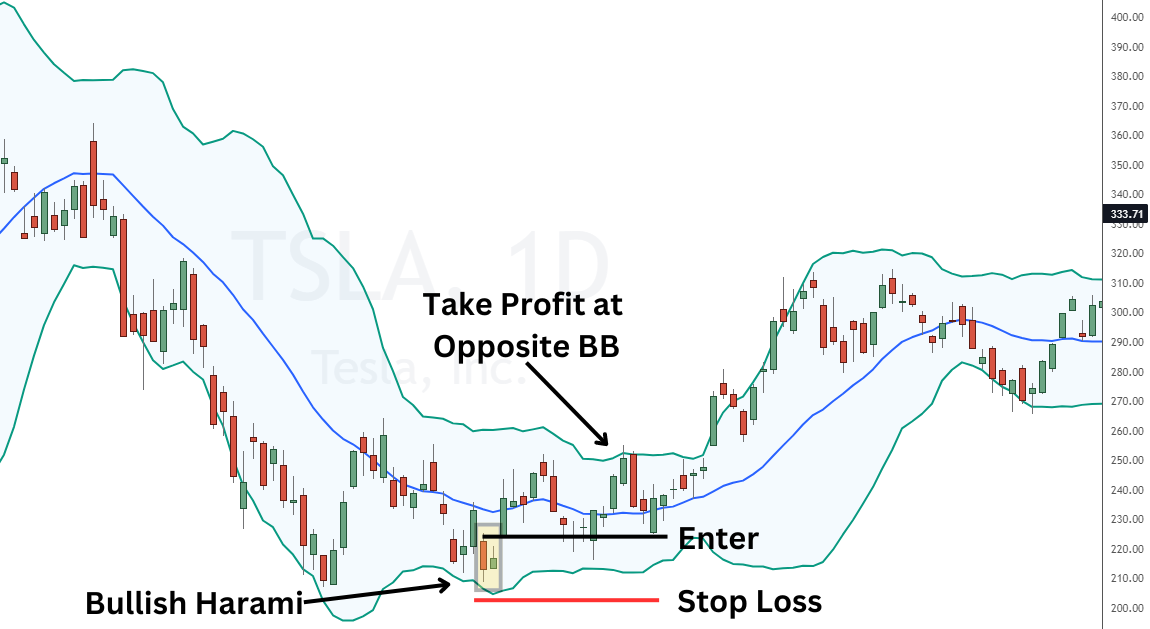
Bollinger Bands® can help traders spot levels of support and resistance. This is useful when a bullish harami develops near the lower band. When used together, the bullish harami and Bollinger Bands signal slowing momentum to the downside and a potential upside reversal.
In the example above, Tesla falls to shape a double bottom pattern. During the second low of the double bottom pattern, a bullish harami pattern appears. Simultaneously, the low of the bullish harami prints near the lower Bollinger band. The second candle gaps higher on the next day’s open and prints a small candle contained inside the first candle. A trader would wait for confirmation of a continued rally before enter the position.
1. Entry Point: A few ticks above the high of the first candle.
2. Stop Loss Points: Set your stop loss a few ticks below the low of the second candle.
3. Take Profit (TP) Level: SUtilize a dynamic take profit level that targets the opposite (upper) band.
4. Risk-Reward Ratio: The risk/reward ratio must be at least 1:1.
Advantages of Trading on the Bullish Harami Pattern
The following are the key advantages of using the bullish harami candlestick patterns:
1. Early Reversal Signal
The bullish harami can offer early signs of a possible reversal into a potential uptrend or mark the end of a pullback. This is because this bullish pattern can form after a single bullish session. Why? Well, the pattern’s first candle is technically still part of the bearish trend and, in fact, often signals a continuation of downward momentum—being a long-bodied bearish candle. Yet, when the market gaps higher on the next bullish session that holds above the low, it can already become a viable trend reversal pattern.
2. Low-Risk Entry Points
Because the bullish harami pattern’s second candle is often much smaller, it typically allows for a close cut-loss point relative to your entry. This setup enables a low-risk play, compensating for the pattern’s lower success rate than similar candlestick patterns (which will be discussed in the disadvantages section). Therefore, this drastically reduces the chance of incurring significant losses, as you can immediately cut your losses short (this is one of the most crucial trading techniques to be profitable).
3. Ideal for Exhaustion Plays
The bullish harami pattern often forms when a downtrend or pullback phase is “exhausted”—meaning the bearish momentum driving prices lower is losing steam. This is reflected in the second candle’s sudden gap up in price versus the previous candle, signaling a likely shift in market sentiment where buyers are now gaining control, which could ultimately lead to a potential uptrend or the end of the pullback phase.
Disadvantages of Trading on the Bullish Harami Pattern
The following are the notable disadvantages of using the bullish harami candlestick patterns:
1. Inferior Versus Other Major Bullish Reversal Patterns
Despite being classified as a bullish pattern, the bullish harami lacks the “immediate” strength observed in other bullish reversal patterns. For instance, in a bullish engulfing pattern, we can quickly identify a strong buying conviction from the second bullish candlestick, which fully engulfs or covers the range of the first bearish candle. In contrast, the bullish harami’s reversal signal doesn’t necessarily arise from sudden buying conviction but rather from the diminishing selling pressure.
2. Relatively Weak When Used in Isolation
The bullish harami is relatively weaker than other comparable candlestick patterns when used in isolation. For instance, a tweezer bottom—which is also a two-candlestick bullish reversal pattern—can effectively show a clear rejection of lower prices. In contrast, the bullish harami can simply be a sign of momentary pause unless accompanied by a complementary indicator or viewed within the broader market context for confirmation.
3. Limited Use in Momentum Trading
If your trading strategy relies on momentum, then using the bullish harami as your primary candlestick reversal signal may not be optimal. This is because other candlestick patterns, such as the bullish engulfing, provide more decisive bullish trend reversals. In contrast, the bullish harami often requires strong confirmation from other technical indicators to instill confidence that it has the necessary momentum to move swiftly over a short period—an essential aspect of momentum trading.
For momentum traders who rely on swift, aggressive moves, the bullish harami may appear too weak or slow in indicating a reversal, especially compared to stronger patterns like bullish engulfing or piercing patterns.
Bullish Harami Pattern vs. Bullish Engulfing Pattern
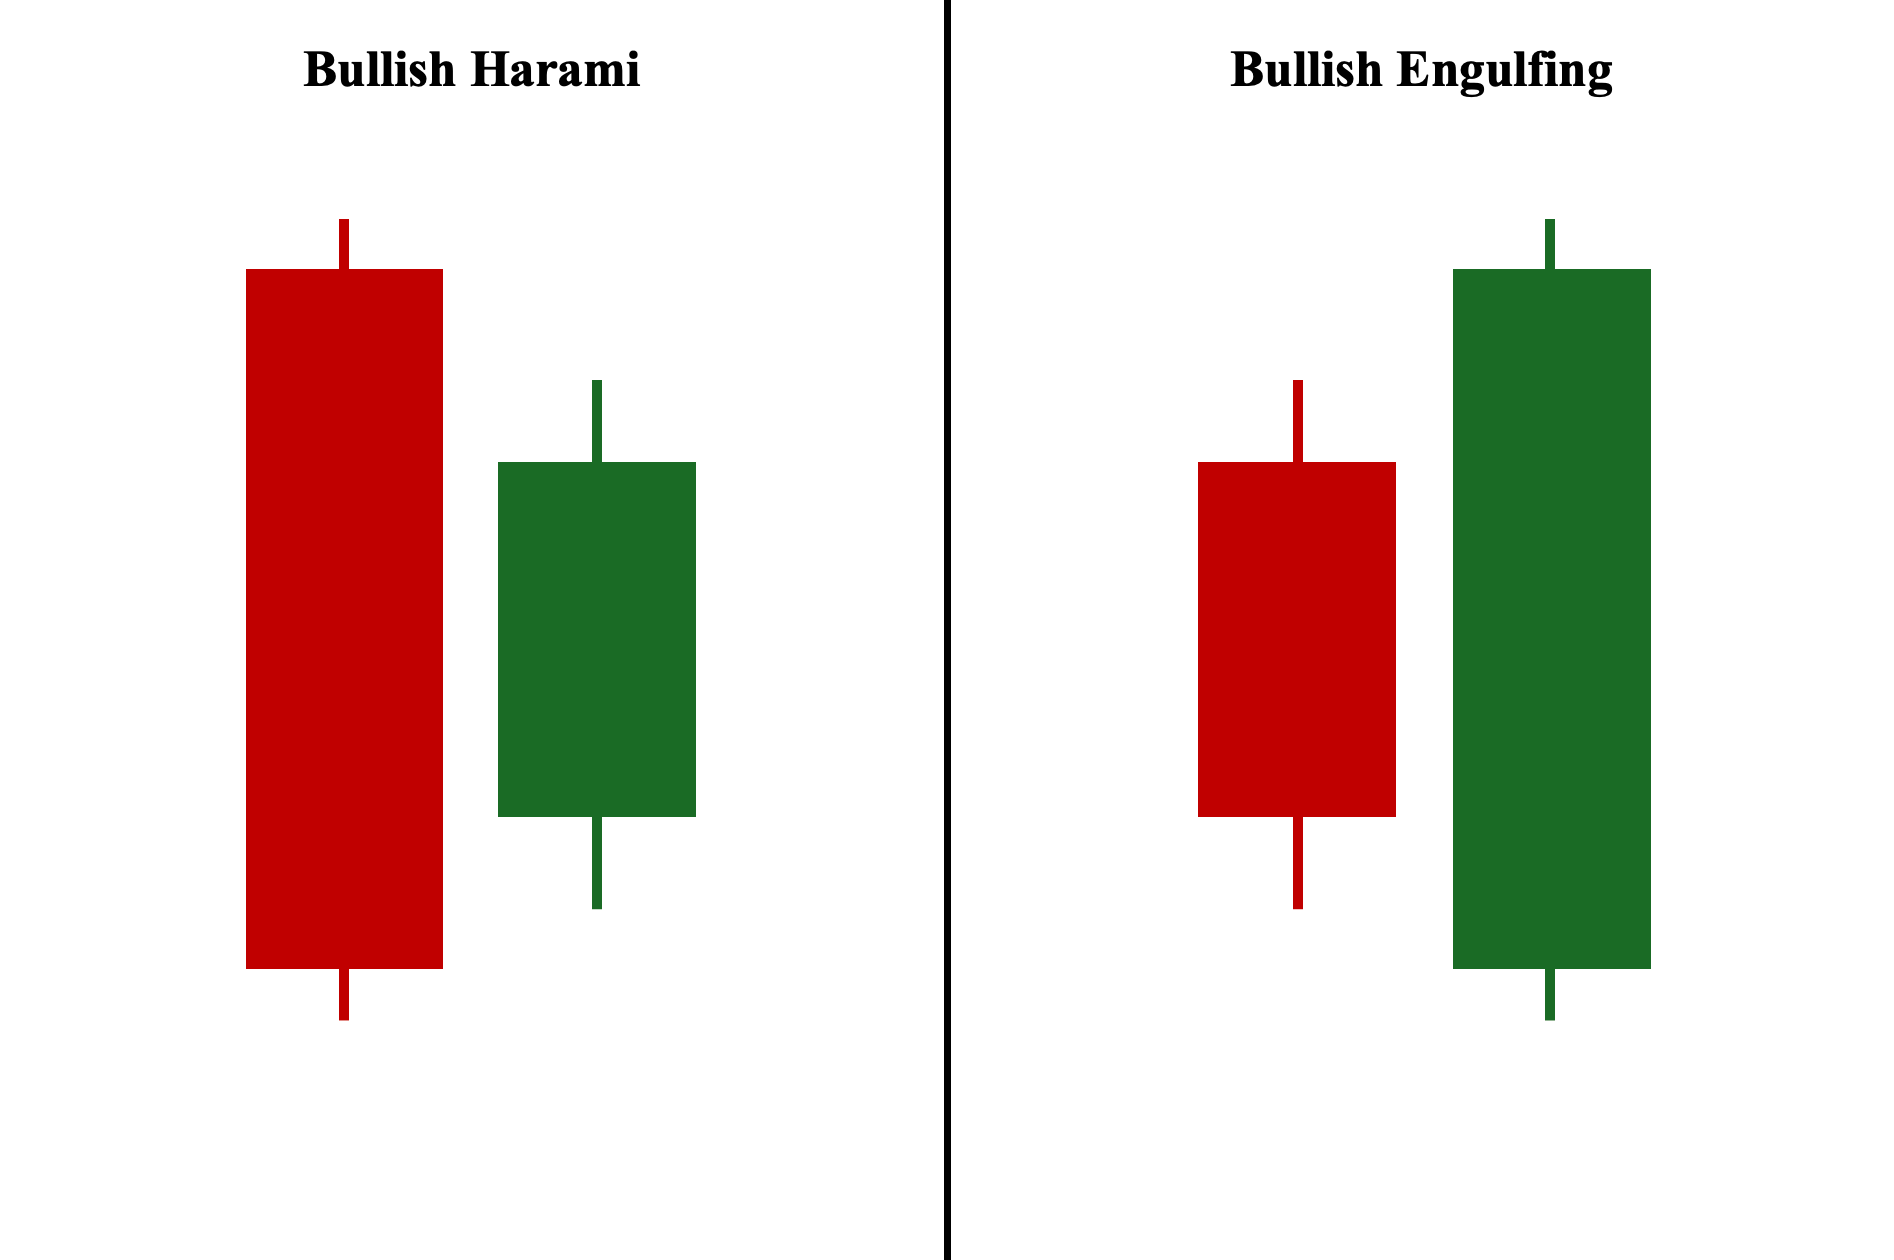
Both the bullish harami and bullish engulfing—as their name imply—are bullish reversal candlestick patterns that are used to signify a shift in market sentiment from bearish (i.e., an ongoing downtrend or uptrend’s pullback phase) to bullish (i.e., an upward market rally or uptrend). With that said, we can see that the two patterns are a complete mirror of each other.
This is because while the bullish harami pattern involves two candlesticks with a long-ranged bearish candle as its first candle and short-ranged bullish candle as its second candle, the bullish engulfing pattern is formed with a short-ranged bearish candle (first candle) and a long-ranged bullish candle (second candle). The second candle is contained within the first candle for the bullish harami while the first candle is contained within the second candle for the bullish engulfing.
Comparatively, the bullish engulfing pattern is generally considered a stronger bullish reversal pattern since the second bullish candle completely engulfs or covers the first small bearish candle.
Bullish Harami Pattern vs. Bearish Harami Candlestick Pattern
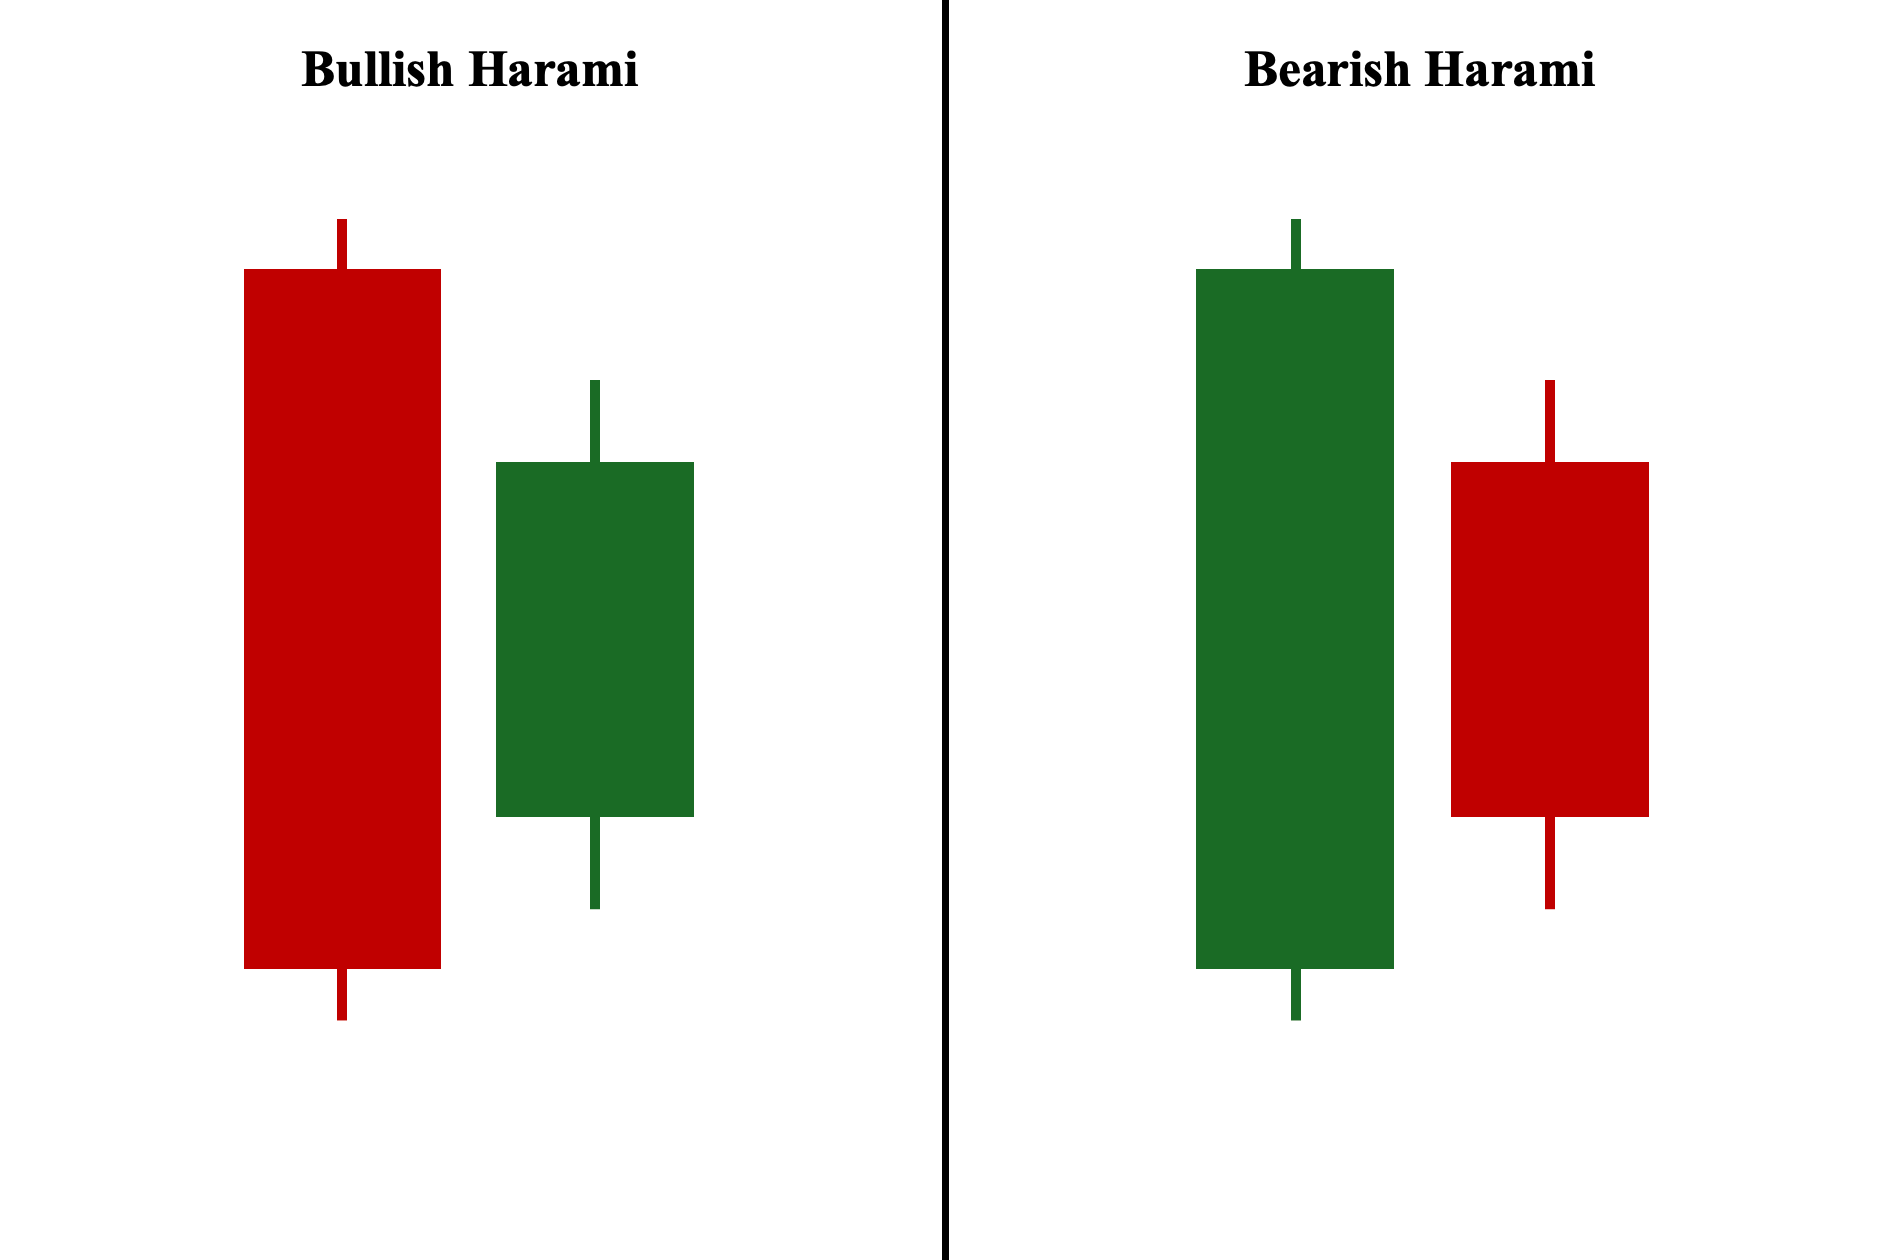
Both harami patterns begin with a long-ranged candle and end with a small second candle that is contained within the first. Additionally, both harami patterns signal trend reversals, albeit on opposite sides. Their comparisons stop there.
While the bullish harami occurs during a bearish move—either in an ongoing downtrend or the pullback phase of an uptrend—to indicate a potential upward market rally, the bearish harami forms during a bullish move—either in an ongoing uptrend or the retracement/pullback phase of a downtrend—and signals a possible start of downward price momentum.
Bullish Harami Pattern vs. Tweezer Bottom Pattern
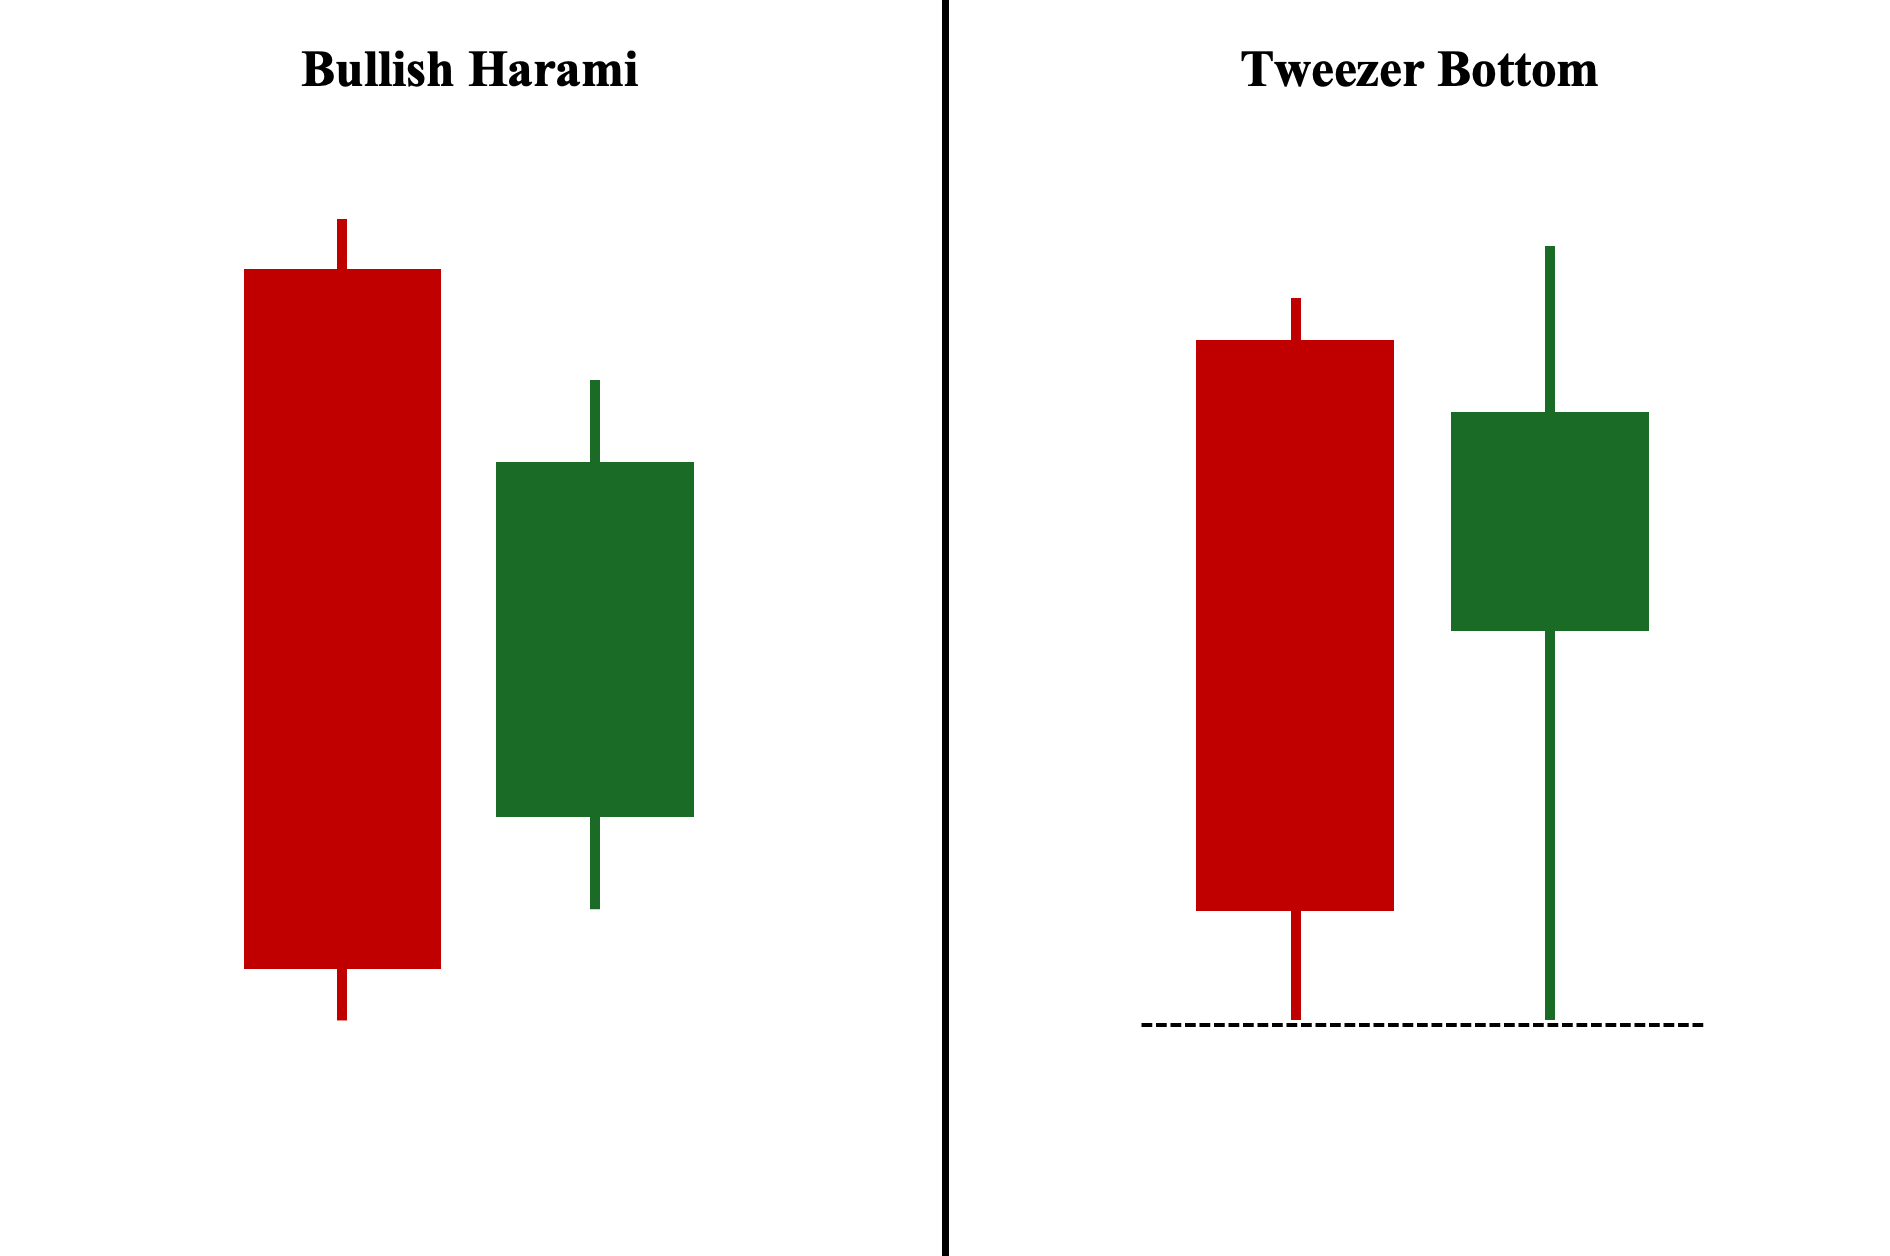
Both the bullish harami and tweezer bottom patterns are used to signal bullish trend reversals. However, unlike the standard bullish harami where the second candle is contained within the first candle, the tweezer bottom pattern consists of two candles with identical lows.
Note: Both candlestick patterns can occur simultaneously, provided that the two candles have similar lows and the second candle remains within the range of the previous candle. In fact, when this happens, it provides an even stronger bullish reversal signal.
Bullish Harami vs. Inside Bar
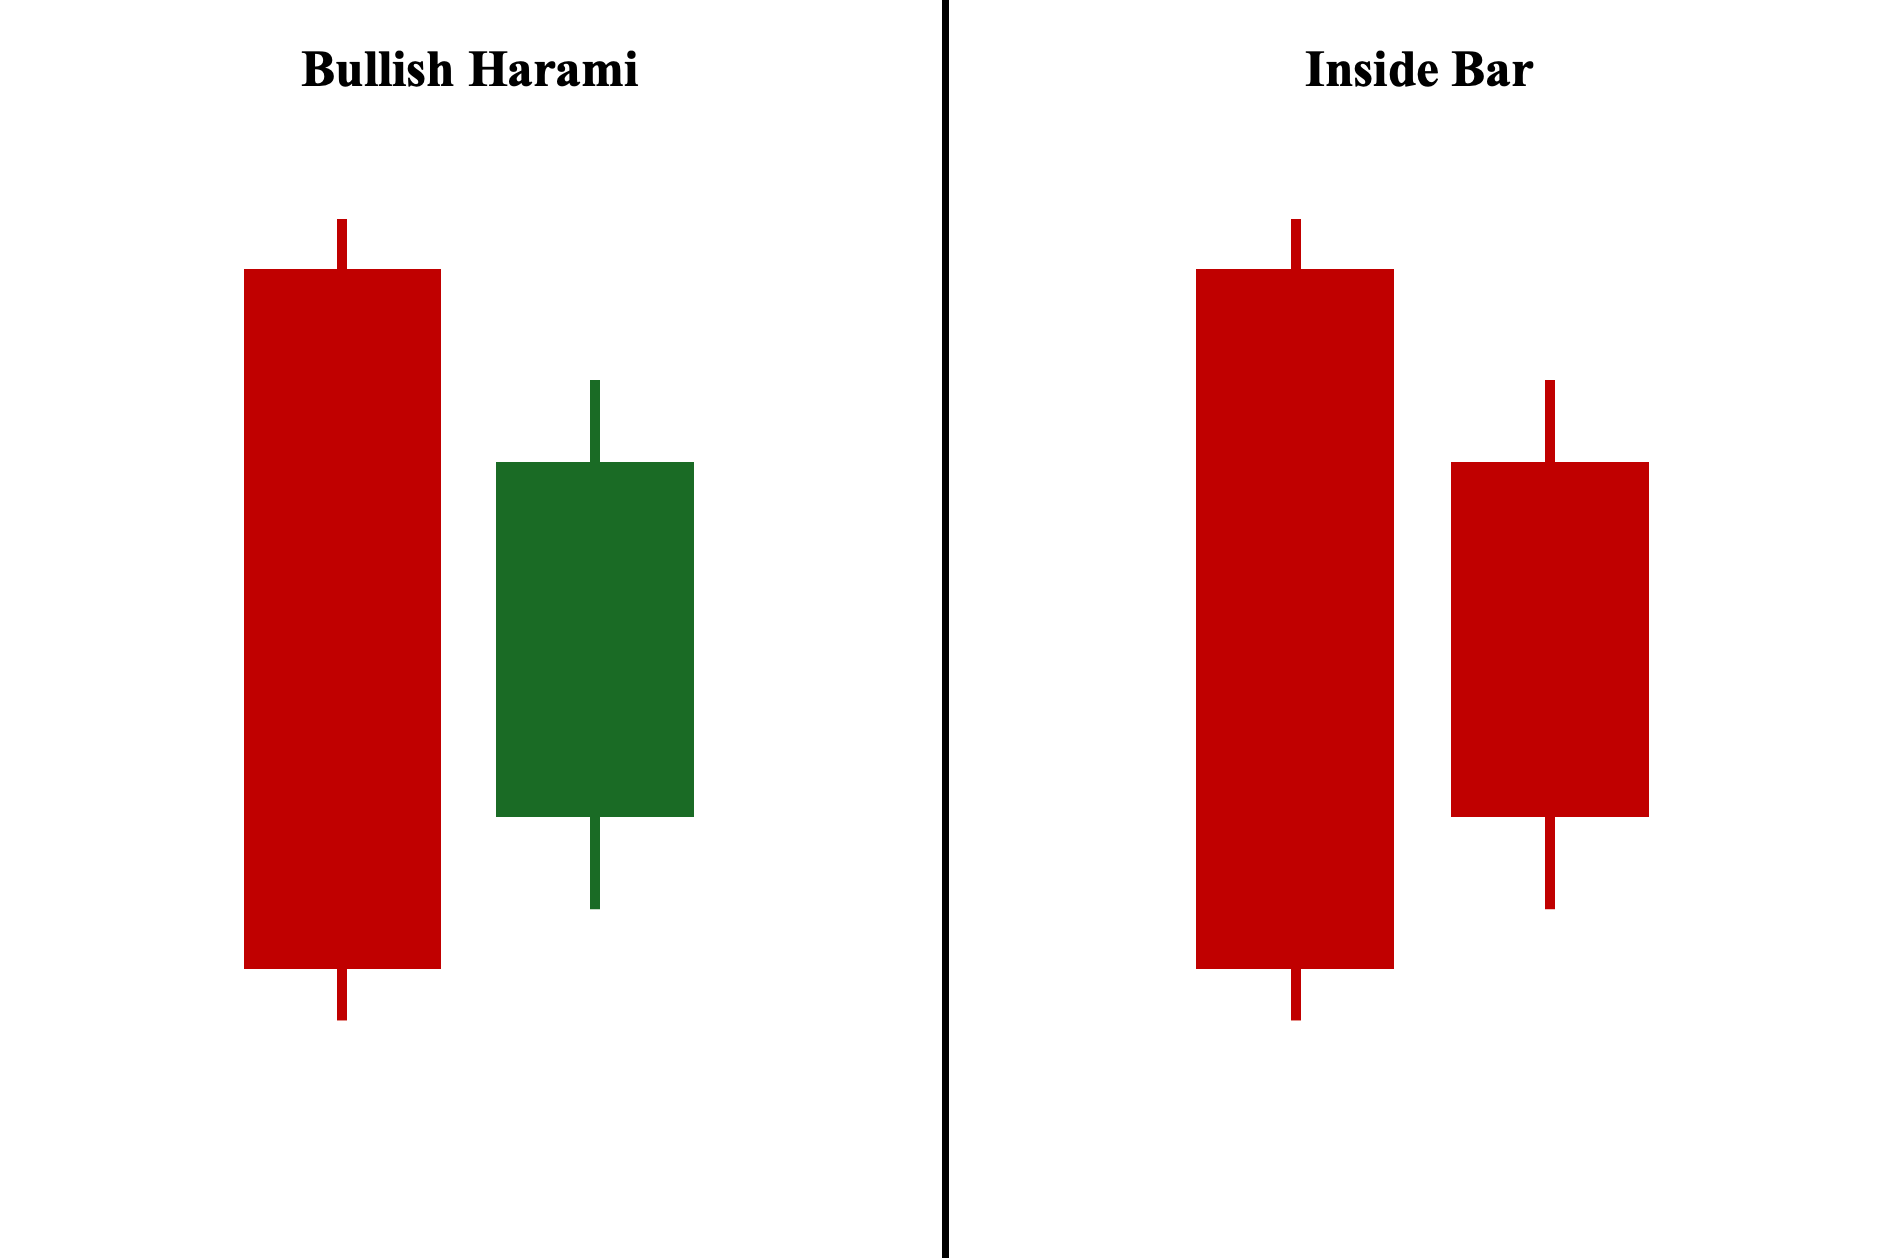
Finally, and perhaps the most potentially confusing, the bullish harami and inside bar formations can look similar or even identical in some scenarios. Yet, there are key differences to take note of. First, while both patterns consist of a long-ranged first candle and a short-ranged second candle, the color of these candles is of secondary importance for the inside bar. This is because what determines its “bullish” or “bearish” nature depends on its position on the chart, not the color of its candlesticks. As a result, compared to harami patterns, an inside bar can have two candles of the same color (in fact, two bearish candles can be considered a bullish signal, and vice versa, depending on their position on the chart).
Second, while harami patterns signify potential reversal, inside bars are merely considered indecision candles, where a third (confirmation) candle is needed to verify the likely price direction (i.e., whether it will serve as a reversal or simply a continuation pattern).
Common Bullish Harami Pattern Mistakes to Watch out
Here are the three key mistakes to avoid to improve your success rate when using bullish harami patterns:
1. Failing to Account Market Context
The bullish harami can be misleading if not analyzed within the broader market context, such as ignoring key structural support and resistance levels where the pattern occurs or overlooking the existing trendline where the bullish harami pattern appears.
2. Misrepresenting a Pause as an Automatic Sign of Reversal
It’s important to note that the bullish harami can sometimes indicate only a temporary pause in its downward path rather than a full reversal. This is especially true when it occurs at a price level that lacks significance or when the confirmation tool you use does not align with the reversal signal.
3. Confusing a Bullish Harami with an Inside Bar
Finally, there is the risk of mistakenly confusing an inside bar with a bullish harami. This is particularly common among newer traders who have yet to gain enough experience to effectively differentiate between the two patterns.
Frequently Asked Questions (FAQs)
What is the best time frame to use for the bullish harami pattern?
Candlestick formations such as the bullish harami are generally more reliable when the pattern appears on the price charts in longer time frames, particularly on the daily and weekly timeframes—as these are the standard chart timeframes used by most institutional and retail traders and investors.
How common is the bullish harami candlestick pattern?
The bullish harami, being a two-candlestick pattern, is one of the most common candlestick patterns observed on the price charts. This is because, in general, two-candlestick patterns appear more frequently than three-candlestick patterns or higher. Additionally, the bullish harami has a relatively basic condition for its two candles to be considered valid.
Does the bullish harami pattern work, and is it profitable?
Yes, the bullish harami works as a reversal pattern to initiate a potential uptrend (from a downtrend) or continue upward momentum (from a pullback). However, no candlestick pattern is perfect or works all the time. Therefore, to be profitable, it’s crucial to have sound risk management in place to ensure you do not incur significant losses when the pattern fails.
How accurate is the bullish harami pattern?
The accuracy of bullish harami patterns depends on how they are employed in your trading strategy. Generally, while it can work, the pattern is less accurate when used on its own. In contrast, it becomes more accurate and reliable when paired with complementary technical analysis tools (e.g., RSI, MAs, volume, etc.) to better assess the pattern’s likelihood of leading to a possible reversal.
Can a bullish harami pattern occur in both uptrends and downtrends?
Yes, the bullish harami pattern can appear in both uptrends and downtrends on price charts. However, for the pattern to be valid, it must either occur in an existing downtrend that is actively making lower lows or during the pullback phase (a temporary market decline) of an uptrend.
Is a bullish harami candlestick pattern a bullish reversal?
Yes, as its name implies, the bullish harami is indeed a bullish reversal pattern. It is primarily used to signal a potential shift in market sentiment against an ongoing downtrend or to mark the end of the pullback phase in an uptrend.


