


Written by:

Reviewed by:


Bearish
Bullish
- October 5, 2024
- 24 min read
Marubozu Candlestick Pattern
What is a Marubozu Candle?
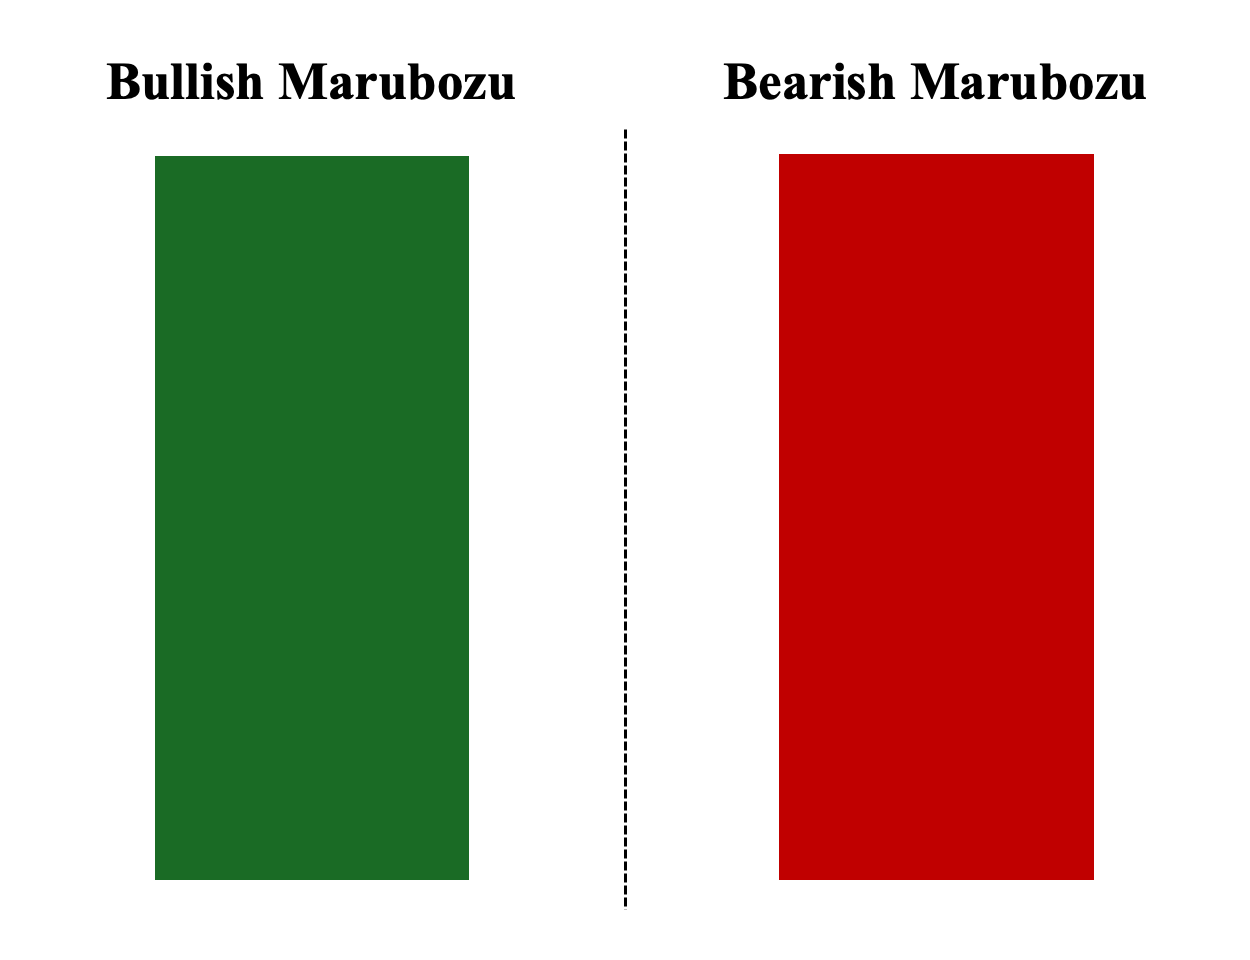
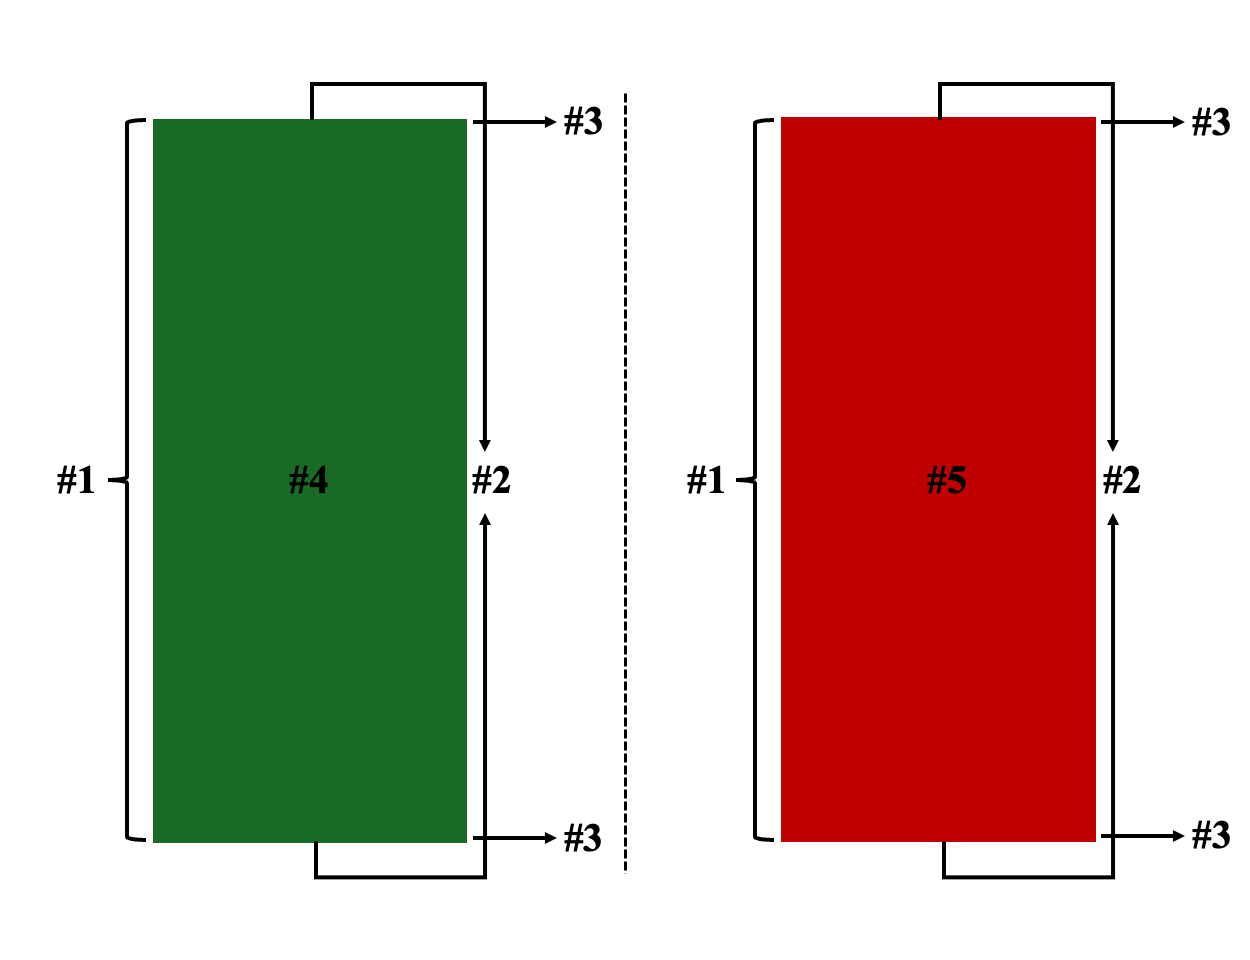
A marubozu is a one-candlestick pattern that reflects decisive bullish or bearish market sentiment, where one party—either buyers or sellers—is predominantly or completely in control of price action. This results in a long-bodied candle with little to no shadows. It can then be classified as either a “bullish marubozu,” characterized by a green or white long-bodied candlestick with little to no upper or lower shadows, or a “bearish marubozu,” characterized by a red or black long-bodied candlestick with no or very small shadows on either side.
The candle with no wick gives the appearance of a bald head or shaved head. This is how the pattern obtained its name as marubozu is the Japanese term for bald hill or closed-cropped (shaved) head.
What is a Marubozu Full Candle?
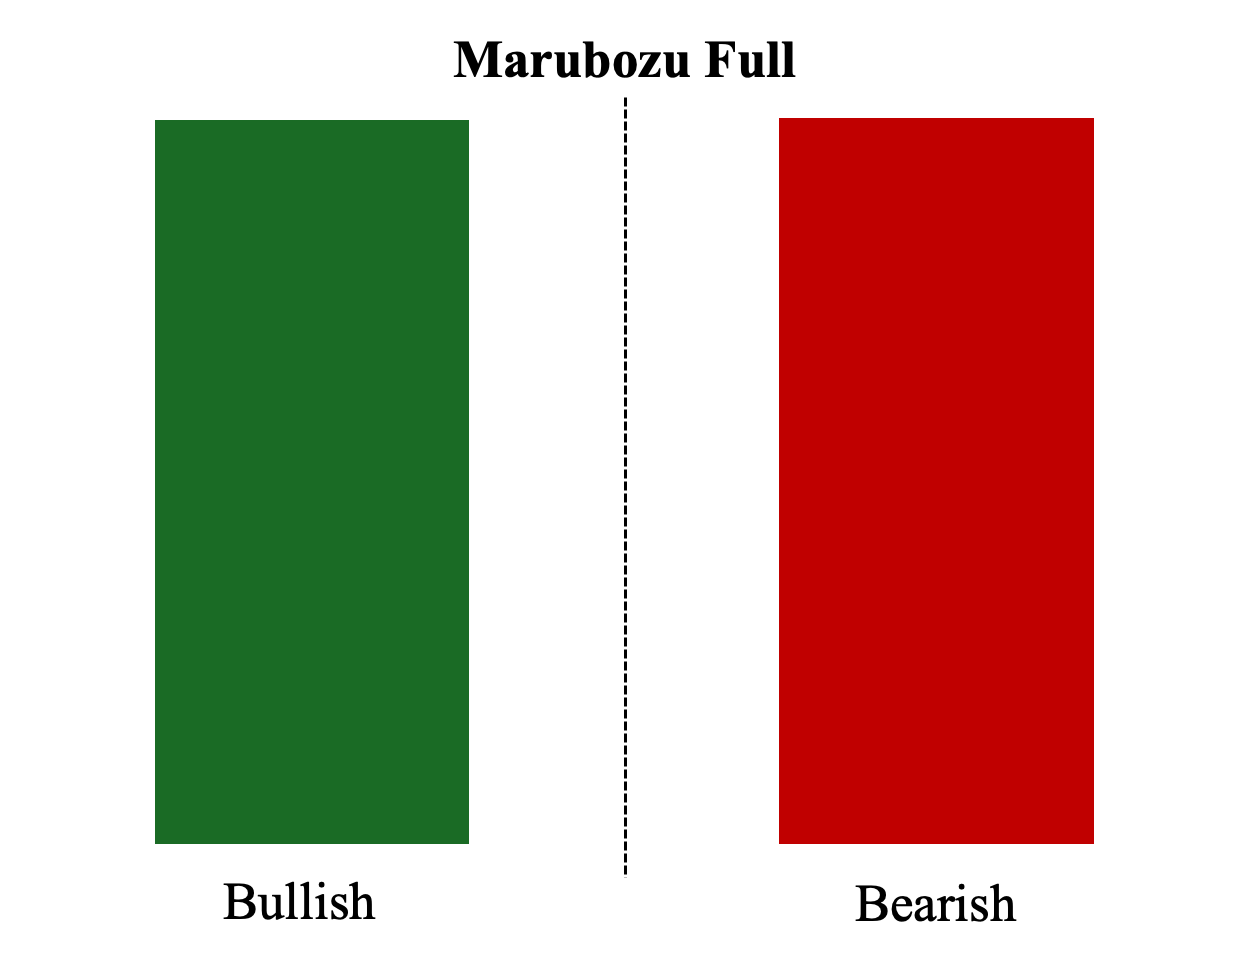
The marubozu full candlestick is a variant of the marubozu pattern with only a body and no shadows or wicks on either side. This is arguably the strongest and most ideal version of the marubozu, as it shows total control and dominance by one party from opening to closing. Here’s what it looks like for bullish and bearish marubozu:
a. Bullish Marubozu Full – the opening price is also the lowest price, and the closing price is also the highest price in that trading session.
b. Bearish Marubozu Full – the opening price is the highest price, and the closing price is the lowest price for that trading session.
What is a Marubozu Open Candle?
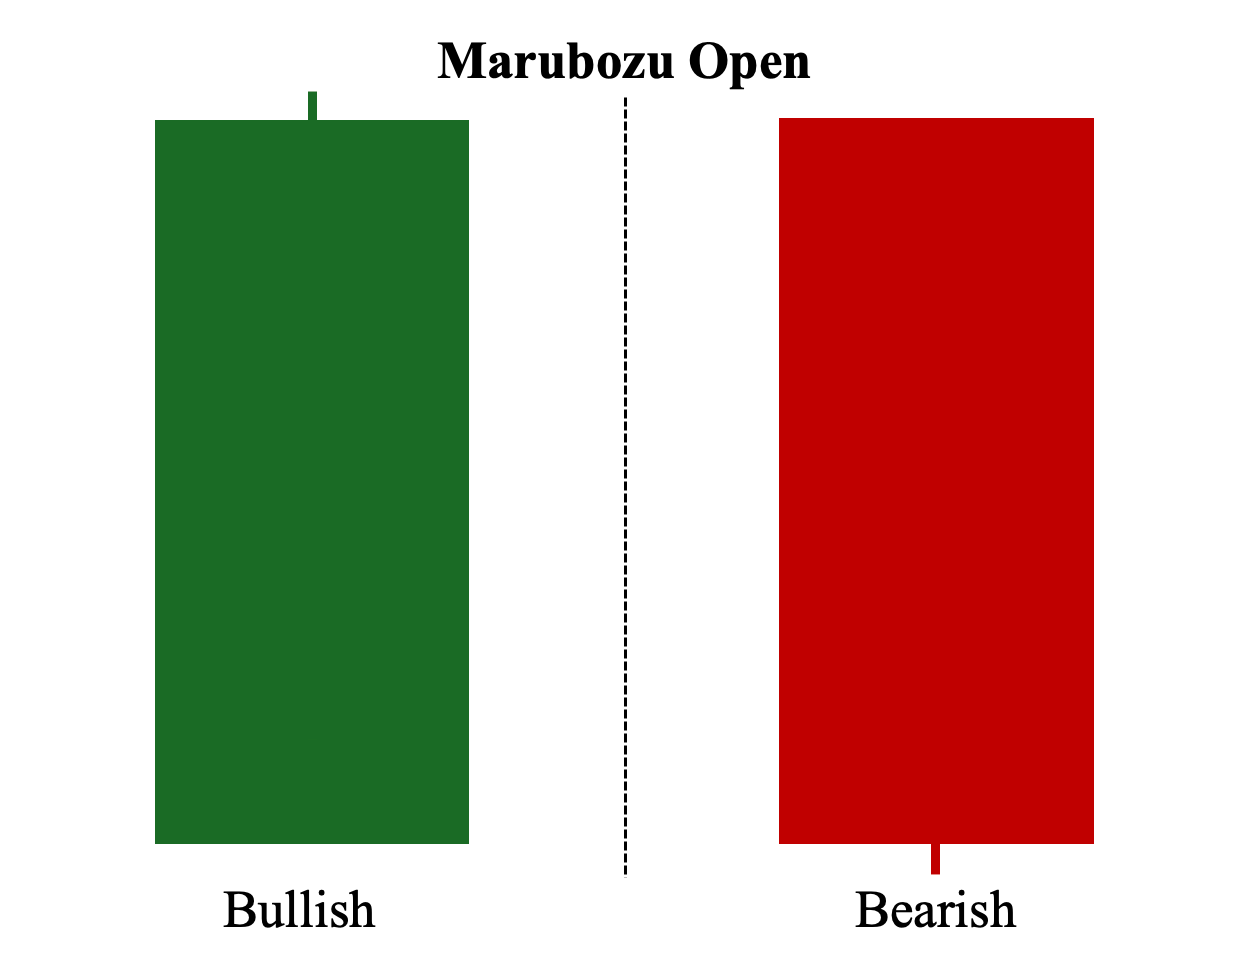
The marubozu open candlestick (also known as the opening marubozu candle) is another variant of the marubozu pattern where the opening price is also the lowest price for the bullish marubozu candle and the highest price for the bearish marubozu candle. However, the closing price is not the highest for the bullish marubozu nor the lowest for the bearish marubozu. This results in a candle having a small wick near the closing price, demonstrating that one party—although still predominantly in control—is not entirely in control of the price action, particularly towards the end of the trading session.
a. Bullish Marubozu Open – The opening price is also the lowest price, but the closing price is NOT the highest price.
b. Bearish Marubozu Open – The opening price is also the highest price, but the closing price is NOT the lowest price.
What is a Marubozu Close Candle?
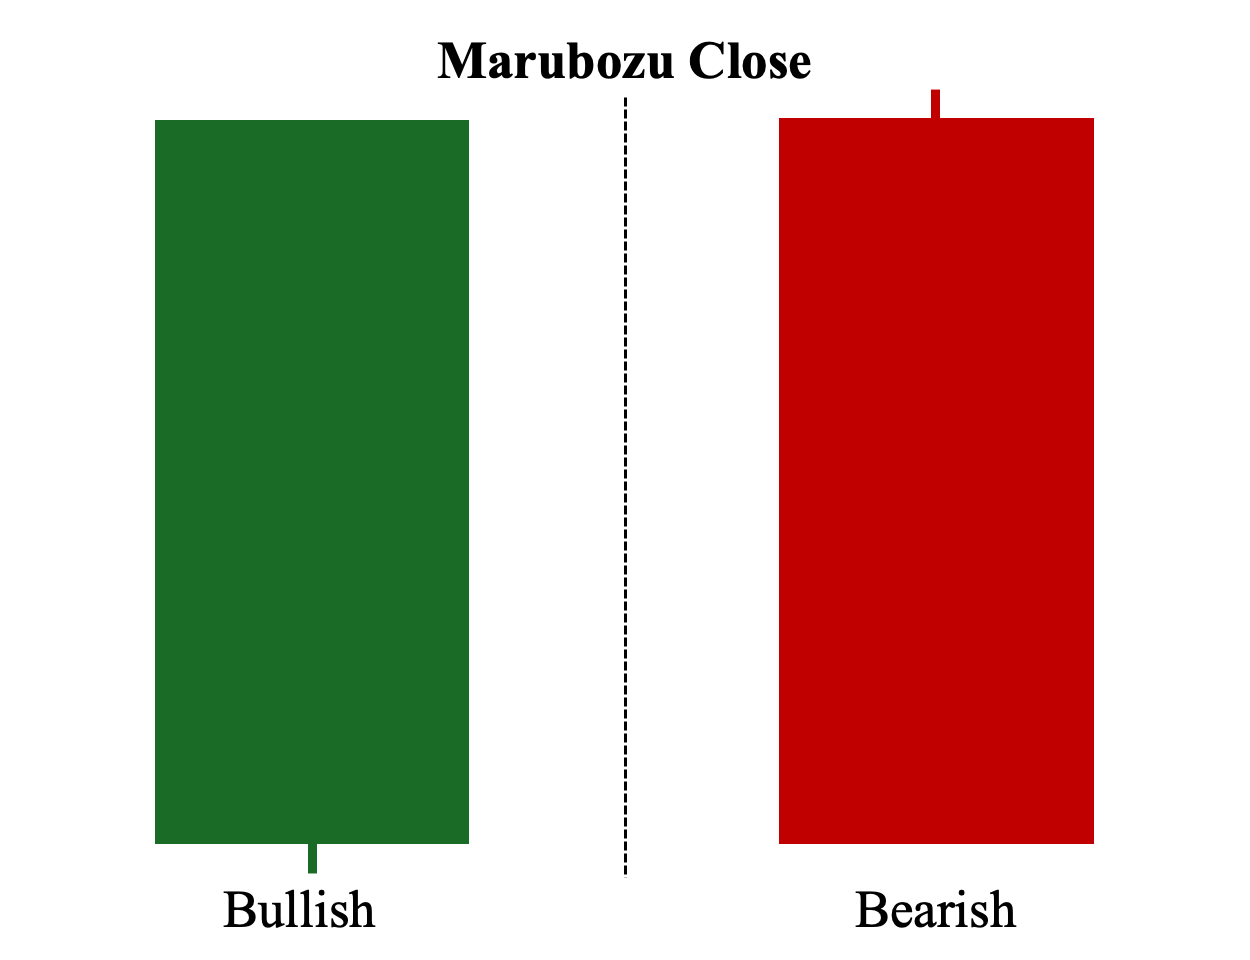
The marubozu close candle (also known as the closing marubozu candle) is the third variant of the marubozu pattern and the opposite of the marubozu open or opening marubozu candle. In the price chart, the bullish marubozu will decline first on the open, then rally upward to close at the session’s highest price. Similarly, the bearish marubozu will rise first on the open, then decline to close at the session’s lowest price. Overall, this pattern shows that there was a struggle for control between the two parties when the trading session began, but ultimately, one party overwhelmed the other towards the end of the session.
a. Bullish Marubozu Open – The closing price is also the highest price, but the opening price is NOT the lowest price.
b. Bearish Marubozu Open – The closing price is also the lowest price, but the opening price is NOT the highest price.
What Does the Marubozu Candlestick Indicate?
A marubozu candle conveys tremendous market interest in an asset generated through intense one-sided buying or selling pressure. Hence, marubozu candles—both bullish and bearish variants—have no or very small shadows, as the price moves decisively in one direction throughout the trading session.
How to Identify the Marubozu Candlestick Pattern?
Here are five primary criteria to quickly identify a viable marubozu candle in a price chart:
1. Body – Must have a long-bodied that typically stands out among other candlesticks.
2. Shadow – Must have little to no shadows or wicks.
3. Key Price Levels – The open and close prices are subsequently the lowest and highest prices or, at the very least, near them if there is a shadow.
4. Bullish Marubozu – The candlestick pattern must be green or white and occur in an ongoing uptrend to serve as a confirmation signal that the upward move will likely continue.
5. Bearish Marubozu – The candlestick pattern must be red or black and occur in an ongoing downtrend to serve as a confirmation signal that the downward move will likely continue.
What Is the Importance of the Marubozu Candlestick Pattern?
Overall, marubozu candlesticks help traders formulate more informed trading decisions that align with their trading strategy and approach. Unlike other candlestick formations, which can serve as trend reversal patterns (e.g., when a bearish candlestick pattern suggests an upcoming bearish reversal or identify potential trend reversals), marubozu is predominantly used as a confirmation signal that the ongoing trend will continue. This information can guide traders to find viable entry points to position themselves for a potential rally.
Marubozu Candlestick Pattern Examples
Here are five examples of bullish and bearish marubozu candlestick patterns in different market environments:
Example #1: Uptrend Confirmation – Successful Set-Up

In this first example, we observe an uptrend before the bullish marubozu appears. When it does, it successfully serves as a confirmation candle, indicating that the uptrend remains intact and that the bullish sentiment continued to drive the asset’s price higher. Thus, in this scenario, the marubozu candle pattern materialized as a leading signal.
Example #2: Uptrend Confirmation – Failed Set-Up
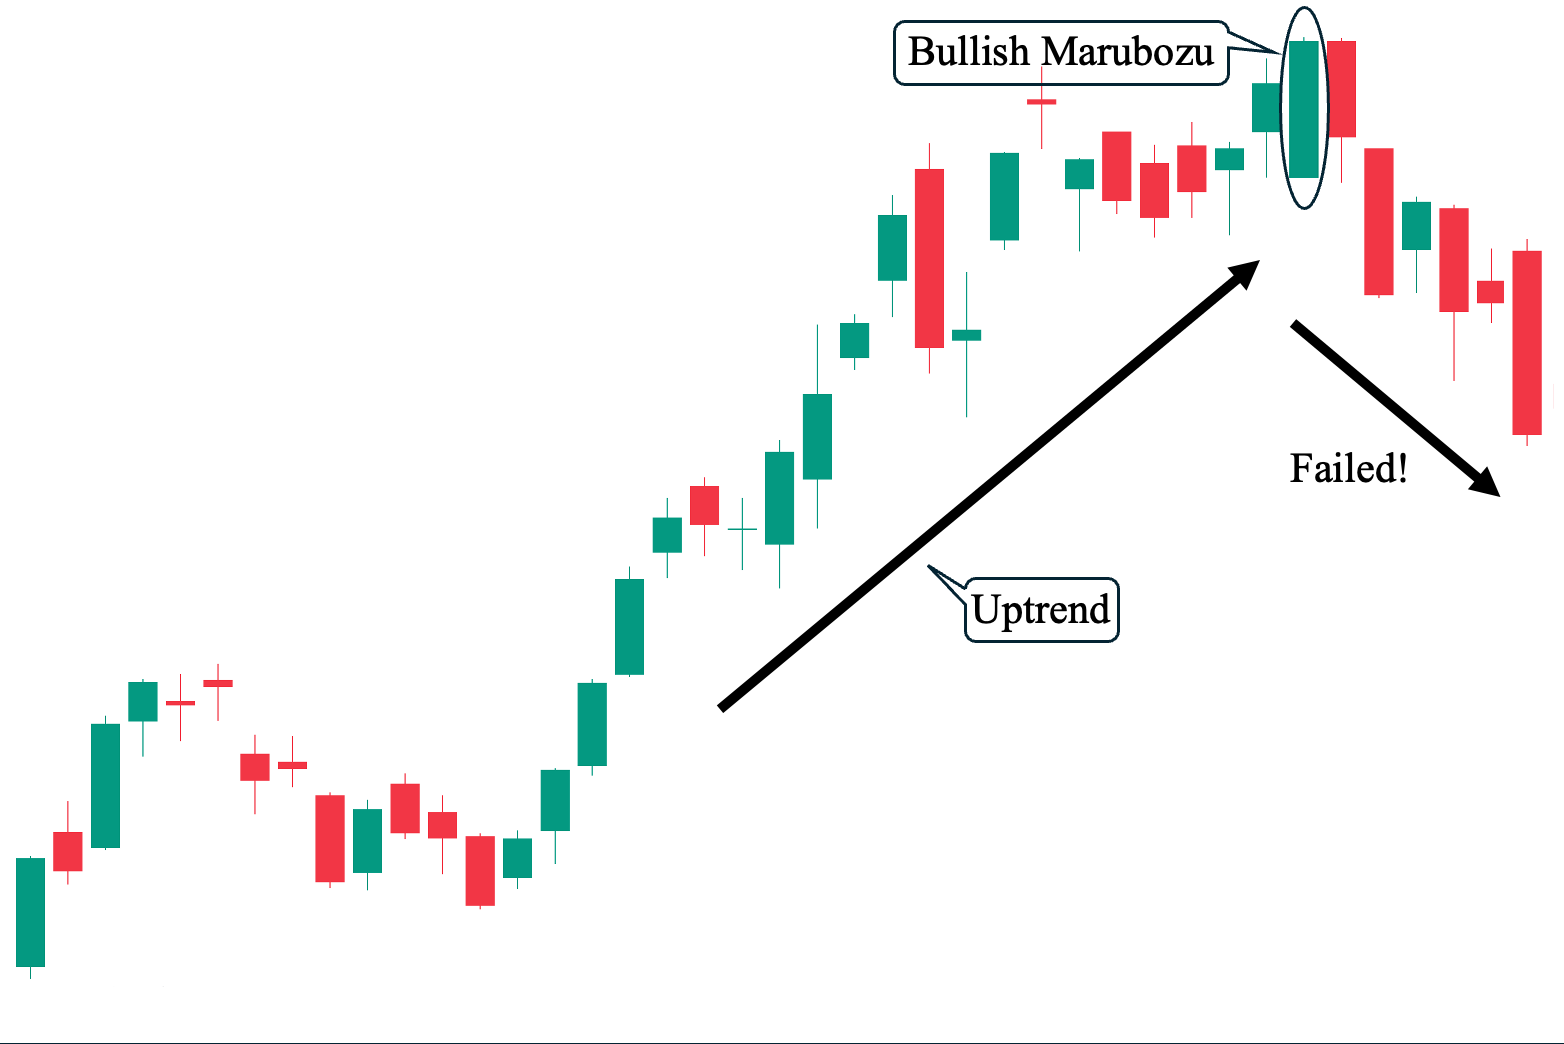
Similar to the previous example, our second example also shows an uptrend preceding the bullish marubozu candle. However, after it formed, the price did not continue with the expected upward move. Instead, we observe a trend reversal due to significant selling pressure (as evidenced by the long-bodied bearish candles that followed). In this scenario, the marubozu pattern failed. This example illustrates that even when a candlestick pattern meets all conditions, it can still ultimately fail. Therefore, it’s crucial to have a sound risk management system in place to avoid potentially catastrophic losses.
Example #3: Downtrend Confirmation -Successful Set-Up
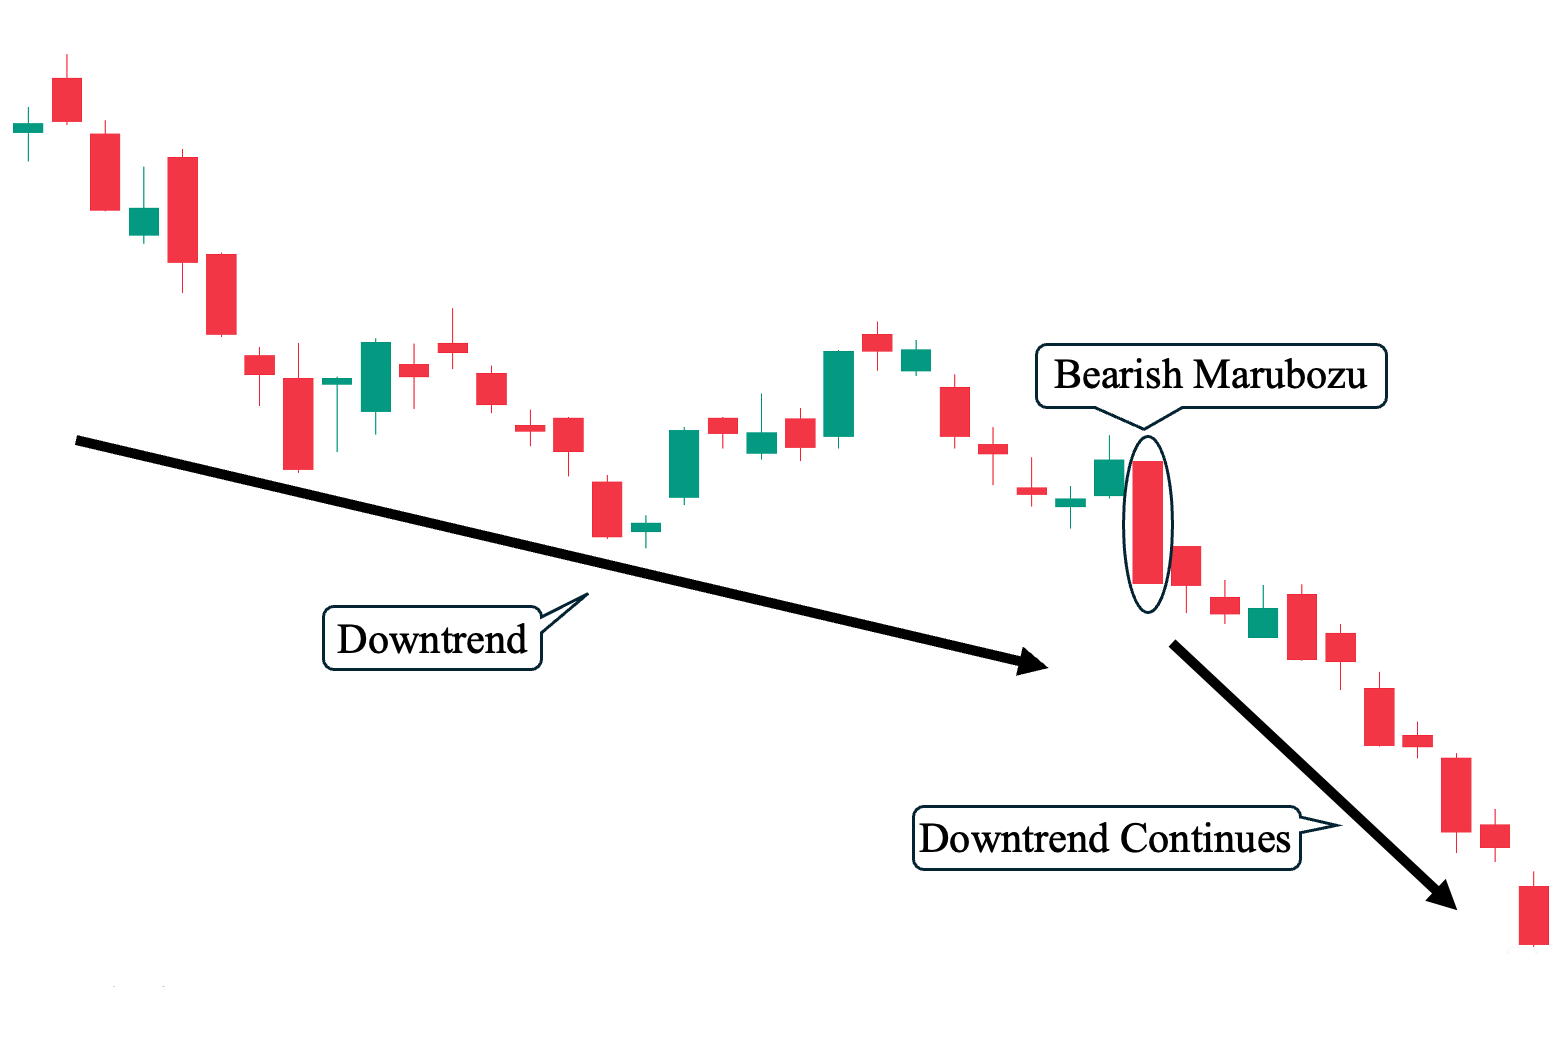
Let’s now look at some bearish marubozu setups, starting with our third example. As shown, a downtrend preceded the bearish marubozu candle. When the candlestick appeared, it successfully acted as a bearish continuation pattern, driving the price much lower as selling pressure intensified. In this scenario, the marubozu candle once again served as a leading signal, indicating that a steeper downward move was about to materialize.
Example #4: Downtrend Confirmation – Failed Set-Up
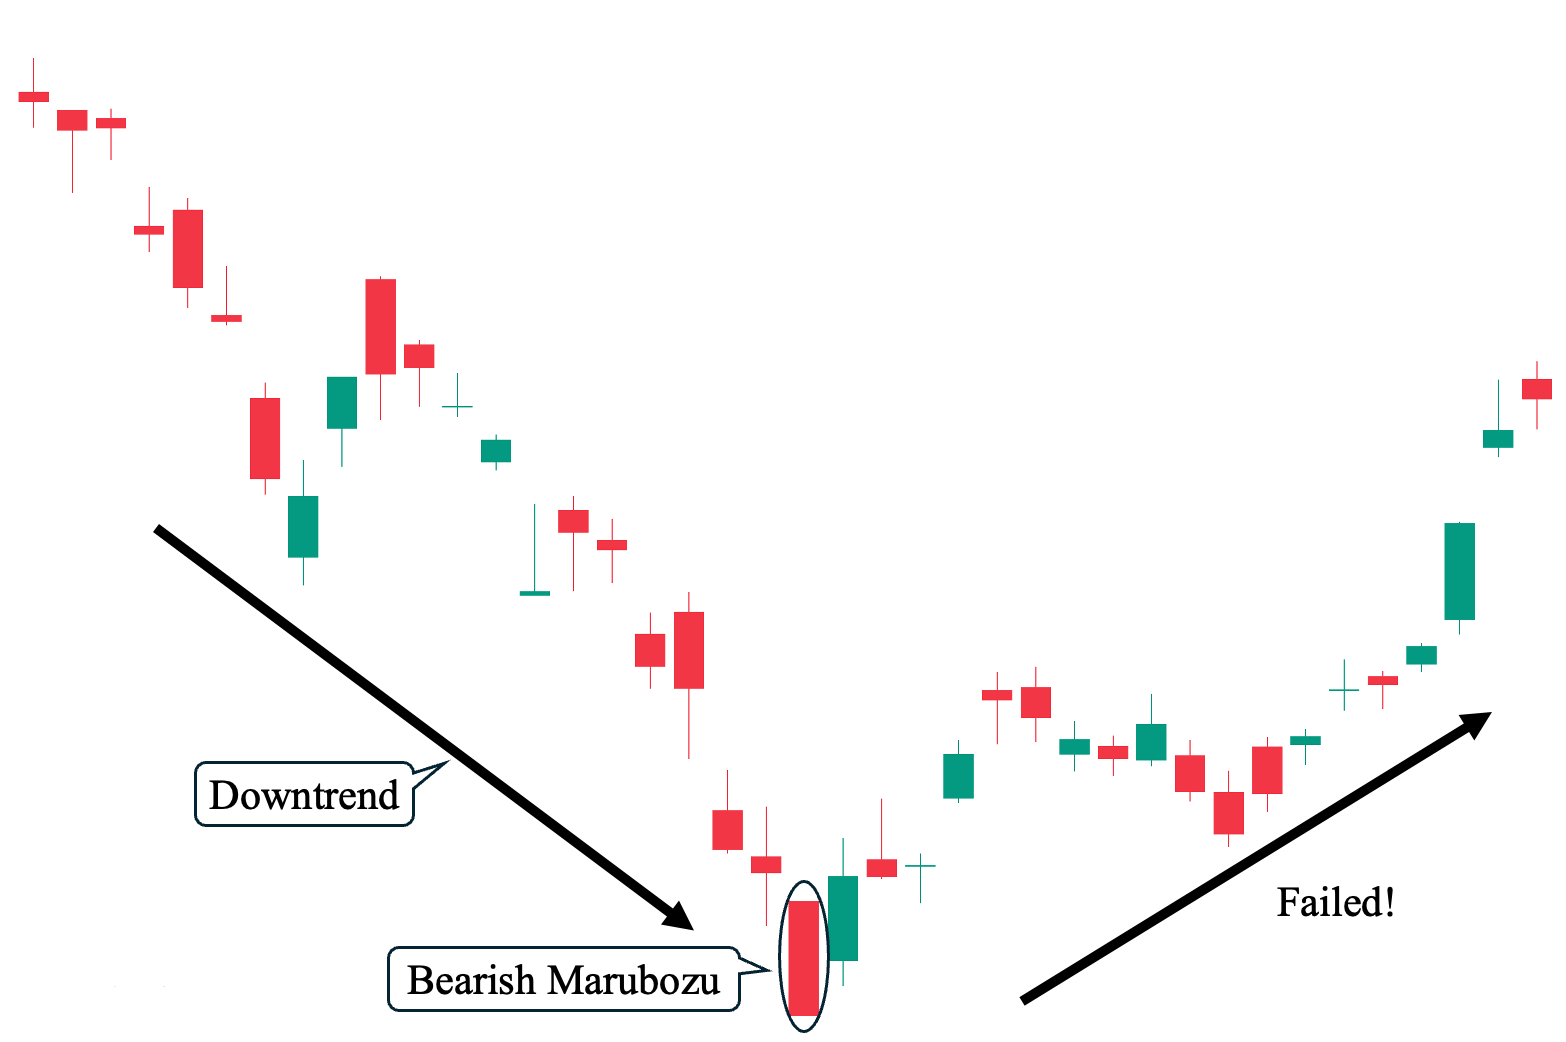
In contrast to our third example, despite the bearish marubozu also being preceded by a downtrend—a steep one at that—the candlestick pattern failed to lead to the expected continued price drop. Instead, it was followed by a trend reversal to the upside. This example again illustrates that the marubozu candle is not 100% reliable (just like any other candlestick formation, technical analysis tool, or other indicators), particularly when used on its own without other indicators, to make more informed trading decisions and ultimately guide your overall trading strategy.
Example #5: Sideways or Non-Trending Market
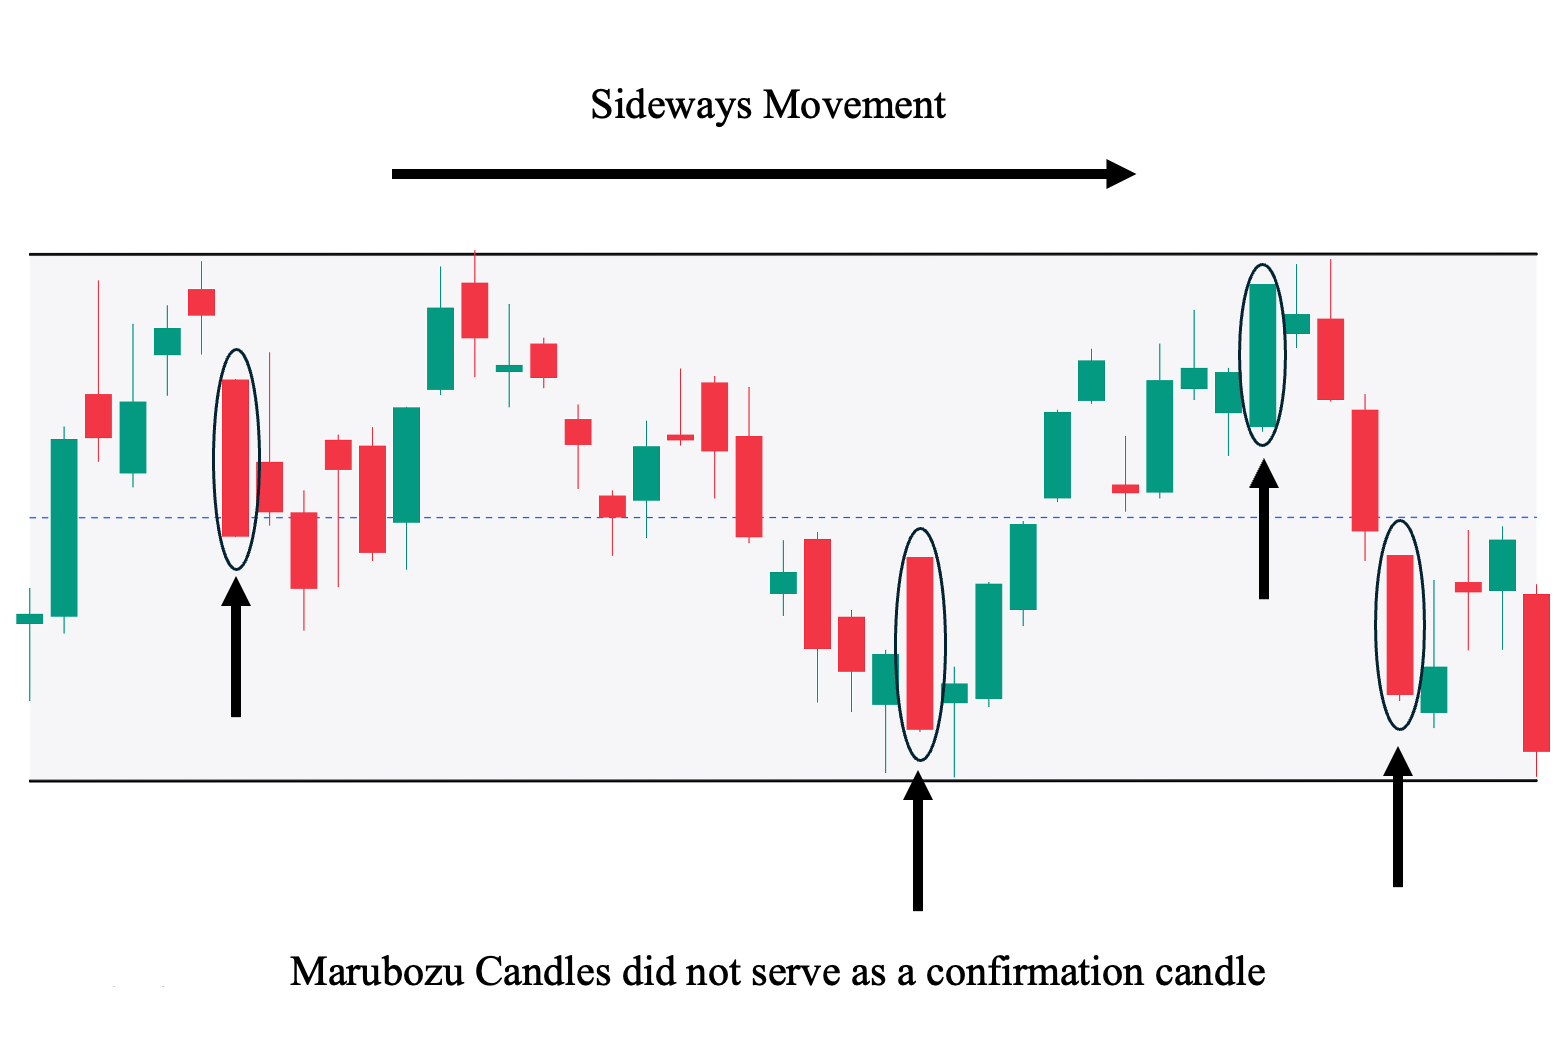
Finally, let’s observe how frequently marubozu candles can appear in a sideways or non-trending market, while simultaneously losing their functionality of confirming a trend. Marubozu candles are most effective when used in a trending market—whether in an uptrend or downtrend—where they can serve as a trend confirmation tool. However, in a sideways-moving market, this becomes an issue, as the overall sentiment is indecisive and unclear, leading to price moving aimlessly.
The only time a marubozu candle can be effective in a sideways-moving market is when it triggers a price breakout (when price closes above the “structural resistance,” similar to the upper horizontal black line in the illustration that prevents the price from rising) or a price breakdown (when price closes below the “structural support,” similar to the lower horizontal black line in the illustration that prevents the price from falling further).
Marubozu Candlestick Pattern Trading Strategies
Here are ten distinct ways you can incorporate bullish and bearish marubozu candles into different trading strategies:
1. High Volume
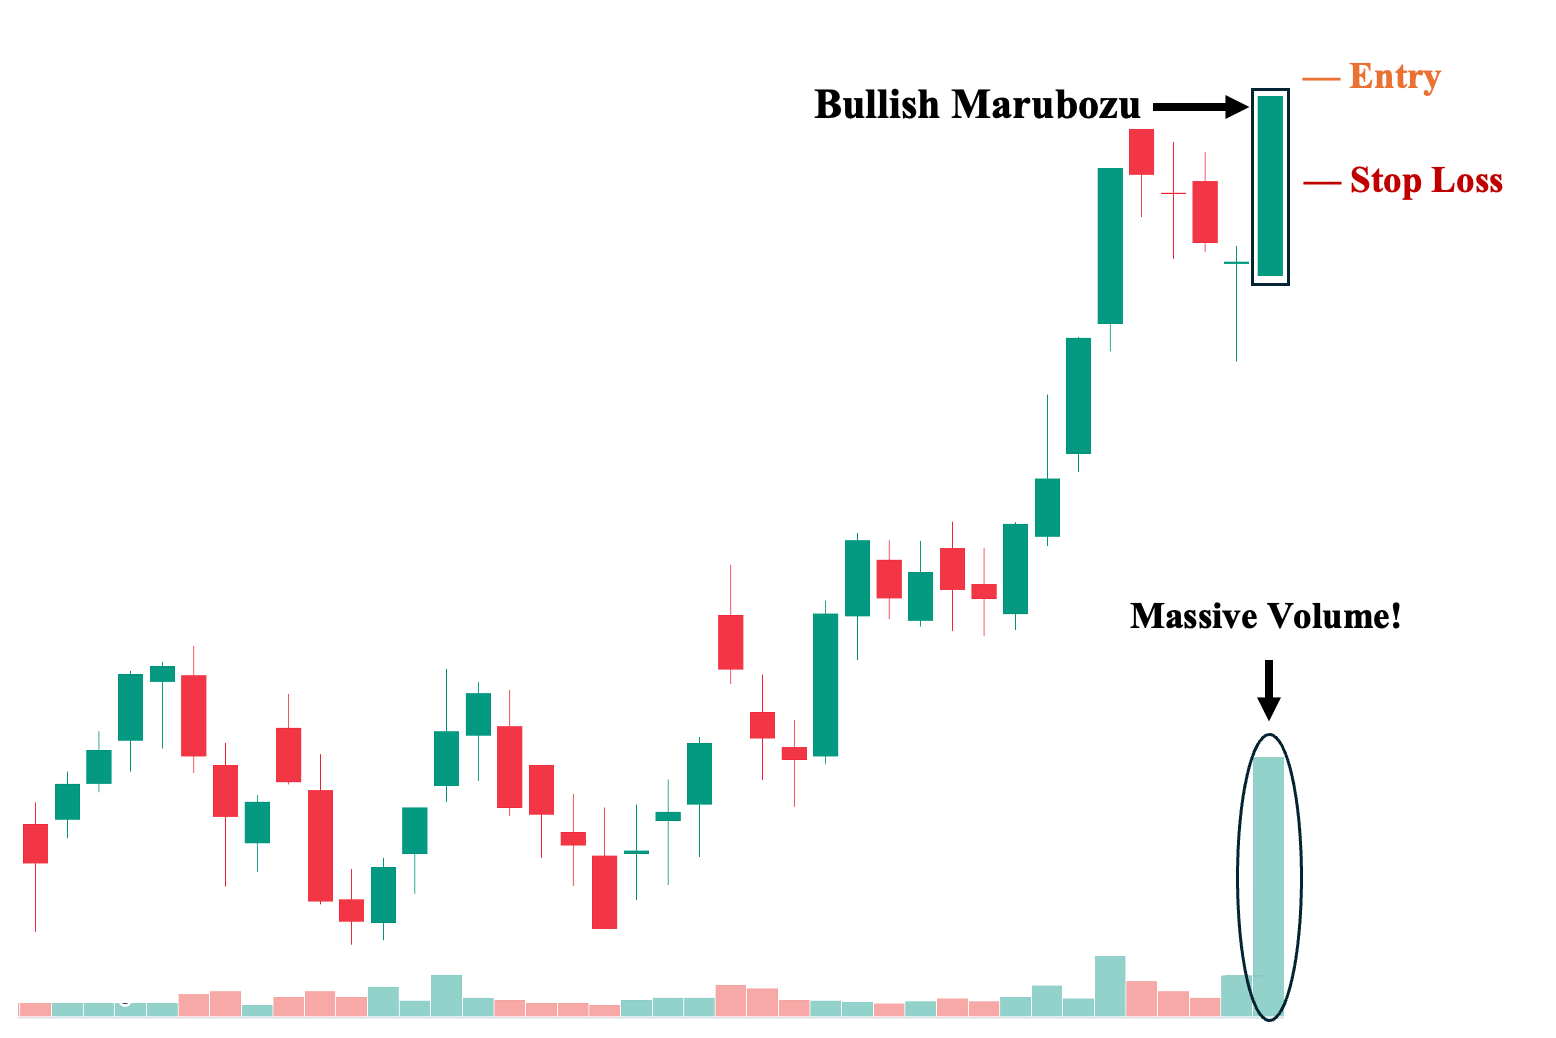
First, you can supplement the marubozu candlestick with volume analysis to gauge the likelihood of a successful confirmation signal. Ideally, you want to see substantial volume (at least twice the average daily volume, the higher the better) on the trading session where the marubozu candle appears. Why? Because marubozu candles are supposed to indicate overwhelming buying or selling pressure. Therefore, significantly high volume supports the decisive price movement in one direction. Furthermore, in the next section, we will explain how market makers can manipulate a trading session to create the appearance of a marubozu formation and discuss how you can avoid falling into this pitfall by simply observing the volume traded.
- Suggested Entry: A few ticks above the bullish marubozu’s close.
- Take Profit (TP) Level: Once the pattern has been successful and an upward move commences, set your first TP a few ticks below the nearest structural resistance area.
- Stop Loss Level: A few ticks below the upper half (50%) of the marubozu’s body, as this can invalidate the bullish setup. Note that setting your stop loss much lower can expose you to substantially more risk.
- Risk-Reward Ratio: At least 1:1. We strongly recommend not taking trades with a risk/reward ratio lower than 1:1 with marubozu set-ups. Of course, the higher the potential reward compared to risk, the better. Just ensure that you have an objective approach to identifying your TP and SL levels, such as basing it on key structural price levels.
2. Break of Resistance/Support
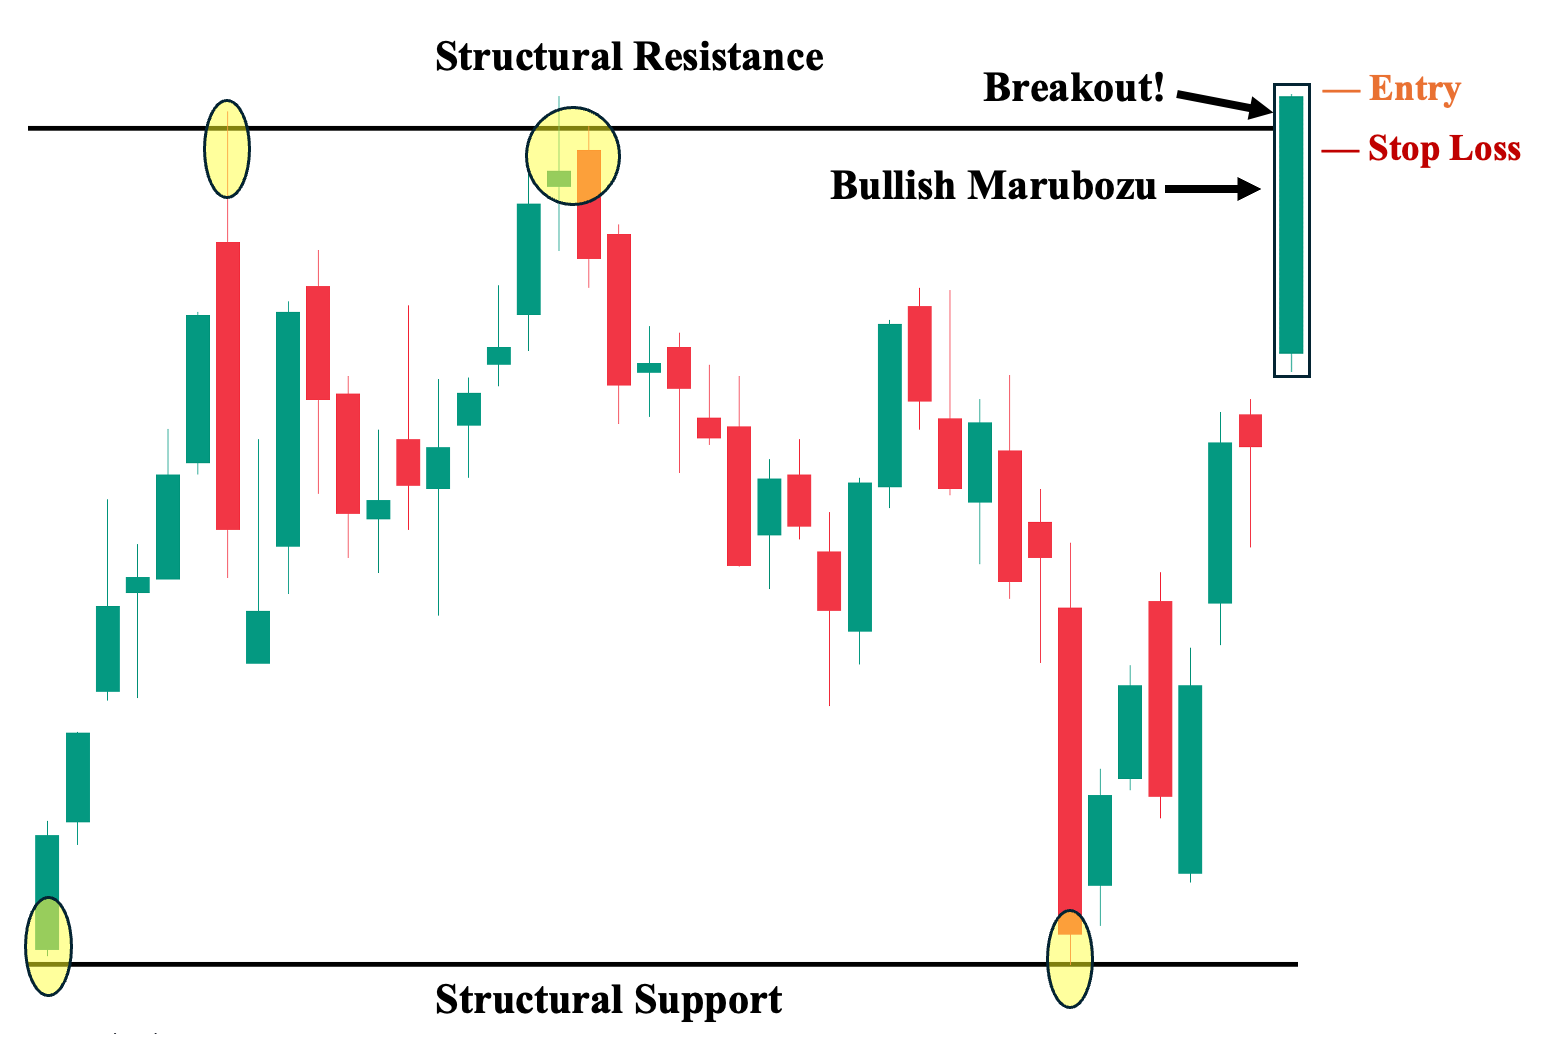
Second, as we mentioned in the fifth example from the earlier section, a marubozu candle can be significant during a sideways movement if it manages to close either above the structural resistance level (bullish marubozu) or below the structural support level (bearish marubozu). This can lead to a potential breakout or breakdown, shifting the market from a sideways movement into a trending state. Furthermore, a breakout or breakdown triggered by a marubozu candle can be particularly significant, as it illustrates how decisive the price movement was—strong enough to break through a key price level that the asset had previously struggled to overcome.
- Suggested Entry: A few ticks above the bullish marubozu’s close.
- Take Profit (TP) Level: Once the pattern is successful and the price rallies, set your first TP a few ticks below the nearest structural resistance area.
- Stop Loss Level: A few ticks below the previous structural resistance. This is because, in a breakout, the previous major resistance becomes a key support level. If the price closes below this structure, it essentially invalidates the setup and turns the breakout into a “fakeout” or fake breakout.
- Risk-Reward Ratio: Aim for at least a 1:1 ratio. We strongly recommend not taking trades with a risk/reward ratio lower than 1:1 in marubozu setups. The higher the potential reward compared to the risk, the better. However, ensure you have an objective approach to identifying your TP and SL levels, such as basing them on key structural price levels.
3. Bearish Marubozu, Trend & 50 EMA
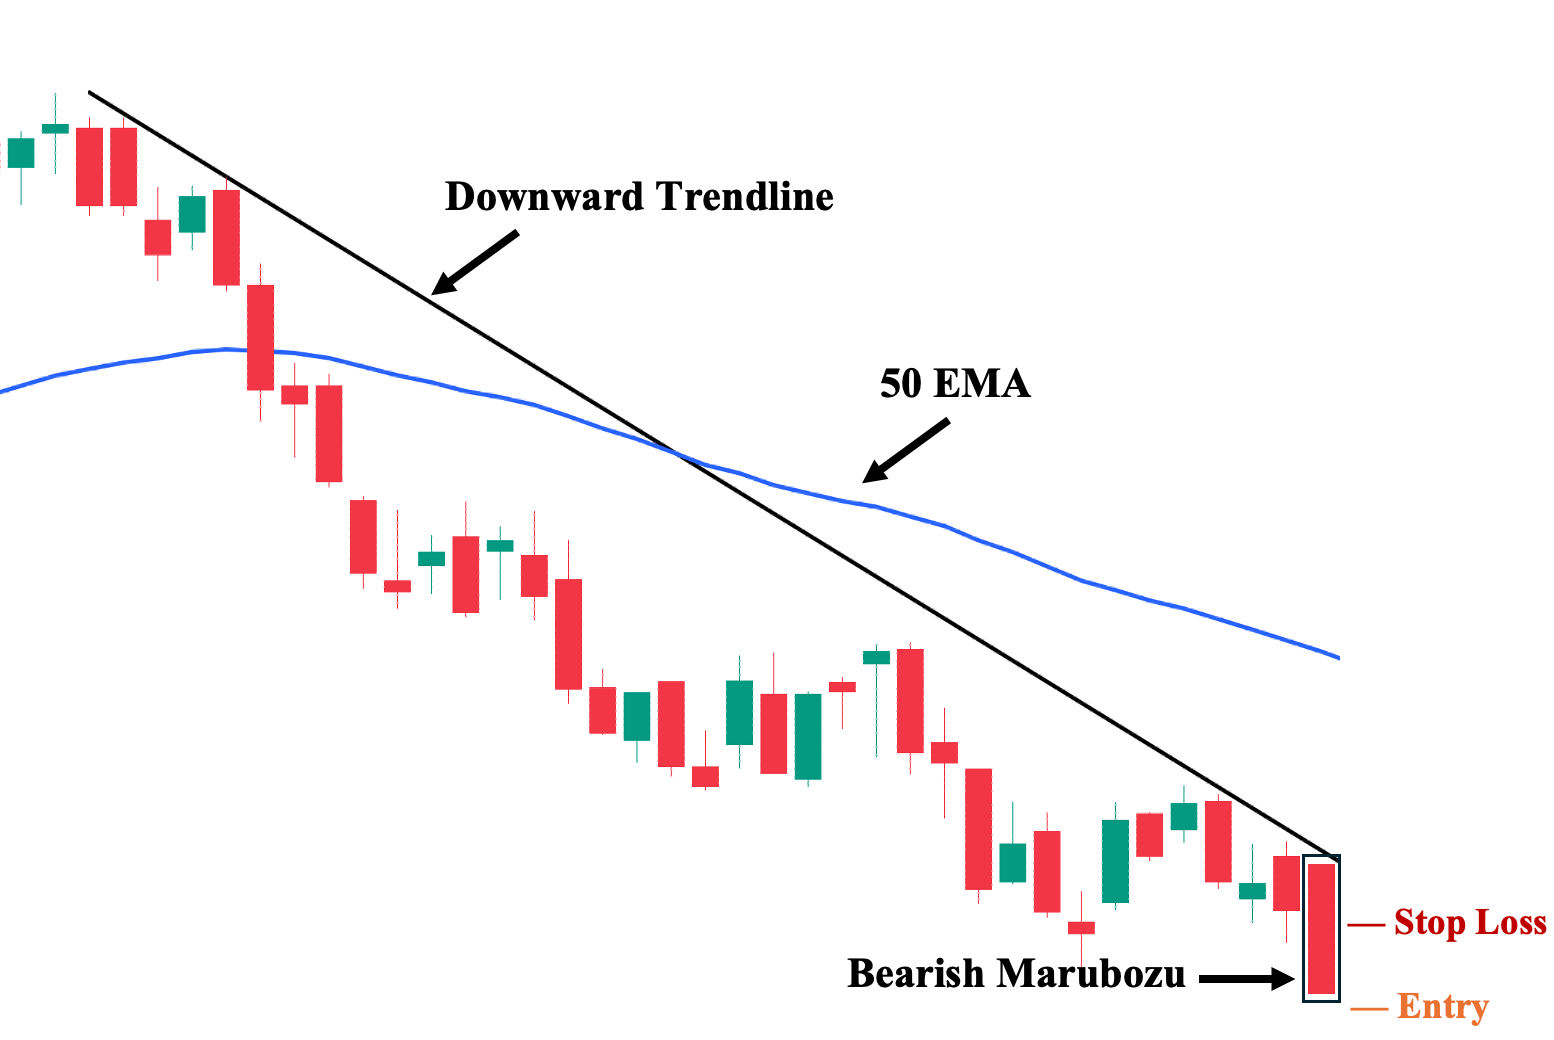
Third, to guide your trading decisions, you can combine a trendline (serving as static support or resistance) with a moving average (serving as dynamic support or resistance) to enhance the effectiveness of the marubozu candle pattern. For instance, as shown in the illustration, a downward trendline serves as definitive resistance that the price must not close above if the bearish marubozu is to materialize. Meanwhile, our chosen moving average, the 50 exponential moving average (EMA), provides a viable trailing stop moving forward.
- Suggested Entry: A few ticks below the bearish marubozu’s closing price.
- Take Profit (TP) Level: Once the pattern is successful and the price rallies, set your first TP a few ticks above the nearest structural support area. Pay close attention to ensure the price does not break the downward trendline, as that may indicate a potential breakout. Additionally, the price must remain below the 50 EMA, which you can use as a valid trailing stop.
- Stop Loss Level: Set your stop loss a few ticks above the upper half (50%) of the marubozu’s body, as this can invalidate the bearish setup. Note that setting your stop loss much higher could expose you to significantly more risk.
- Risk-Reward Ratio: Aim for at least a 1:1 ratio. We strongly recommend not taking trades with a risk/reward ratio lower than 1:1 in marubozu setups. The higher the potential reward compared to the risk, the better. However, ensure you have an objective approach to identifying your TP and SL levels, such as basing them on key structural price levels.
4. Bullish Marubozu with Guppy Multiple Moving Average (GMMA)
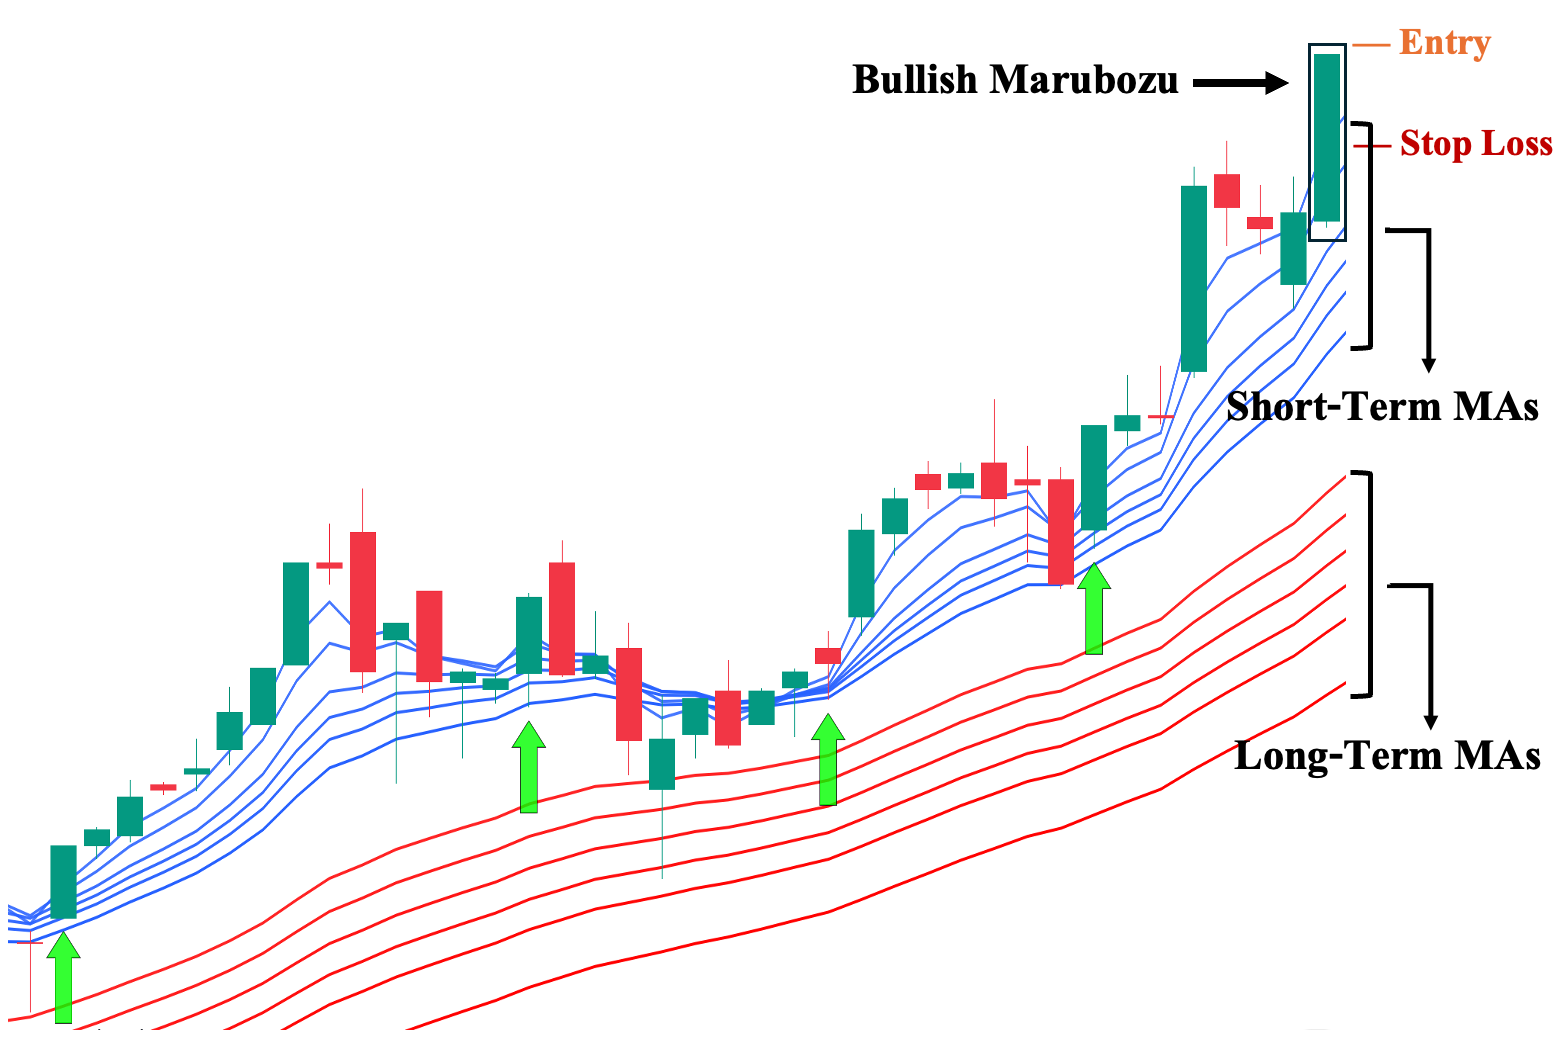
Fourth, you can also use one of the more unique technical indicators, the GMMA, to guide your trading decisions. Simply put, this indicator uses multiple moving averages that are divided into two sections: the Short-Term MAs and the Long-Term MAs. The short-term MAs (usually in red) reflect the latest market sentiment and represent the shorter-paced attitude of retail traders. In contrast, the long-term MAs (usually in blue) reflect the overall market sentiment regarding the asset and represent the longer-paced buy-and-hold approach of long-term investors.
- Suggested Entry: A few ticks above the bullish marubozu’s close.
- Take Profit (TP) Level: Once the pattern is successful and the price rallies, set your first TP a few ticks below the nearest structural resistance area. Pay attention to the short-term moving averages (MAs), ensuring that no single MA crosses above the asset’s price. You can also use these lines as your trailing stop moving forward. Additionally, make sure the long-term MAs do not cross over the short-term MAs; if they do, it could indicate that the strong bullish sentiment is weakening.
- Stop Loss Level: Set your stop loss a few ticks below the upper half (50%) of the marubozu’s body, as this can invalidate the bullish setup. Note that setting your stop loss much lower can expose you to substantially more risk.
- Risk-Reward Ratio: Aim for at least a 1:1 ratio. We strongly recommend not taking trades with a risk/reward ratio lower than 1:1 in marubozu setups. The higher the potential reward compared to the risk, the better. However, ensure you have an objective approach to identifying your TP and SL levels, such as basing them on key structural price levels
5. Bearish Marubozu with Bearish Pin Bar Patterns
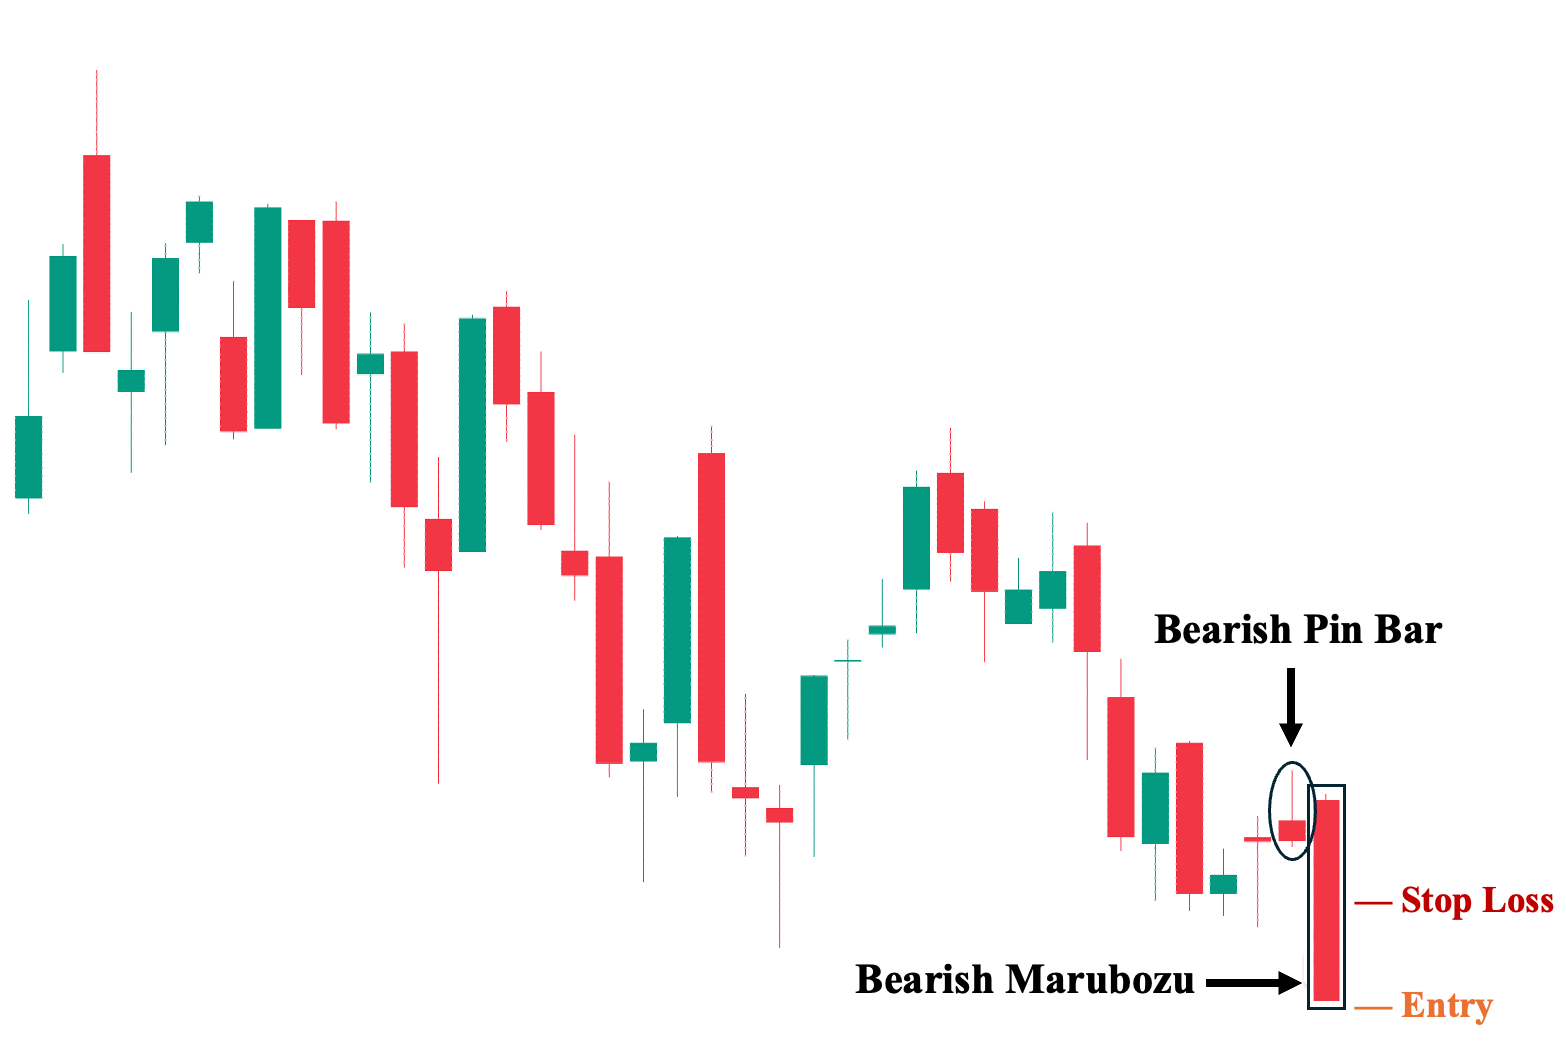
Fifth, arguably a much stronger continuation pattern than a standalone marubozu candle is the combination of a bearish pin bar, which signifies a rejection of higher prices, followed by a bearish marubozu candle, signaling renewed selling pressure. These two one-candlestick patterns complement each other to reflect a decisive bearish sentiment. Nevertheless, note that this setup is relatively difficult to come by.
- Suggested Entry: A few ticks below the bearish marubozu’s close.
- Take Profit (TP) Level: Once the pattern is successful and the price rallies down, set your first TP a few ticks just above the nearest structural support area.
- Stop Loss Level: Set your stop loss a few ticks above the upper half (50%) of the marubozu’s body, as this can invalidate the bearish setup. Note that setting your stop loss much higher could expose you to significantly more risk.
- Risk-Reward Ratio: Aim for at least a 1:1 ratio. We strongly recommend not taking trades with a risk/reward ratio lower than 1:1 in marubozu setups. The higher the potential reward compared to the risk, the better. However, ensure you have an objective approach to identifying your TP and SL levels, such as basing them on key structural price levels.
6. Marubozu Candlestick with Moving Averages
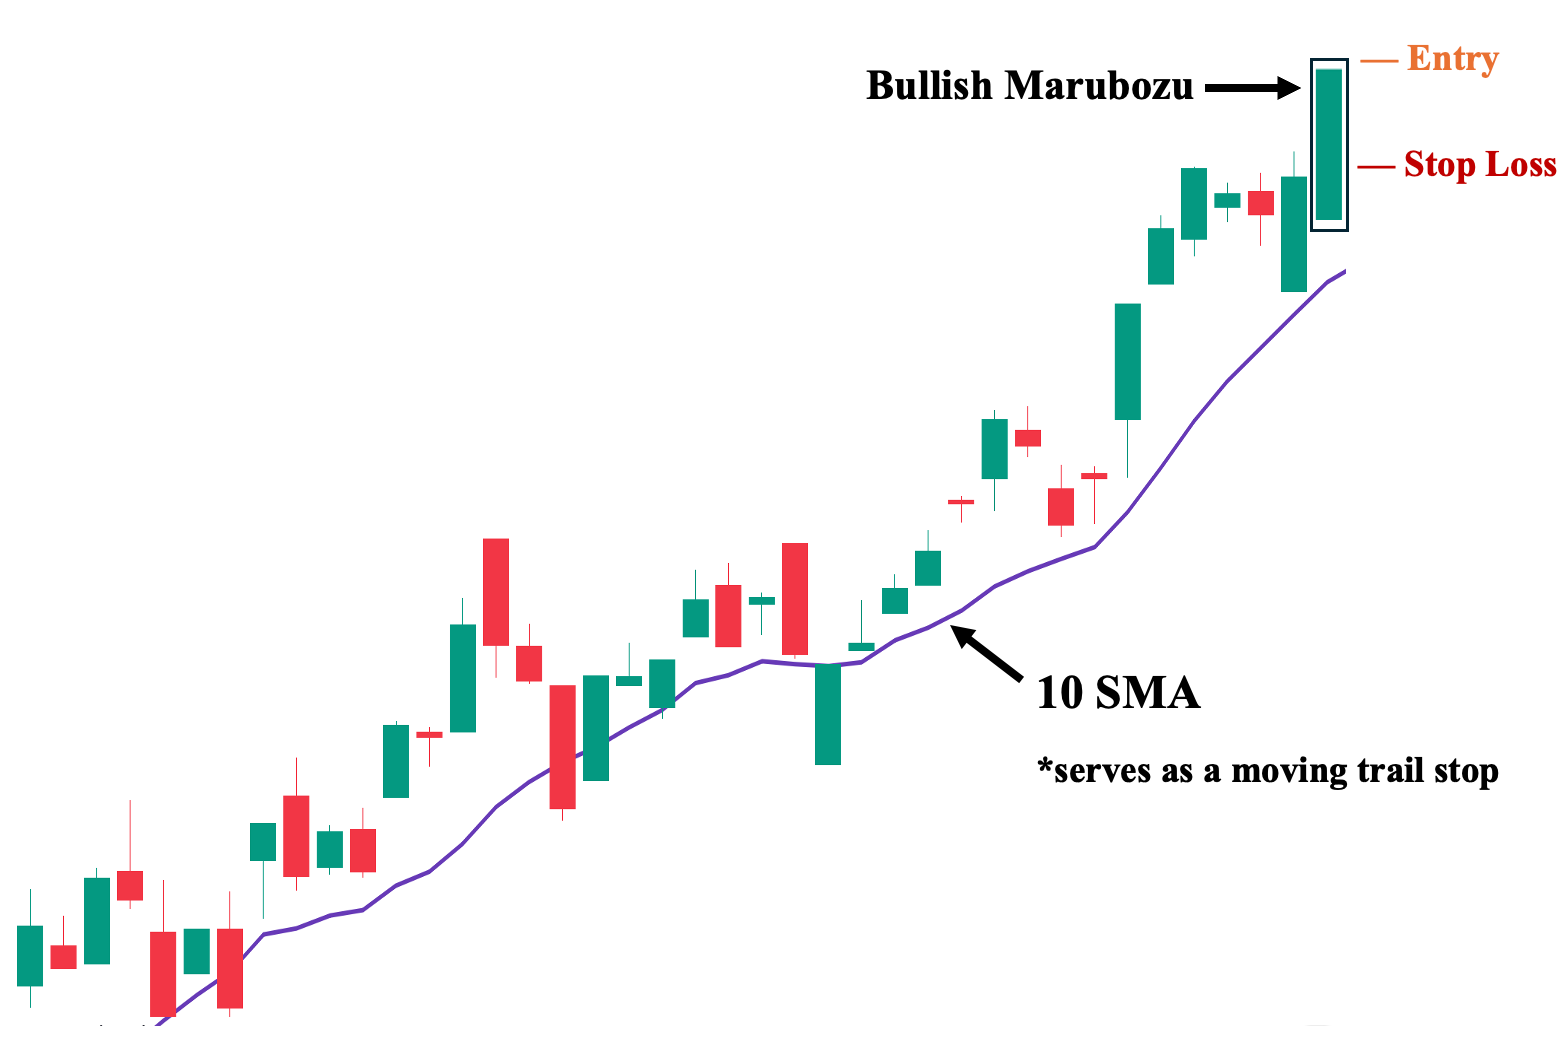
Sixth, the foundation of the majority of indicators in this list, and many other technical indicators, is the simple moving average. Despite its simplicity, the moving average can still serve a crucial role as a go-to supplemental technical analysis tool for trend confirmation. For example, in our case, we chose a short-term MA, the 10 SMA, to serve as a dynamic nearest support and, at the same time, as a trailing stop. This versatility makes moving averages one of the most crucial technical indicators to use alongside candlestick patterns.
- Suggested Entry: A few ticks above the bullish marubozu’s close.
- Take Profit (TP) Level: Once the pattern is successful and the price rallies, set your first TP a few ticks below the nearest structural resistance area. Then, use the 10 SMA as a trail stop moving forward
- Stop Loss Level: Set your stop loss a few ticks below the upper half (50%) of the marubozu’s body, as this can invalidate the bullish setup. Note that setting your stop loss much lower can expose you to substantially more risk.
- Risk-Reward Ratio: At least 1:1. We strongly recommend not taking trades with a risk/reward ratio lower than 1:1 with marubozu set-ups. Of course, the higher the potential reward compared to risk, the better. Just ensure that you have an objective approach to identifying your TP and SL levels, such as basing it on key structural price levels.
7. Marubozu Candlestick with MACD
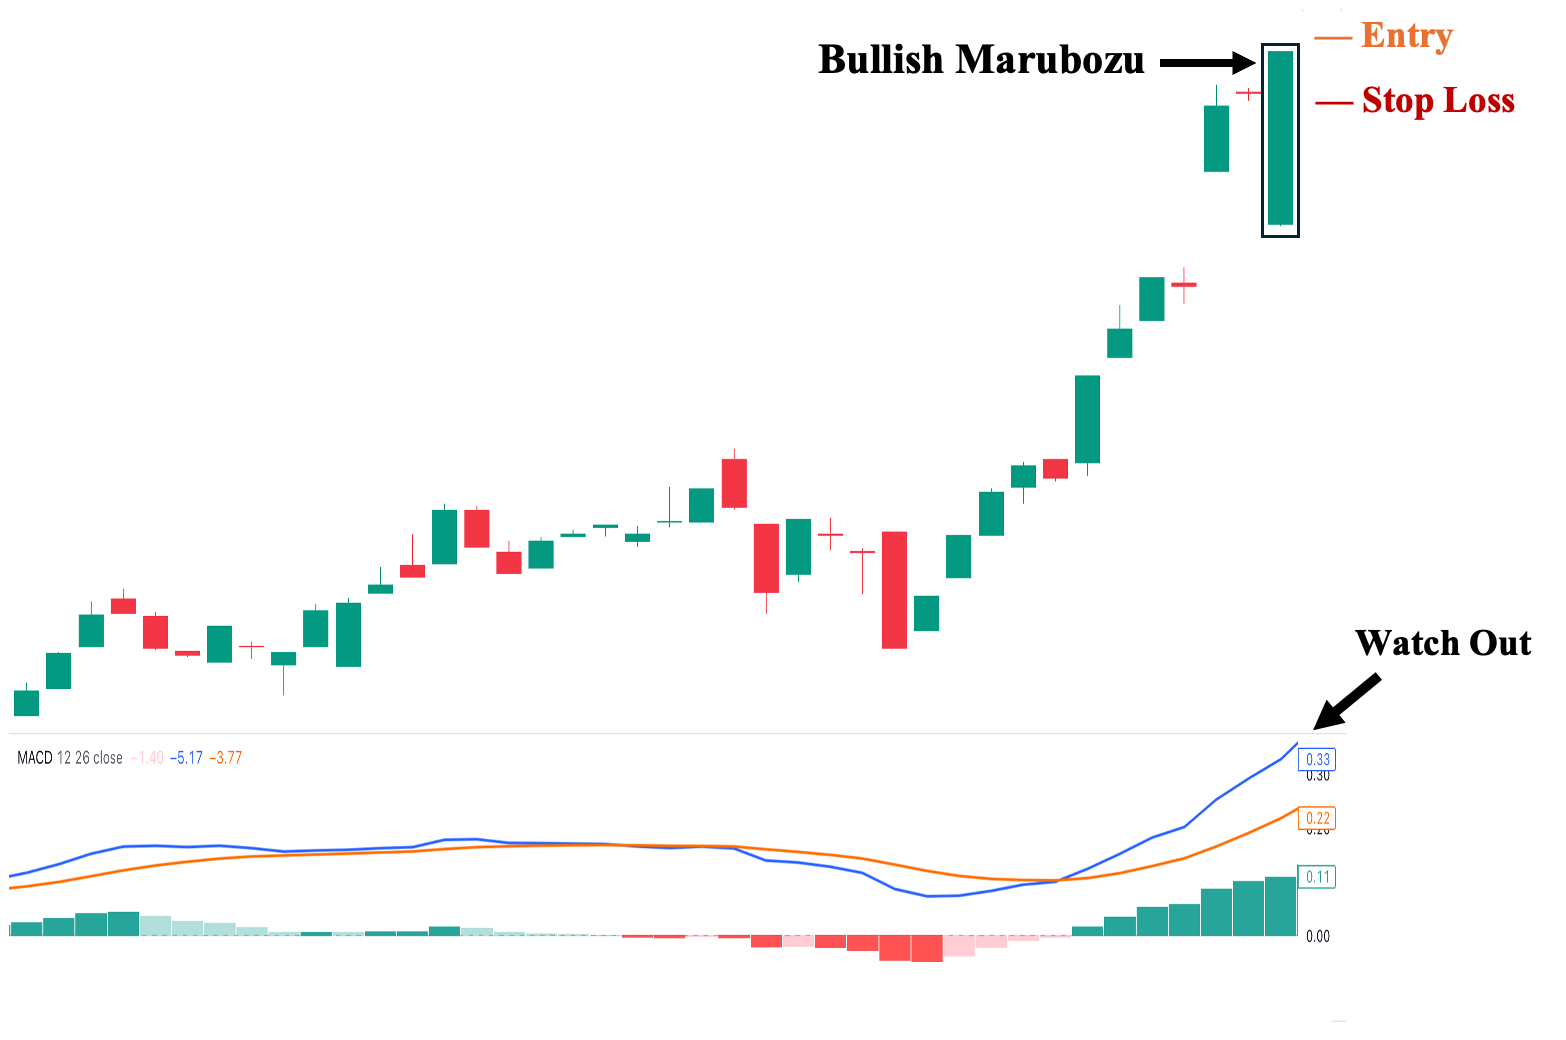
Seventh, among other technical indicators, MACD stands out as one of our favorite technical analysis tools. As you can observe, there are two lines: the blue line, known as the MACD line, and the orange line, referred to as the signal line. In general, it is a bullish signal when the blue line is above the orange line, and vice versa for a bearish signal. As shown above, the bullish marubozu is supported by a bullish crossover, where we observe a wide separation between the two lines. In this scenario, the wider the separation, the more bullish the overall sentiment.
- Suggested Entry: A few ticks above the bullish marubozu’s close.
- Take Profit (TP) Level: Once the pattern is successful and the price rallies, set your first TP a few ticks below the nearest structural resistance area. Then, utilize the MACD as a trailing stop (be ready to sell when a crossover occurs).
- Stop Loss Level: Set your stop loss a few ticks below the upper half (50%) of the marubozu’s body, as this can invalidate the bullish setup. Note that setting your stop loss much lower can expose you to substantially more risk.
- Risk-Reward Ratio: At least 1:1. We strongly recommend not taking trades with a risk/reward ratio lower than 1:1 with marubozu set-ups. Of course, the higher the potential reward compared to risk, the better. Just ensure that you have an objective approach to identifying your TP and SL levels, such as basing it on key structural price levels.
8. Marubozu Candlestick with RSI
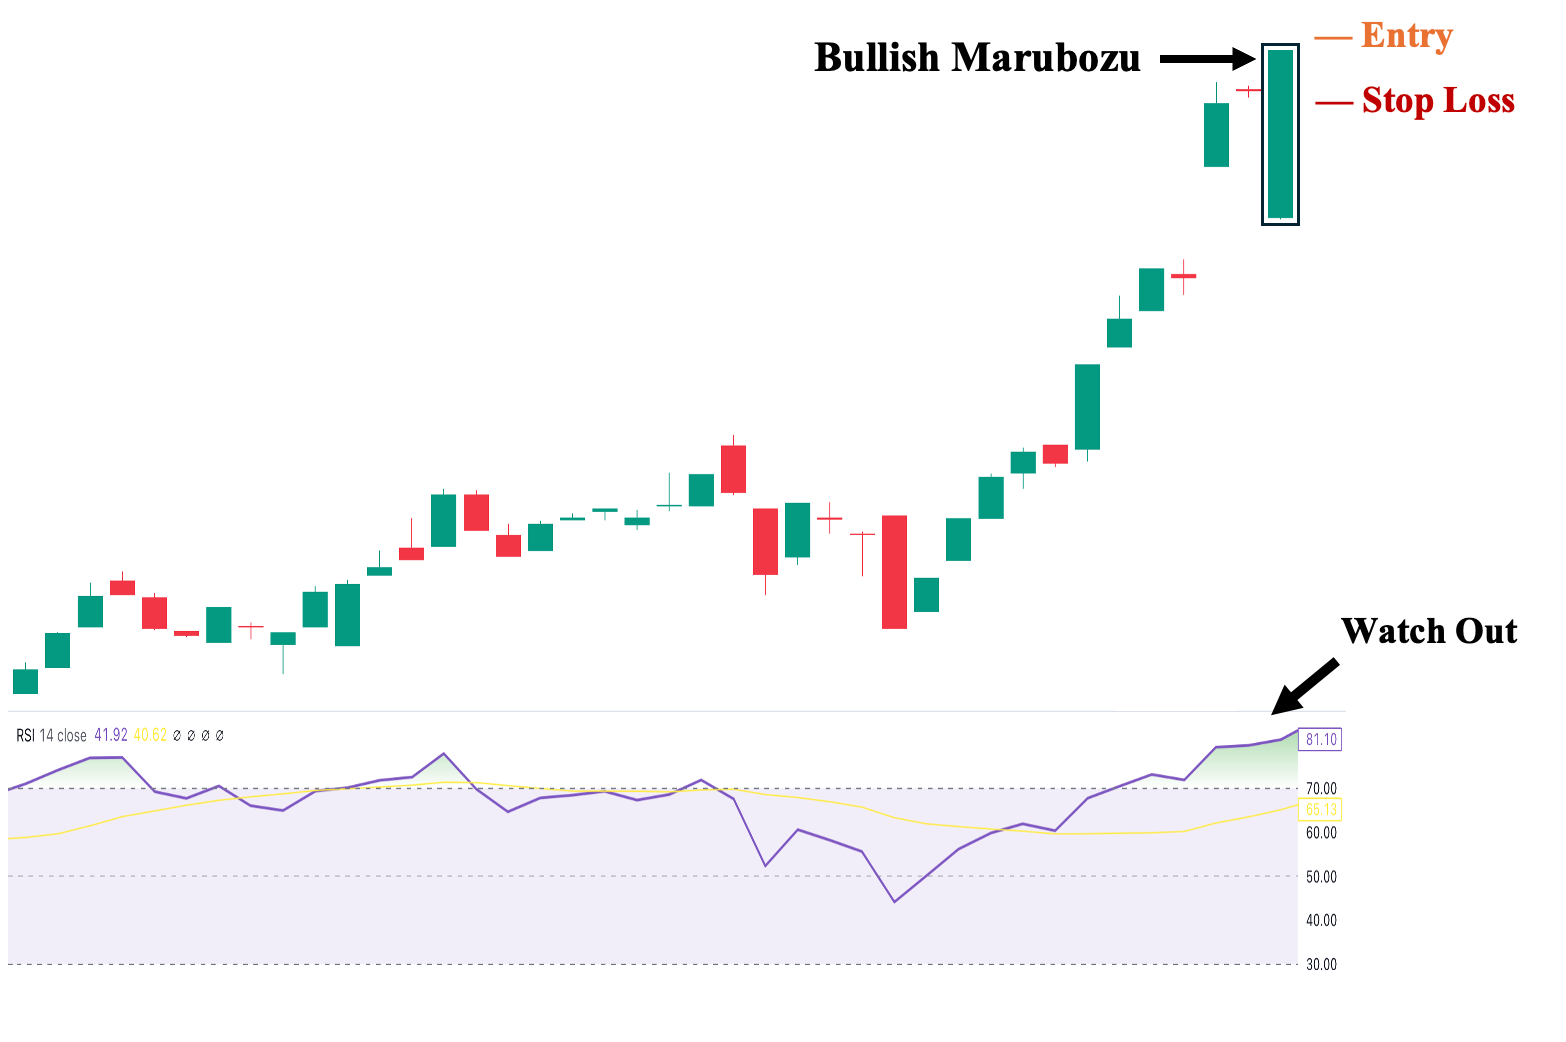
Lastly, unlike other technical indicators, we prefer to use Relative Strength Index (RSI) primarily for its leading nature during a ‘divergence.’ Essentially, this occurs when the price and RSI move in opposite directions. For example, suppose the price continues to rise following a successful bullish marubozu candle, but then the RSI suddenly starts to point downward. This would be a case of divergence. Here, RSI acts as the leading indicator, suggesting that the price will likely follow suit, in which case, we should consider selling our position.
- Suggested Entry: A few ticks above the bullish marubozu’s close.
- Take Profit (TP) Level: Once the pattern is successful and the price rallies, set your first TP a few ticks below the nearest structural resistance area. Then, use the RSI as a trailing stop by selling when it diverges from price action—the price is going up, but the RSI is already pointing downward and vice versa.
- Stop Loss Level: Set your stop loss a few ticks below the upper half (50%) of the marubozu’s body, as this can invalidate the bullish setup. Note that setting your stop loss much lower can expose you to substantially more risk.
- Risk-Reward Ratio: At least 1:1. We strongly recommend not taking trades with a risk/reward ratio lower than 1:1 with marubozu set-ups. Of course, the higher the potential reward compared to risk, the better. Just ensure that you have an objective approach to identifying your TP and SL levels, such as basing it on key structural price levels.
Marubozu Candlestick vs. Engulfing Candlestick
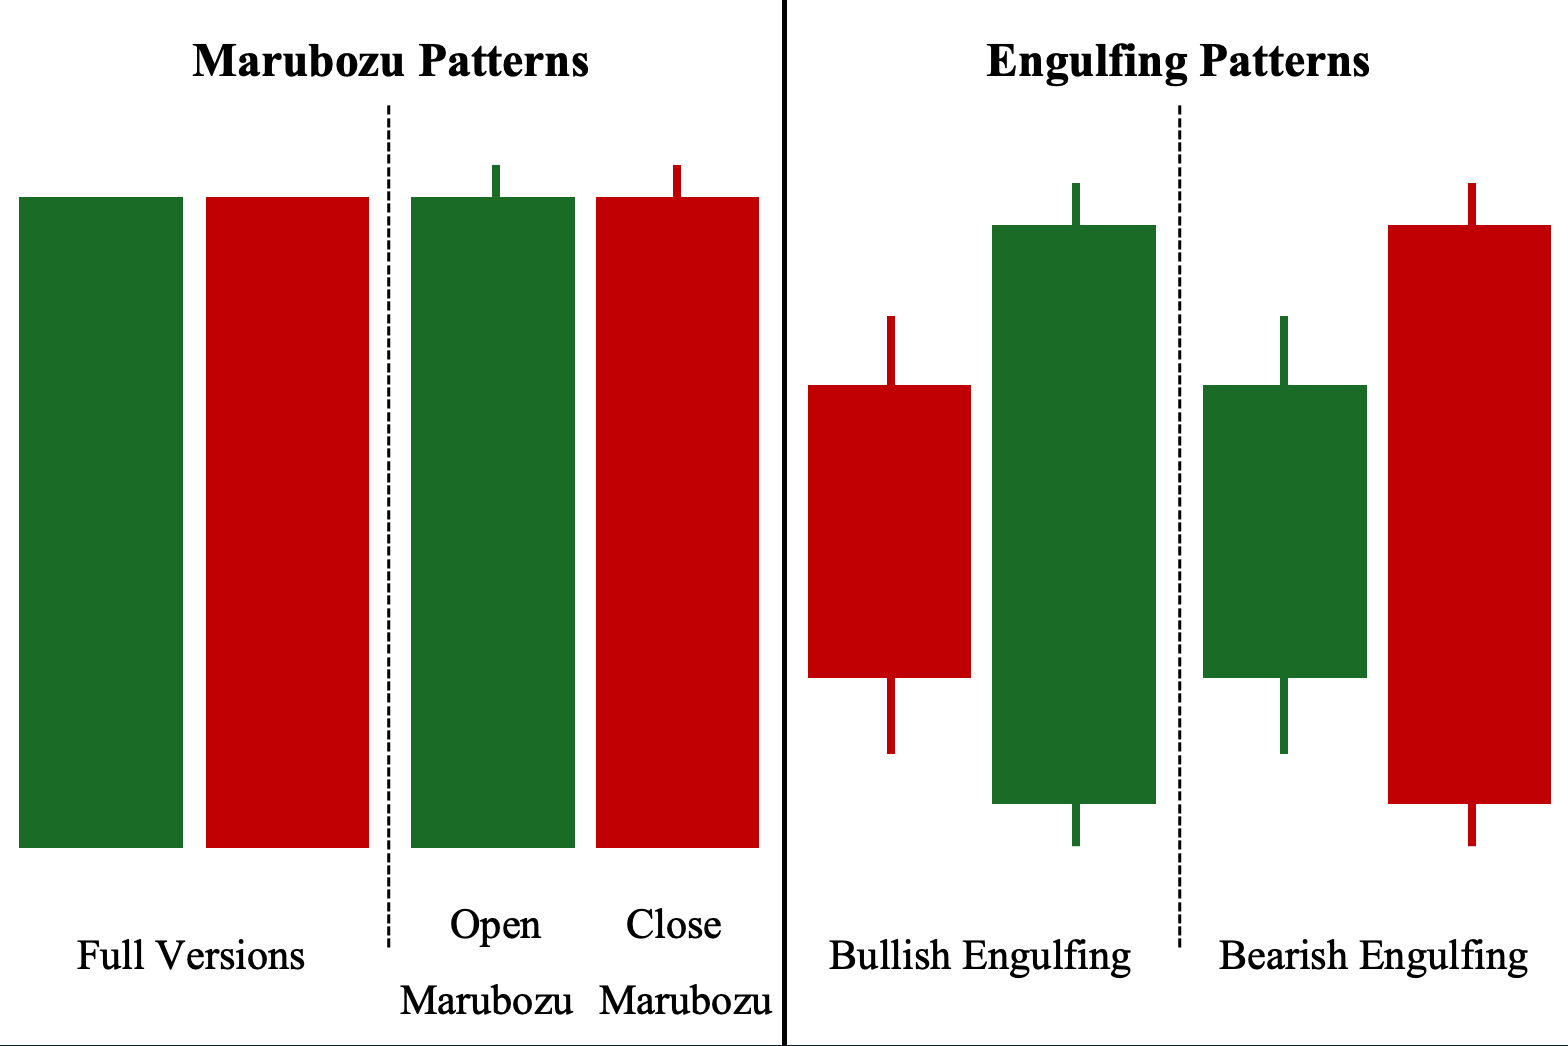
Unlike the marubozu pattern, which is a one-candlestick pattern, engulfing patterns are two-candlestick formations. They consist of a smaller first candle followed by a much larger opposite-colored second candle that ‘engulfs’ or covers the first candlestick’s body and wick. Thus, the directional bias follows the color of the second candle: if the second candle is green, it forms a bullish engulfing pattern, and if the second candle is red, it forms a bearish engulfing pattern.
Advantages of Trading on the Marubozu Candlestick Pattern
Here are three pressing advantages of incorporating the marubozu candle in your trading analysis:
1. Provides Clear Directional Signal
First, perhaps the most evident advantage of utilizing the marubozu candle is its simplicity. A white or green marubozu pattern is a bullish candle that serves as a confirmation signal during an uptrend, indicating that the price will likely continue rising. Likewise, a red or black marubozu candle serves as a confirmation signal during a downtrend, indicating that the price will likely continue dropping. These clear confirmation signals help technical traders position their trades according to the marubozu pattern.
2. Filters Market Noise
Second, unlike other candlestick patterns—which can be more ambiguous in nature—marubozu patterns reveal the actual market sentiment bias at that specific point in time. Bullish marubozu patterns clearly imply a continued upward price movement, while bearish marubozu patterns unequivocally point toward a continued downward momentum. This eliminates uncertainty about market sentiment, as the mere existence of marubozu patterns tells us that the asset is moving decisively in one direction.
3. Good Gauge of Momentum Strength
Third, marubozu candles display the momentum strength of a bullish or bearish trend. In fact, bullish and bearish marubozu candles not only support the ongoing trend in which they appear but also signify potential upside or downside opportunities for traders to take advantage of. This is especially important for medium to long-term trending assets where it can be difficult to gauge the momentum for further upside or downside. When a marubozu candle appears, it solidifies that the trend’s momentum remains intact. Hence, we can expect further upward movement in the case of an uptrend or further downward movement in the case of a downtrend.
Disadvantages of Trading on the Marubozu Candlestick Pattern
Here are three crucial disadvantages of including the marubozu candle in your trading analysis:
1. May Not Provide Optimal Entry
First, the marubozu candlestick patterns—both bullish marubozu and bearish marubozu candles—may not provide an ideal entry on a trade. This is because of the very nature of the candlestick pattern, where the price moves significantly in one direction within a single trading session. For example, if a bullish marubozu candle appears in an uptrend—confirming the likely continuation of the upward trajectory—it may close at an awkward price level where it is nearer to the next resistance level, where you would likely put your target price versus the nearest support level where you can put your cut loss point. Consequently, this results in a skewed risk-reward ratio, where you stand to lose more when the price moves downward than you are to gain when the price moves higher.
2. Risky in Parabolic Moves
Second, marubozu candlestick patterns frequently occur during parabolic moves, where market volatility is extremely high, and market sentiment shows overwhelming bullish or bearish momentum. This results in the asset’s price moving intensely in one direction within a short period of time, making the pattern riskier to rely on. For example, suppose you spot a bullish marubozu candlestick pattern in an uptrend that has been making consistent and substantial upward price moves, and you decide to buy. Well, unfortunately, these massive upward price movements are known as parabolic moves, and you may be taking on much higher risk than desired. Why? Because when market volatility is high, a sudden shift in overall sentiment can cause the price to drop significantly in a single day, potentially erasing the cumulative price increases made from previous trading sessions.
To illustrate, suppose a stock’s price was $10, and over the course of three trading session—which are likely composed of three bullish marubozu candles—it rose to $15, representing a 50% cumulative increase. If, after these three continuous increases driven by enormous bullish momentum, the general investor sentiment suddenly shifts and, driven by high market volatility, the stock price declines by 30% in one session, the stock price would drop from $15 to $10.50. Hence, a 50% price increase can be practically erased by a single 30% price decline.
3. Potential for Market Manipulation
Third, a bullish or bearish marubozu candle can also be created artificially to mislead retail traders. This can occur in assets with clear bullish or bearish trends (i.e., uptrend or downtrend) but with relatively low average volume. Therefore, it’s much easier to push the price decisively in the same direction and create a marubozu candle. Since this pattern suggests that the trend will likely continue, it may lead many retail traders to place an order accordingly, creating a demand (in the case of a bullish marubozu pattern) and a supply (in the case of a bearish marubozu candle). Market makers, such as institutional investors, can take advantage of this by silently dumping their shares during a buying frenzy after a bullish marubozu appears in an upward trend or by accumulating shares at a much cheaper price after a bearish marubozu pattern in a downward trend.
Pro Tip: To avoid this, we recommend always checking the volume when a marubozu candle appears. Ideally, you want to see a significantly higher volume compared to the asset’s average volume when a marubozu candle forms. A Marubozu candle is supposed to signify strong buying or selling pressure. Without this significant volume, the marubozu candle may just be artificially created during a low-volume period for that specific asset.
Frequently Asked Questions (FAQs)
The following are some of the most asked questions regarding the Marubozu candlestick pattern:
Who first identified the marubozu candlestick pattern?
The marubozu pattern is one of the candlestick patterns included in Munehisa Homma’s 1755 publication, The Fountain of Gold—The Three Monkey Record of Money. Homma was a prominent rice merchant from Japan, widely credited as one of the early innovators of technical analysis. He identified many of the known candlestick patterns, including the marubozu, which means ‘close-cropped head’ or ‘bald hill’ in Japanese.
What happens after a marubozu candle?
A marubozu candle is widely considered a confirmation candle. Hence, a bullish marubozu candle validates a strong market trend in an uptrend and signifies continued upward price movement. Likewise, a bearish marubozu candle in a downward trend implies that a continued declining price movement will likely follow. That said, you cannot be 100% certain of the outcome after a marubozu candle occurs, even if you have technical indicators or tools supporting it. Remember that in trading, we deal in terms of probability, not certainty. Hence, we cannot guarantee future results.
How reliable is the marubozu candlestick pattern?
In technical analysis, the marubozu candlestick pattern is widely considered relatively reliable as a continuation signal compared to other candlestick patterns. This is because it is perhaps the most decisive single candlestick pattern, showing how one party—the sellers in a bearish marubozu candlestick and the buyers in a bullish marubozu candlestick—is predominantly or completely in control of price action. Hence, this bullish or bearish sentiment will likely continue in the next candle.
Is the marubozu candlestick pattern bullish or bearish?
It depends. Unlike other candlestick patterns with a clear directional bias, a marubozu candle is classified as either a bullish marubozu candlestick pattern or a bearish marubozu candlestick pattern based on its color. A green or white long-bodied candle is considered a bullish marubozu, while a red or black long-bodied candle is considered a bearish marubozu.


