


Written by:

Reviewed by:

Bullish
- May 1, 2026
- 17 min read
Rounding Bottom Pattern Trading Guide
A rounding bottom pattern, which is also known as a “saucer pattern”, is a bullish reversal pattern that indicates that there has been a gradual bullish shift in the market over a longer time frame.
Think of it as a ‘u’ shaped curve. This pattern is different from a “V-bottom”, which is a sharper rebound. The rounding bottom pattern is more gradual, showing the positive market reversal taking its time, and being confirmed by volume as this chart pattern is playing out.
What is a Rounding Bottom Pattern?
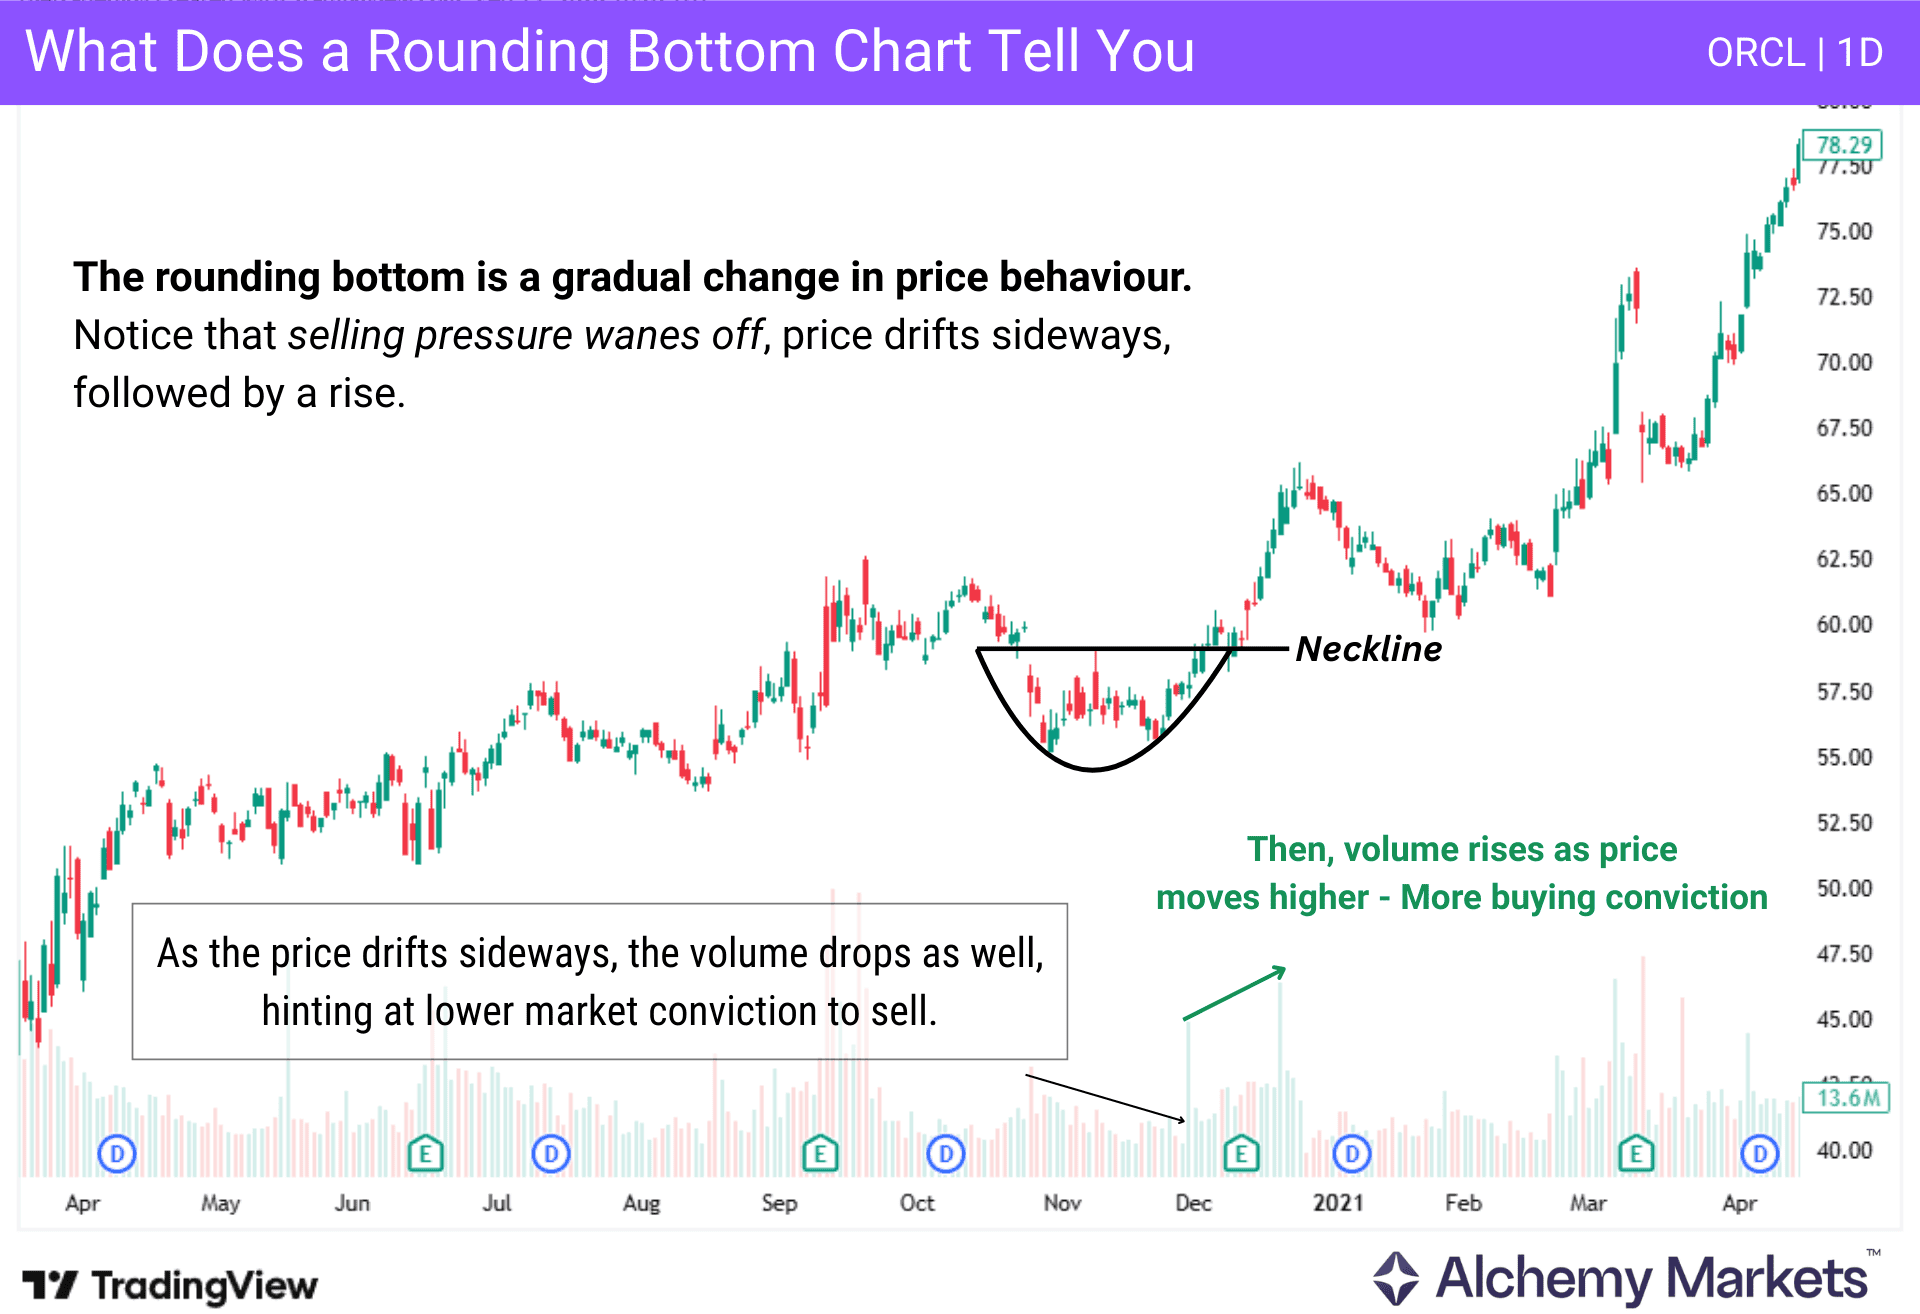
The rounding bottom is a bullish reversal chart pattern that is used by technical traders to show a change in market sentiment as the selling pressure is starting to abate, followed by a trend reversal.
This chart pattern suggests that over time, as shown in the form of an u shaped curve, the attitude and inflows into the market are becoming increasingly bullish.
A rounding bottom is a market where price trends upward after spending some time dropping, going somewhat sideways, following a move to the upside, with increased trading volume.
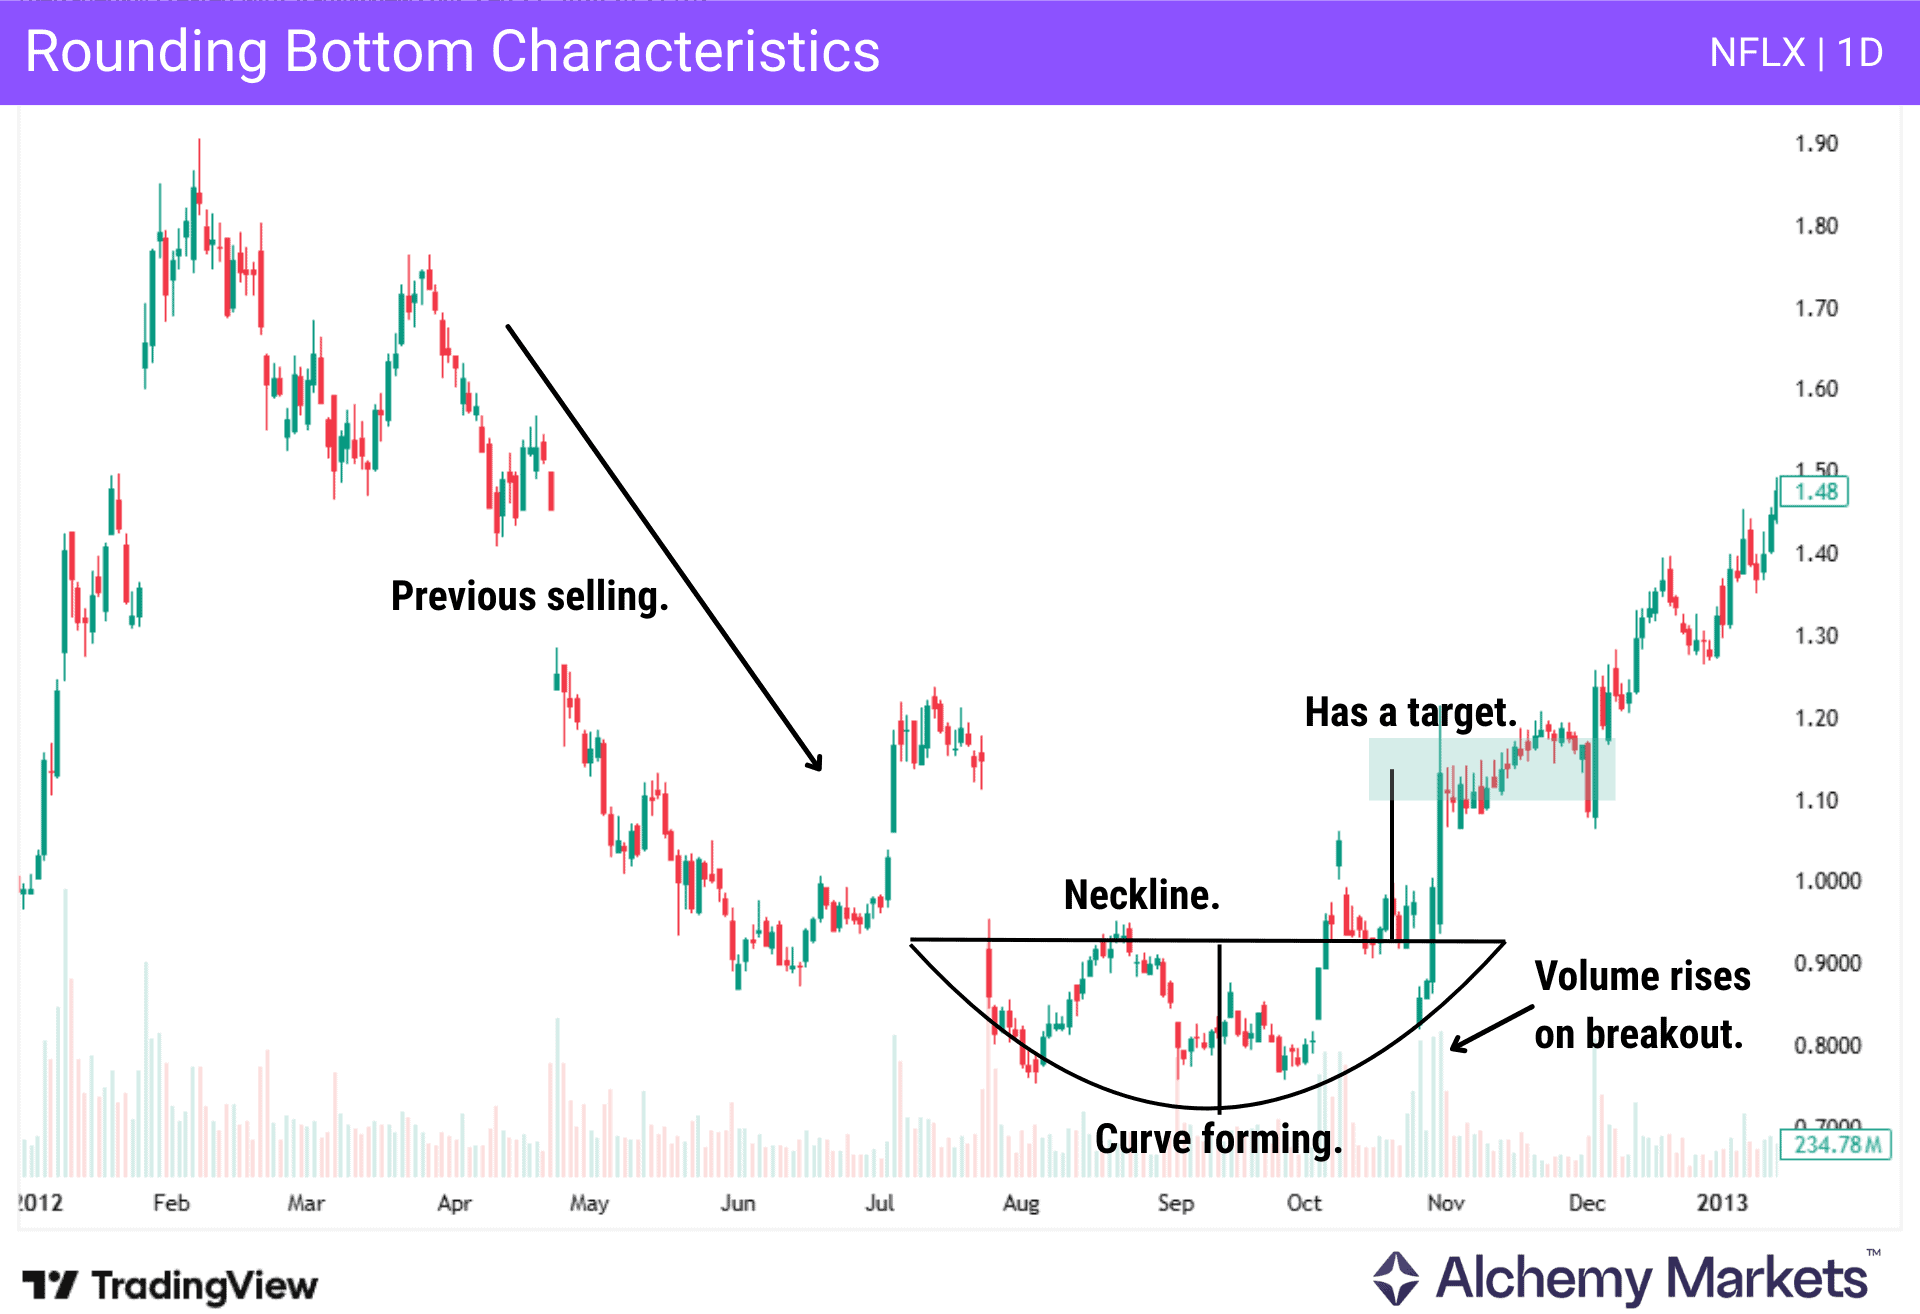
Key characteristics:
- Rounding bottoms occur after a sustained bearish phase or downtrend.
- The price action forms a concave pattern as the selling pressure starts to fade.
- As a general rule, you want to see volume follow the price action. Higher on the move down, dropping off near or at the peak, and then increasing again as the market rallies.
- Has a “neckline” where a breakout signifies a bigger move to the upside is possible.
What is a Rounding Bottom Pattern Breakout?
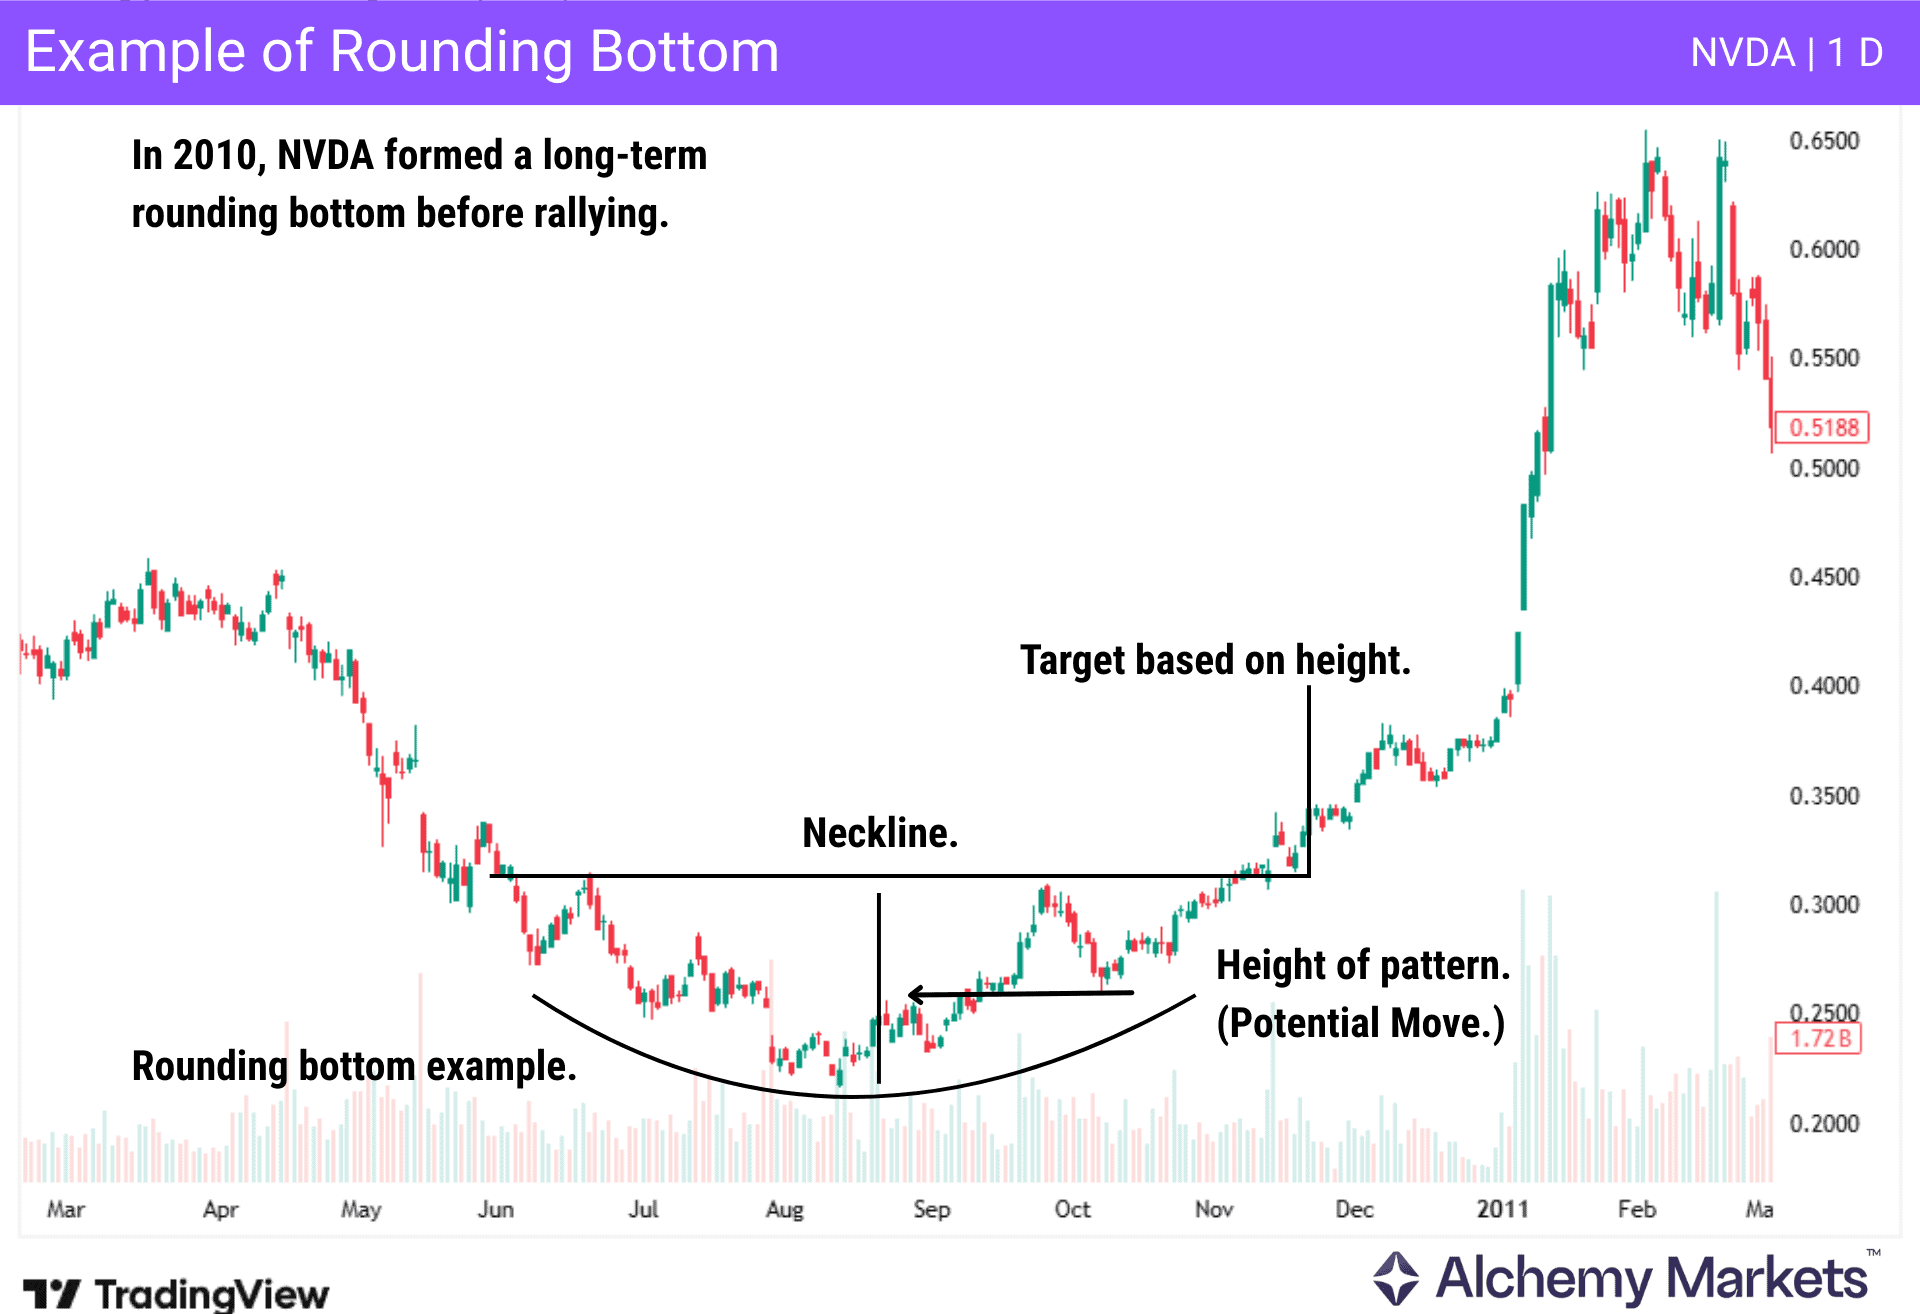
A rounding bottom pattern breakout is a price rise equal to the height of the pattern.
A clear indication this is likely to happen, is when the rounding bottom breaks the resistance at the highs of the pattern. This is usually a critical prior high (neckline); see chart above for reference.
How to Identify the Rounding Bottom Pattern?
Identifying a rounding bottom reversal pattern can be a little confusing for new traders, but there are a few things that you can look for in order to understand when a rounding bottom is forming.
The most important part is that the market has fallen pretty aggressively for some time, but then begins to gradually move sideways. This is a time where volume starts to drop off, showing a potential lack of selling pressure. During this plateau, many traders will stop paying attention. However, after some time, the buyers can return, pushing trading volume higher as the price breaks higher.
In other words, this is a technical analysis pattern that forms a gradual u shape, before turning things around. Sometimes, however, the price can drift horizontally sideways, creating a flat bottom.
The top of the u shaped pattern is the “neckline”, as a potential resistance barrier. Once price breaks above it, preferably with increasing volume, the rounding bottom is confirmed.
Key Characteristics of Rounding Bottom Pattern
The rounding bottom chart pattern is defined by a few key points, including:
- Prior downtrend: The pattern forms after a significant move lower.
- Curve: The pattern creates a sequence of lower lows that will gradually flatten out over time, forming a concave, or u shaped pattern.
- Volume profile: Volumes will often mirror the price curve, tapering off at the bottom of the pattern, but rising on the move higher.
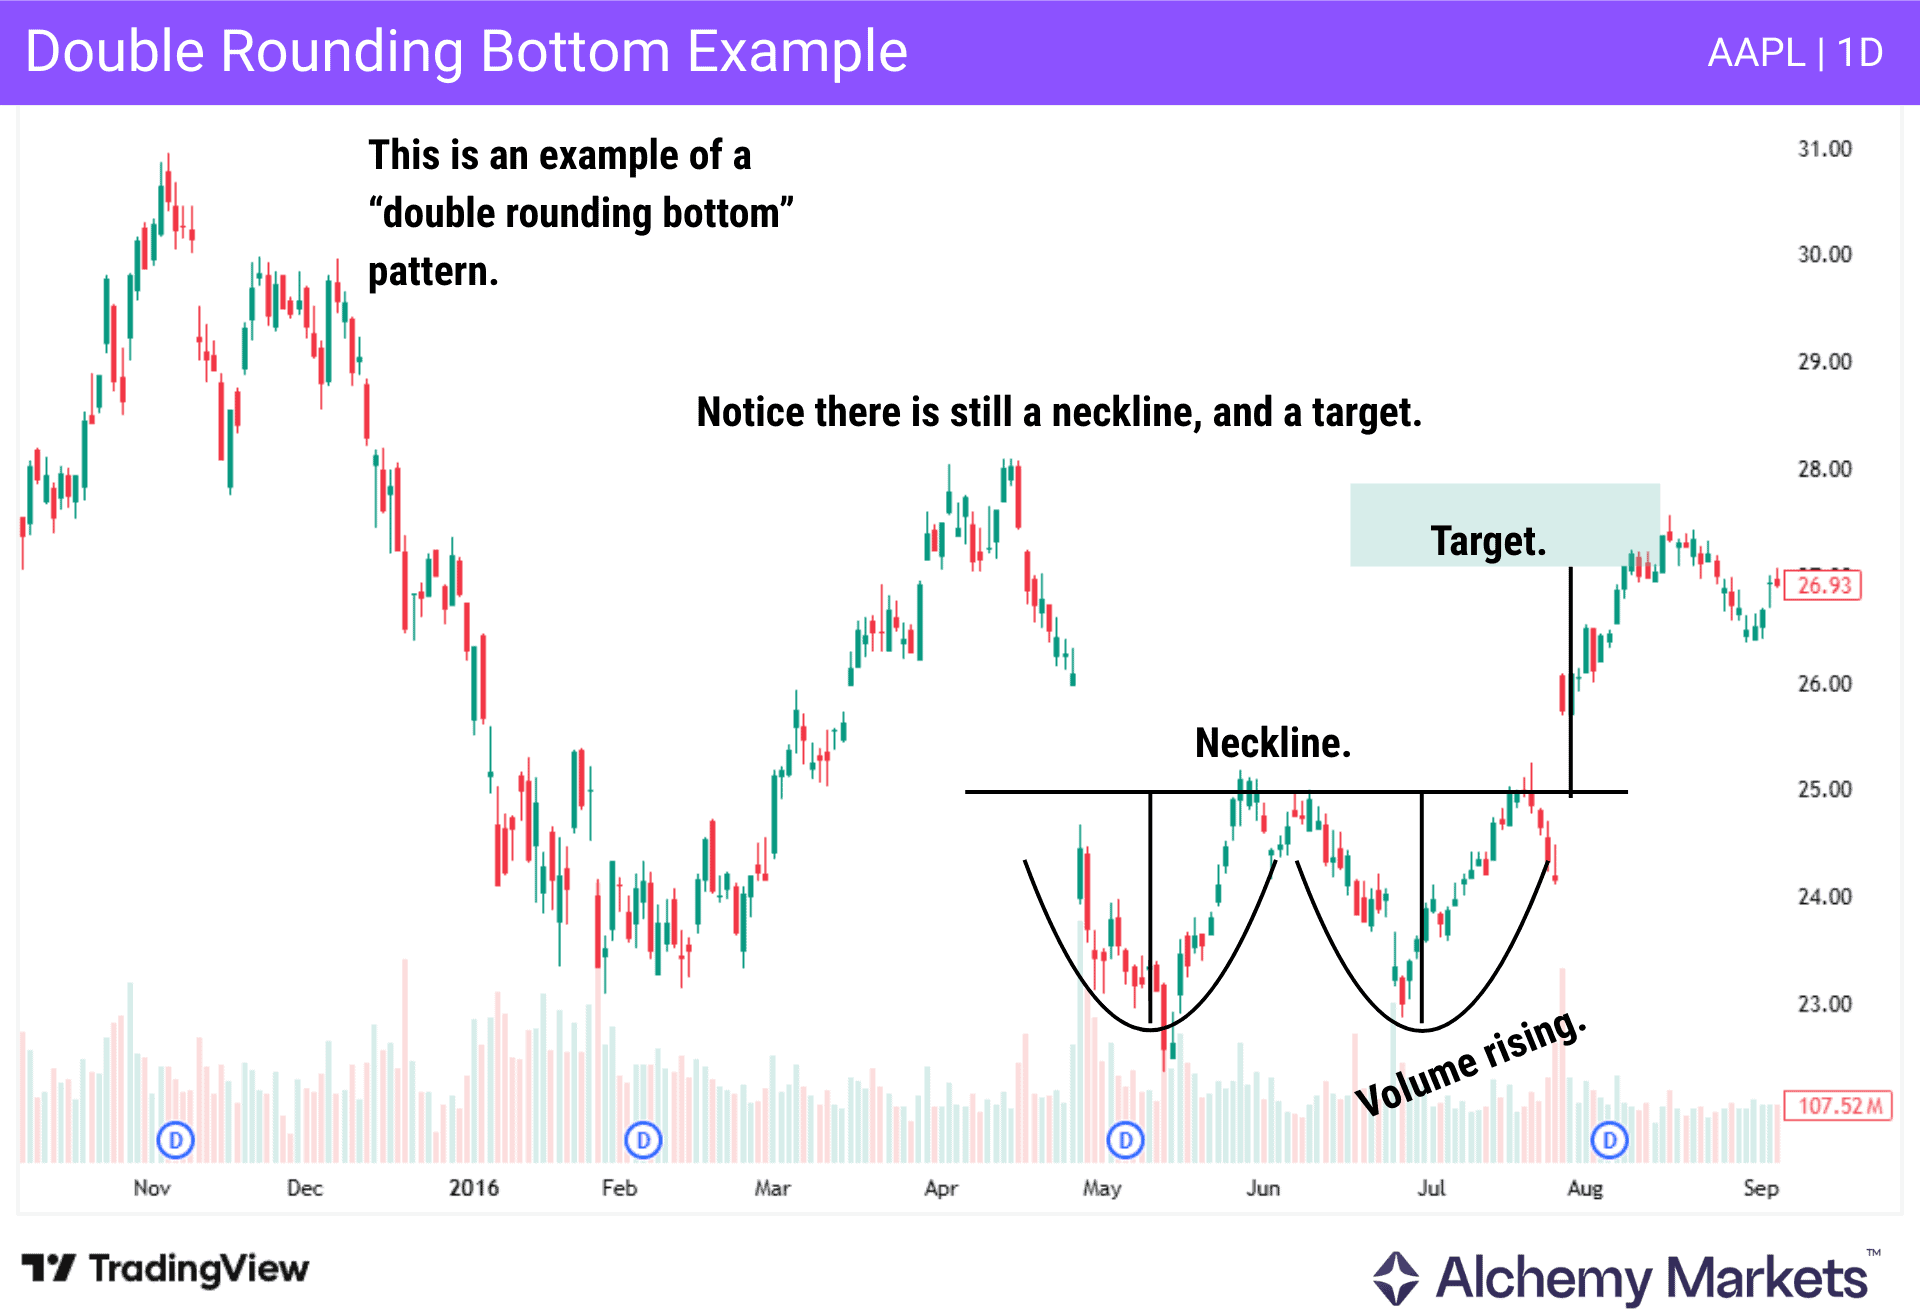
- Neckline: The rounding bottom pattern has a resistance level, or the “neckline” at the top of the concave region.
| Quick note: Some rounding bottoms end up looking more “flat” at the lows, meaning that price doesn’t move significantly lower and gradually form a smooth U shape. That’s still okay, the key here is that downside momentum is fading over a long period of time. |
How Does Rounding Bottom Pattern Trading Work?
The rounding bottom technical analysis pattern is used by traders to identify a potential shift in the previous bearish trend. The market will “bottom” in a sideways action after the selling pressure shows signs of exhaustion, as volume also drops.
This sideways action can be thought of as potential accumulation, as both the sellers and buyers are starting to show signs of equal pressure, like the market is “waiting for something.” The market then will start to shift its attitude, as buyers are starting to become just a touch more aggressive. The market starts to shift from “sell the rally” at the neckline, to “buy the dip” at the previous low.
Once the market breaks above the established neckline, the new bullish trend is established. A breakout with volume increasing adds to the confirmation of the bullish reversal.
To get how far the potential target will be, traders use the height of the pattern, otherwise known as the “measured move target”. For example, if the height of the pattern is $10, once the market breaks out, you will expect the market to aim for $10 above the neckline.
What Does a Rounding Bottom Patter Chart Tell You
The rounding bottom pattern suggests that the market is trying to find its footing, and change the prior trend. The resistance line, the neckline, is the key. Once price breaks and holds above the neckline, this suggests that buyers have decisively overwhelmed the sellers.
Trading volume increasing as the neckline breaks also shows that the sellers are now in serious trouble.
When traders are in trouble, they are forced to cover their shorts, in other words, buy. This only compounds the upwards pressure, and makes the market move even higher.
Importance of Rounding Bottom Pattern
Since rounding bottoms take a longer time to form, it has more market significance, compared to — than say — a V-shaped bottom.
This is because in a rounding bottom, markets had a longer amount of time to decide on the trajectory of inflows and momentum.
It’s like if two players played rock-paper-scissors. A rounding bottom would be the equivalent of playing 1000 games, versus a quicker set of just 500 games. A player showing an edge over the course of 1000 games is simply going to be more significant.
Rounding Bottom Pattern Example
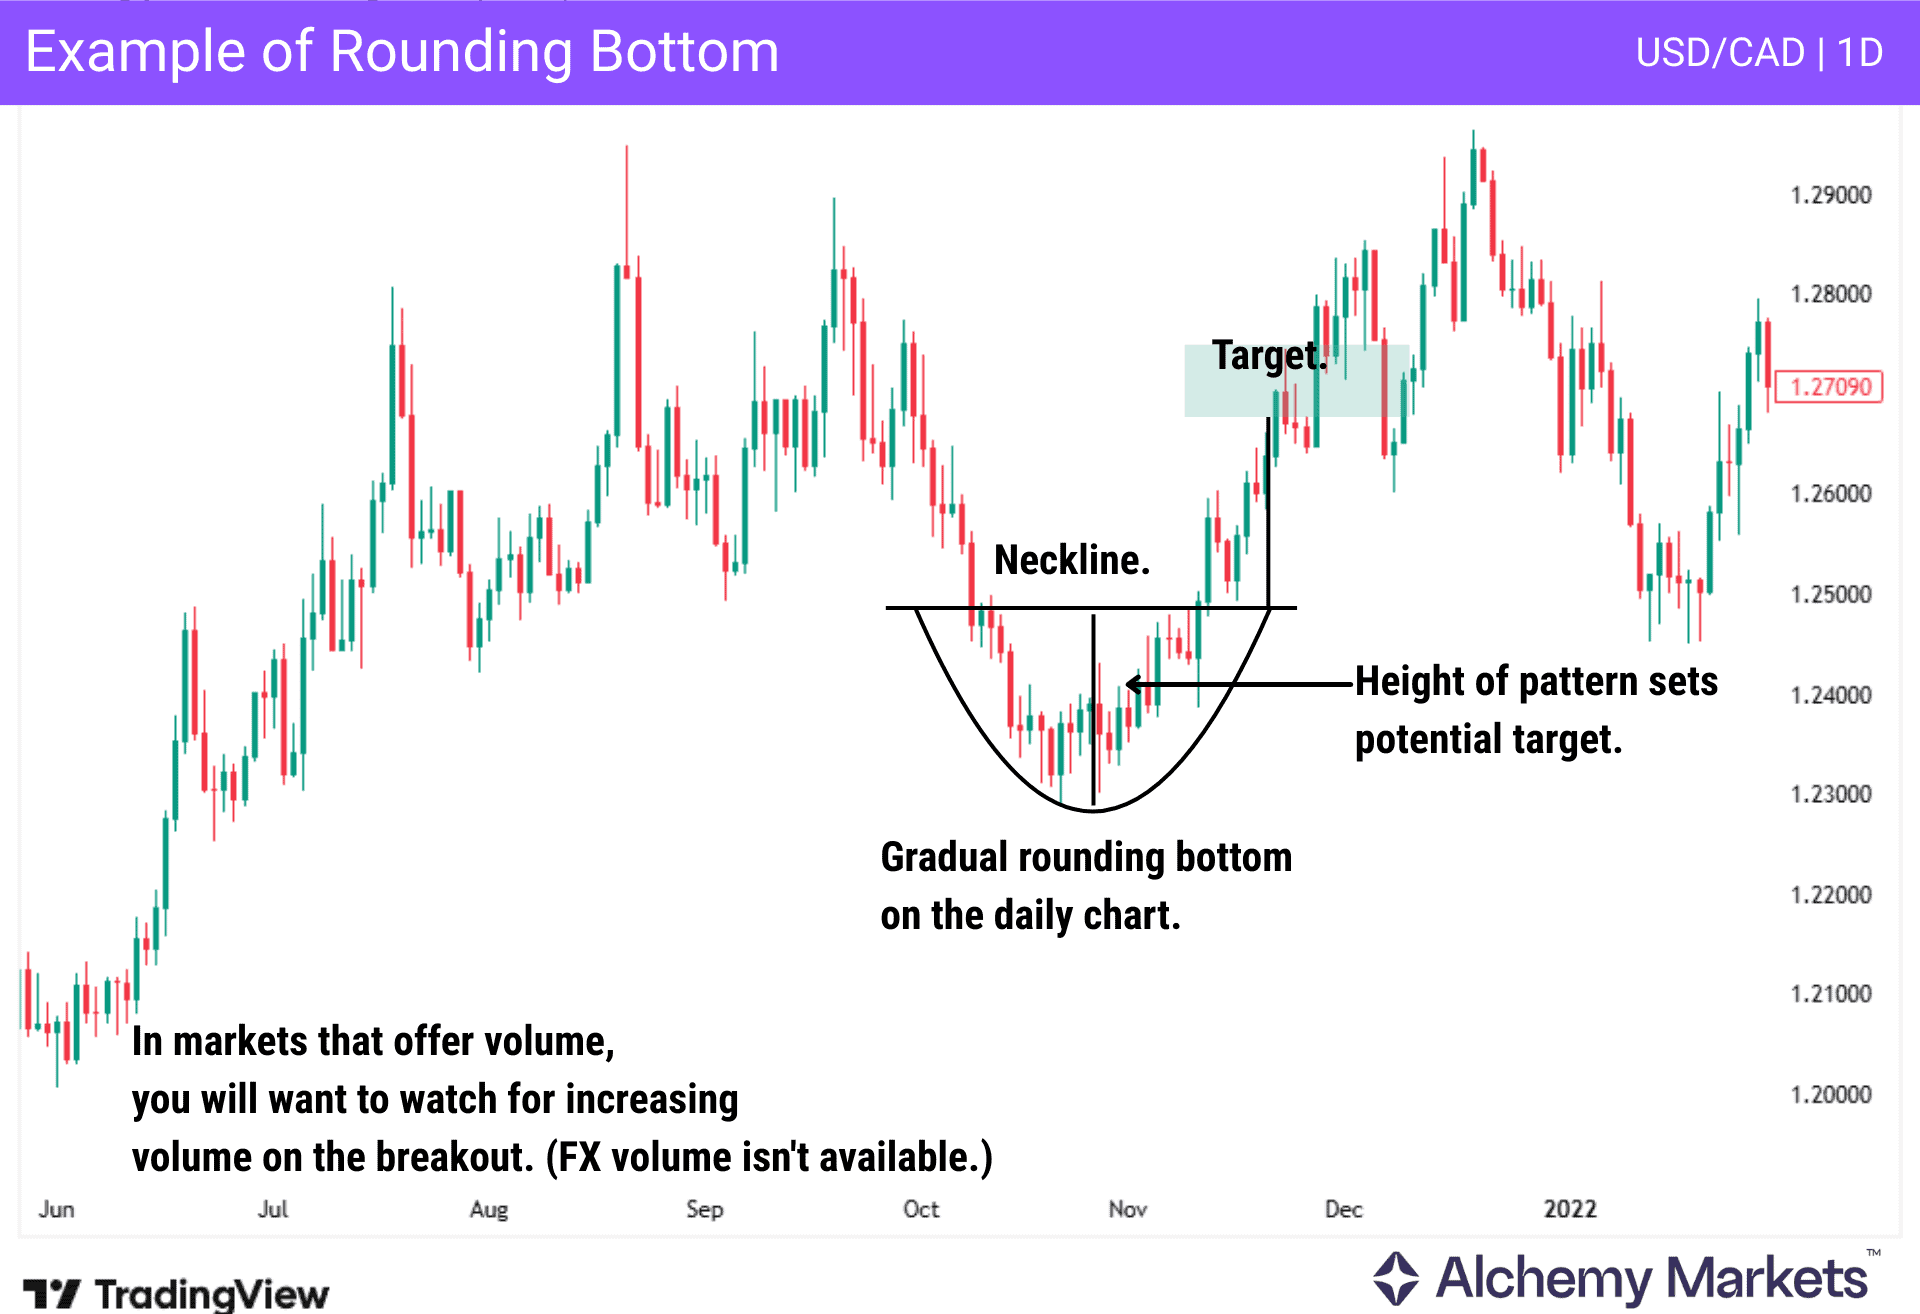
In the USD/CAD currency pair example above, we see a rounding bottom reversal pattern form during a macro uptrend.
This one is a little different in that there is no volume tracked in FX markets. But, just by relying on price action alone, traders can still spot the pattern, and reliably notice a change in behaviour.
Notice how USDCAD pulls back and forms a rounded bottom structure.
There is a “measured move” based on the height of the rounding bottom pattern, which is the expected move to the upside. Once the market breaks above the neckline, or resistance level, the US dollar rises to the potential target.
Rounding Bottom Pattern Trading Strategies
Across various markets, rounding bottom reversal patterns are generally traded the same way.
The overall idea is that once the neckline is broken to the upside, the height of the pattern is the projected target.
Traders who are patient enough to wait for confirmation, be it from volume, or one of the following indicators below, can attempt to ride the wave of those traders who are not only trading the rounding bottom, but also the indicators that some will follow.
Rounding Bottom Pattern with RSI
The Relative Strength Index is a technical indicator that many traders use in the markets. The RSI gives a reading of “overbought” or “oversold”, giving traders an idea as to whether the market has moved too far.
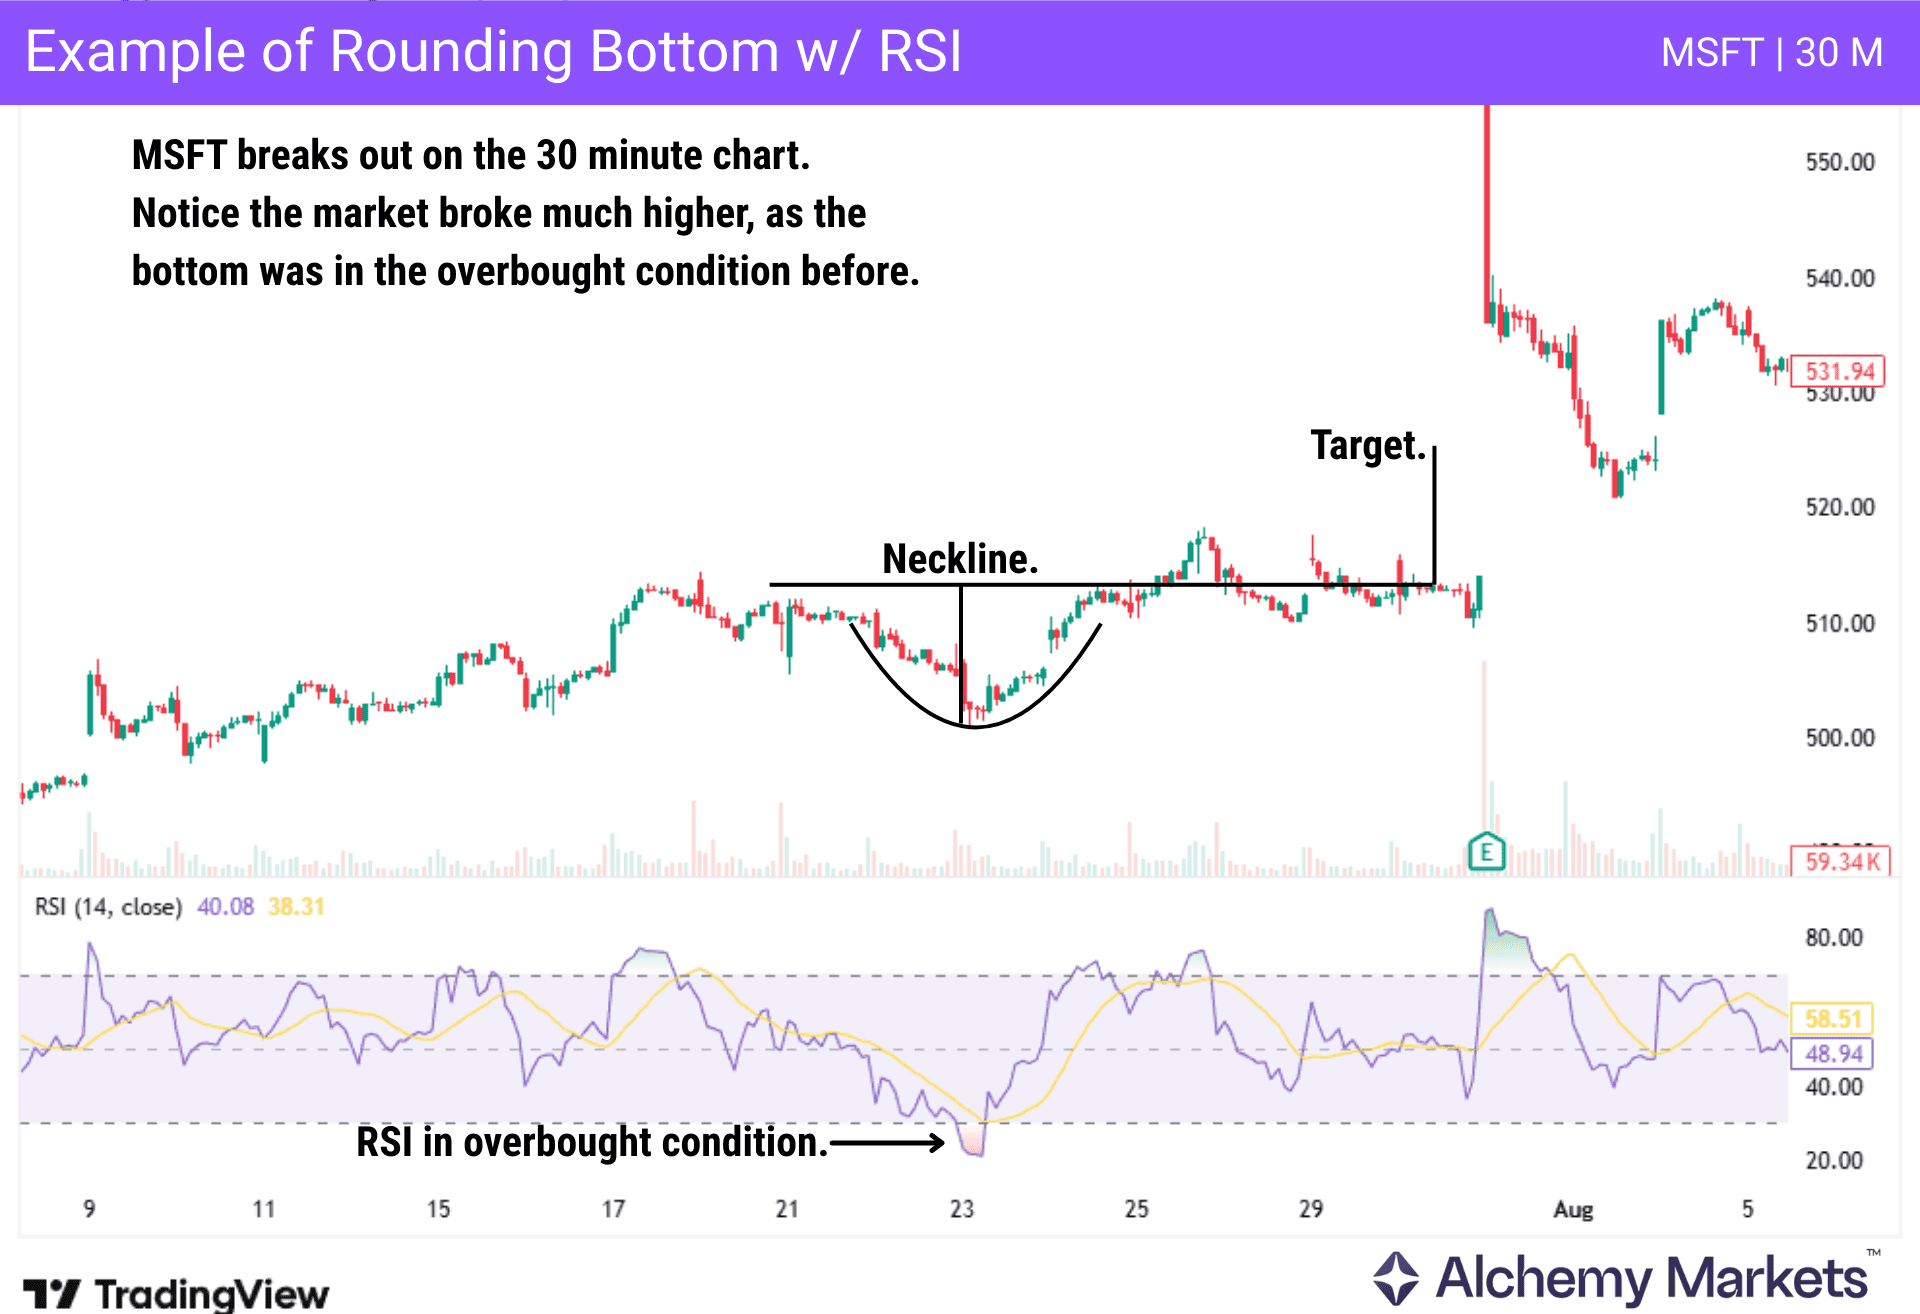
When you trade rounding bottoms, you will want to pay attention to “oversold” signals, which will give another reason for traders to believe that the market has gone too far and too fast; adding more credence to the idea that the market is running out of selling pressure.
In the example above, Microsoft formed a rounding bottom on the 30 minute chart. The neckline was broken to the upside, after the Relative Strength Index reached an oversold condition.
This was “frontrunning” the earnings announcement, showing the potential move ahead of time. That being said, had the earnings gone in the wrong direction, a break below the pattern will have had people exiting this set up.
Rounding Bottom Pattern with Volume Profile
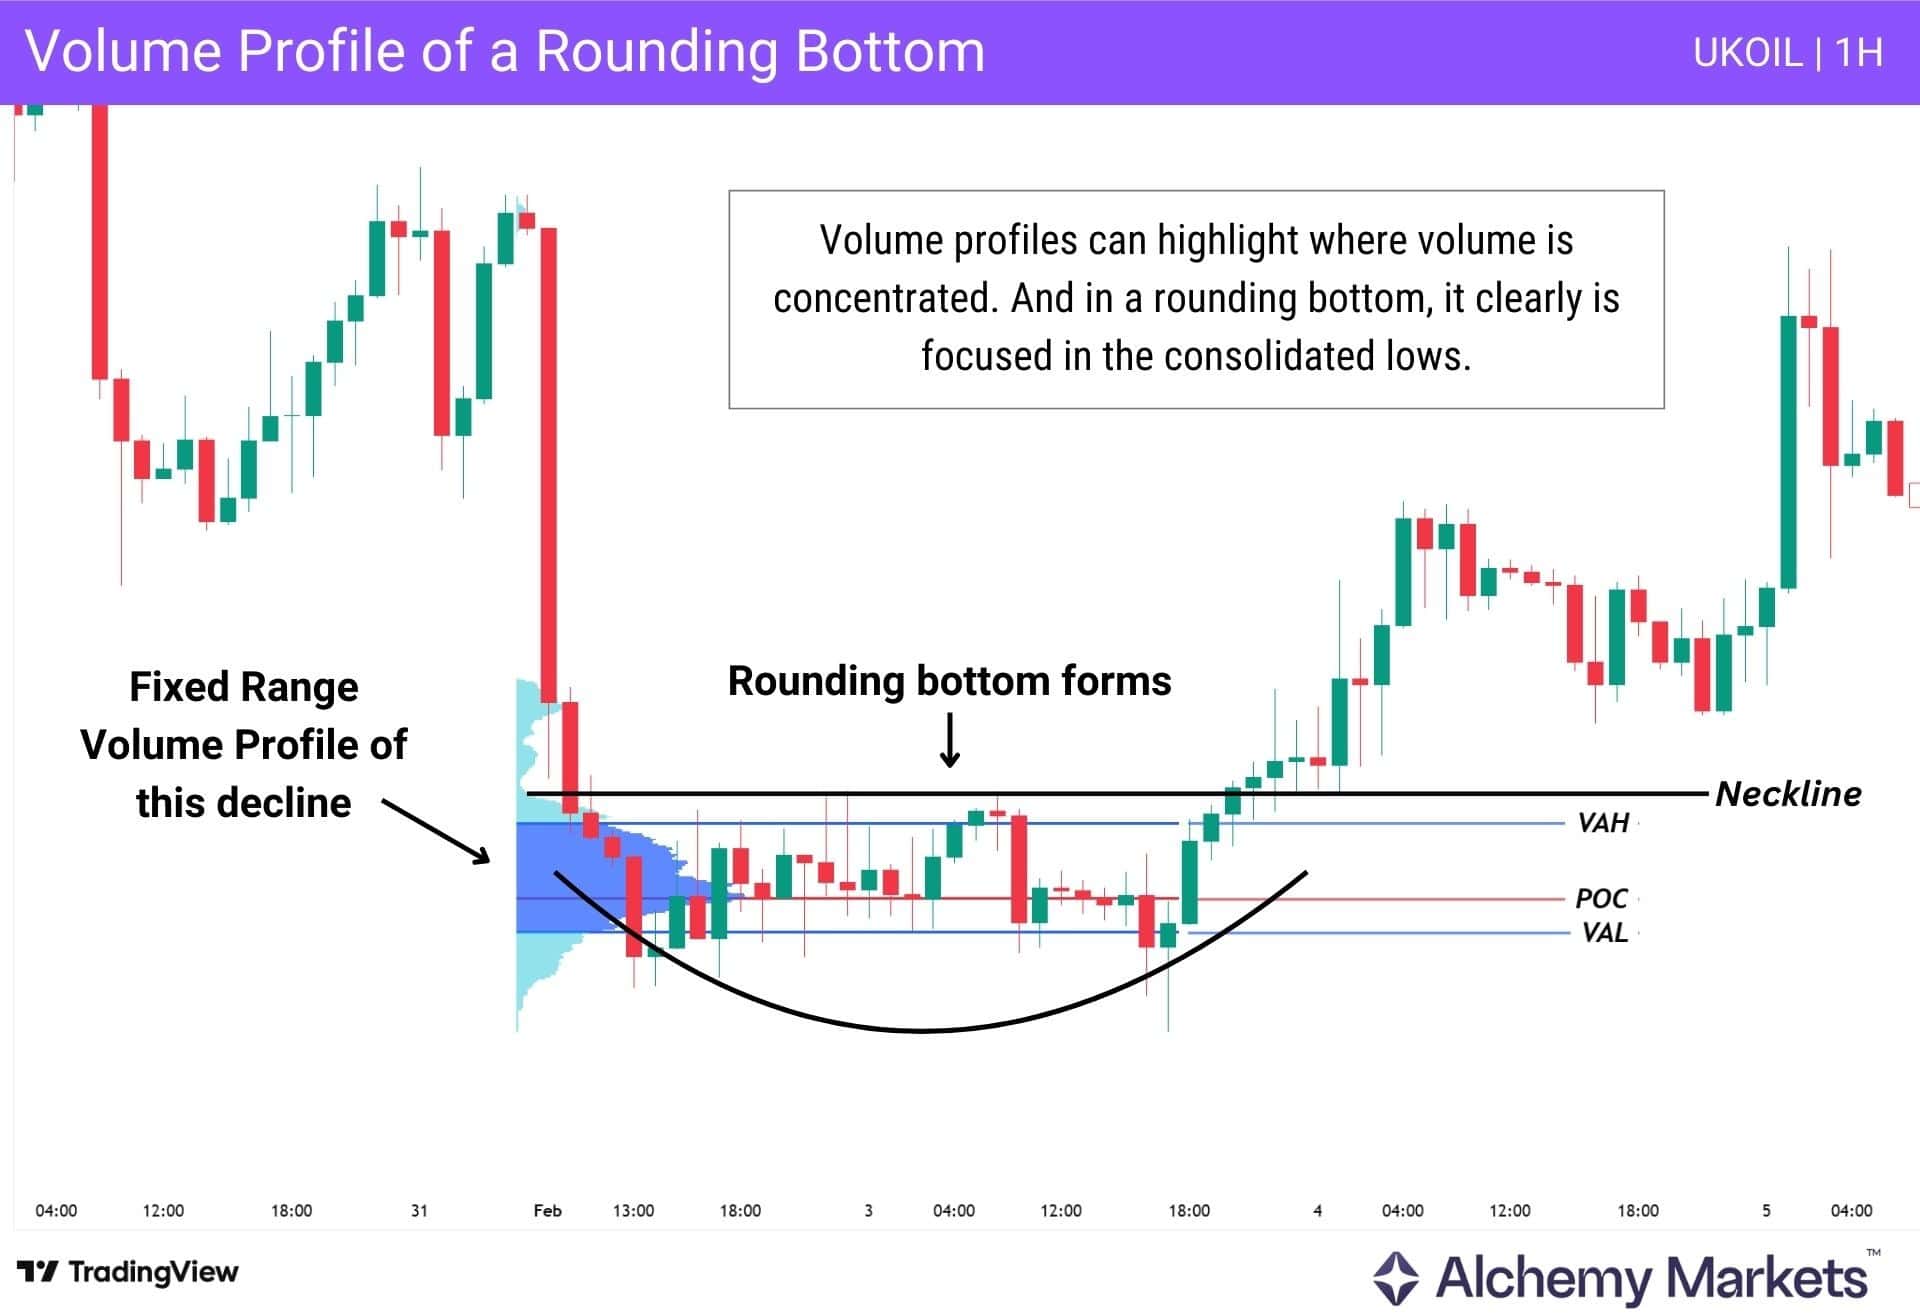
Volume profiles (VP) are tools that can plot the amount of volume traded at a specific price, and can give another way to look at the potential of a flattening curve.
When you use VP and notice that price is consolidating at the lows after a decline, it’s a sign that a rounding bottom reversal pattern could be forming.
The VP can highlight what’s called a Fair Value Area. This is where 70% of the trade volume has been concentrated, and is piled into a zone between a VAH (Value area high), and VAL (Value Area Low).
Should the Fair Value Area coincide with the lows after a decline, it’s a strong hint that a rounding bottom could be building.
Then, you would trade the rounding bottom as you normally would.
Rounding Bottom Pattern with Moving Averages
Moving averages show the average price over a past number of candles. So if you’re using a 50-day average, the indicator displays a smooth line that shows the average price based on those last 50 days.
Traders can use this to confirm if a rounding bottom is forming in alignment with the larger trend. This gives the assumption that price is more likely to reverse after a sharp decline, rather than continue lower.
If the rounding bottom forms after a pullback, and the moving average is showing an uptrend, this gives even more credence to the setup.
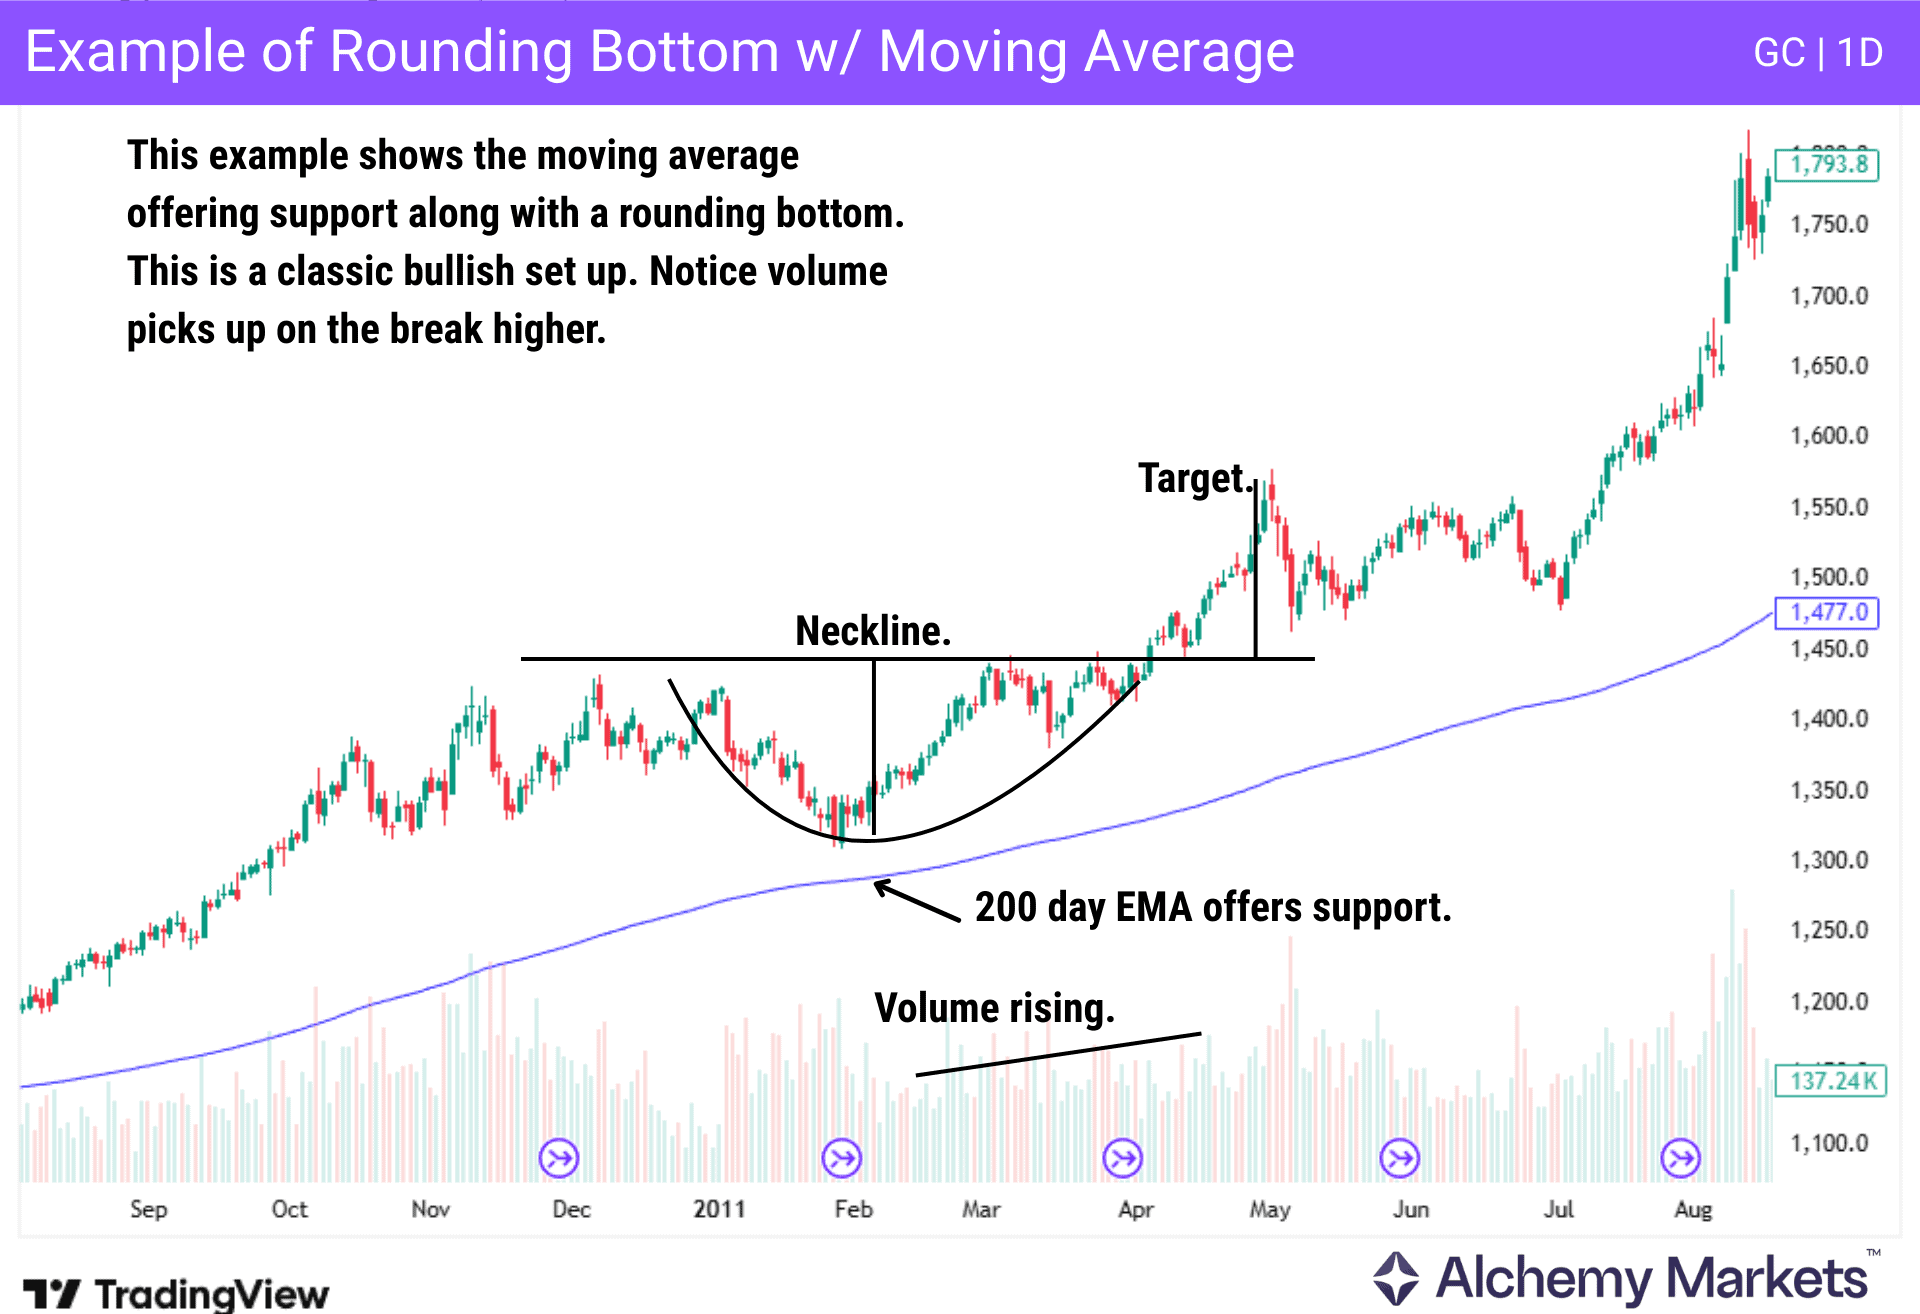
In this example, you can see that the gold futures market on the daily chart had formed a rounding bottom, but in a longer-term uptrend, as the 200 day moving average offers support as well.
This is a classic pullback set up that people see as potential trade. The 200 day moving average is one of the most common moving averages that are used to determine the overall trend on the daily chart.
Advantages of Trading on the Rounding Bottom Pattern
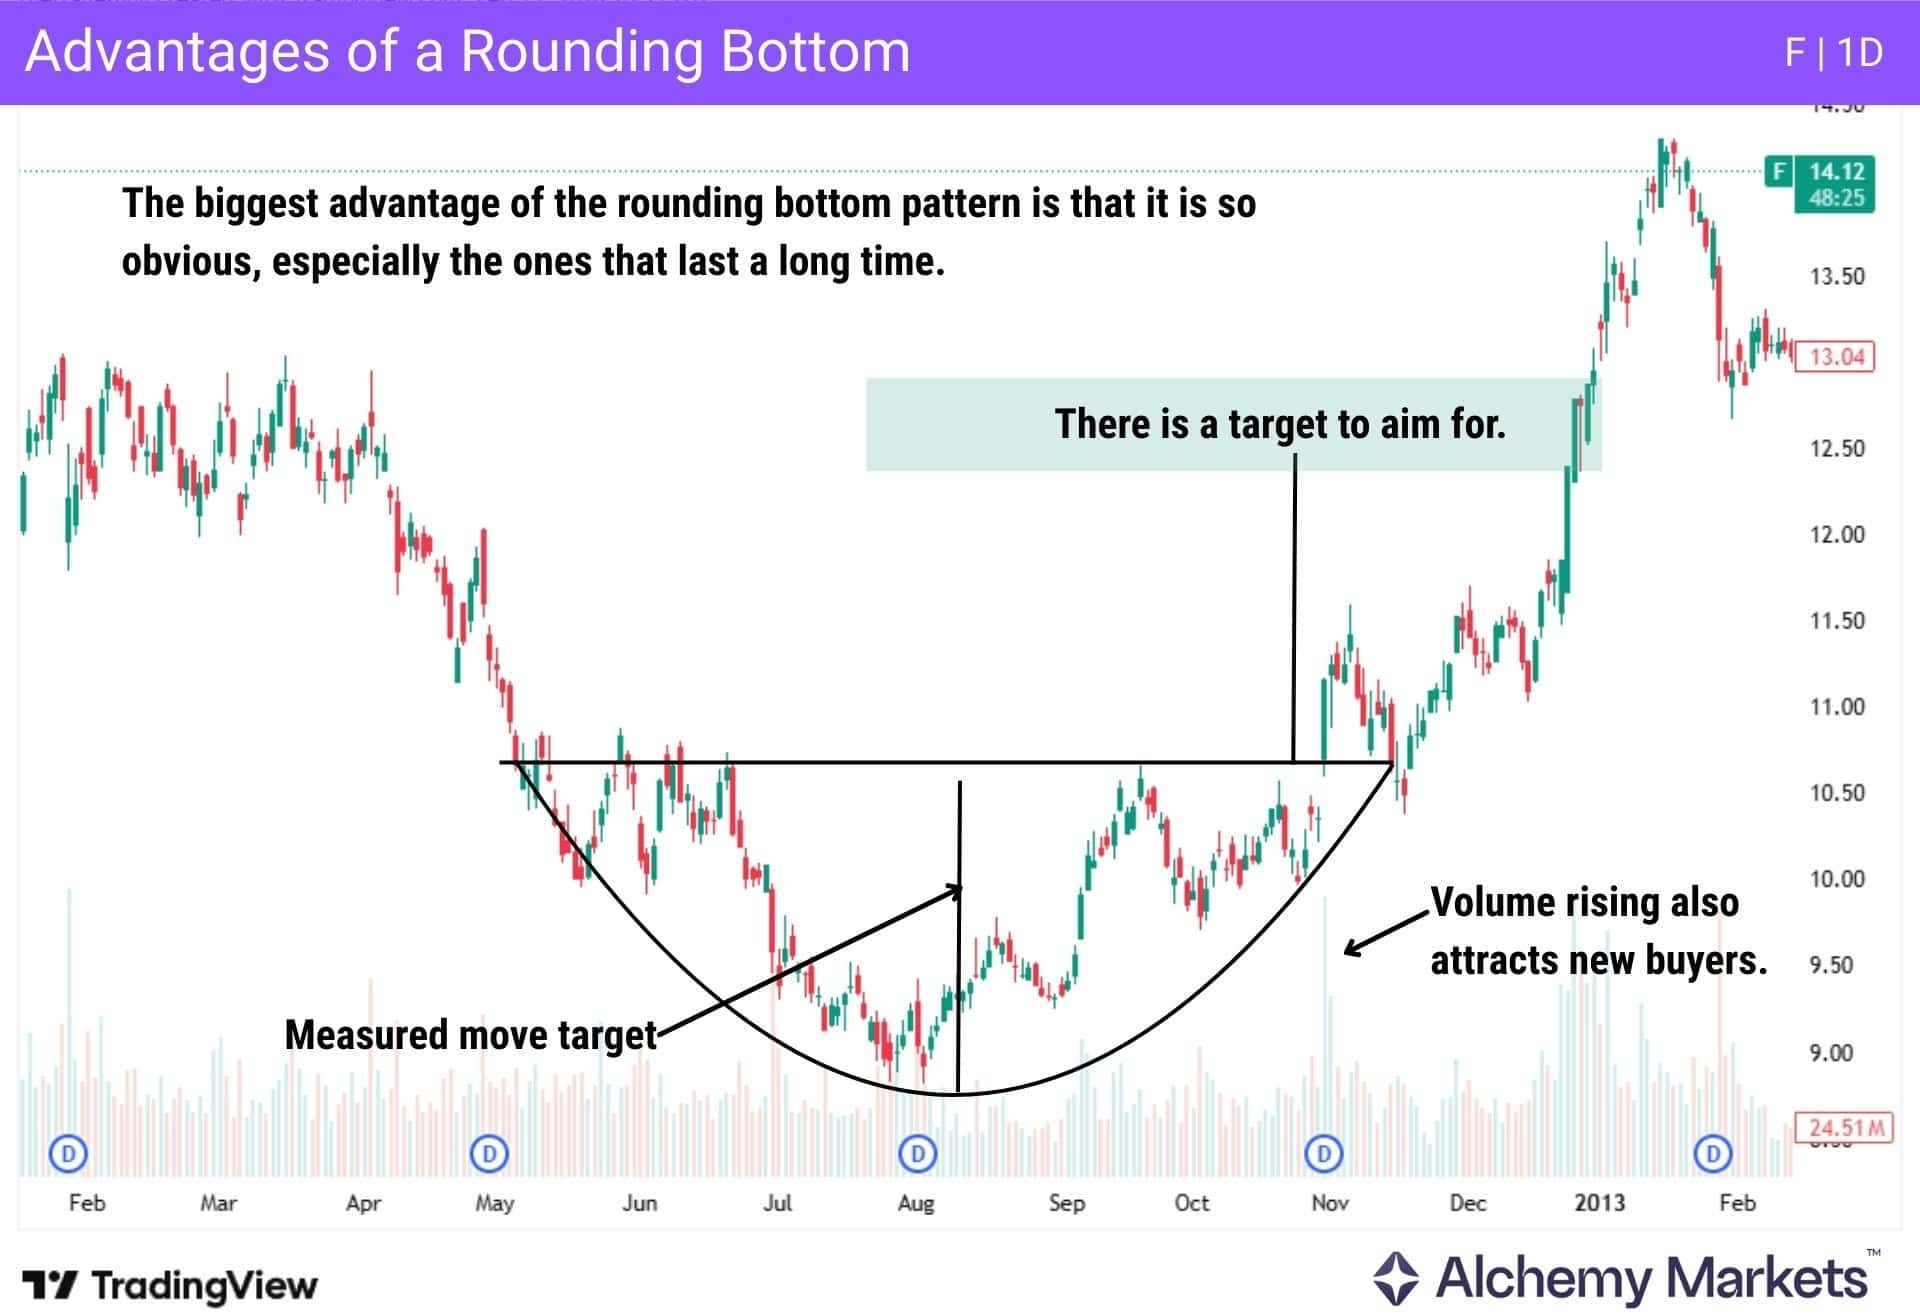
One of the biggest advantages of trading the rounding bottom pattern is that it is so obvious. The fact is that when you trade a pattern, you want as many people as possible to jump into the market.
The rounding bottom is a “widely known pattern” by those who are watching, which can have as much as a 60% success rate. Beyond that, the pattern offers a conventional profit target; equal to the height of the pattern from base to neckline (measured move target).
Pattern recognition is important here, but luckily the chart pattern is easily spotted, especially in longer-term timeframes, such as the daily or weekly charts. Often, when mixed with other technical indicators, this pattern can attract a lot of traders who use technical analysis.
Disadvantages of Trading on the Rounding Bottom Pattern
The biggest disadvantage of the rounding bottom chart pattern is that it takes time to play out. With this being the case, many traders will try to “jump the gun” when it comes to anticipating the new bullish trend. The challenge is to identify a rounding bottom, and only trading it once the resistance line is broken above.
That being the case, some of the biggest pitfalls aren’t actually involving the pattern itself. Unfortunately, traders tend to be overanxious, and this pattern being so obvious will get people to try to “jump the gun” and get involved quickly. This needs to be avoided if you are to trade responsibly.
Rounding Bottom vs Inverse Head and Shoulders
A rounding bottom chart pattern is quite a bit different than the inverse head and shoulders chart pattern. The rounding bottom pattern is more of a gradual shift in market sentiment, as well as the overall pessimism. The concave pattern shows that traders are becoming less and less conviction of the sellers.
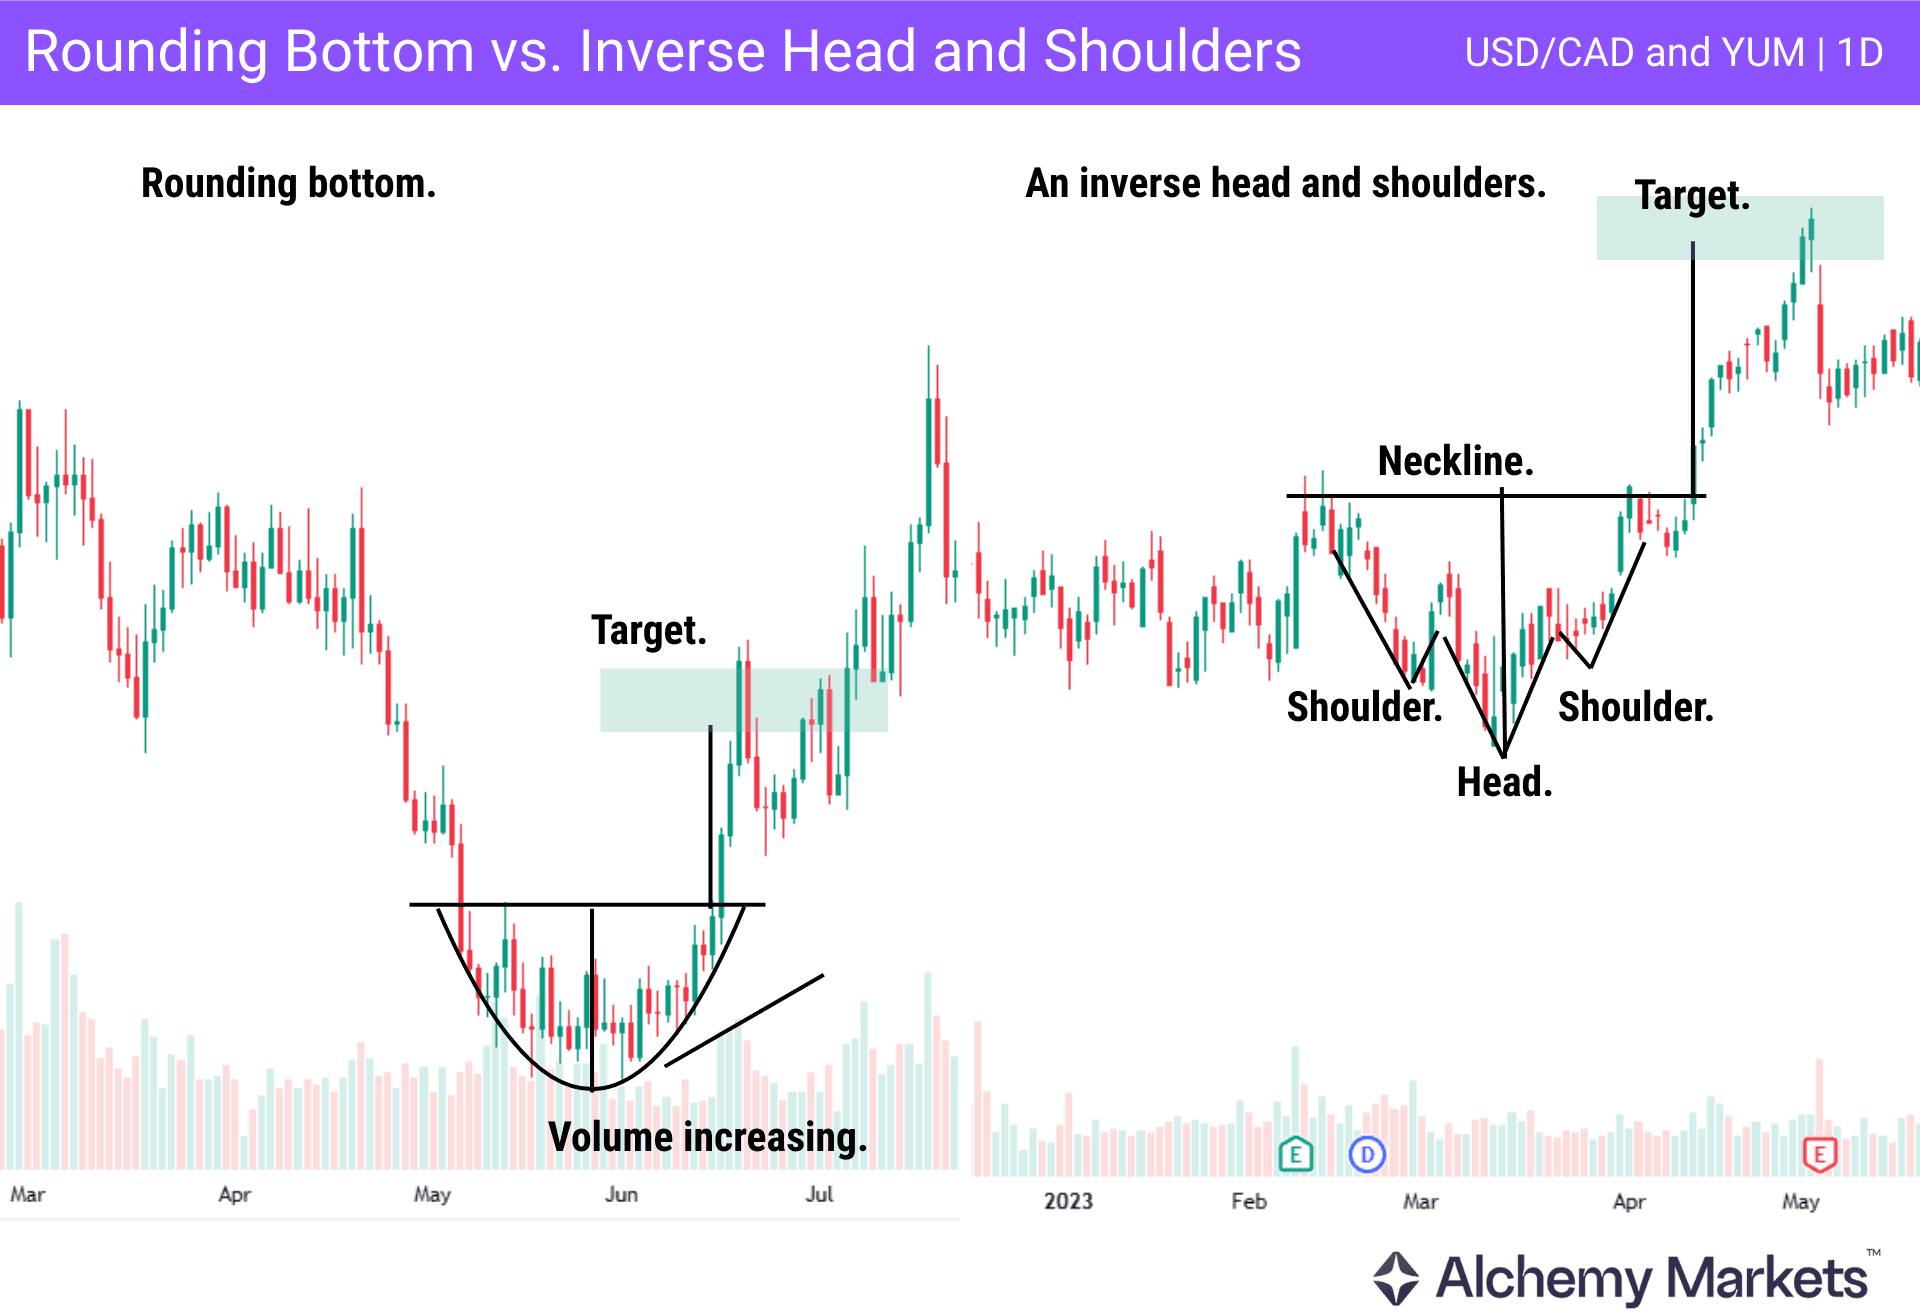
The inverse head and shoulders pattern is characterised by a distinct peak in selling pressure. The pattern has three sharp v-shaped bottoms, with the middle one being the deepest. This is characterized by selling pressure, and then a short-term bounce. After that, the market will fall to a fresh, new, low, and bounce yet again. However, on the third move lower, it doesn’t make a fresh new low.
This suggests that the market sentiment is changing, and the prior trend, this time a bearish one, could be coming to an end. This is also a “neckline” in this pattern, which is the confirmation level.
In this example above, you can clearly see how gradual the rounding bottom pattern is on the left, while the inverse head and shoulders pattern shows sharper and more drastic short-term moves before moving higher and fulfilling the target.
Rounding Bottom vs Rounding Top
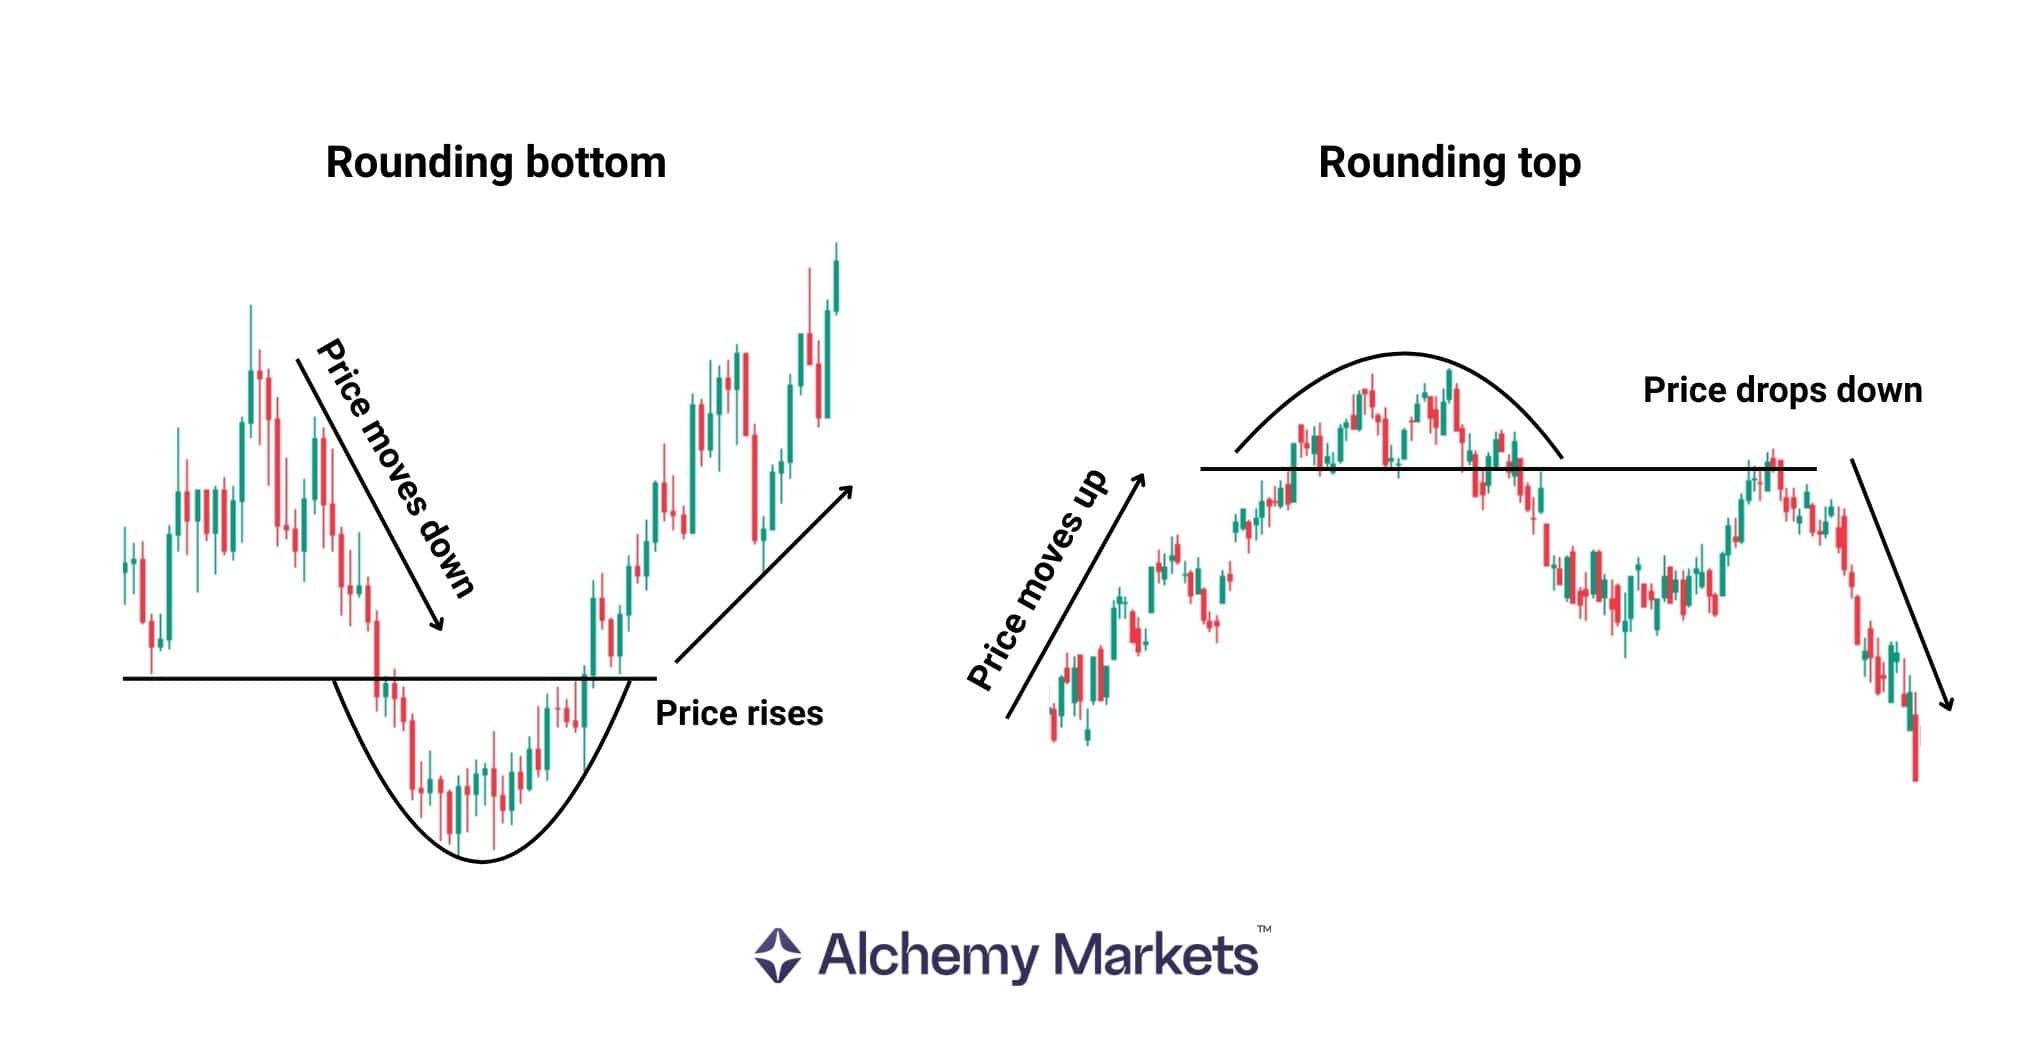
The rounding top is like an inverted rounding bottom pattern. It appears at the end of a bullish move in the market, with a lack of followthrough for the buyers. After that, the market goes sideways, and eventually price breaks down through the neckline.
These patterns, Rounding bottoms and rounding tops, are basically inverses of each other. They work in the same way but direct price in opposite directions.
Rounding Bottom vs Double Bottom
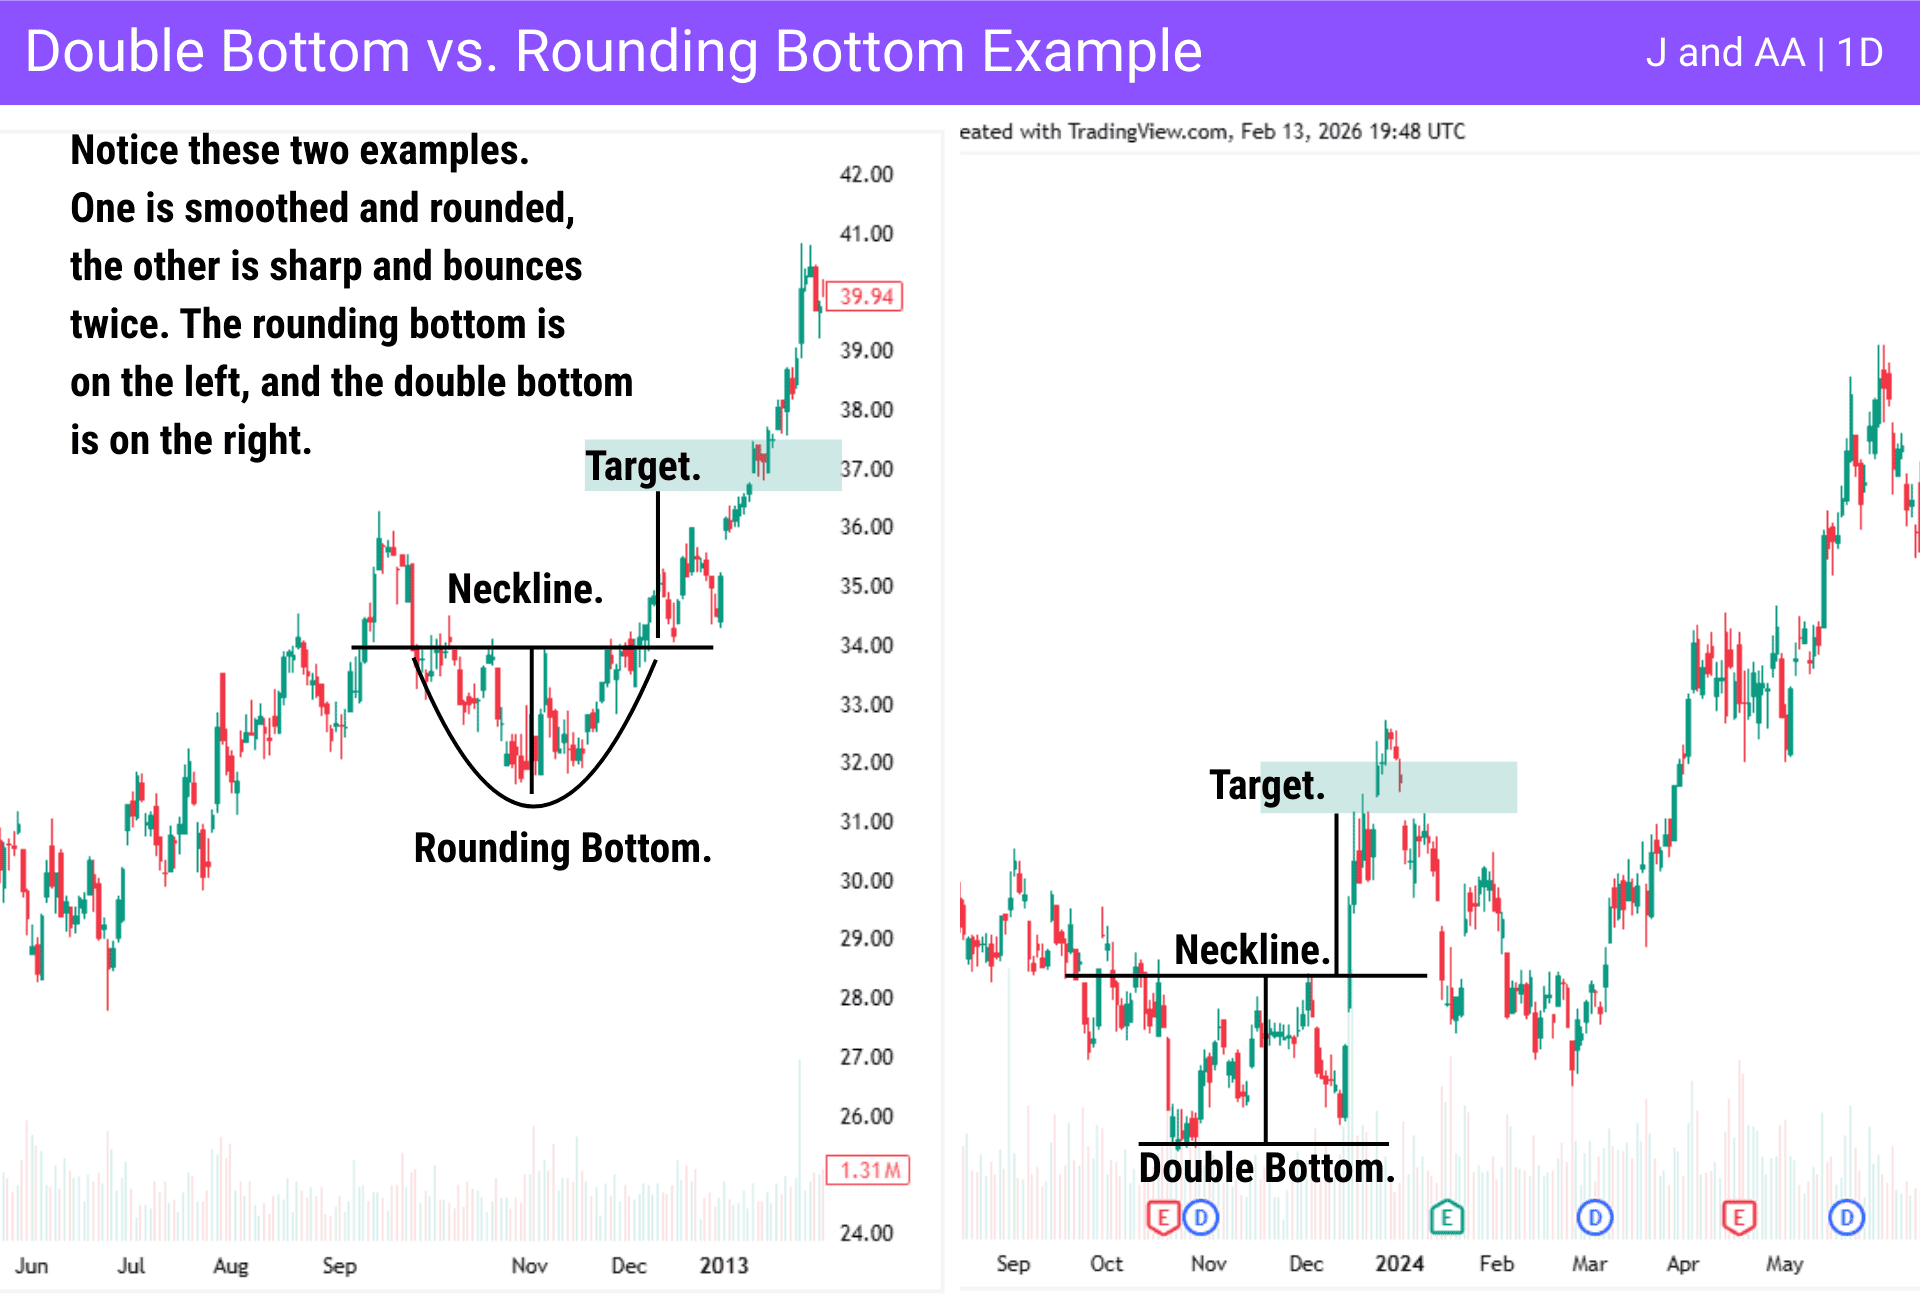
The rounding bottom chart pattern and the double bottom essentially are saying the same thing, that there is a bottom pattern forming. This means that the prior trend could be in trouble, as there are buyers willing to get involved.
However, the double bottom is better thought of as a “double V pattern”, with it being much quicker to show signs of buying. The rounding bottom chart pattern takes longer to form, and therefore suggests a more meaningful change in attitude, as it takes more trading volume and decisions to accomplish it.
This positive market reversal takes more conviction to form, as opposed to the market reacting to a sudden shift in attitude.
Rounding Bottom vs Cup and Handle
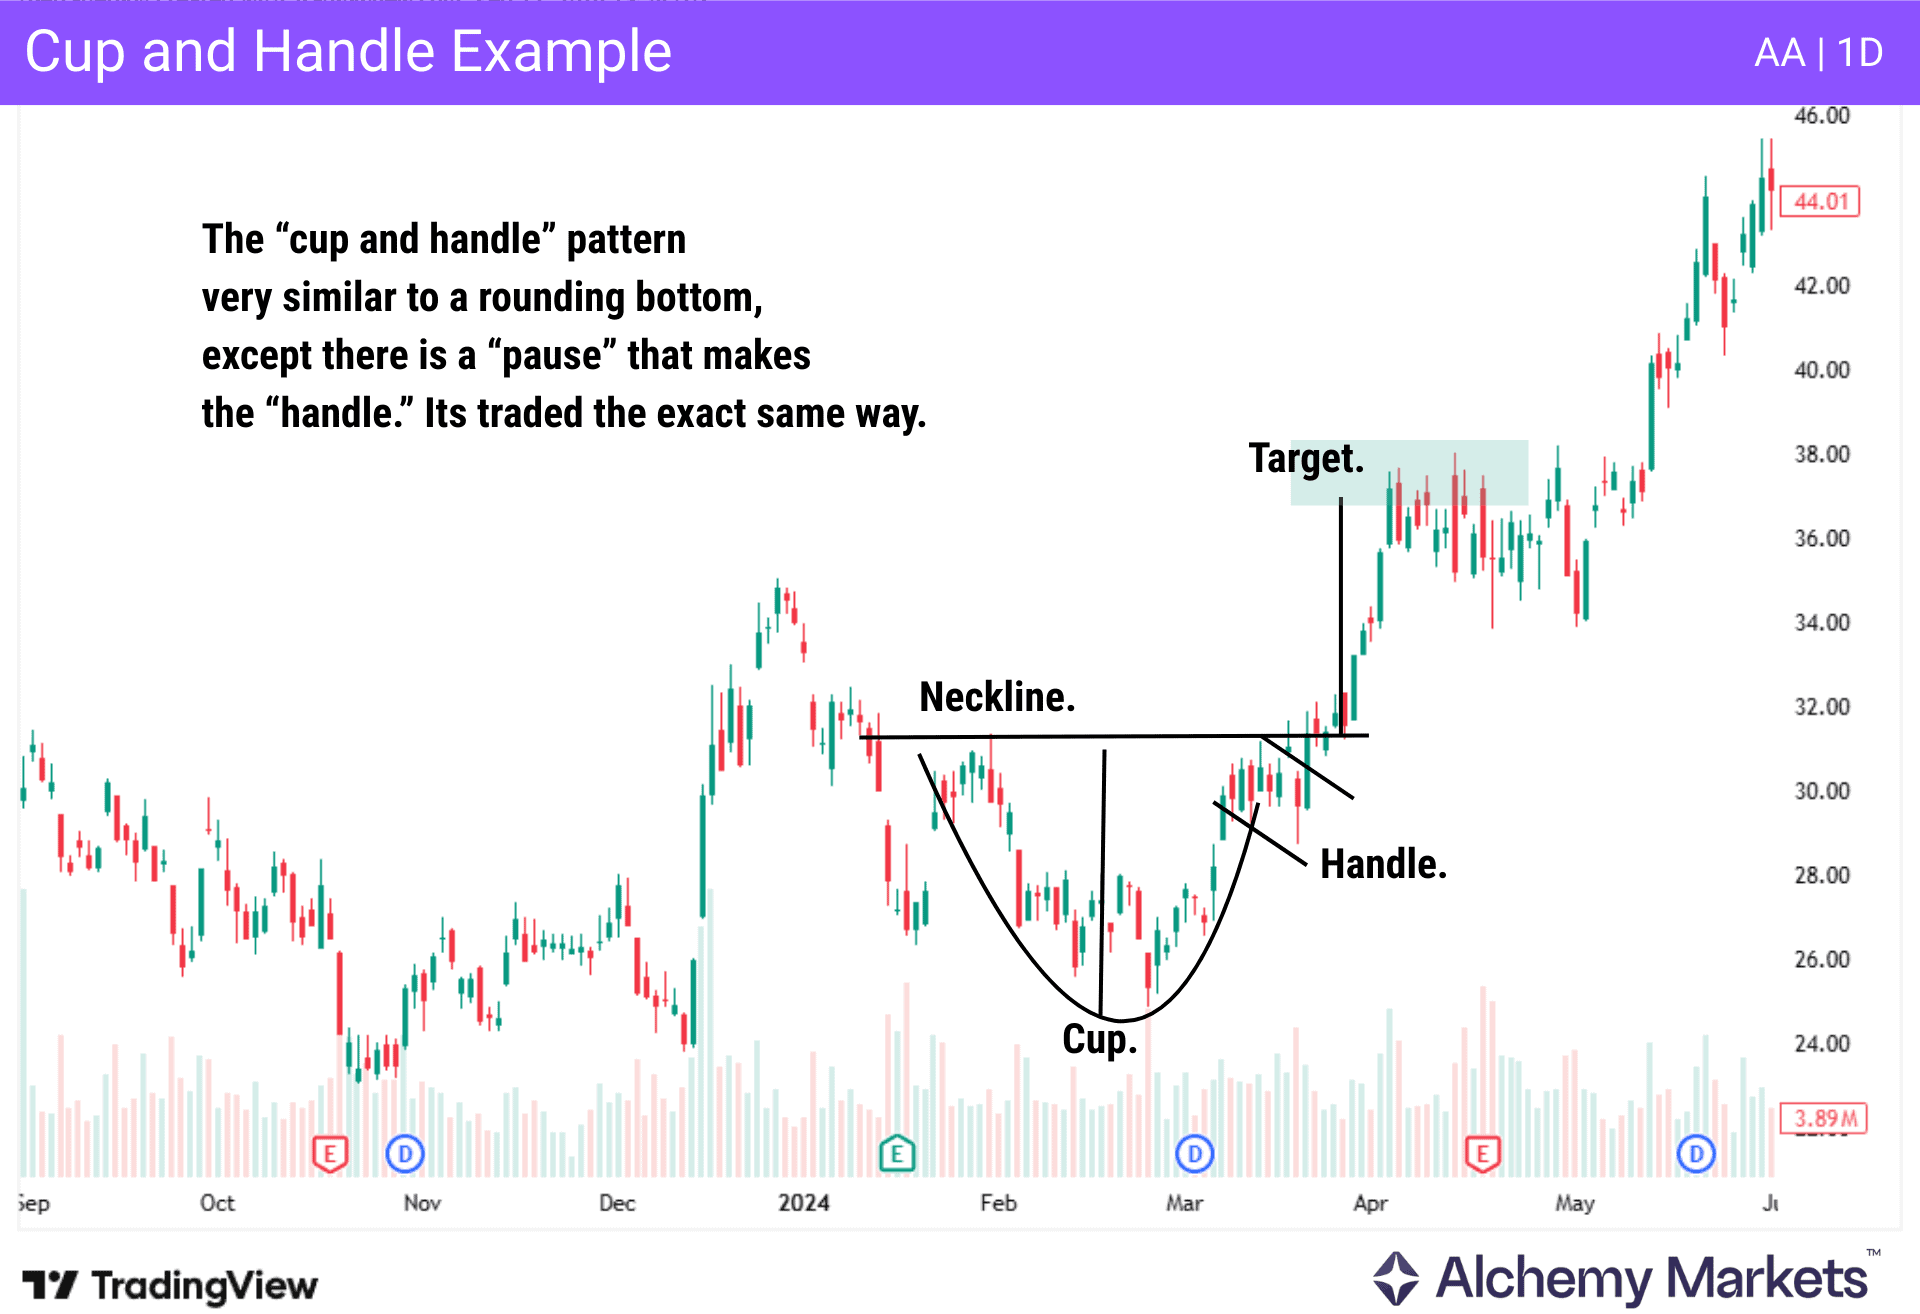
The rounding bottom chart pattern is very similar to the cup and handle pair, as both are a reversal chart pattern, and both take some time to form completely. The difference is that at the end of the rounding bottom, there is a bit of tighter consolidation, where the market then tries to build upwards pressure, in what looks a bit like a channel. This is the “handle” part of the cup and handle pattern.
The breakout point of the consolidation and handle is confirmed if trading volume picks up as well. Think of it as the same thing as a rounding bottom, but with a slight hesitation. However, once can use the bottom of the handle area as the place to put a stop loss. The measured move is still the height of the pattern, just as in the rounding bottom itself. The only real difference would be the breakout point used to signify the bigger move.
Rounding Bottom vs Triple Bottom
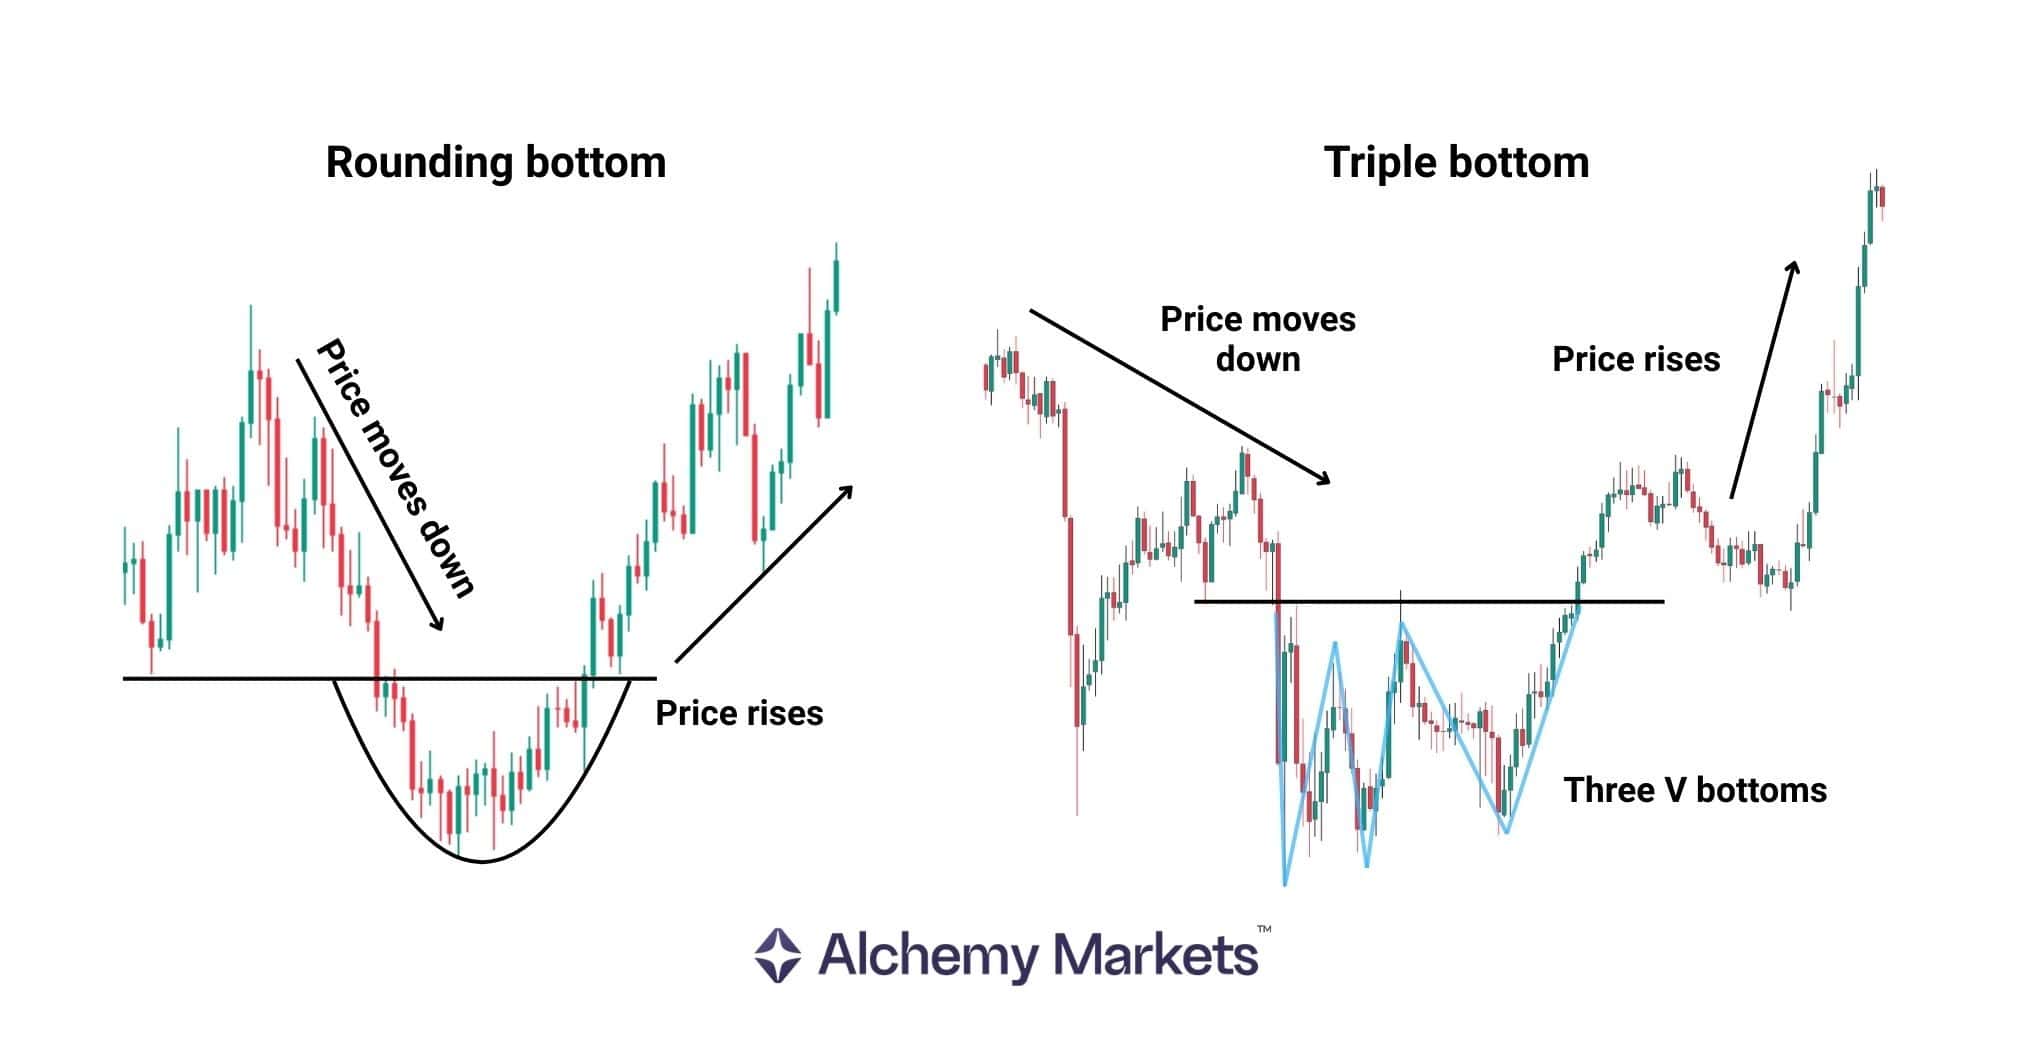
The rounding bottom chart pattern and the triple bottom are positive market reversal patterns, with the rounding bottom coming into itself over time. The trading volume can be fairly flat in the middle of it, but at the end, you are looking for the trading volume to pick up, as price breaks the neckline at the top.
The triple bottom pattern is three V-shaped moves in a row. This shows that there are a lot of buyers willing to step into the market, but the volatility is a bit of a concern, as there are sudden drops as well.
This is in stark contrast to the rounding bottom chart pattern, as there is a certain amount of confidence in a market that takes its time in changing the market sentiment, and produces this chart pattern, especially with trading volume suggesting a sudden bullish intent of traders.
Rounding Bottom Pattern in Crypto Trading
In crypto trading, rounding bottoms often appear after extended downtrends or long consolidation phases. Unlike the forex market, where volume data can be fragmented across brokers, cryptocurrencies trade on exchanges that provide clearer volume metrics.
This means traders can often observe a rounding bottom forming alongside gradually rising volume, reinforcing the idea that accumulation may be taking place as selling pressure fades and buyers quietly step in.
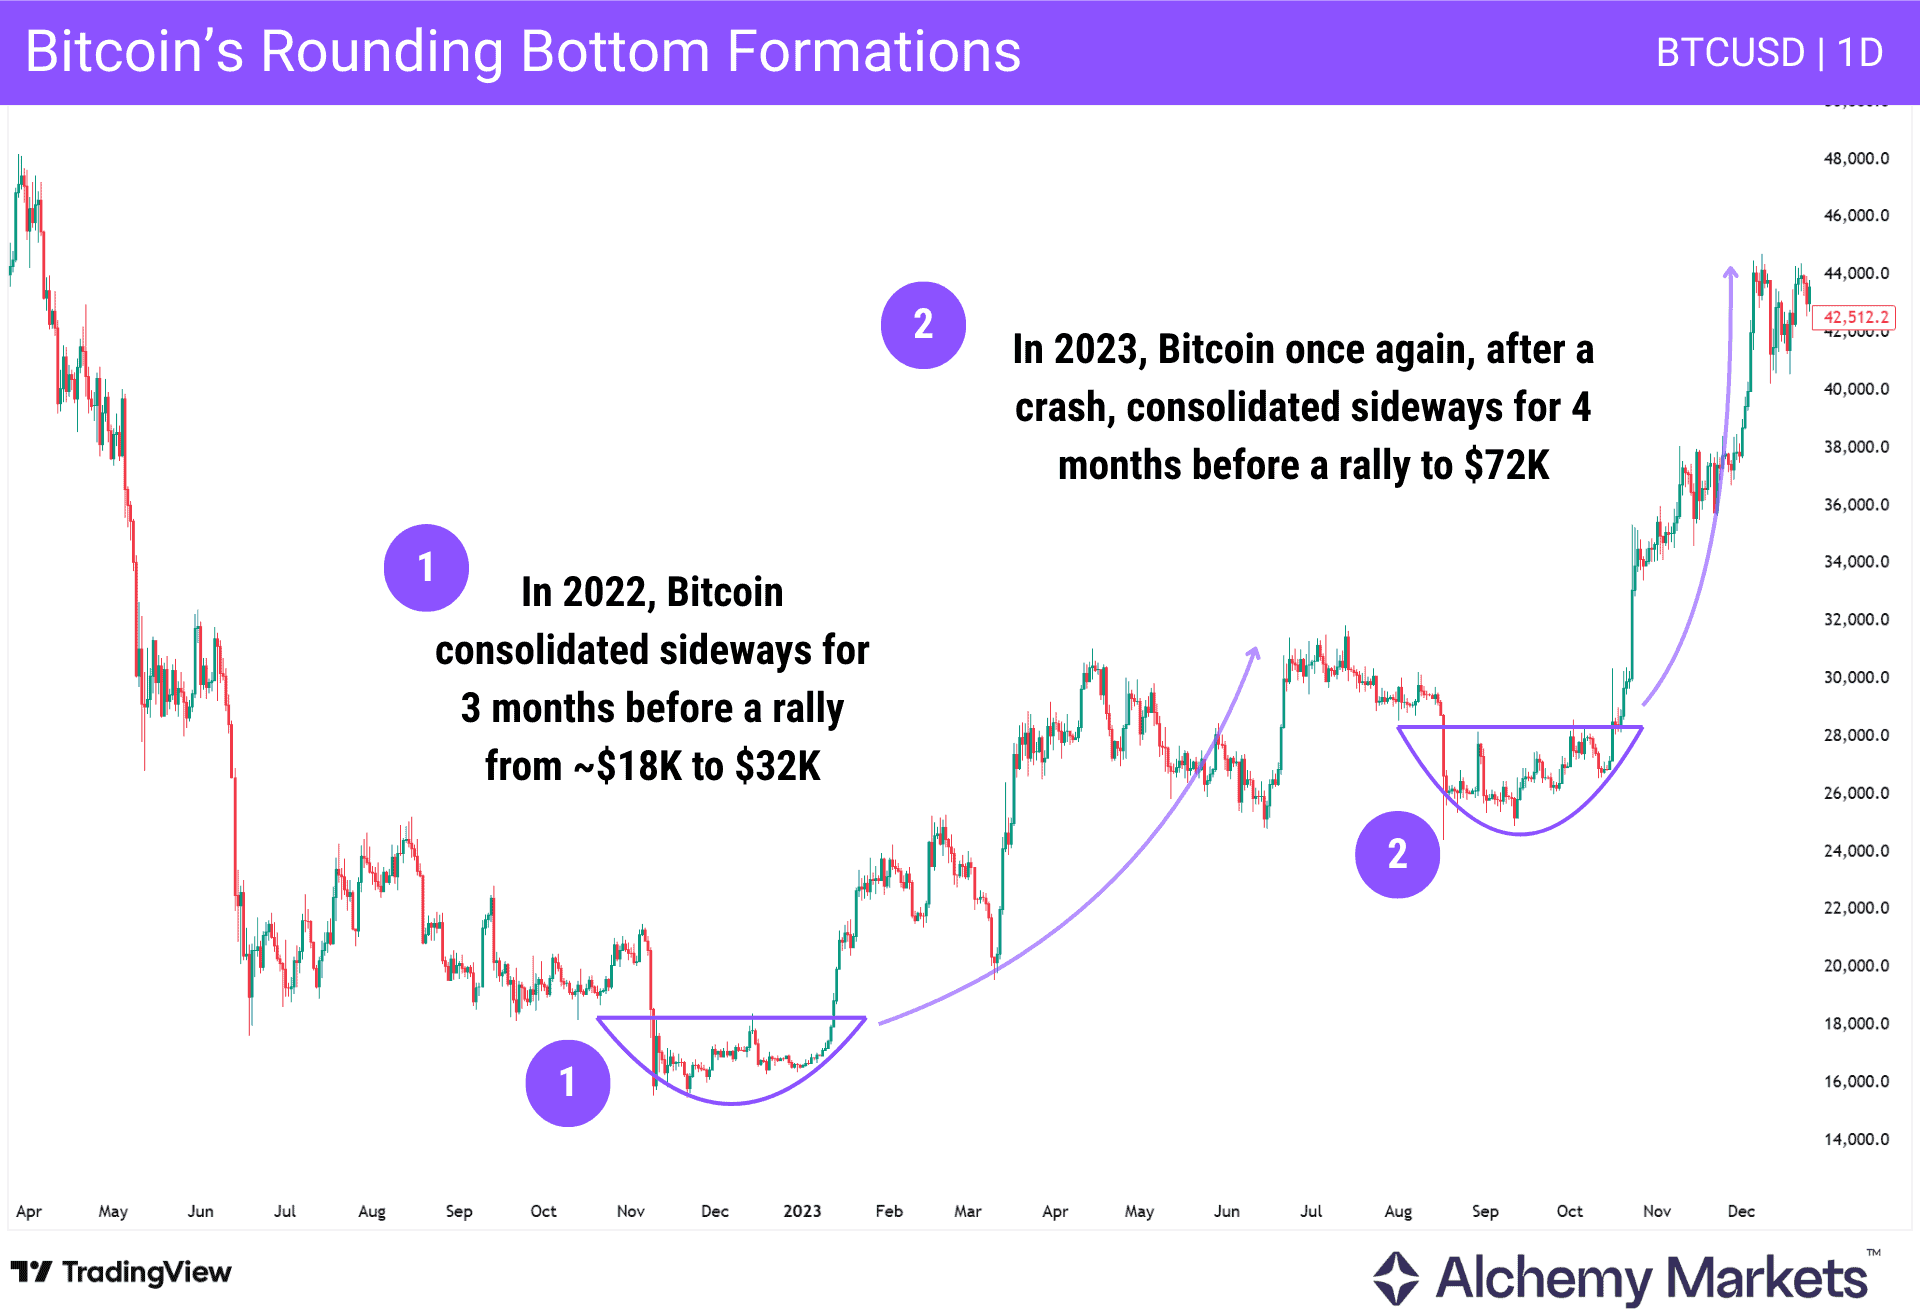
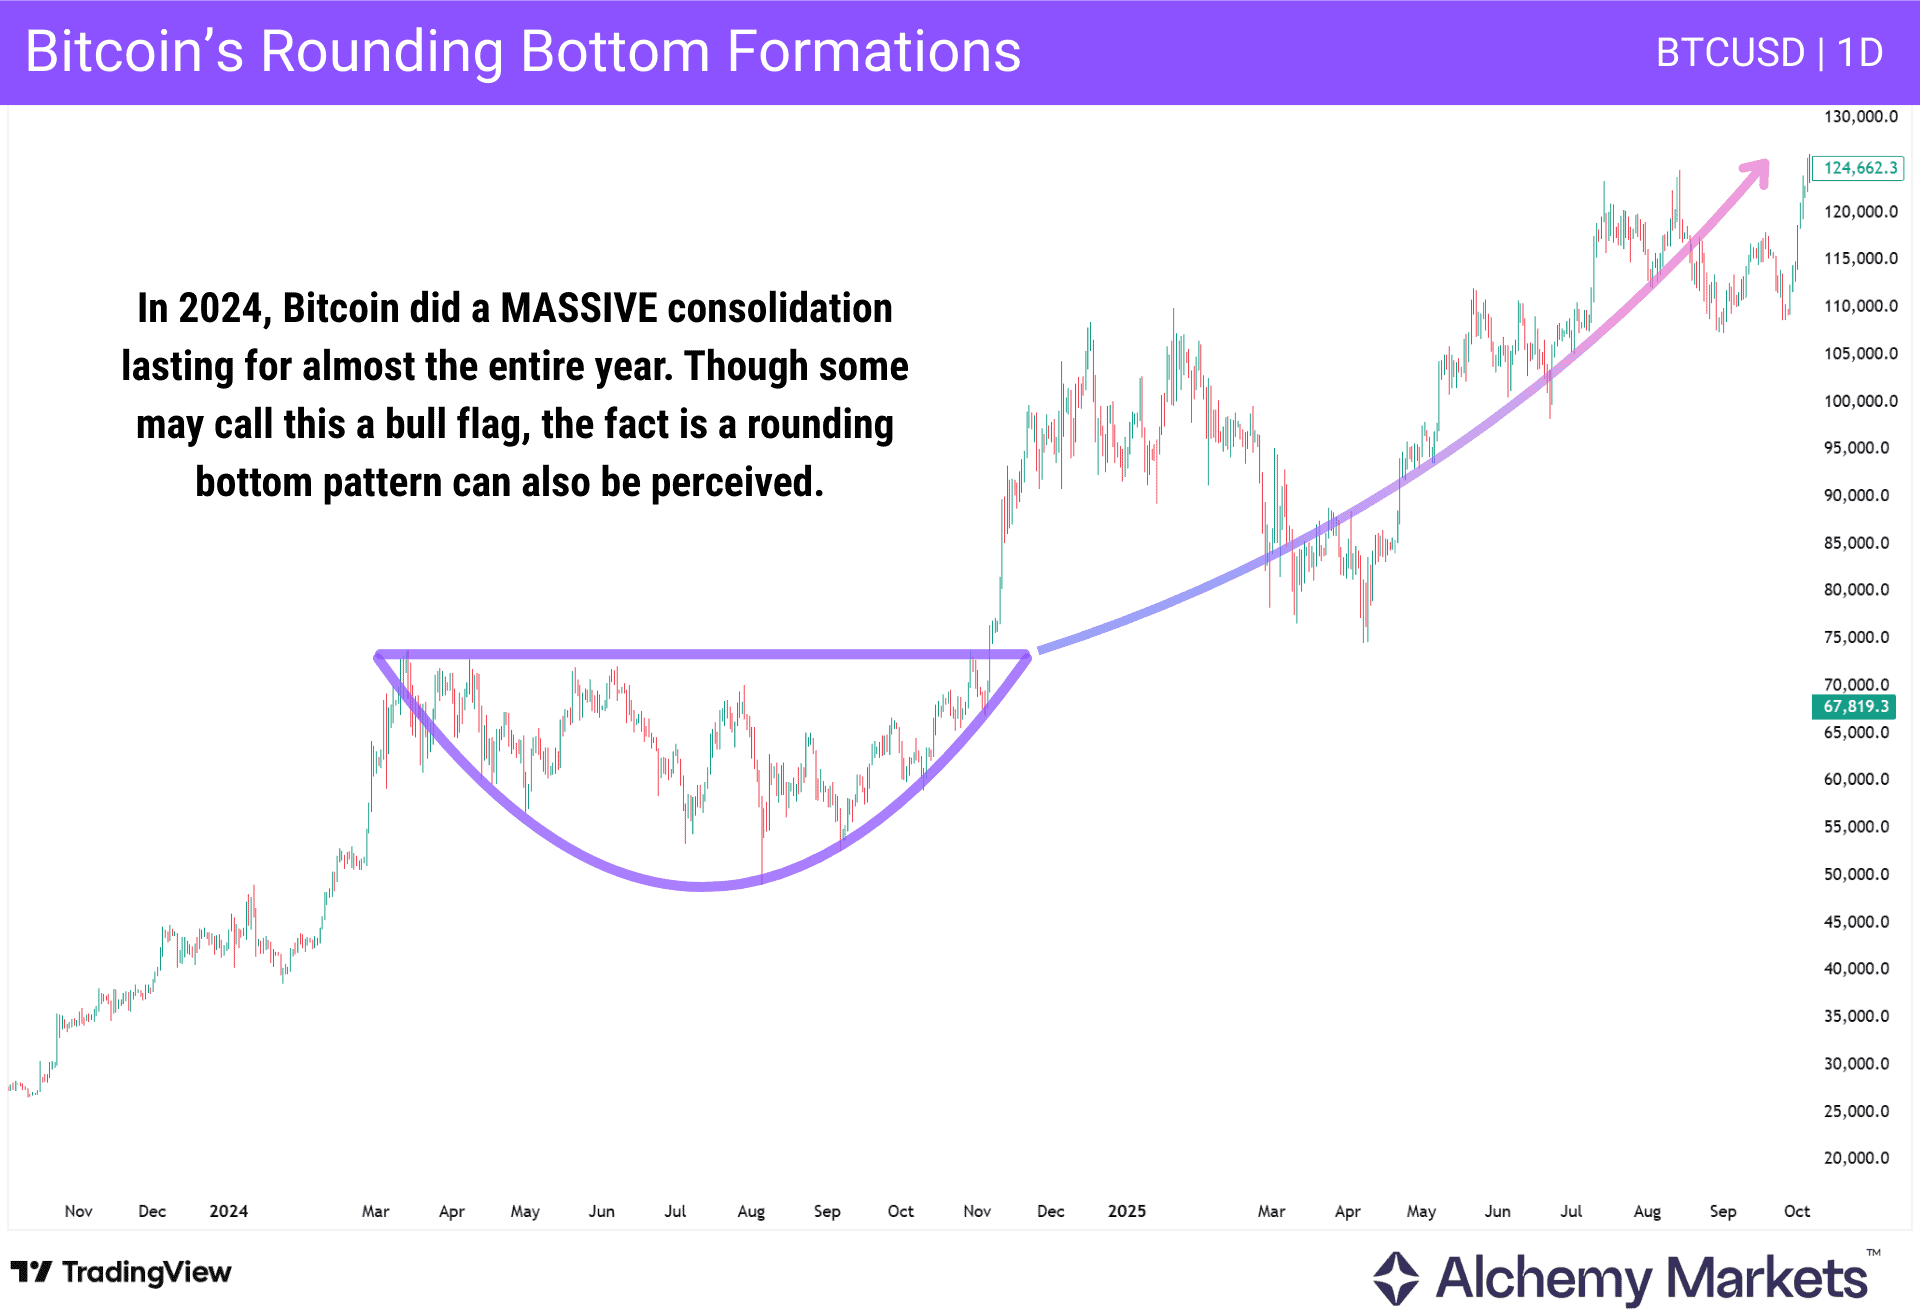
Bitcoin, for example, has repeatedly formed broad rounding bottoms before major bullish cycles. In 2022 and early 2023, Bitcoin spent several months consolidating sideways after its bear market decline before eventually breaking higher into a strong recovery phase.
A similar structure appeared again leading into 2025, where Bitcoin traded in a prolonged consolidation range for much of the year before pushing toward new highs near $125,000.
Since Bitcoin acts as the primary driver of sentiment across the crypto market, similar structures often emerge in other cryptocurrencies (altcoins) as well.
When Bitcoin forms a large accumulation base, many altcoins tend to mirror that behaviour, building their own rounding bottoms before participating in the broader market rally. As a result, the pattern appears frequently across the crypto space during the transition from bearish phases to new bullish cycles.
FAQ
The rounding bottom pattern is fairly common and simple to spot, the rounding bottom pattern can bring up some questions, as traders are looking to utilize the pattern in a trading strategy.
What are the Common Rounding Bottom Pattern Mistakes to Watch out For?
There are a handful of common mistakes that traders can make trading the rounding bottom pattern, including:
- Risk management: There is a tendency of traders to ignore risk management when trading an obvious pattern.
- Rushing the trade: Sometimes, the pattern can cause traders to be a bit too aggressive when spotting this set up. Instead of waiting for the proper confirmation, they try to “frontrun” the trade, which can lead to chasing false signals.
- Confirmation signals: Trading this pattern without confirmation signals that are recommended can lead traders to thinking that consolidation is a rounding bottom.
- Ignoring the market environment: Traders will see the pattern, but ignore the fact that the market itself isn’t changing, as it is simply drifting.
What Is the Best Time Frame To Use for the Rounding Bottom Pattern?
As a general rule, you are going to find more success with longer-term charts, such as daily and weekly charts. However, there are some who can use this bottom pattern in shorter timeframes. Normally though, when someone is talking about the rounding bottom pattern, it is normally on at least the daily charts. It’s a common trading strategy for those looking to take advantage of “value” in the stock market and other financial assets.
How Do You Describe a Rounding Bottom Reversal?
A rounding bottom is a pattern that occurs over time. The pattern is a gradual shift in the attitude of market participants, after a sustained sell off. This bottom pattern will often be part of a larger trading strategy, as it is a fairly obvious pattern to spot.
A market falls, then slows down and loses volume, ideally. The pattern starts to form a convex pattern, with volume flattening out, as traders are simply bottoming. After some time, the market then breaks higher, preferably on higher volume, where it breaks the “neckline”, a level where resistance can be found. Traders measure the height of the pattern to determine the potential target.
Can a Rounding Bottom Pattern occur in both uptrends and downtrends?
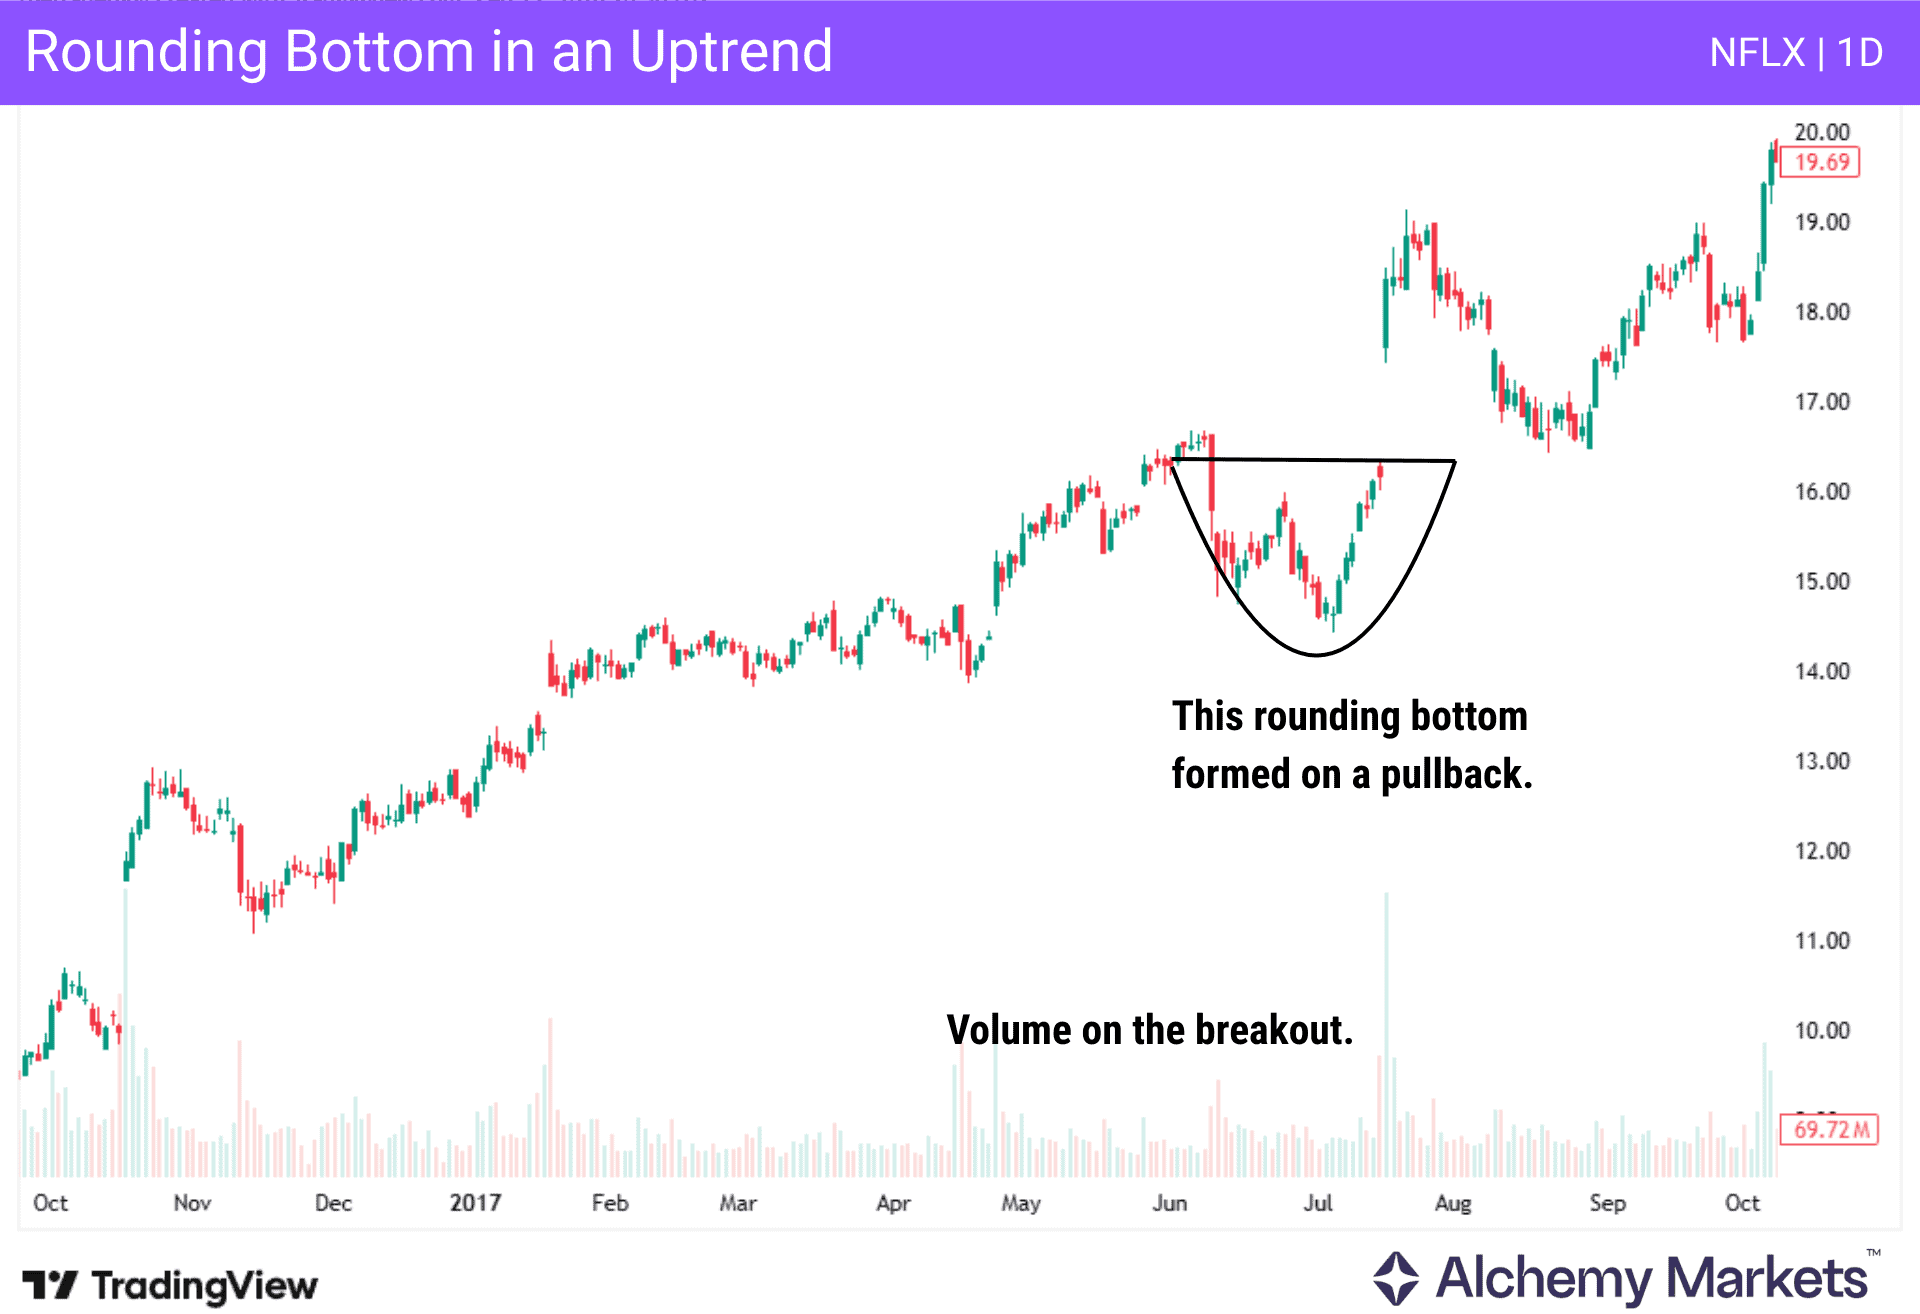
While at first glance, you may not think so, it is possible for a rounding bottom to occur in an uptrend, as it would be better classified as a “longer-term pullback” in an otherwise stronger upward trend. This is a common way to use this technical analysis pattern, as it shows a gradual shift to the upside to continue the buying pressure and longer-term trend.
Is the Rounding Bottom Pattern Bullish or Bearish?
The rounding bottom pattern is decidedly bullish. This can occur as a longer-term bottom pattern, or even as a break in the overall trend. There is an opposite pattern, the rounding top, that is bearish.
Can I Use the Rounding Bottom Pattern to Identify a Potential Bearish Trend?
No, this would be the opposite of what the pattern is used for. It shows that buyers are starting to gain a foothold in the market, and sellers are struggling.


