
- Elliott Wave
- October 3, 2025
- 2 min read
Crude Oil Elliott Wave: Slipping Lower Ending Diagonal Pattern
Executive Summary
- Crude oil has been declining since June in a final terminal wave.
- Crude oil appears to be nearing the end of its 2-year ending diagonal pattern.
- Downside targets are between $51.77 – 57.38.
Earlier this week, Crude Oil’s price dropped below a support shelf at $61.45 trading down to a temporary low of $60.40. The downside trend appears to be incomplete.
Current Elliott Wave Analysis
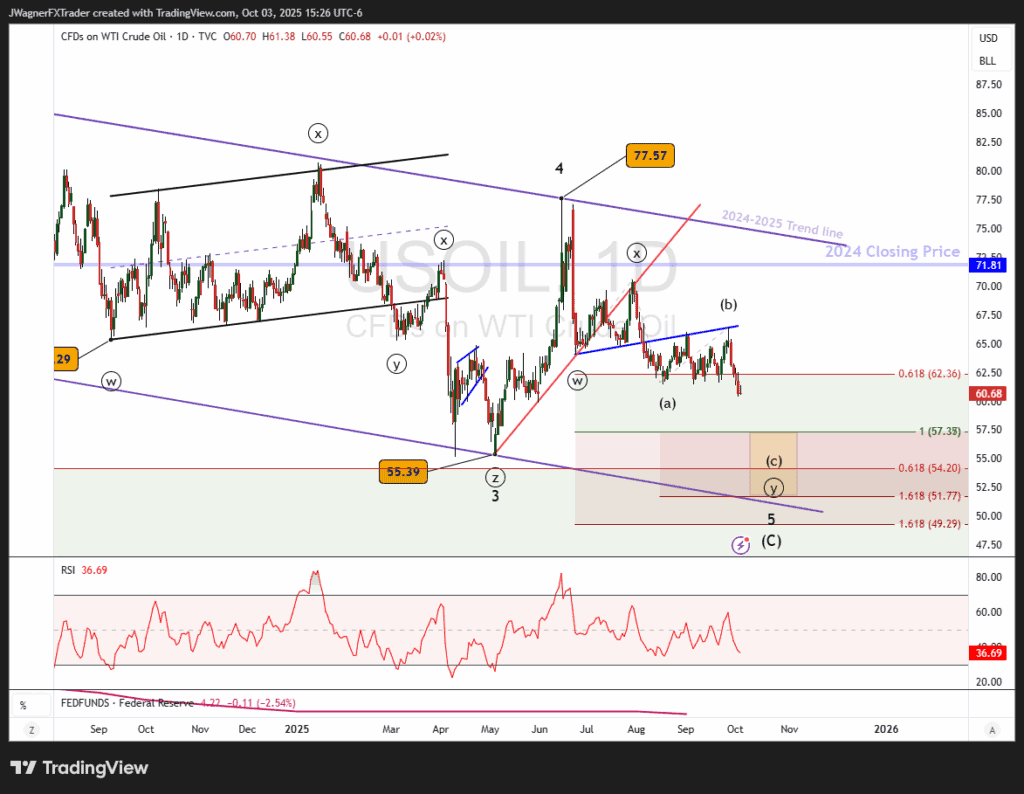
We are tracking a large ending diagonal pattern in Crude oil that began 2 years ago in September 2023. The ending diagonal is one of the five basic Elliott wave patterns and is shaped like a falling wedge.
Ending diagonals develop in five waves and four of those waves are complete. Each of the waves would form as a zigzag or multiple zigzag pattern.
Zooming in on the current wave 5, it appears a double zigzag pattern is developing and crude oil prices are currently in wave (c) of ((y)) of 5.
The decline below the support shelf at $61.45 should continue to work lower.
There is a cluster of wave relationships, using the Fibonacci extension tool, appearing between $51.77 – $57.38 (yellow box).
- Wave ((y)) = ((w)) at $57.38
- Wave (c) = (a) at $57.37 and 1.618 x (a) at $51.77
- Previous wave 3 low at $55.39
- Wave (C) = 0.618 x (A) at $54.20
Bottom Line
Crude oil appears to be nearing the end of a large ending diagonal pattern that began September 2023. We estimate a downside target, using Elliott wave principles, to be $51.77 – 57.38
If Crude oil rallies above $67, then we’ll need to reconsider the Elliott wave count. Until then, we are focused on an incomplete bearish pattern that may drive prices below $57.38.