Written by:

- Opening Bell
- September 1, 2025
- 3 min read
Volatility Warning: Tariffs Ruled Illegal by Federal Courts
Last week, a federal appeals court dropped a bombshell: it ruled the current tariff regime illegal. Yet in the same breath, it left those tariffs in force until either the Supreme Court rules or mid-October deadlines kick in.
That means companies, investors, and traders are stuck in a paradox: the tariffs are wrong, but they’re still in effect. And the markets are thrown for a loop; “how do we prepare for this uncertainty?”
Here’s the basic rundown of what likely is happening in the short term:
- Corporates are slowing capex and hiring.
- Importers face a margin squeeze as they swallow higher costs.
- Traders read tariffs as inflationary, weighing on Fed cut odds.
- Capital rotates into financials, energy, and materials, leaving semis and Nasdaq tech as the weak links.
Let’s map those fundamentals onto the charts.
SPX Weekly Chart: Rising Wedge Under Pressure
Tariff anxiety has capped upside momentum in the S&P 500, but rotation into financials and energy is keeping the broader trend intact. The market is showing fatigue inside a rising wedge, but not yet breaking trend.
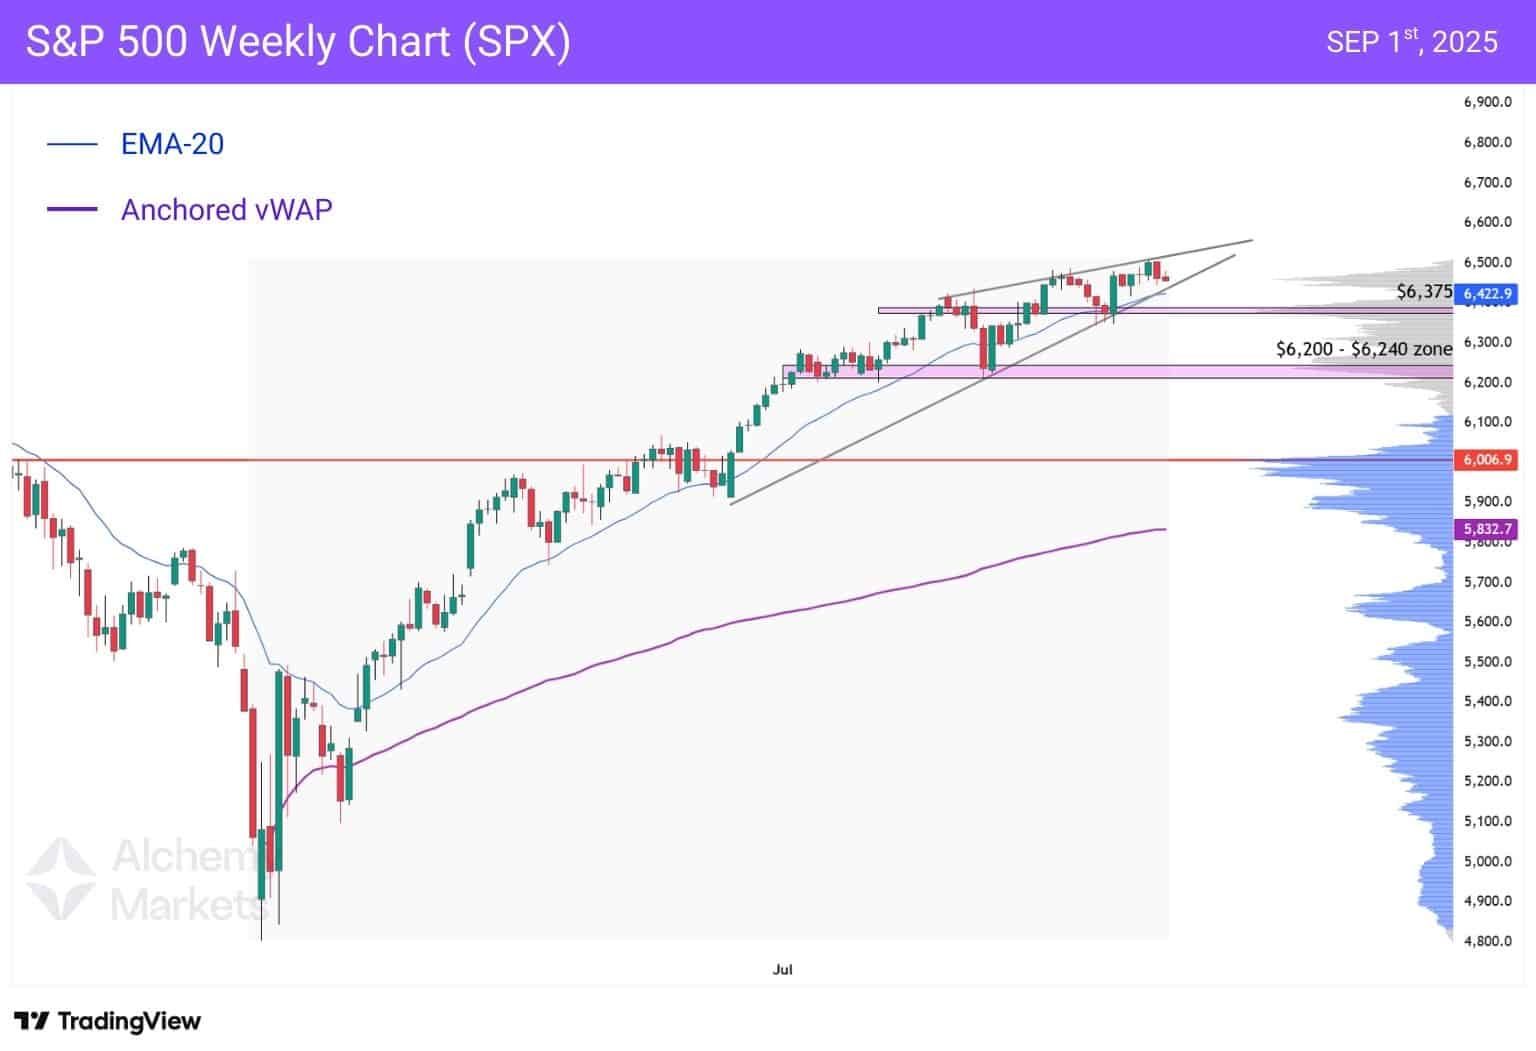
The S&P 500 remains inside a rising wedge, clinging to its uptrend but showing fatigue.
- Approx $6,422.9: The weekly EMA-20, which aligns perfectly with the trendline support of the wedge.
- $6,375 Zone: A high volume node and a prior support area.
- $6,200 – $6,240 Zone: A high volume node and prior consolidation zone.
- $6,006.9 Zone: The point of control (highest traded volume-price level) since the rally in April 2025.
RSP Daily Chart: Breadth Holding the Fort
Breadth is the counterweight to tariff volatility. While megacap tech chops sideways, equal-weight leadership shows money is still flowing across the market — signalling that rotation away from tech is in play (further supported by Nasdaq 100’s behaviour).
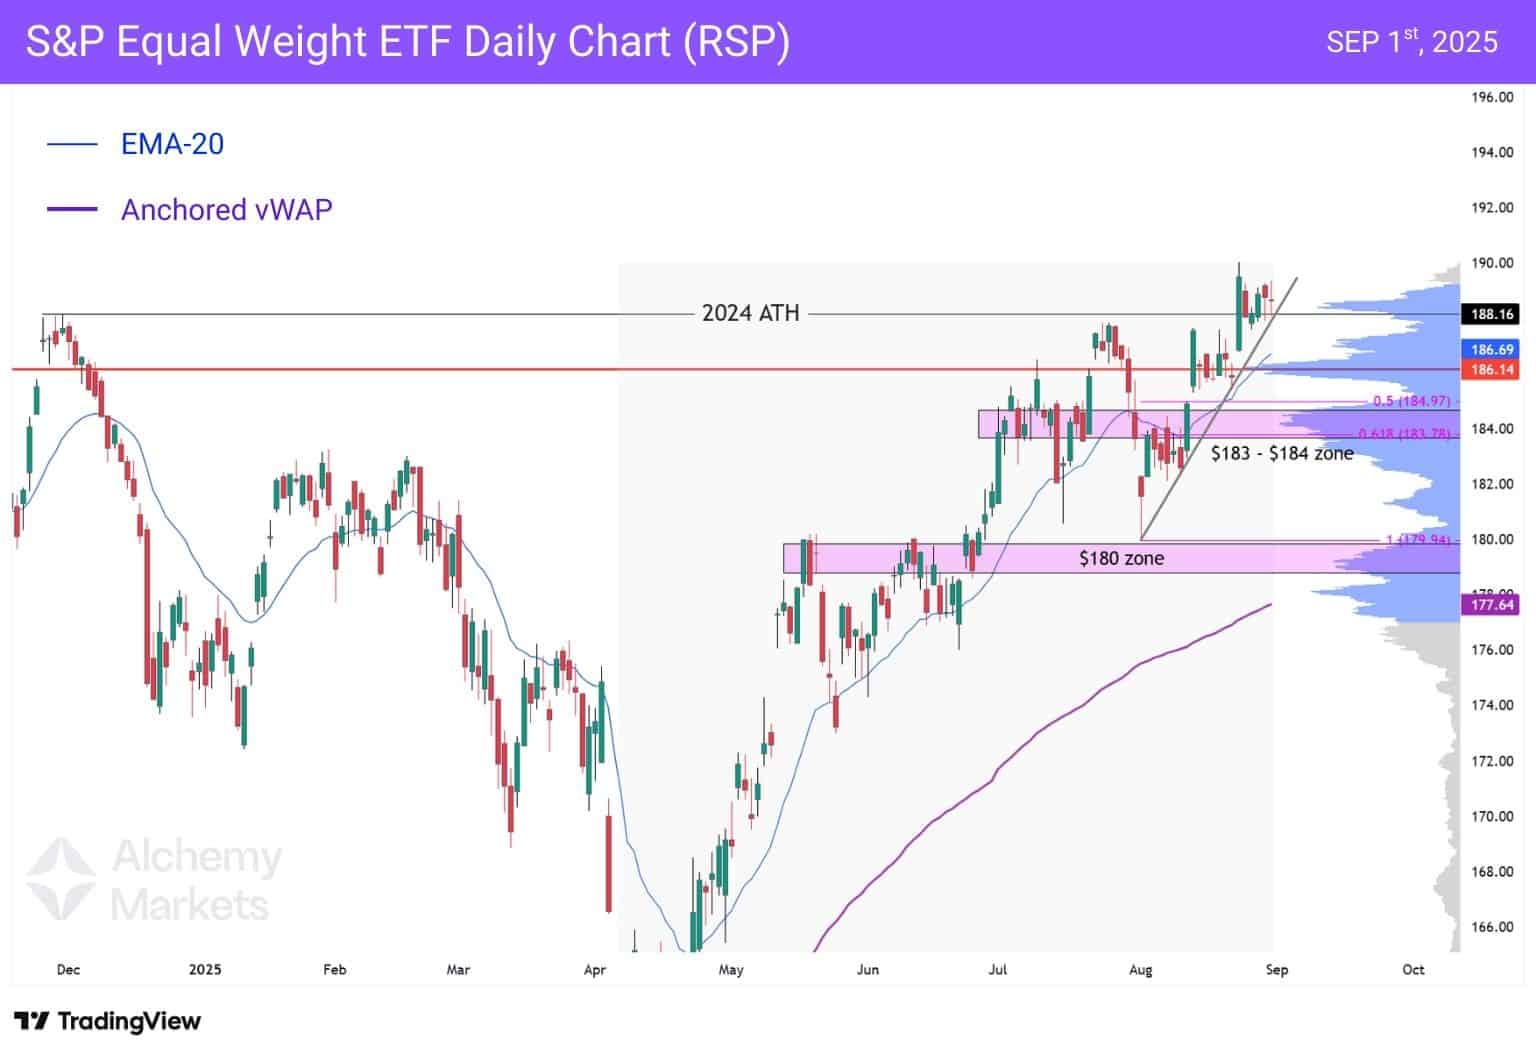
Breadth remains constructive, showing capital rotation even as megacap tech wobbles.
- $188 Zone: 2024 All-Time Highs area, could provide a bounce.
- $186.69 Zone: Daily EMA-200 price, aligns closely with the point of control.
- $183–$184 Zone: Golden pocket fib zone and high-volume shelf.
- $180 Zone: Line in the sand; losing it signals breadth failing as a buffer.
- $177.64.: Anchored VWAP support, key for holding current momentum — quickly approaching $180.
Nasdaq 100 Daily Chart (NAS100)
The Nasdaq’s tariff-sensitivity contrasts sharply with RSP’s resilience. Where RSP signals healthy rotation into financials and cyclicals, Nasdaq weakness underscores the pivot away from a tech focused stock portfolio.
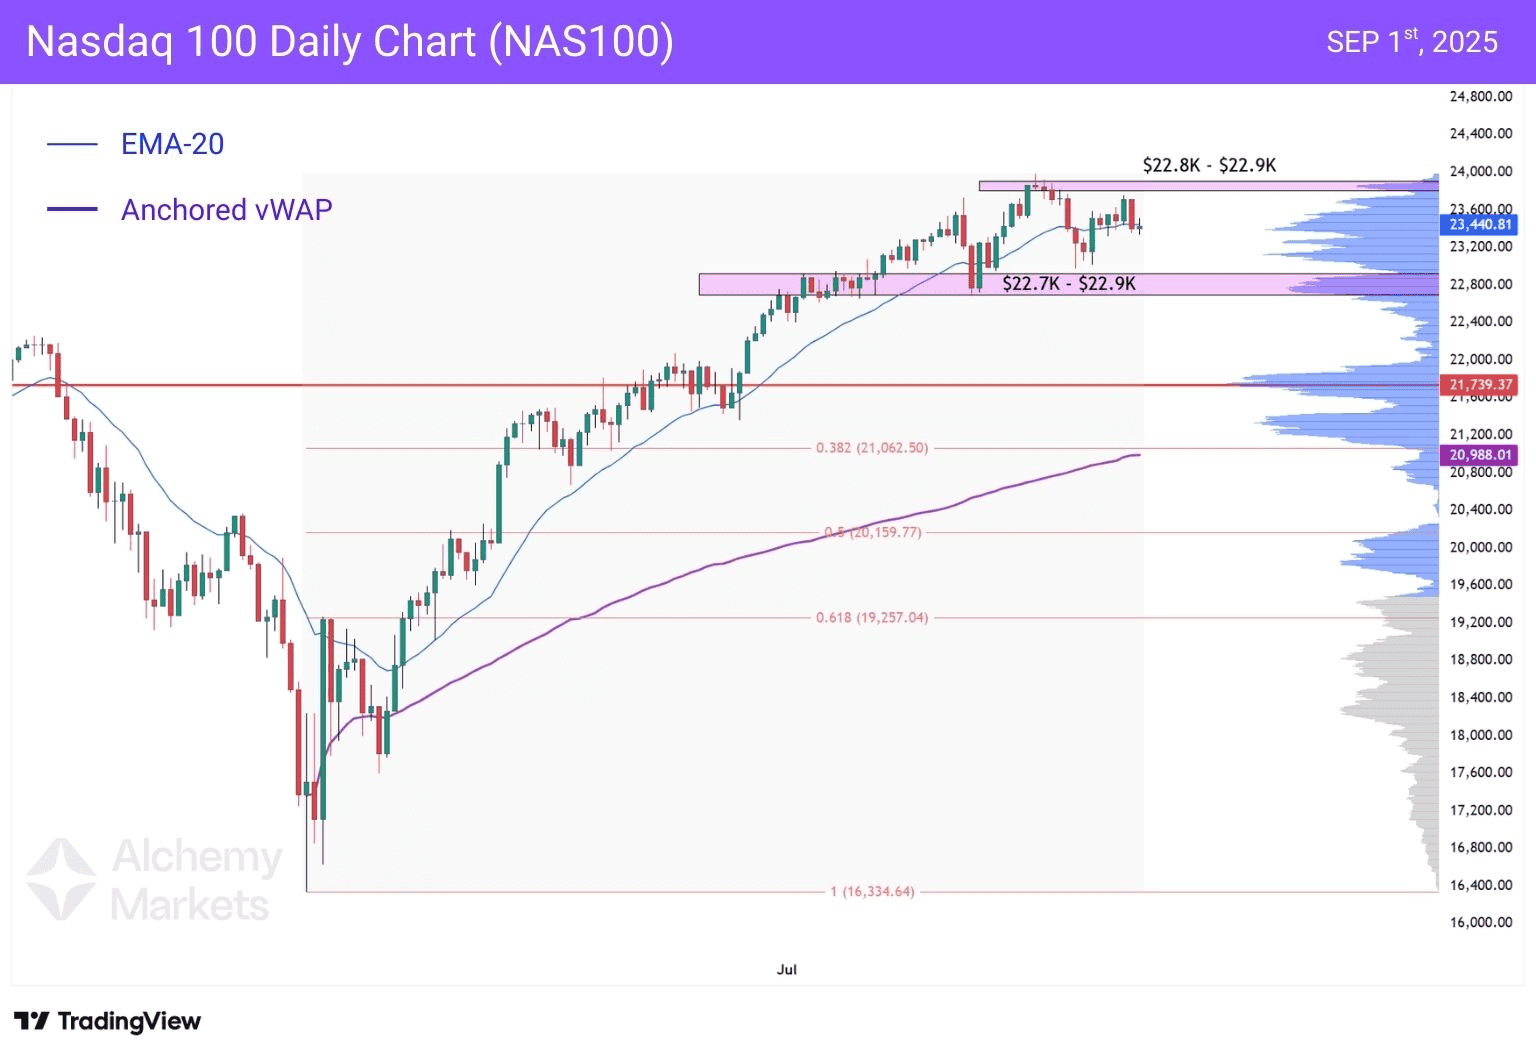
The Nasdaq sits at the frontline of tariff risk, with semiconductors and China-linked hardware carrying the weight. The index has stalled just under resistance, showing fragility compared to broader measures.
- $23,440.81: EMA-20; losing this tilts momentum back to sellers.
- $22.7k–$22.9k Zone: Wider consolidation zone; failure here exposes downside.
- $21,739.37: Deeper support and is the point of control.
- $21,062.50: The 38.2% fib support level which is now aligning nicely with the anchored vWAP.
What Else to Watch
- SOX (Semis): First tariff casualty if weakness deepens.
- XLF (Financials): Outperformance validates rotation.
- High-yield spreads (HYG/JNK): Widening = tariff risk bleeding into credit.
- DXY/CNH: Dollar strength and yuan weakness reflect tariff premium.
- Gold & Oil: Safe-haven demand (gold) and cost-push inflation optics (oil).
- IWM & Transports: Early warning if tariffs hurt domestic demand or trade flows.
Bottom Line
The courts have said tariffs are illegal, but markets must still trade them as law. That paradox is showing up across the tape: SPX wedging higher but capped, RSP breadth supporting dips, and Nasdaq dragging under tariff exposure.
Market uncertainties can make for a difficult week – so keep your eyes peeled for upcoming news announcements – and driving factors such as the PCE and ISM data this week.