Written by:

Reviewed by:

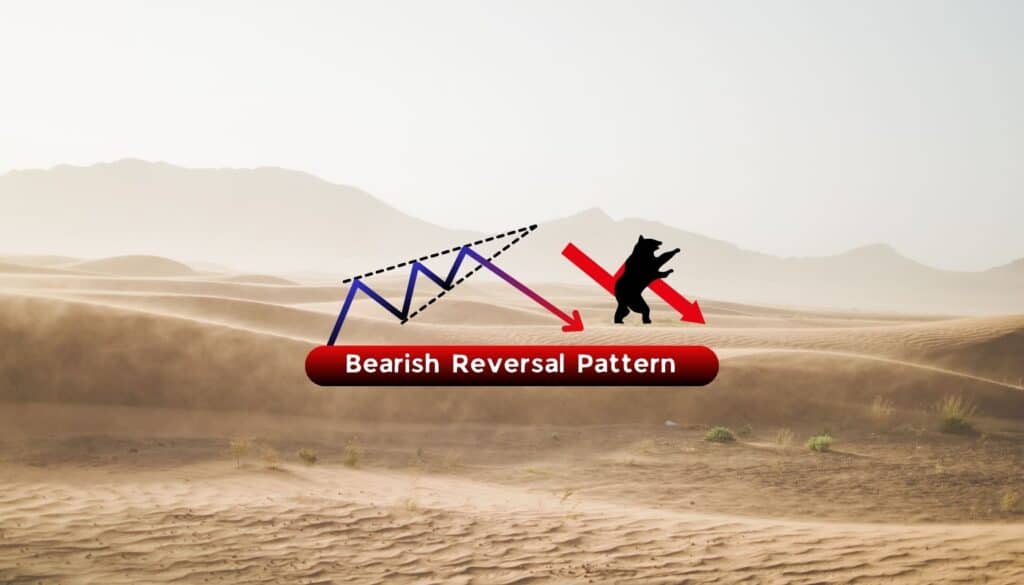
Bearish
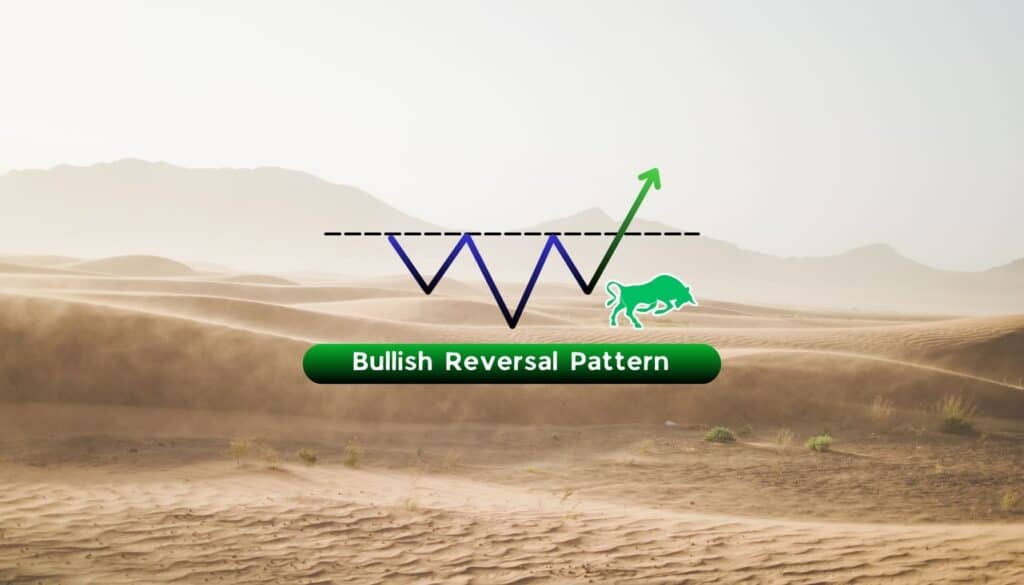
Bullish
- May 26, 2025
- 34 min read
Fair Value Gap (FVG) Trading Guide
What is a Fair Value Gap?
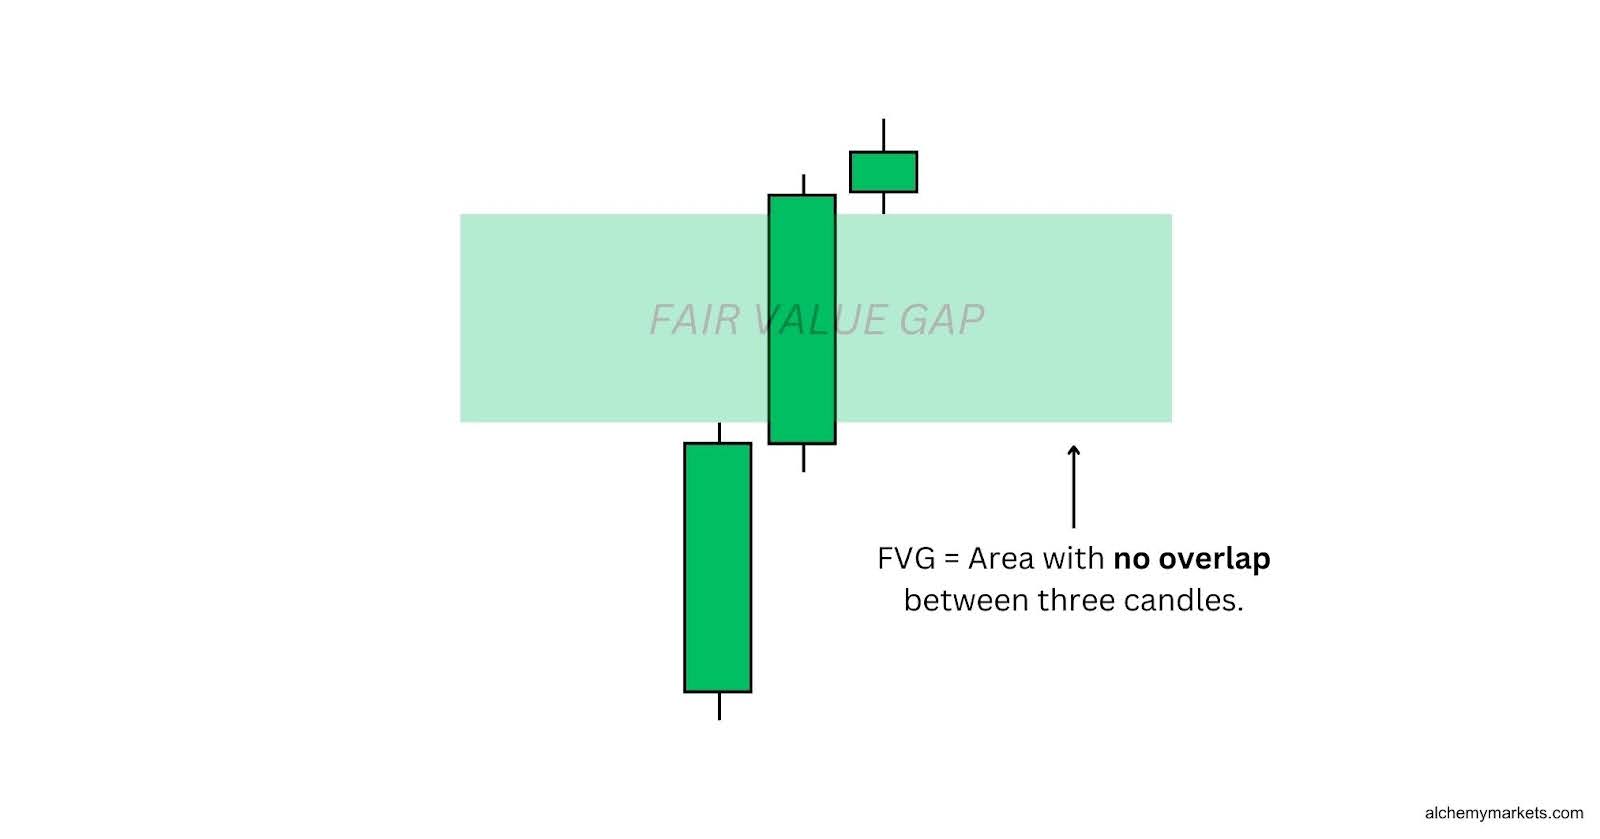
A Fair Value Gap (FVG) is a swift movement in price, visible with three candlesticks where the middle candlestick is strong and impulsive, creating a price zone that does not overlap with the first and last candle.
This means that, when looking for a fair value gap, we are not just observing the closing price, but also where the wicks of the first and third candle are in relation to the second candle. If the wicks are large, then it’s likely no gap is formed in between the candles.
What Does The Fair Value Gap Signal Mean?
The concept of Fair Value Gaps (FVGs) comes from a modern trading approach called Smart Money Concepts. Traders use this approach to anticipate how ‘smart money’—the big players with substantial trading volume—intend to move the market.
FVGs signal a significant market move, likely driven by smart money rather than the average retail trader, and they often indicate strength in the direction of the gap:
- If a FVG forms as the price rises, it suggests a bullish bias;
- If it forms as the price drops, it signals a bearish bias, as smart money may be pushing prices lower.
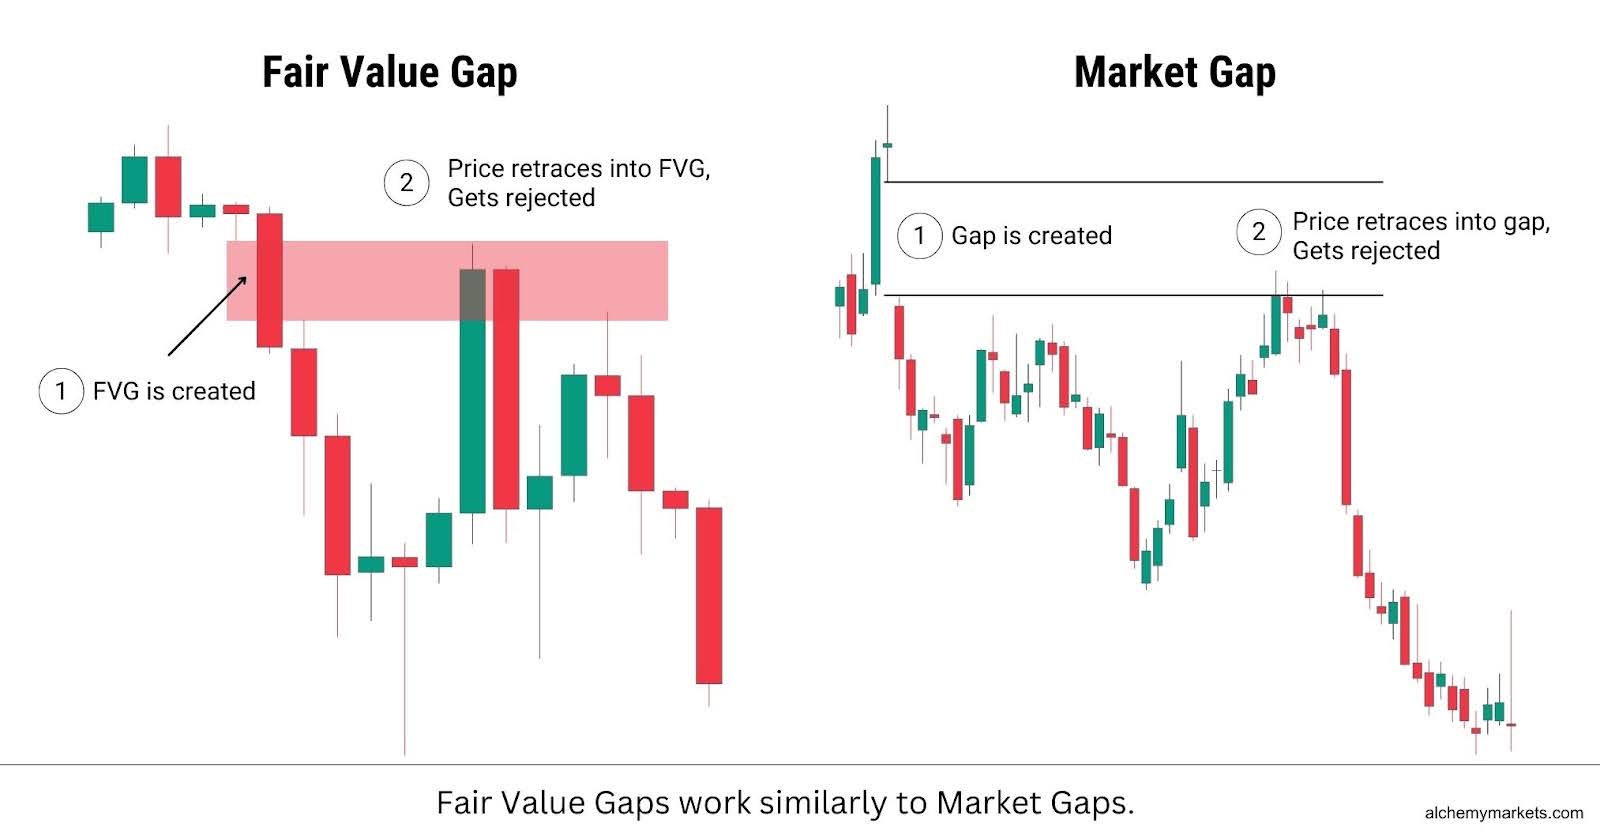
At its core, a Fair Value Gap is like a pocket of unfilled orders in the market. It acts like a market gap, where the price moves so fast that not all orders get filled within that zone. This is called an imbalance.
Traders believe that when the price revisits the FVG, those unfilled orders will get triggered, leading to a potential price reaction.
Think of it like reading through a book too quickly. Eventually, you realise you’ve missed some important details, so you flip back to fill in those “gaps” of information—just like how the market revisits an FVG to fill unfilled orders.
| Note: Fair Value Gaps do not always result in a price reaction, and only signals a higher probability for one. When a reaction does occur, its strength depends on the type of FVG formed, and how it aligns with the market’s overall trend. |
What Causes the Fair Value Gap?
A Fair Value Gap (FVG) forms when rapid buying or selling creates a dramatic three candle structure on the chart. This swift price change is often attributed to Smart Money injecting large volumes into the market. Therefore, should the FVG be revisited, Smart Money would theoretically step in and protect their buy or sell positions at the price zones.
Economic news or fundamental events can also be another factor in creating Fair Value Gaps, as they can entice large orders to come into the market; especially if the news announcement goes against market expectations.
Economic News and Announcements
Major economic news, such as inflation data, interest rate decisions, and employment data, can often give insights into how well an economy will perform in the future. While most news will not move the markets significantly, surprising news will. For example, if 90% of the market was expecting a rate hold, but the news of a rate cut was happening instead, it would cause traders and large institutions to quickly adjust their positions, causing a sudden flux of high trading volume.
Earnings Reports
For individual stocks, earnings reports can create sudden price movements if the reported figures (revenue, profit, guidance) differ sharply from forecasts. If institutional investors react quickly, the market may form an FVG.
Market Sentiment
Shifts in market sentiment, driven by risk appetite, geopolitical events, or central bank statements, can lead to aggressive buying or selling. If this shift happens suddenly, price moves away too quickly for the market to efficiently fill orders, leaving behind a Fair Value Gap.
Supply and Demand Imbalances
When demand far outweighs supply (or vice versa), price moves swiftly as buyers or sellers scramble to execute trades. This often occurs when liquidity is thin, such as during market open, after major announcements, or in trending markets with minimal retracement.
Large institutional deals
Big players, such as hedge funds and banks, execute large orders that may not be fully absorbed by the market at once. These bulk transactions can push price sharply in one direction, leaving a gap where liquidity was insufficient to provide a smoother transition.
Types of Fair Value Gap
A fair value gap can be bullish or bearish, depending on where it forms relative to the price. When the price is above the fair value gap as it forms, it is a bullish FVG. When it is below as it forms, it is bearish.
Bullish Fair Value Gaps
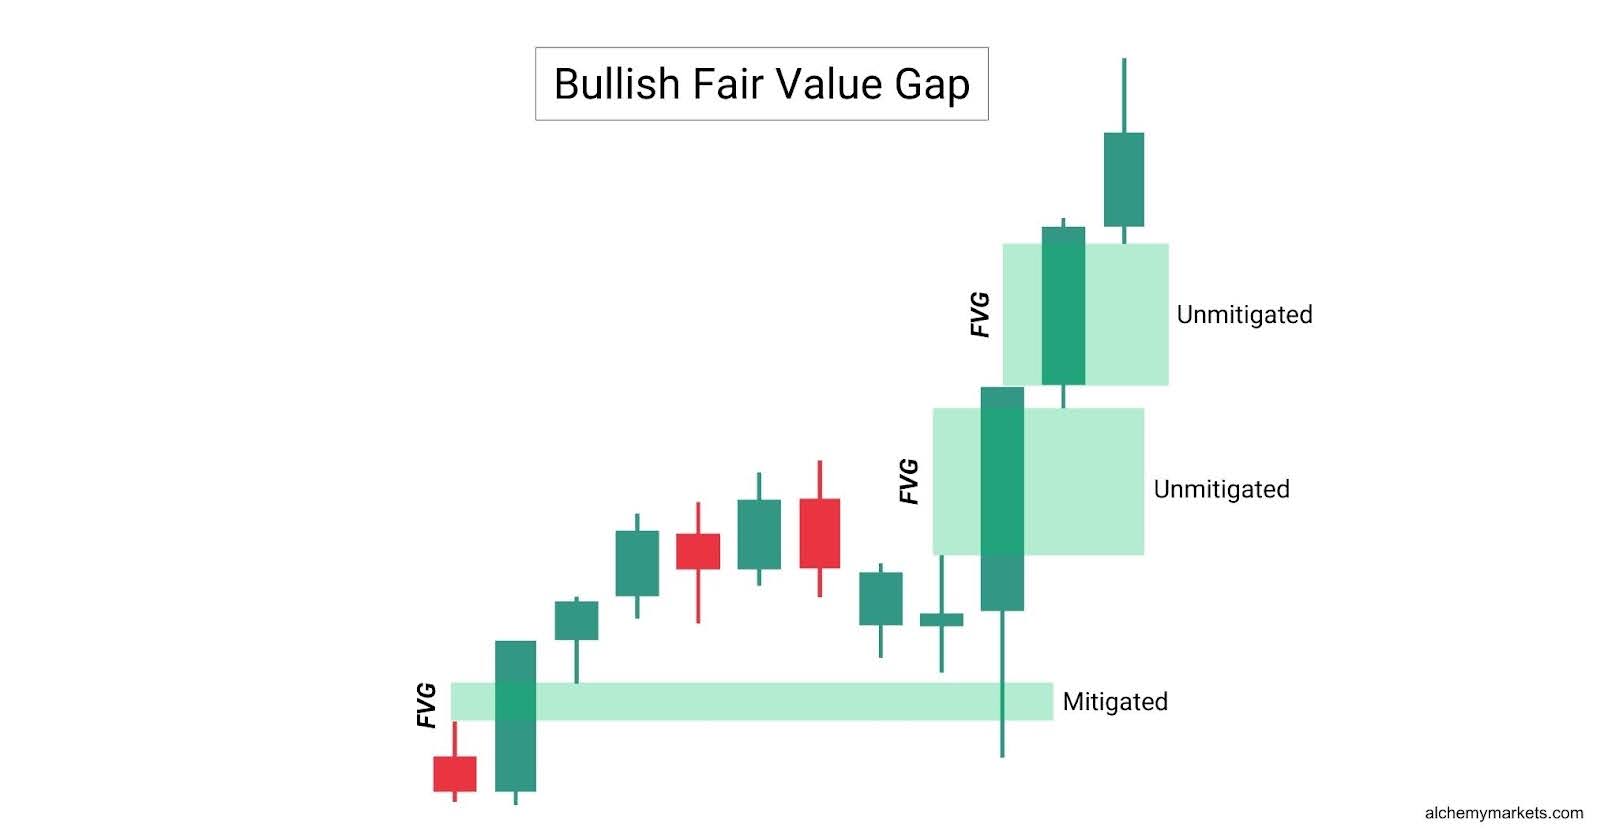
Bullish fair value gaps are formed when the price moves higher impulsively, creating the pattern in the process. This zone is then established as a secret support zone, where price may revisit and potentially bounce.
In Fair Value Gap (FVG) trading, the term “mitigation” refers to whether an FVG has been revisited:
- A fully mitigated FVG means price has filled the imbalance, reducing its reliability as a reaction zone for future retests.
- A partially mitigated FVG means price has tapped into the gap but not fully filled it, meaning it may still provide a reaction.
- An unmitigated FVG means price has not yet returned to the gap, keeping it fresh for a potential first reaction.
Since a FVG represents a cluster of active orders, a fully mitigated FVG means that the orders have already been triggered, making the FVG no longer valid as reliable support.
There are 4 types of bullish fair value gaps; each with a different formation and meaning.
Bullish PFG (Perfect Fair Value Gap)
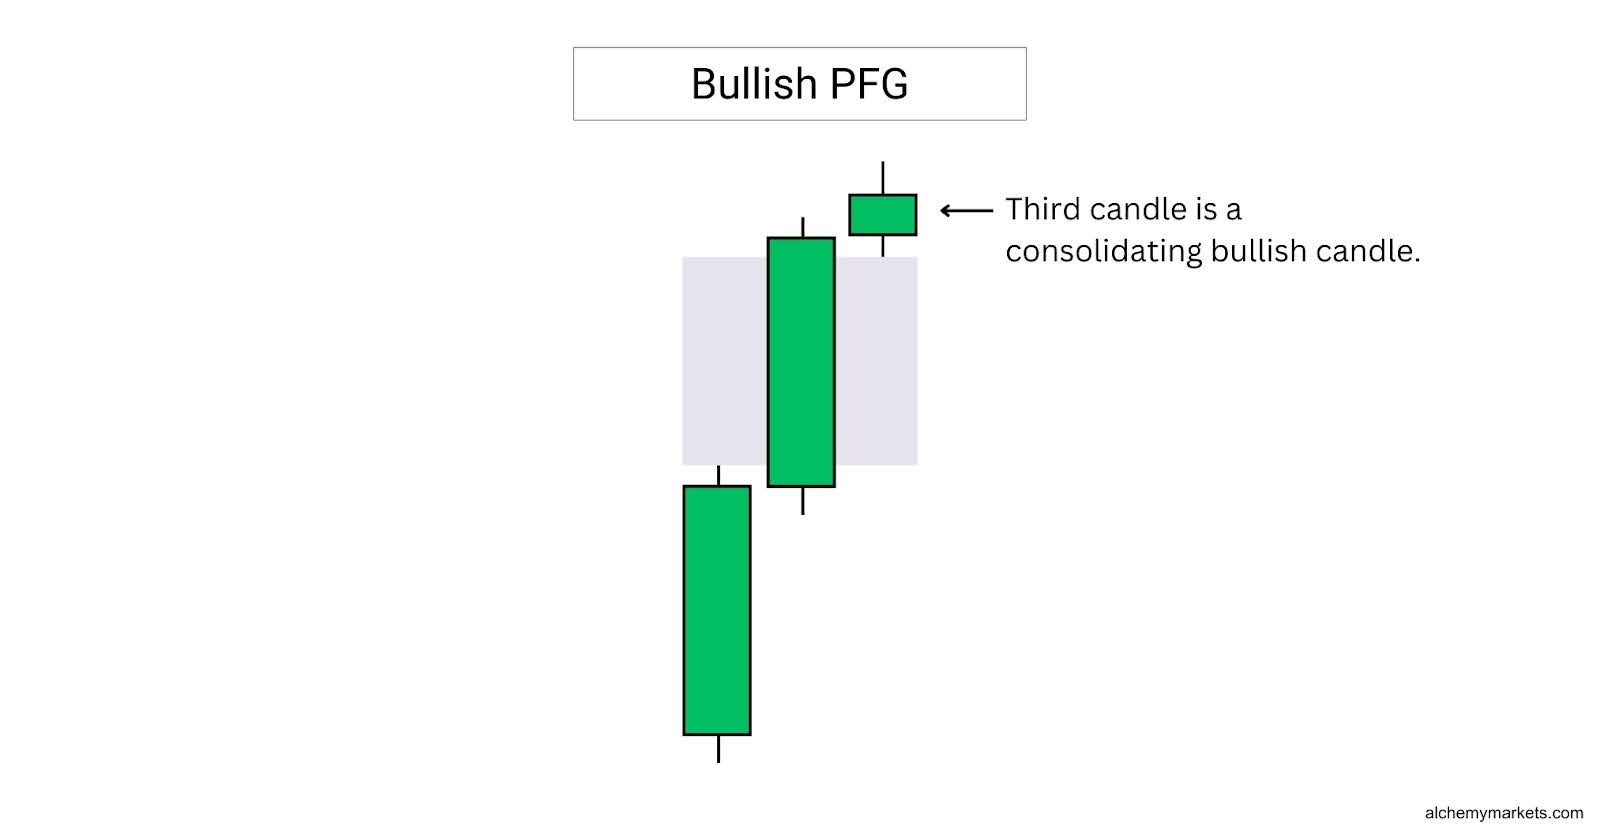
A bullish perfect fair value gap, or PFG, is formed when the third candle is a small, bullish consolidation candle. Note that the candle low is not below the previous candle’s closing price, validating it as a bullish PFG.
This implies a high chance for the fair value gap to be revisited in the immediate term, giving us a chance to enter a long position.
Bullish BFG (Breakaway Fair Value Gap)
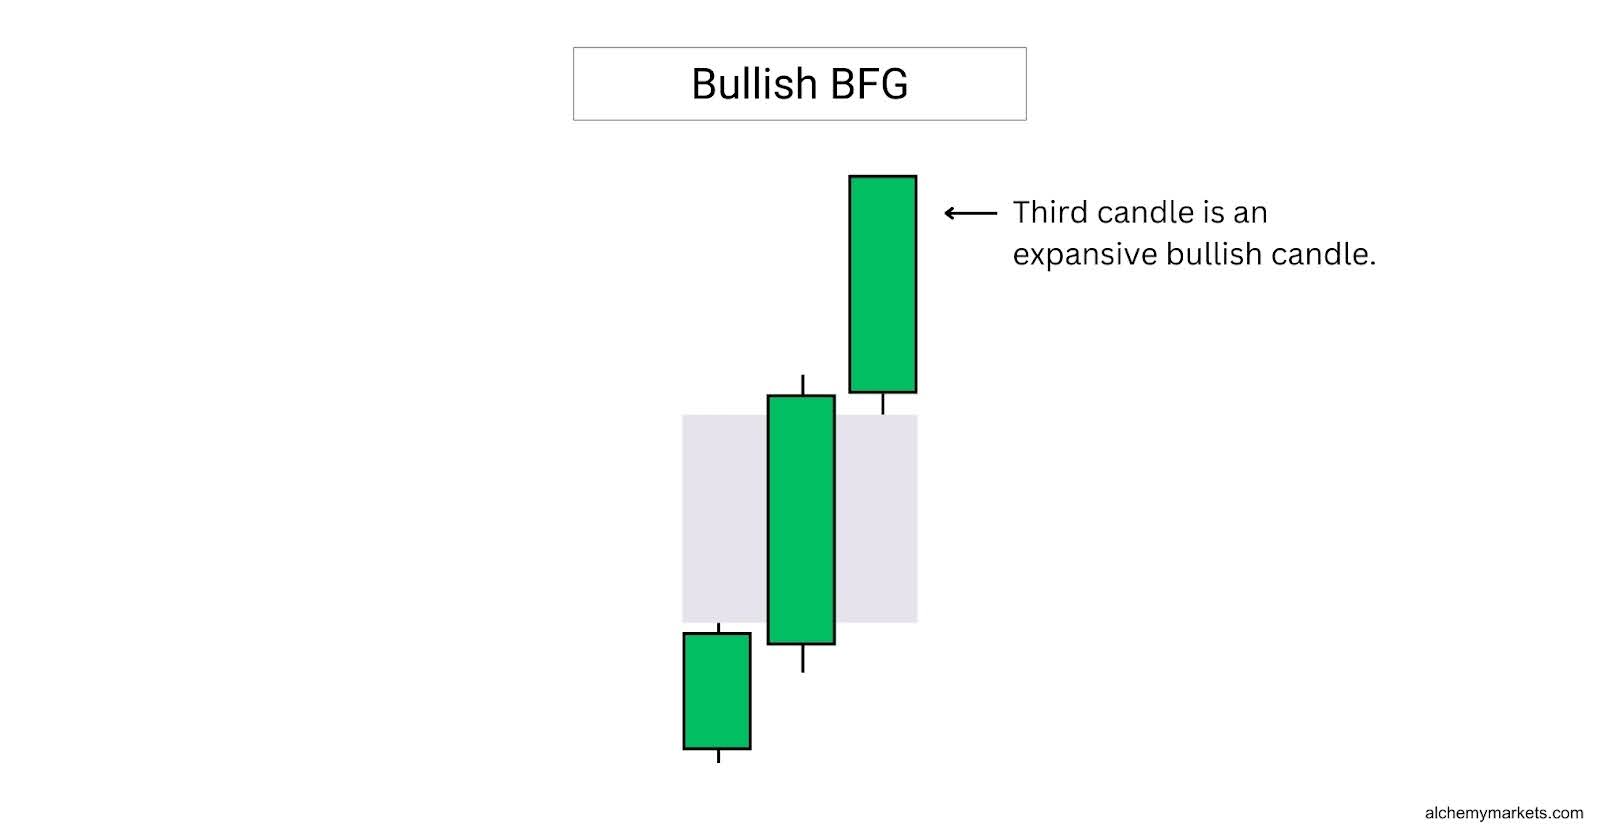
A bullish breakaway fair value gap, or BFG, is formed when the third candle is a large, expansive candle.
The third candle’s close in a BFG setup reflects strong directional momentum. Its size and wick can help validate the strength of the move.
Aggressive traders may consider entering a long position directly at the formation of this pattern, as price is unlikely to retrace in the short term.
Bullish RFG (Rejection Fair Value Gap)
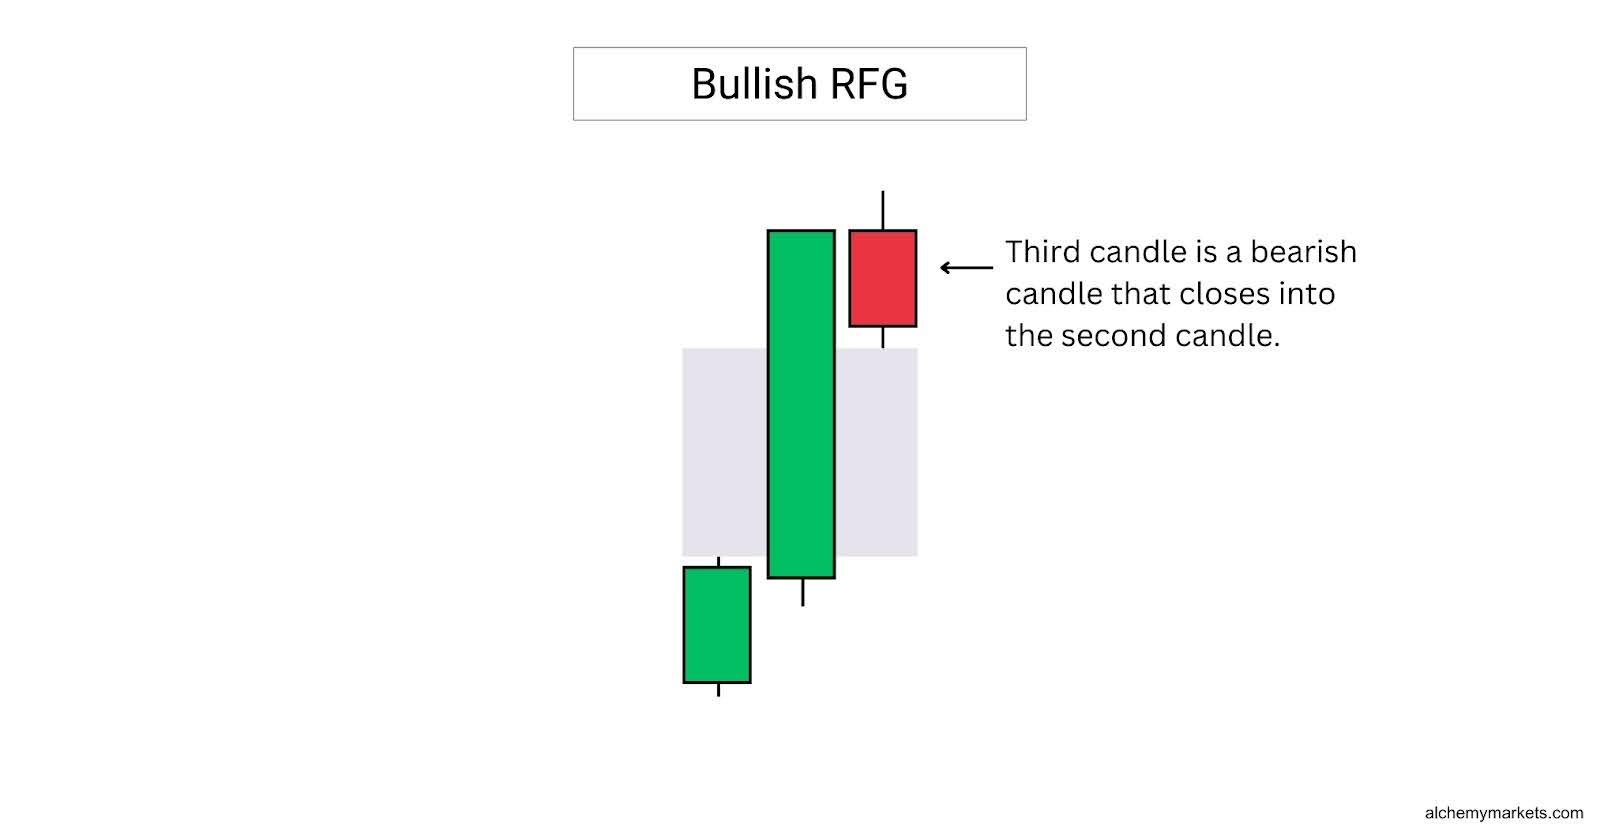
A bullish rejection fair value gap, or RFG, is formed when the third candle closes into the second candle. This implies weakening momentum, and signals a weaker fair value gap that is unlikely to hold as support.
Bullish IFVG (Inverse Fair Value Gap)
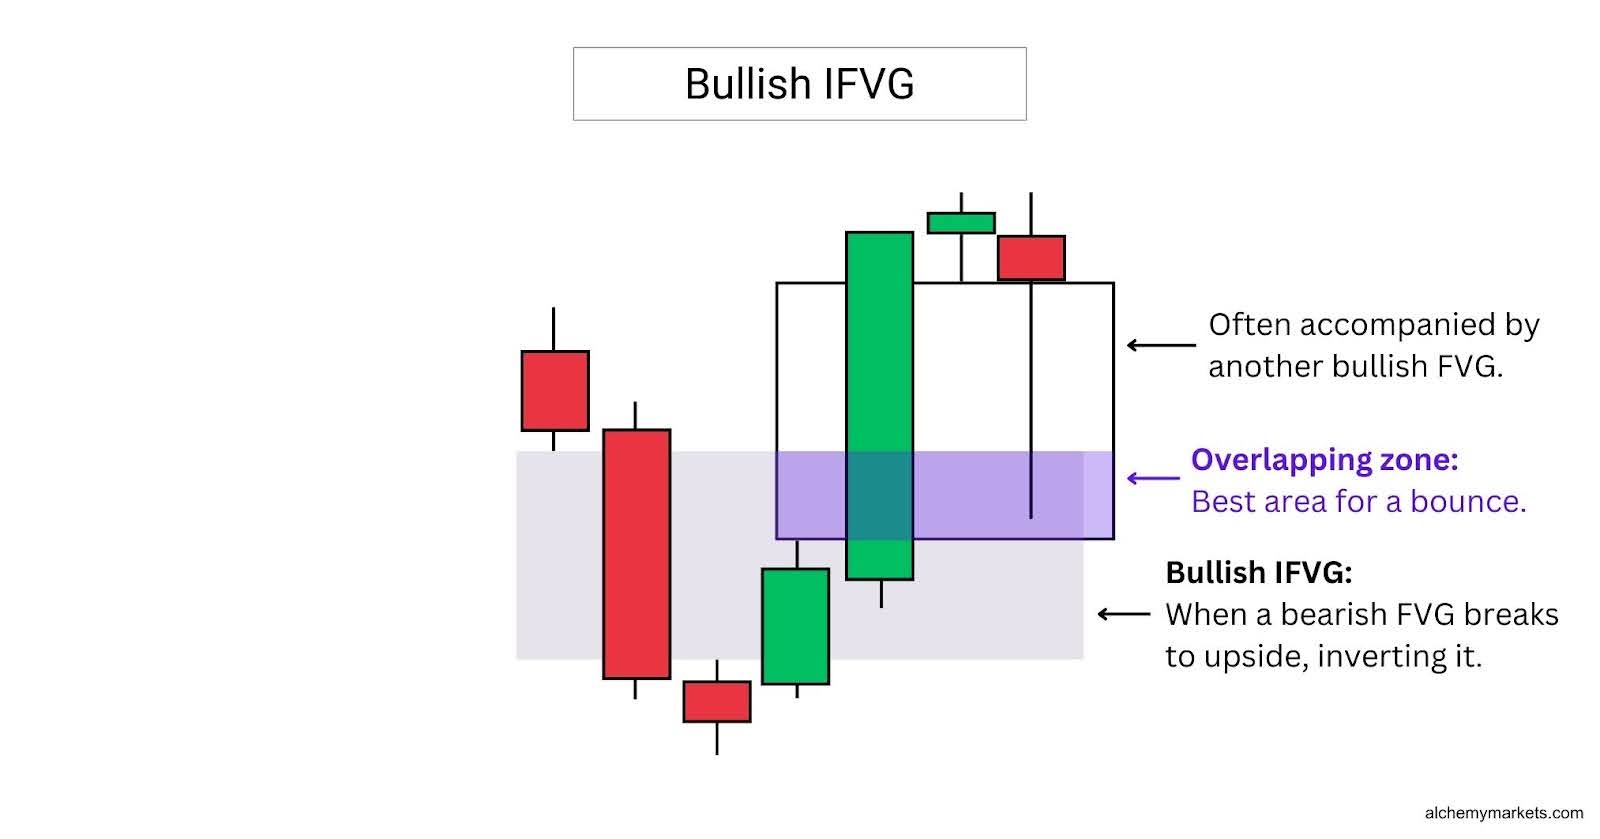
Additionally, a bullish IFVG often forms alongside another fair value gap, creating an overlapping zone. This overlap acts as a key area of interest, offering traders a powerful zone to watch for a potential bounce.
Bearish Fair Value Gaps
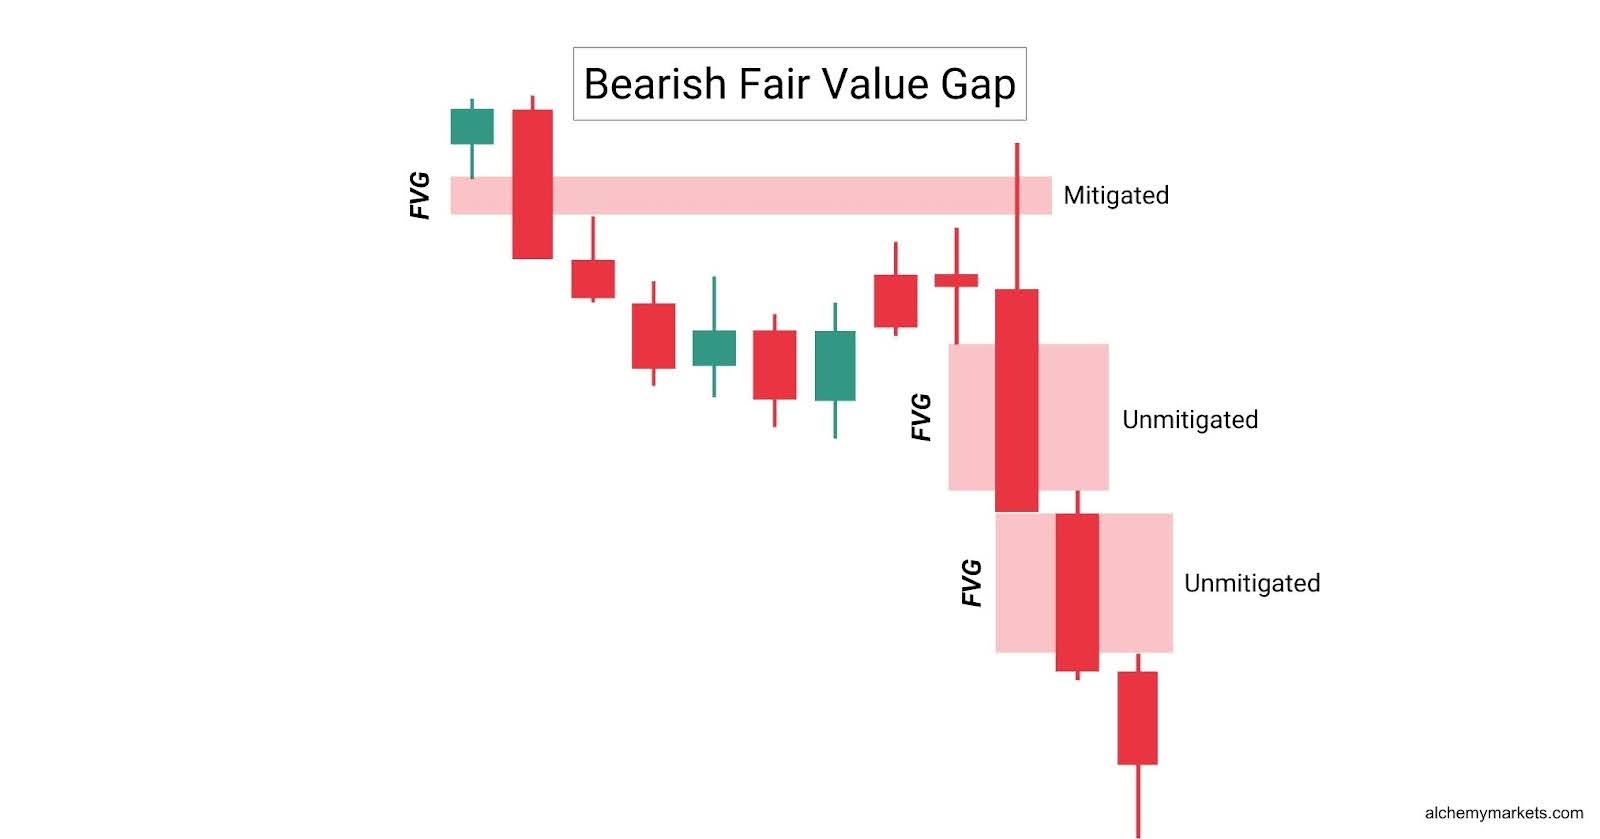
Bearish fair value gaps are formed when the price moves lower impulsively, creating the pattern in the process. This zone is then established as a secret resistance zone, where price may revisit and potentially reject.
Just like bullish FVGs, bearish FVGs can come in four forms.
Bearish PFG (Perfect Fair Value Gap)
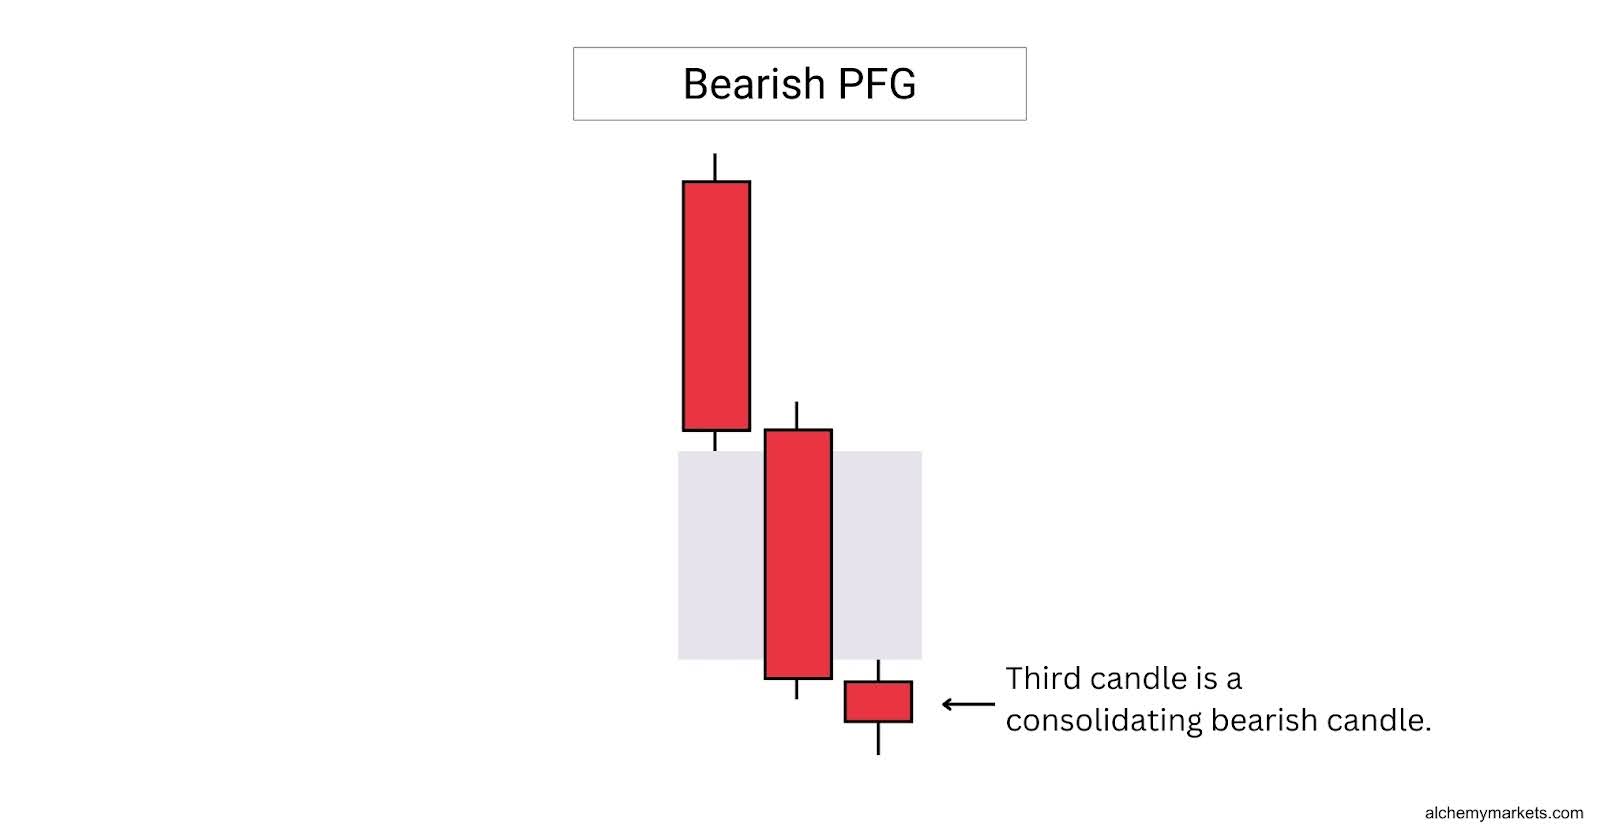
A bearish perfect fair value gap, or PFG, is formed when the third candle is a small, consolidating candle. The candle does not close above the previous candle’s closing price. This implies a high chance for the fair value gap to be revisited in the short term.
Bearish BFG (Breakaway Fair Value Gap)
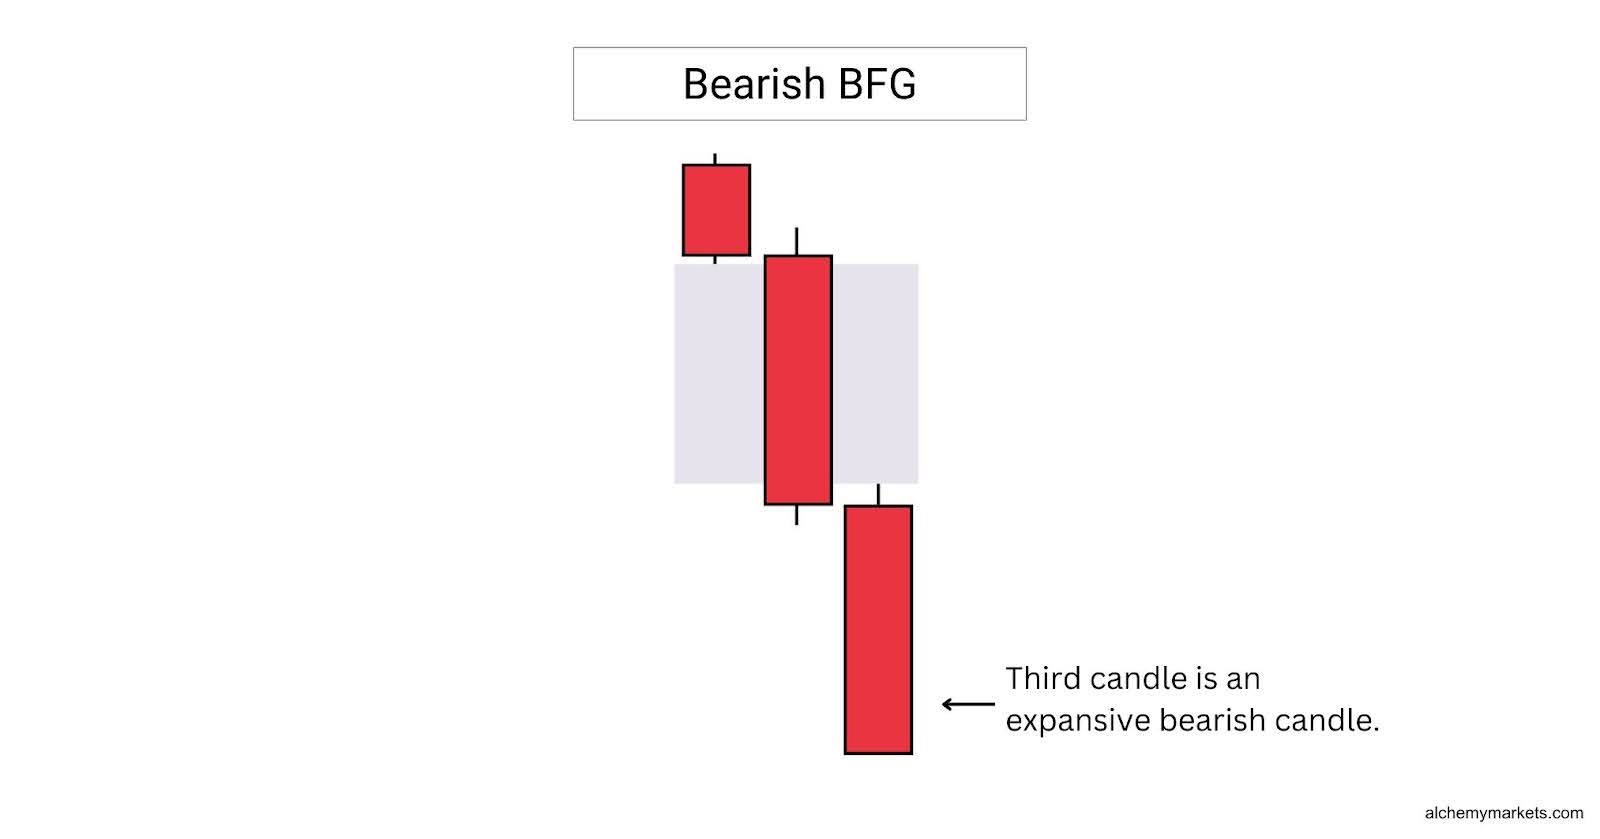
A bearish breakaway fair value gap, or BFG, is formed when the third candle is a large, expansive candle. This implies strong bearish momentum, and a low chance for the fair value gap to be revisited in the short term.
Aggressive traders may consider going short as this pattern closes, as the price experiencing strong bearish momentum and unlikely to retrace immediately.
Bearish RFG (Rejection Fair Value Gap)
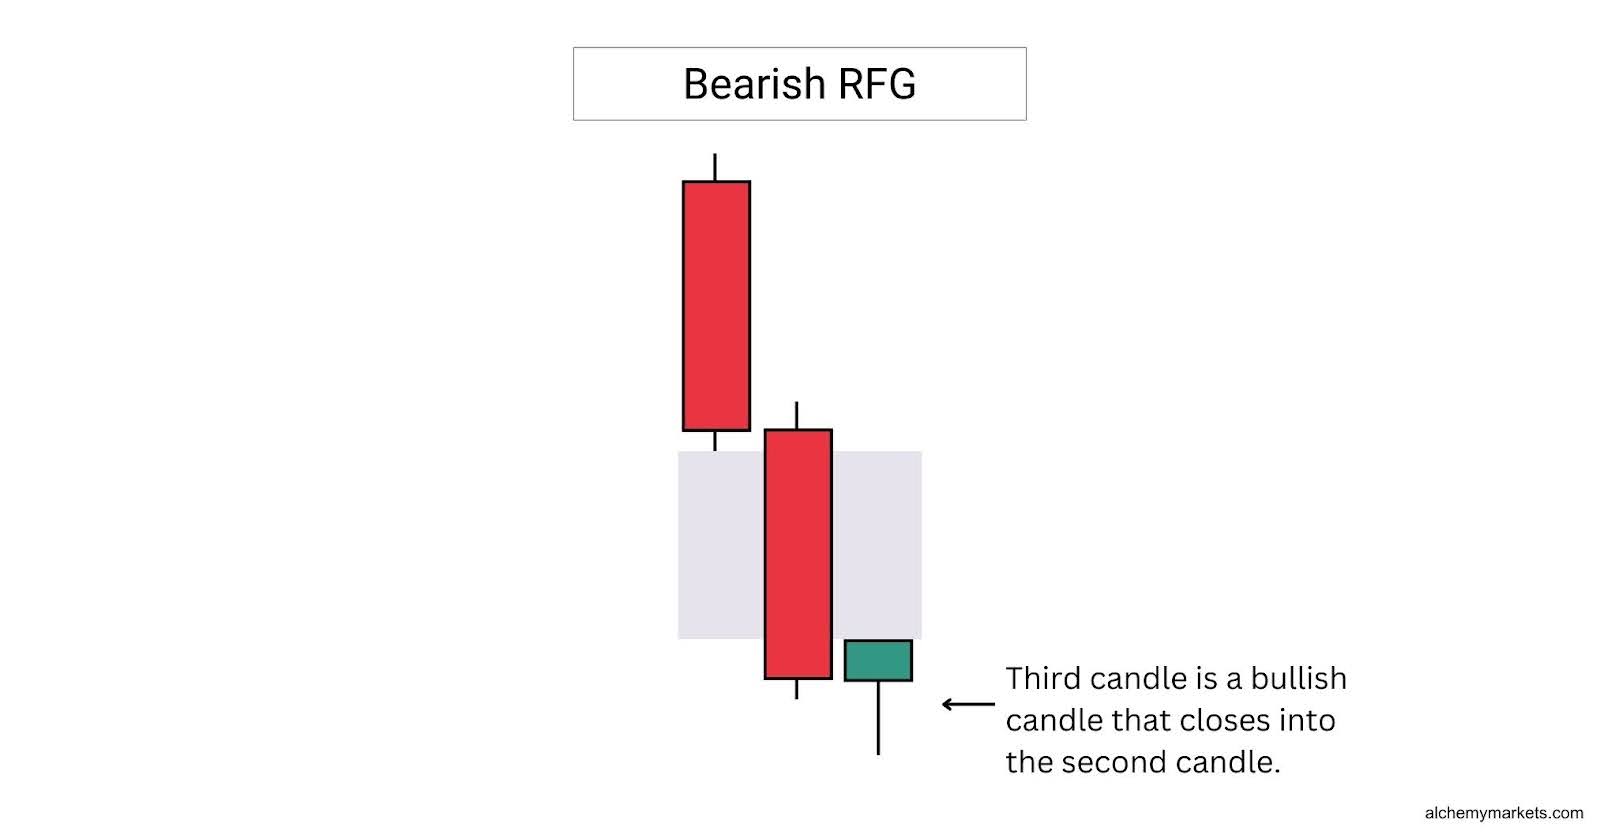
A bearish rejection fair value gap, or RFG, is formed when the third candle closes into the second candle. This implies weakening momentum, and a higher chance for the fair value gap to fail if revisited.
It does not invalidate the fair value gap, but it does call a need for caution for traders looking to go short.
Bearish IFVG (Inverse Fair Value Gap)
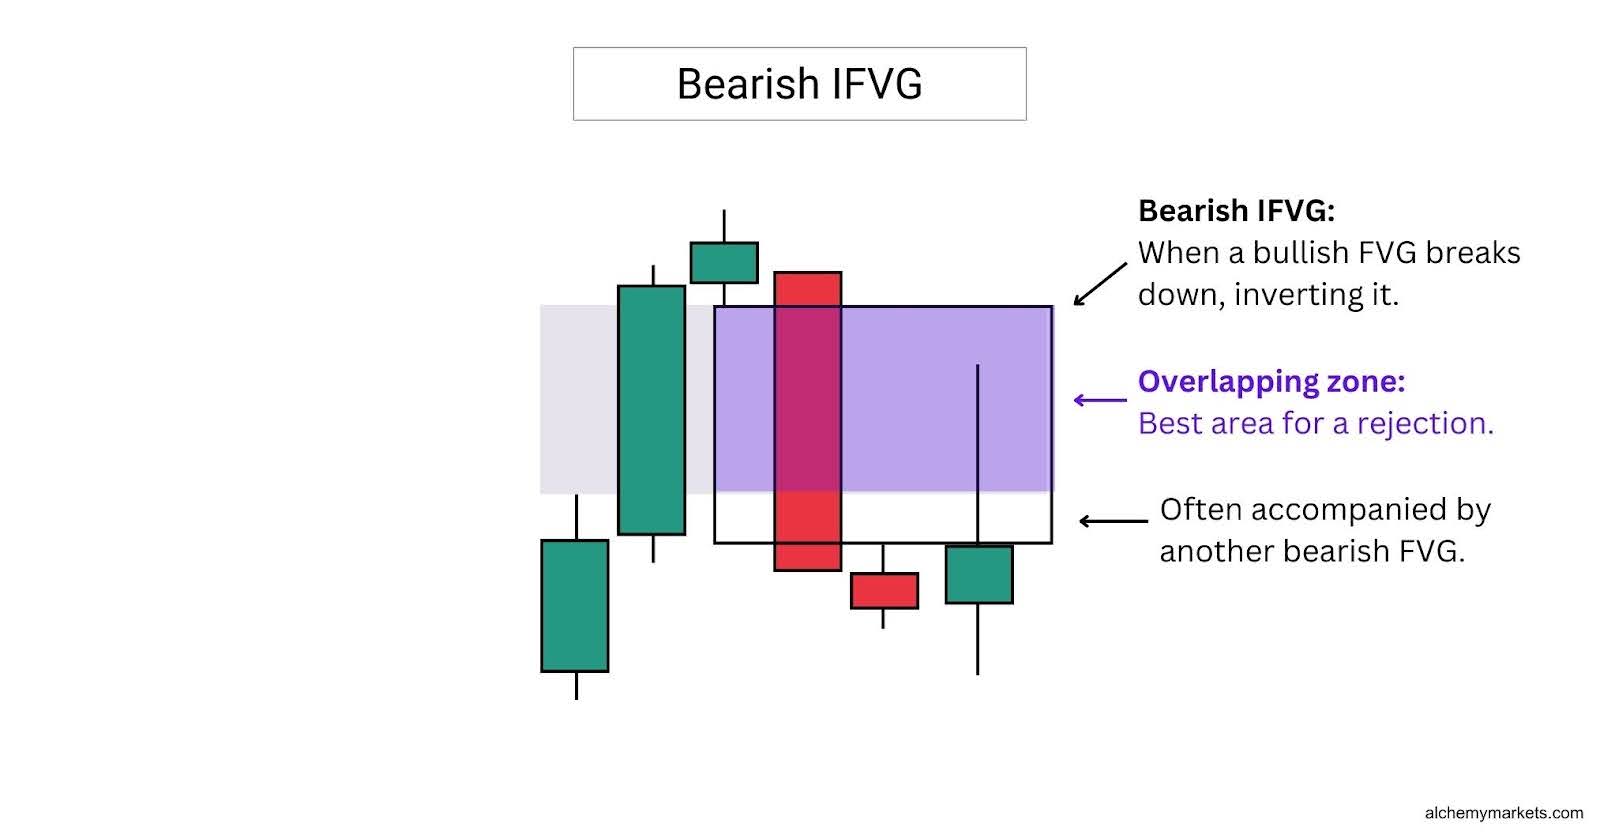
A bearish inverse fair value gap (IFVG) is formed when a previous bullish fair value gap is broken to the downside. This implies that an imbalance, where sellers previously had little opportunity to participate, has now been reclaimed by Smart Money. As a result, this reclaimed zone is likely to become a level where Smart Money may step in to defend.
Additionally, a bearish IFVG often forms alongside another fair value gap, creating an overlapping zone. This overlap acts as a key area of interest, offering traders a powerful zone to watch for a potential rejection.
How to Identify the Fair Value Gap?
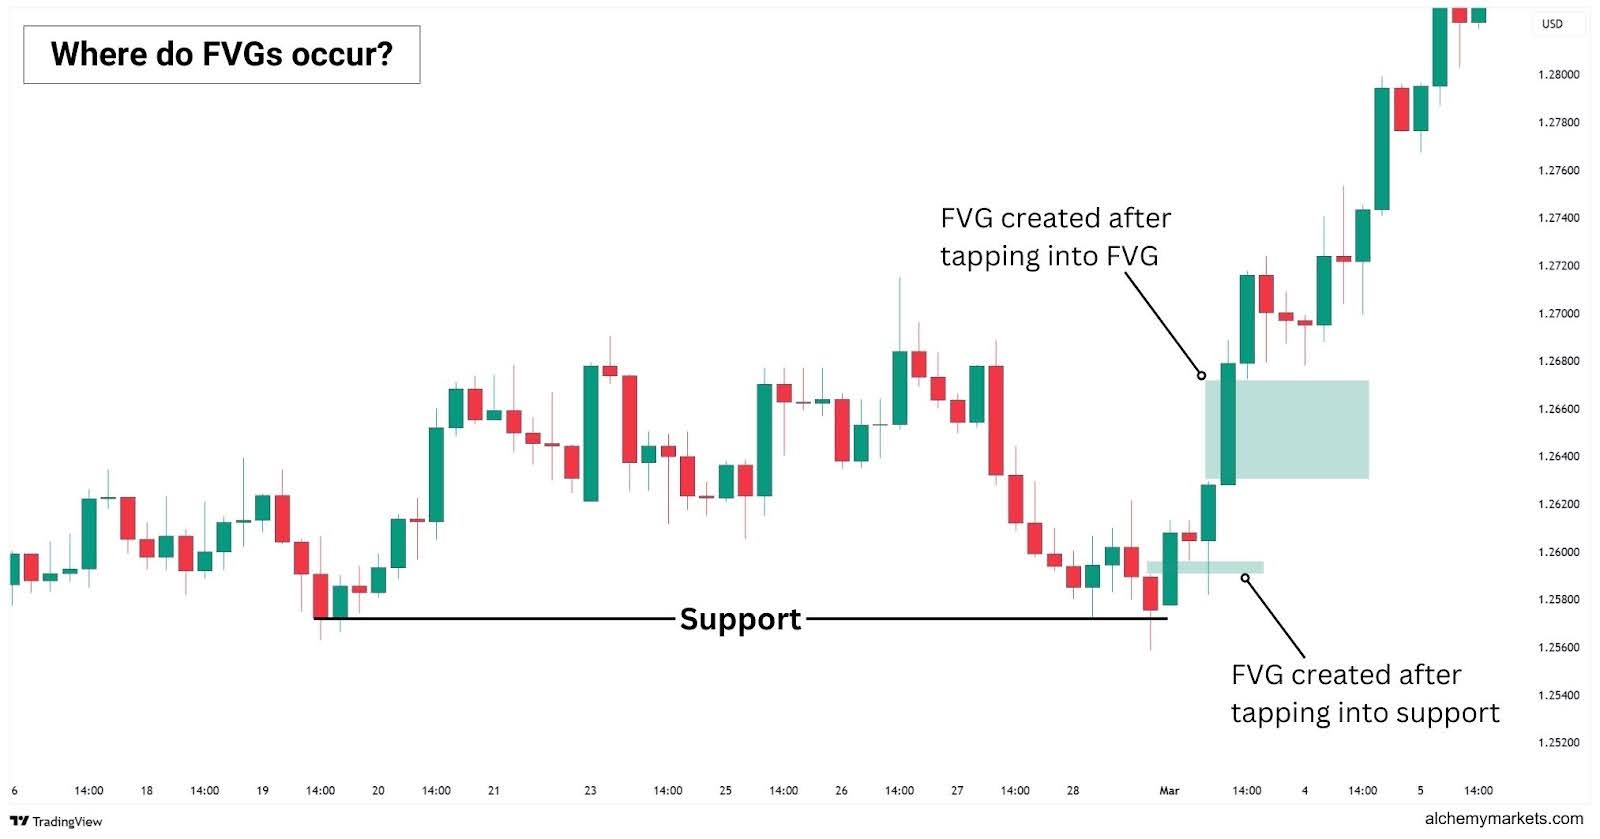
A fair value gap is best identified at a significant support or resistance level, where they are most likely to occur. Understanding this will help you simplify the process of looking for FVGs.
Additionally, when identifying an FVG, the wicks are more important than the closing prices. This is because closing prices alone do not fully communicate where price action has taken place—remember, we’re solely interested in the areas where price has passed through, but not revisited, making it a valid fair value gap.
Structure of a Fair Value Gap on a Chart
FVGs tend to occur at key prices which has increased buying or selling interest. This translates to support or resistance zones, or at even other Fair Value Gaps. At these levels, Smart Money may step in with institutional orders, which creates relatively large candles, leading to the creation of FVGs.
How to identify Supply and Demand Zones for Fair Value Gaps?
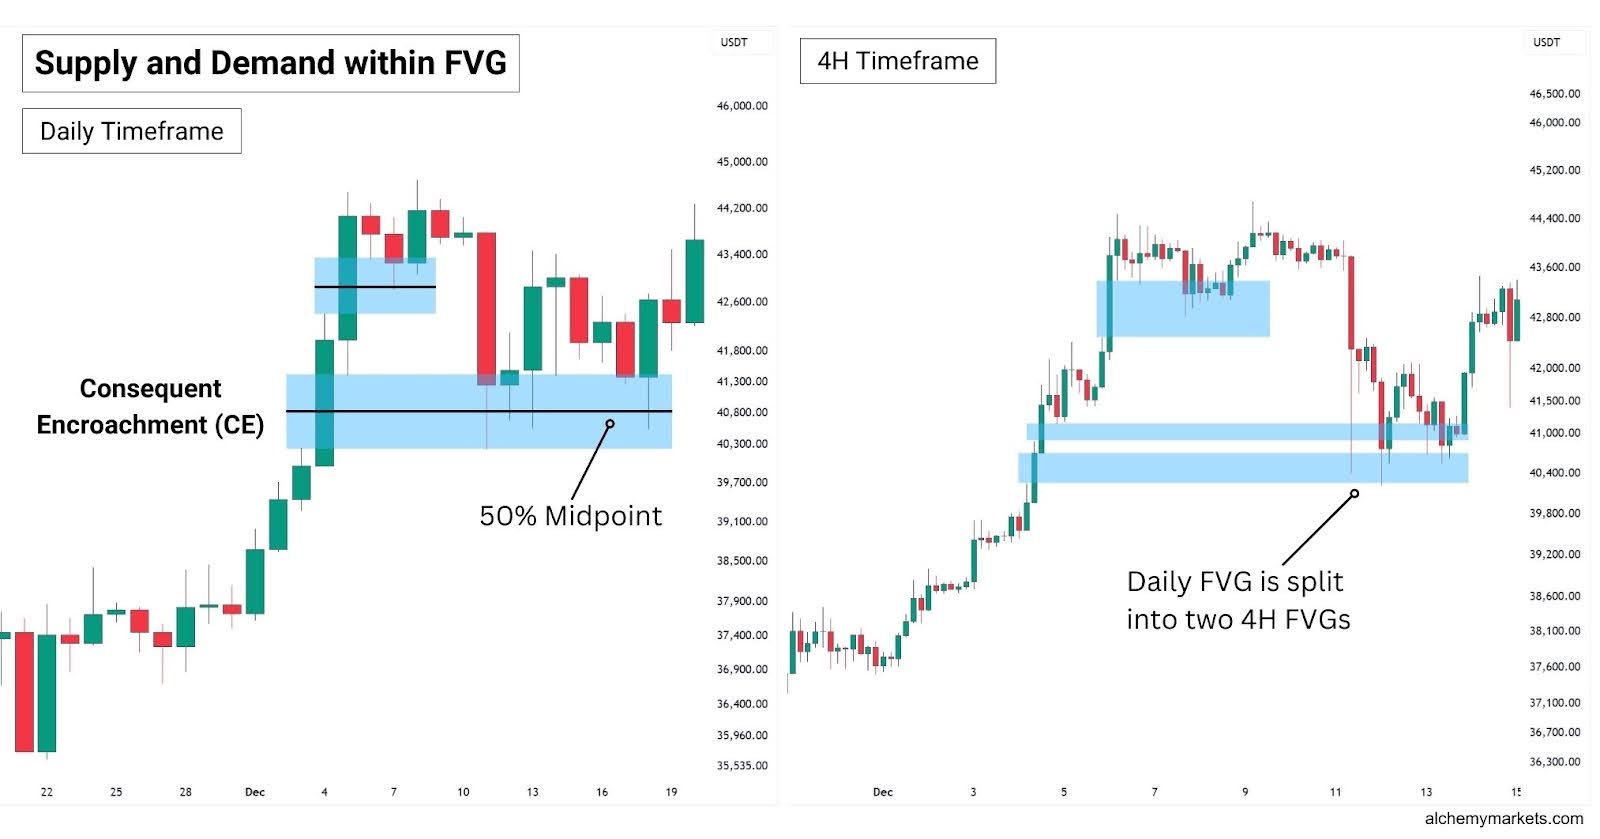
A fair value gap (FVG) acts as support or resistance, depending on its position relative to price and whether it has been mitigated. Once an FVG has been reached—meaning orders within it have been taken—it loses its validity as support or resistance.
However, sometimes a FVG can appear to be very large, making it difficult for traders to pinpoint where exactly to enter a trade. This is where using the Consequent Encroachment, or CE—the 50% mark of the FVG as a point of interest can help standardise the process.
The price should not close below the CE in order for a successful bounce/rejection to be considered. Additionally, using a lower timeframe to find smaller FVGs within a larger one can help provide refined entries.
How to Find a Bullish FVG
It is most effective to look for bullish FVGs near support, Fibonacci retracements, and at where a break of structure (BOS) to the upside has occurred. These confluences can significantly strengthen the effectiveness of a Fair Value Gap.
How bullish a fair value gap is will depend on the formation of the FVG, and overall market trend:
- A bullish perfect fair value gap has the highest chance for a successful retrace and retest, making it ideal for trading.
- A bullish breakaway fair value gap is the most bullish, with a high chance of continuation from this point forth with no retracement.
- A bullish rejection fair value gap is the least bullish, with the lowest chance of a successful retest, and the highest chance to become a bearish IFVG.
How to Find a Bearish FVG
It is most effective to look for bearish FVGs near resistance levels, Fibonacci retracements, or at points where a break of structure (BOS) to the downside has occurred. These confluences can significantly improve the reliability of a Fair Value Gap setup.
How bearish a fair value gap is will depend on the type of FVG and the overall market direction:
- A bearish perfect fair value gap offers the cleanest setup, with a strong chance of price retracing higher into the gap before continuing lower.
- A bearish breakaway fair value gap is the most bearish, often appearing after strong impulsive moves, and may not offer a retest at all.
- A bearish rejection fair value gap is the weakest, with a higher risk of invalidation or reversal, and could potentially signal the start of a bullish imbalance forming instead.
Importance of Fair Value Gaps
When it boils down to it, Fair Value Gaps tell you why and where a dramatic price change has happened: Smart Money has stepped into the market. The whole idea behind FVGs is that Smart Money left their footprint on the chart, and because they’ve got positions there, they’re likely to come back and defend that area.
That’s why a lot of traders use FVGs to find better support or resistance zones, they are areas where price is more likely to react, giving them cleaner, higher-quality trade setups.
Fair Value Gap Example
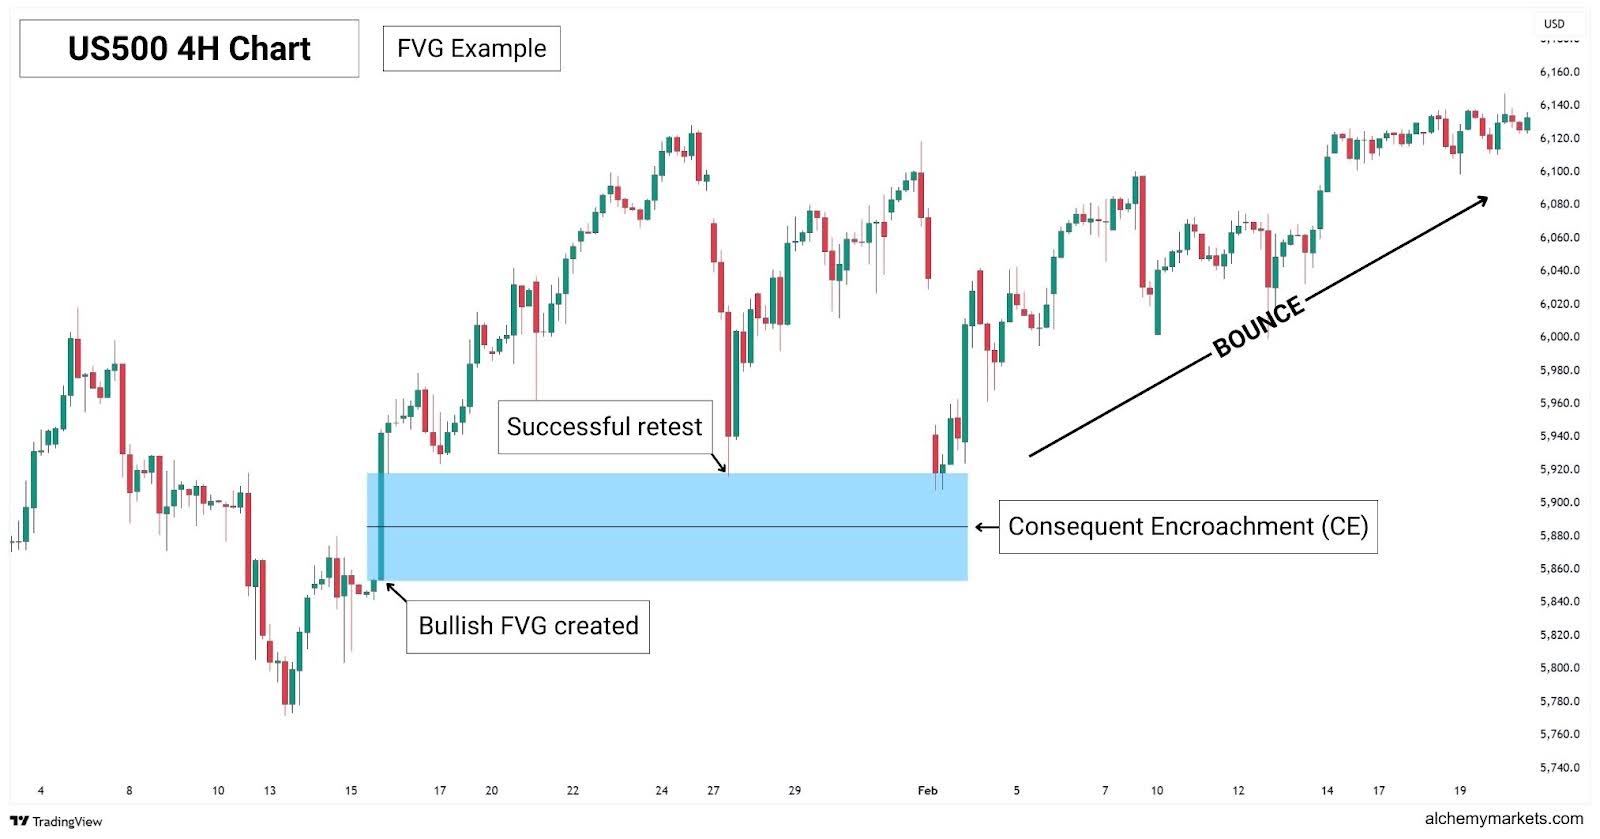
In this 4H live chart, a bullish FVG formed on the US500 (S&P 500) on 16th January 2025. The price first retested this zone on 27th January, partially mitigating the imbalance and triggering a bounce.
Despite this mitigation, the FVG remained a valid reaction area, as seen on the second retest, where price tapped into the upper portion of the FVG before launching into a strong rally. The consequent encroachment (CE) of the FVG remains unbroken, signalling strong buying interest from Smart Money, and little interest to sell.
Fair Value Gap Trading Strategies
FVGs are an interesting new tool traders can easily apply to their current trading plan, simply by just finding it in the naked chart. This versatility makes the FVG an incredibly useful tool to pick up and add into your trading arsenal.
Let’s explore the various ways traders have discovered trading the FVG pattern.
Perfect Fair Value Gap Strategy
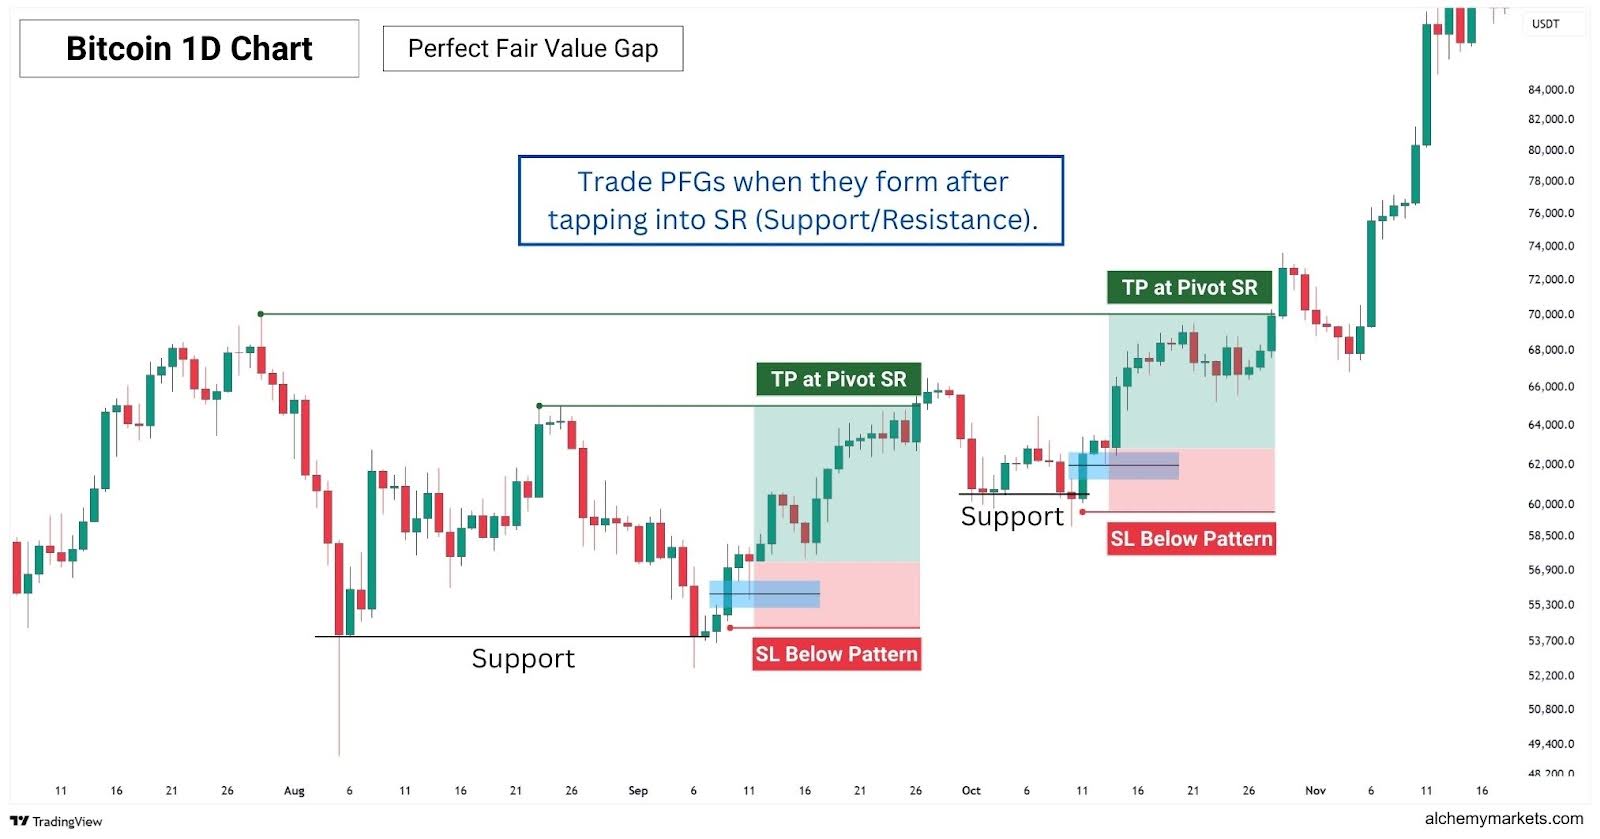
This is a level-to-level trading strategy, which uses the Perfect Fair Value Gap (PFG) as our confirmation method that a support or resistance zone is holding, increasing the likelihood of a strong pivot.
The strategy is simple and can be broken down into three steps:
- Look for a perfect fair value gap.
- Notice if it was created at a SR zone, an area where the price has pivoted from.
- Enter a trade if the price retests the FVG, and does not close beyond the midpoint (50%) of the FVG.
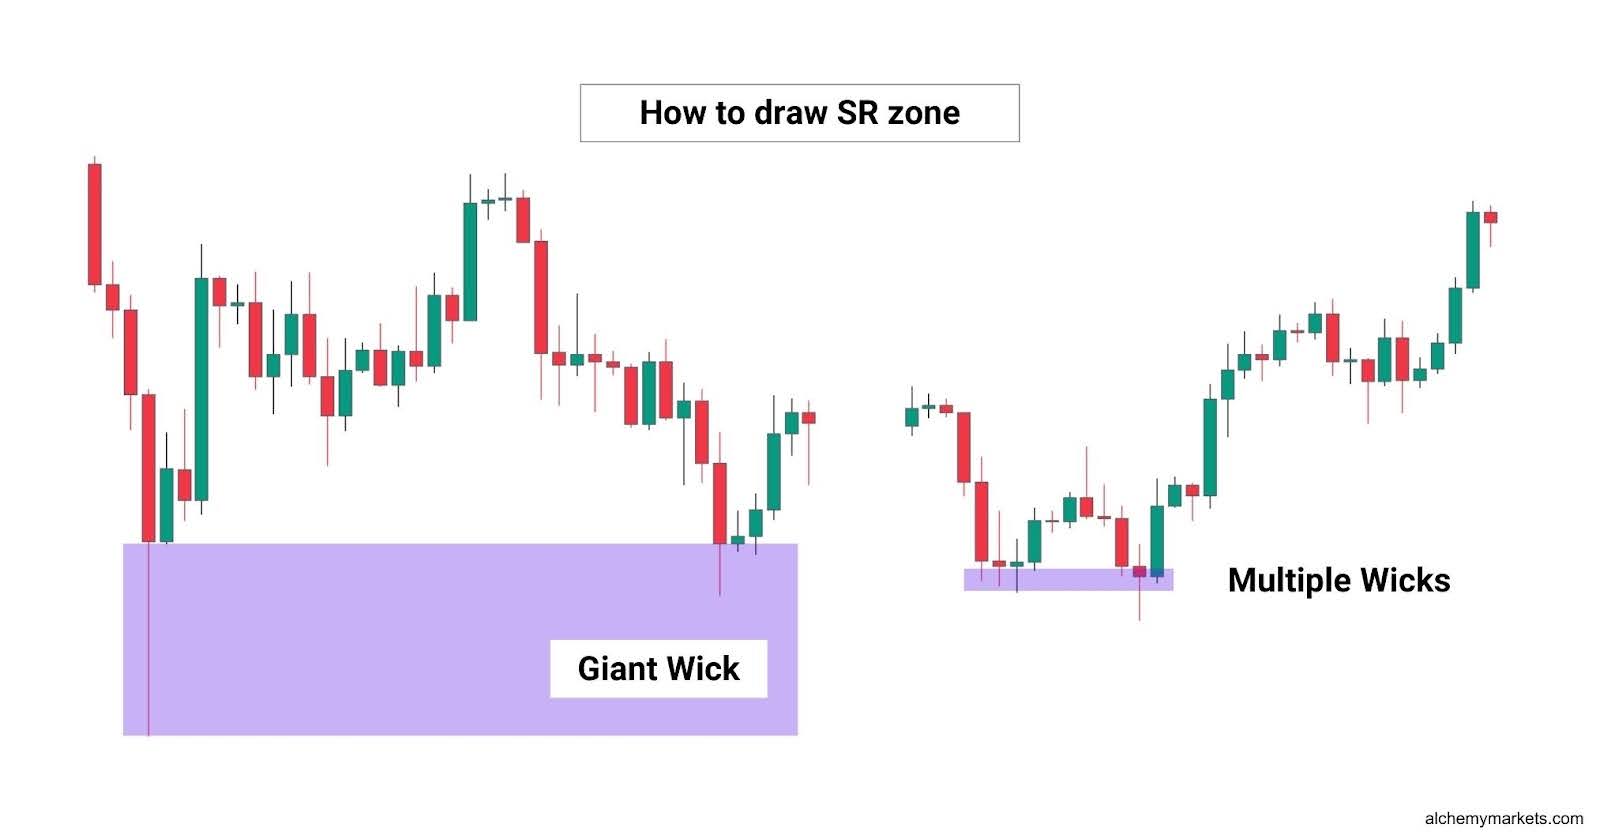
There are two ways you can identify a support/resistance zone (SR zone):
- Look for a previous point where price has clearly pivoted, ideally forming a strong rejection wick.
- Find areas where price has paused and consolidated, leaving multiple smaller wicks.
Once identified, draw a box from the candle body close to the wick’s extreme end. See below:
If a PFG forms within this zone, it signals that Smart Money is now getting involved, thus increasing the probability of price pivoting from this point forth.
Pay attention to the third candle in the pattern—it provides key context for momentum and potential continuation.
| Long trade 🌱 | Short trade 🐻 | |
| Setup | A bullish PFG forms after price taps into support. | A bearish PFG forms after price taps into resistance. |
| Entry Conditions | Go long when the price wicks into the CE but closes above, or when it shifts above the PFG. | Go short when the price wicks into the CE but closes below, or when it shifts below the PFG. |
| Take Profit (TP) | At the next resistance | At the next support |
| Stop Loss (SL) | Below the first candle of the PFG | Above the first candle of the PFG |
Fair Value Gap with Break of Structure
This is a simple and effective strategy that works like trading a support and resistance breakout. A Break of Structure (BOS) occurs when price breaks a support-resistance (SR) zone, in the direction of the current trend. In an uptrend, this means breaking the previous high, while in a downtrend, it means breaking the previous low.
When a BOS aligns with a Fair Value Gap (FVG), the gap becomes a high-probability zone for a continuation trade. The level which was broken often overlaps with the FVG, reinforcing it as a strong reaction point for potential continuation.
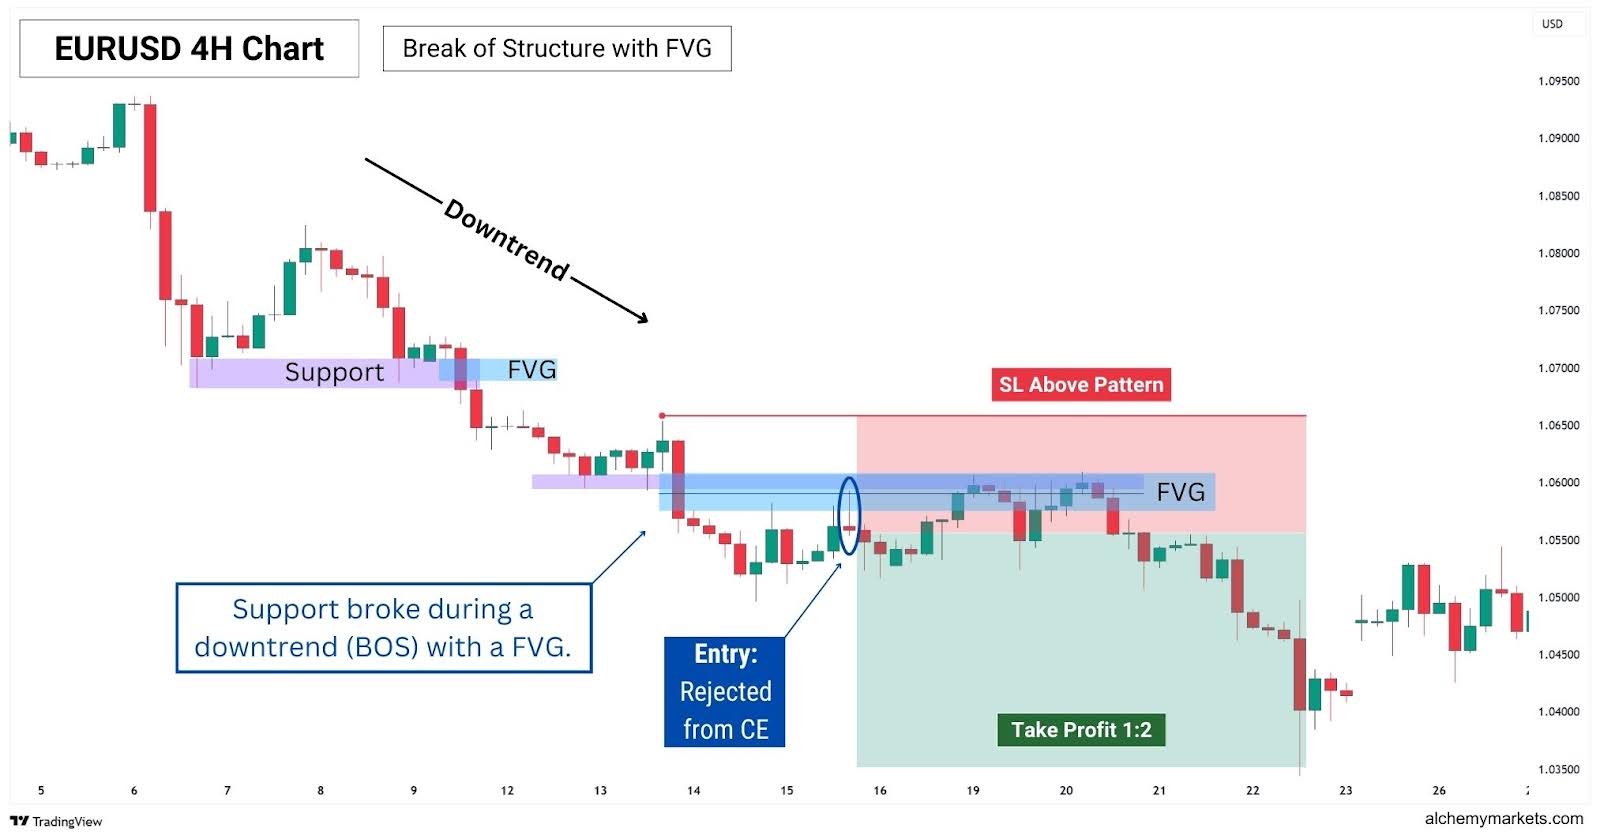
In this EURUSD 4H chart, notice how the asset is in a downtrend—forming lower highs, and lower lows. Therefore, in this example, we will only look for short trades with our BOS-FVG setup.
A simple but effective entry signal to look for is a reaction at the Consequent Encroachment (CE)—the 50% midpoint of the Fair Value Gap (FVG). In an uptrend, we look for a bounce; in a downtrend, a rejection. An initial reaction at CE signals potential continuation, as it represents the midpoint of the imbalance where unfilled orders may still exist.
By placing our stop loss behind the first candle of the pattern, we are committing to the idea that the Fair Value Gap (FVG) will hold as a support or resistance zone. For take profit (TP), a 1:2 risk-to-reward ratio is a balanced and effective target for a continuation trade.
| Long trade 🌱 | Short trade 🐻 | |
| Setup | A break above a previous high which forms a FVG. | A break below a previous low which forms a FVG. |
| Entry Conditions | Go long when the price retests the CE, or shifts above the FVG with a green/bullish candlestick. | Go short when the price retests the CE, or shifts below the FVG with a red/bearish candlestick. |
| Take Profit (TP) | 1:2 Risk-to-Reward | 1:2 Risk-to-Reward |
| Stop Loss (SL) | Below the first candle of the FVG | Above the first candle of the FVG |
Inverse Fair Value Gap Strategy
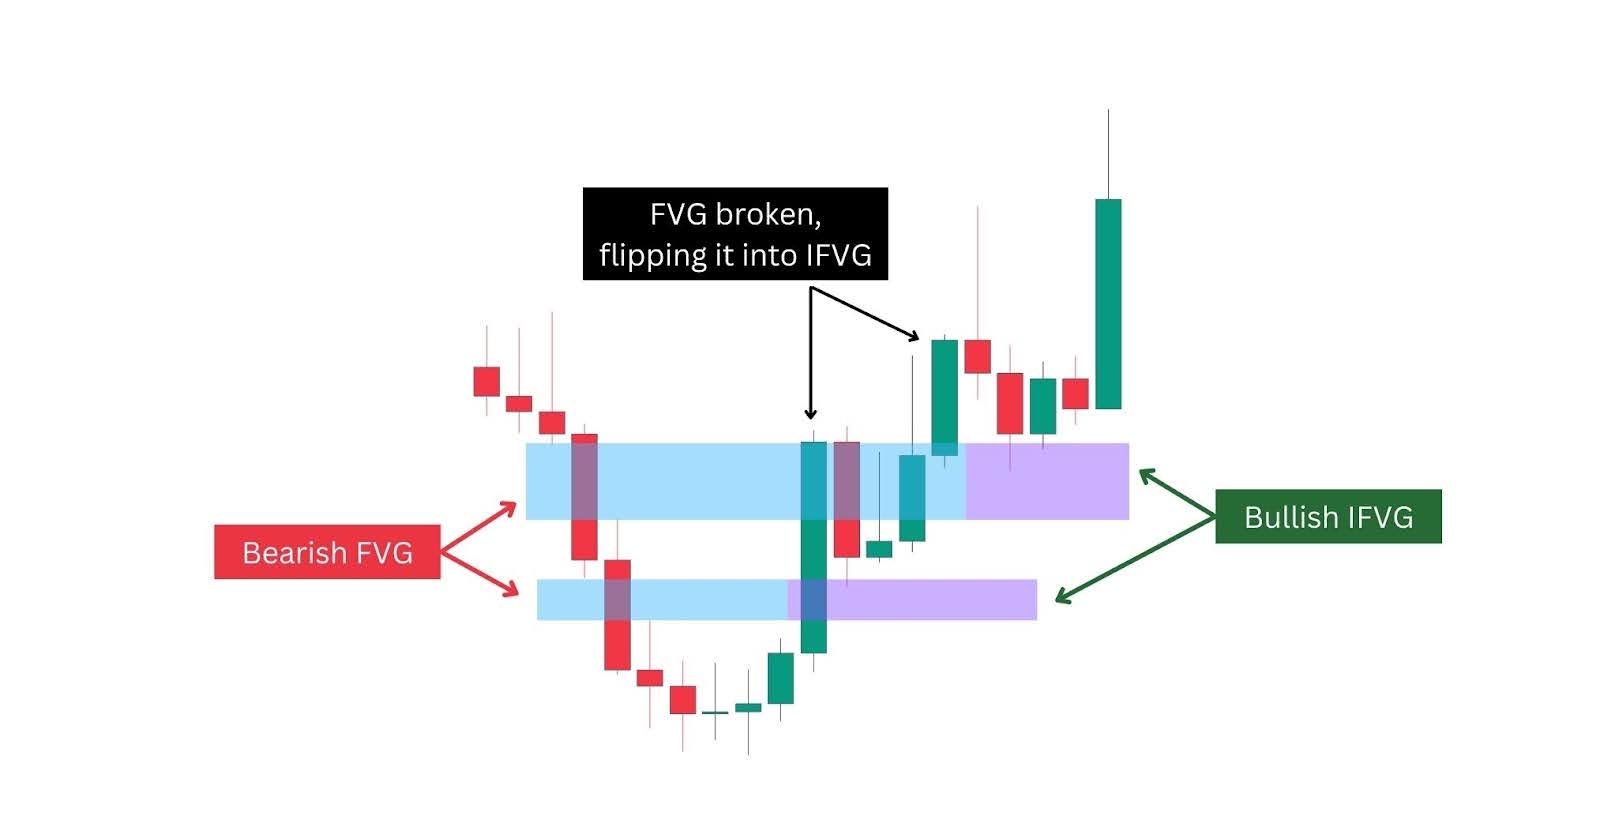
An Inverse Fair Value Gap (IFVG) is what happens when a Fair Value Gap (FVG) fails to hold, with price slicing through it and flipping direction. A bullish FVG that gets invalidated turns into a bearish IFVG, and a bearish FVG flips into a bullish IFVG.
The best IFVG setups are the ones that align with the trend. Momentum is everything, and these IFVGs are basically failed reversal attempts—which create the perfect conditions for a squeeze. When price comes back to retest the IFVG, it can act as a launchpad, driving price further in the direction it was already heading.
To trade an IFVG setup, first confirm the overall trend—higher highs and lows for an uptrend, lower highs and lows for a downtrend. Then, look for a Fair Value Gap (FVG) against the trend that could flip into an IFVG. Finally, watch for a reaction at Consequent Encroachment (CE)—the price should wick into it without closing beyond it, signalling a potential pivot.
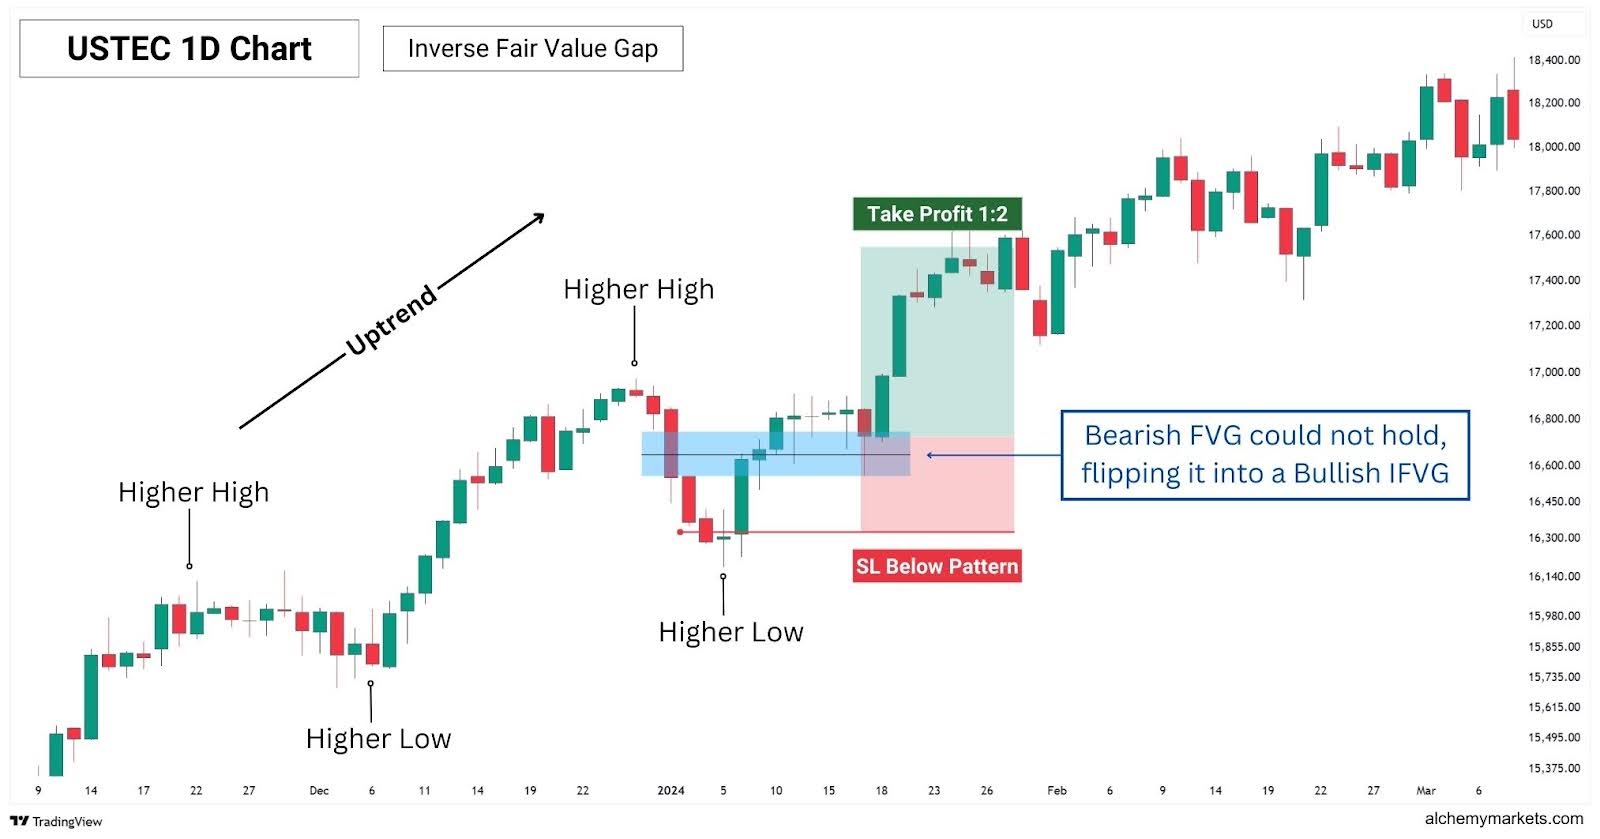
Notice how in this USTEC 1D Chart, the price is consistently forming higher highs and higher lows. Then, a bearish FVG forms on one of its pullbacks, suggesting a possible trend reversal. However, that idea is quickly invalidated as price breaks right through the FVG, turning it from a bearish FVG into a bullish IFVG. Then, on a retest of the IFVG, the price bounces and reaches 1:2 take profit.
| Long trade 🌱 | Short trade 🐻 | |
| Setup | A bearish FVG turns into a bullish IFVG in an overarching uptrend. | A bullish FVG turns into a bearish IFVG in an overarching downtrend. |
| Entry Conditions | Go long when the price retests the CE, or shifts above the FVG with a green/bullish candlestick. | Go short when the price retests the CE, or shifts below the FVG with a red/bearish candlestick. |
| Take Profit (TP) | 1:2 Risk-to-Reward | 1:2 Risk-to-Reward |
| Stop Loss (SL) | Below the third candle of the bearish FVG | Above the third candle of the bullish FVG |
Fair Value Gap with Bollinger Bands
The Bollinger Bands® can not only signal the trend, but also highlight likely support and resistances that price is expected to range between. However, when a candlestick closes outside of a Bollinger Band, it can also signal a potential rally (if closed above), or potential decline (if closed below)—supported by strong momentum.
This strategy takes the classic Bollinger Bands breakout strategy and combines it with Fair Value Gaps to confirm strong momentum. To apply this strategy properly, traders must be acquainted with what each type of FVG signals.
Let’s recall the basics:
- A perfect fair value gap (PFG) has the highest potential to retrace and retest successfully.
- A rejection fair value gap (RFG) has the weakest momentum, and lowest potential to create a reaction.
- A breakaway gap (BFG) has the highest momentum, and lowest potential to retrace.
With this in mind, we will follow three main rules in this strategy:
- Only trade PFGs and BFGs as they signal stronger momentum, suggesting a valid breakout.
- Ignore trade RFGs as they have the weakest momentum among all FVG types.
- Only trade FVGs when they occur outside of the Bollinger Bands (BB), activating the BB breakout signal.
Here’s a live chart example on Gold, on how different fair value gaps would interact with this strategy–Starting with PFGs and RFGs.
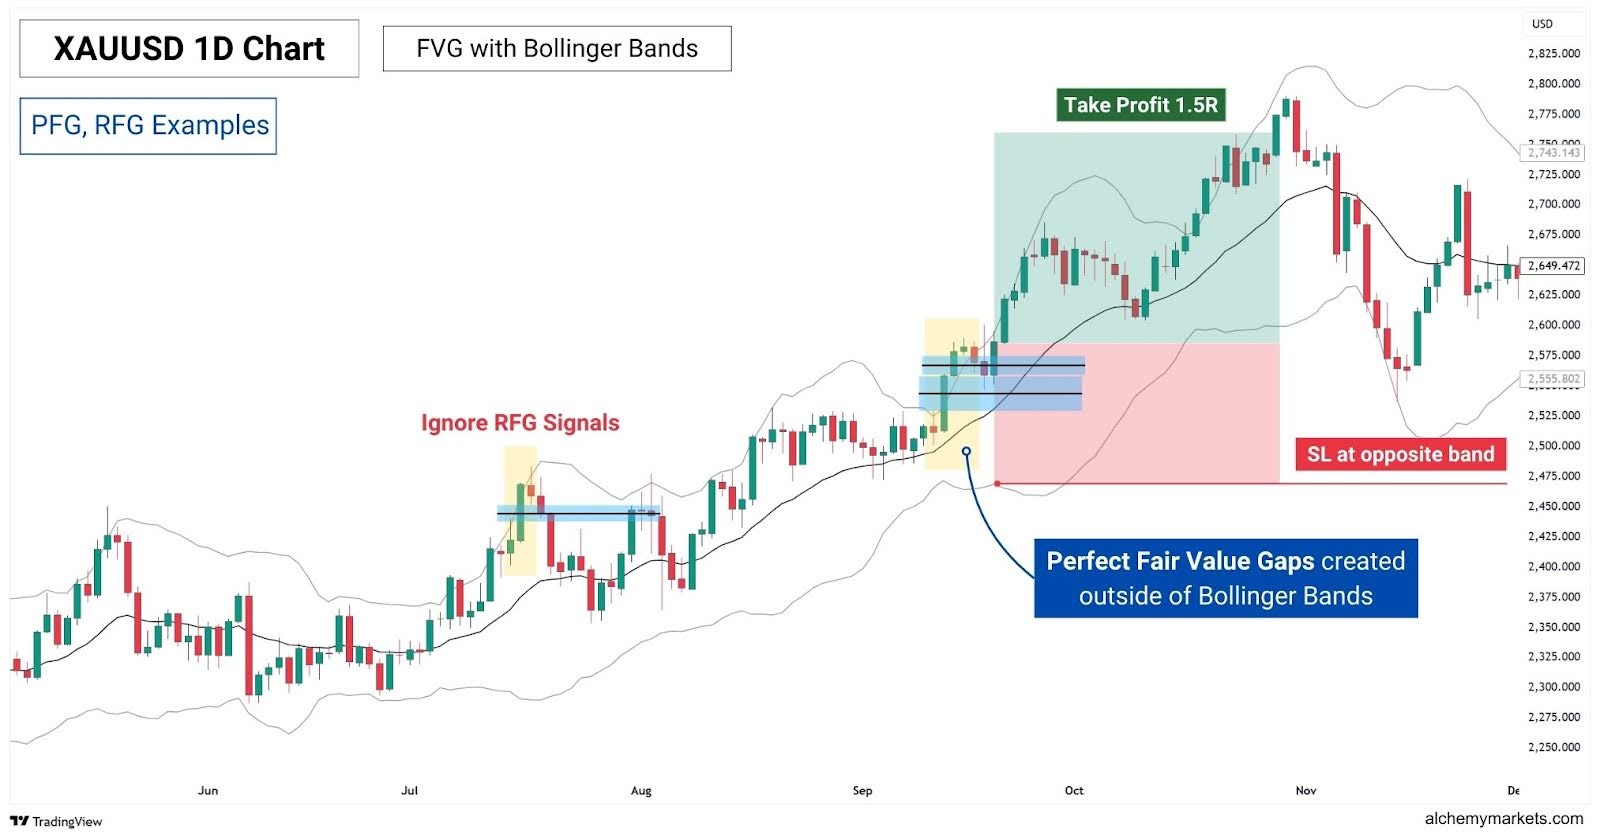
The first step is to validate the bullish FVG signals. Did they occur above the Bollinger Bands and its midpoint? The answer is yes, so now we can go to the next step: identifying the type of FVG they are.
Notice how the PFGs provided a decent bounce, while the RFG did not. This highlights the weaker momentum inherent to the RFG pattern, especially when it appears at the outer bands of Bollinger Bands which act as support and resistance—hindering the breakout.
By ignoring RFGs, we can simplify our decision making and only take high probability breakouts. For the entry, you could either wait for a successful test of the CE, or for the price to shift out of the FVG, in the direction of the breakout.
Now, let’s look at how you’d trade a Breakaway Gap (BFG) with this strategy.

Notice how price surges after the BFG forms, rallying without retracing into the gap. While a typical Fair Value Gap entry isn’t available, the confluence of the BFG and Bollinger Bands breakout justifies a direct entry after the Breakaway Gap—leading to a nice 1.5R trade.
| Long trade 🌱 | Short trade 🐻 | |
| Bollinger Bands | 20-SMA, 2-Standard Deviation | |
| Setup | A candle from a bullish PFG or BFG pattern closes above the Bollinger Bands. | A candle from a bearish PFG or BFG pattern closes below the Bollinger Bands. |
| PFG Entry Condition | Go long when the price wicks below the CE, but closes above. | Go short when the price wicks above the CE, but closes below. |
| BFG Entry Condition | Go long at the close of the third candle of the BFG, or wait for a retracement to CE (unlikely). | Go short at the close of the third candle of the BFG, or wait for a retracement to CE (unlikely). |
| Take Profit (TP) | 1:1.5 Risk-to-Reward | 1:1.5 Risk-to-Reward |
| Stop Loss (SL) | At the lower band | At the upper band |
Fair Value Gap with Moving Averages
Moving averages are indicators that provide the average price across a set period of time, by looking back at a past number of candlesticks. A candlestick represents price movement within a timeframe, which can be anywhere from 1 second, to even a year.
For example, a 200-period moving average on the 1H timeframe, calculates the average price of the last 200 hours, then visualises it as a smooth, dynamic line that constantly is updated as the price develops. Traders use this to their advantage to identify the trend direction, or even as a support or resistance.
For this strategy, we will be using an Exponential Moving Average to tell us where the average trend is:
- If the price is above the 200-EMA, it means we are in a macro-uptrend.
- If it’s below 200-EMA, a downtrend.
Using the EMA as our trend-filter, we will only take FVG trades aligned with trend direction.. Here’s how it looks on a 4H chart:
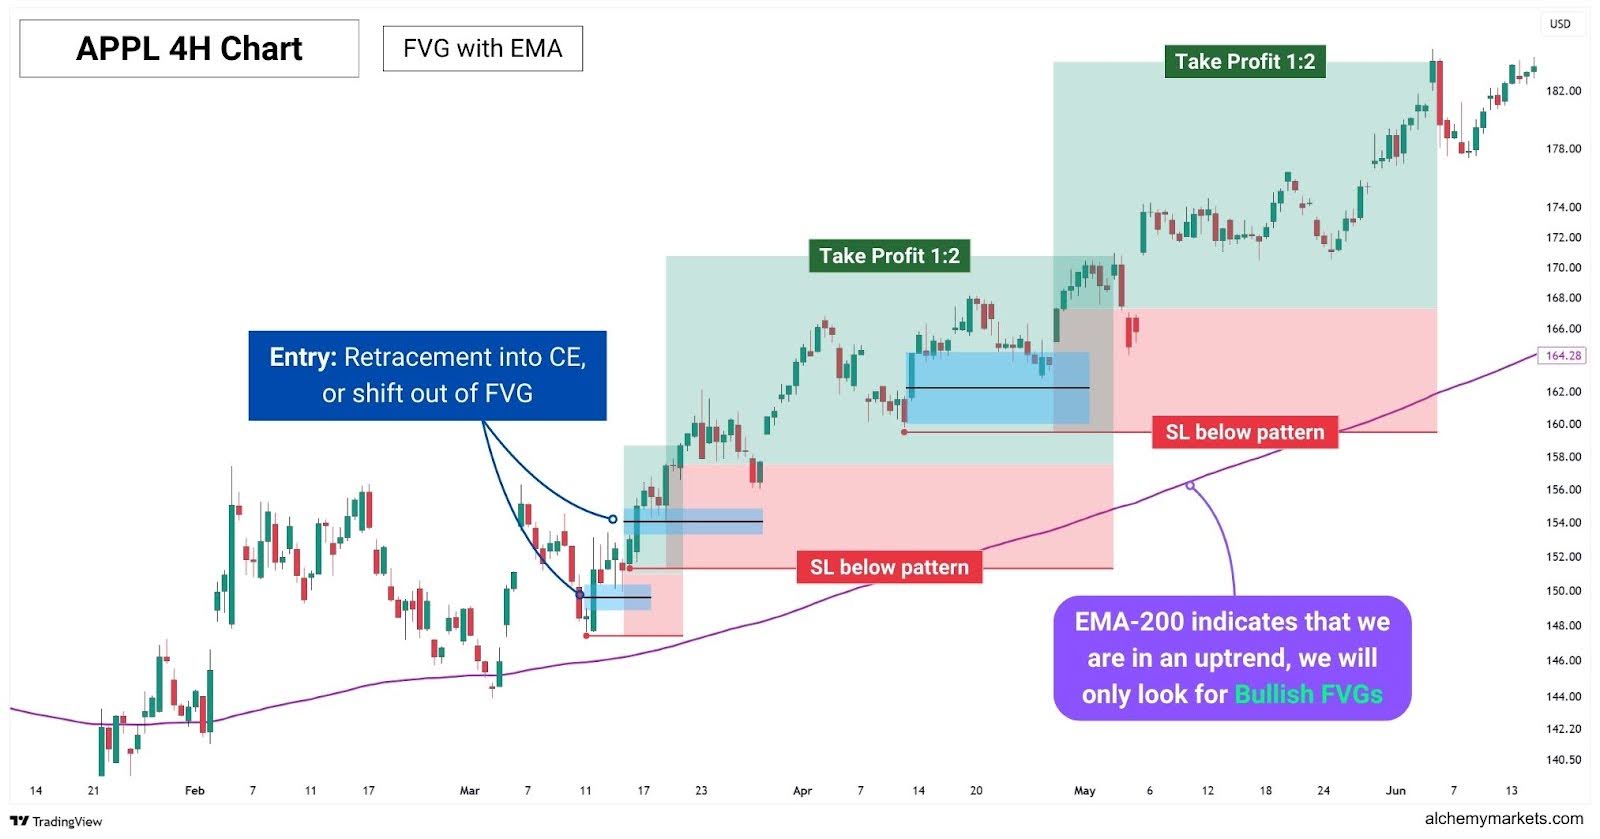
Notice how in this Apple Stock Chart, the price is above the 200-EMA, which signals an uptrend. Our trading process is now greatly simplified, as we’ll just look for Bullish FVGs, cutting down time you spend on finding fair value gaps, and filtering out weaker FVGs.
| Long trade 🌱 | Short trade 🐻 | |
| Moving Average | 200-EMA | |
| Setup | When the price is above the 200-EMA, look for bullish FVGs to trade. | When price is below the 200-EMA, look for bearish FVGs to trade. |
| Entry Conditions | Go long when the price retests the CE, or shifts above the FVG with a green/bullish candlestick. | Go short when the price retests the CE, or shifts below the FVG with a red/bearish candlestick. |
| Take Profit (TP) | 1:1.5 Risk-to-Reward | 1:1.5 Risk-to-Reward |
| Stop Loss (SL) | Below the first candle of the FVG | Above the first candle of the FVG |
Fair Value Gap with MACD (Moving Average Convergence Divergence)
The MACD is a momentum indicator that highlights both divergences and trend shifts across short-term and long-term conditions. This dual perspective makes it a powerful tool for double-confirming the market’s conditions.
When combined with Fair Value Gaps (FVGs), the MACD helps traders identify both trend direction, and momentum strength. This helps filter and prioritise which FVGs are worth trading.
Since the MACD can be noisy at times—flipping between green and red histogram bars which signal bullish and bearish momentum—we will incorporate a 50-Exponential Moving Average to help smooth out the signals, offering clearer trend alignment.
Let’s see how this strategy applies to a 5-minute NZDUSD chart.
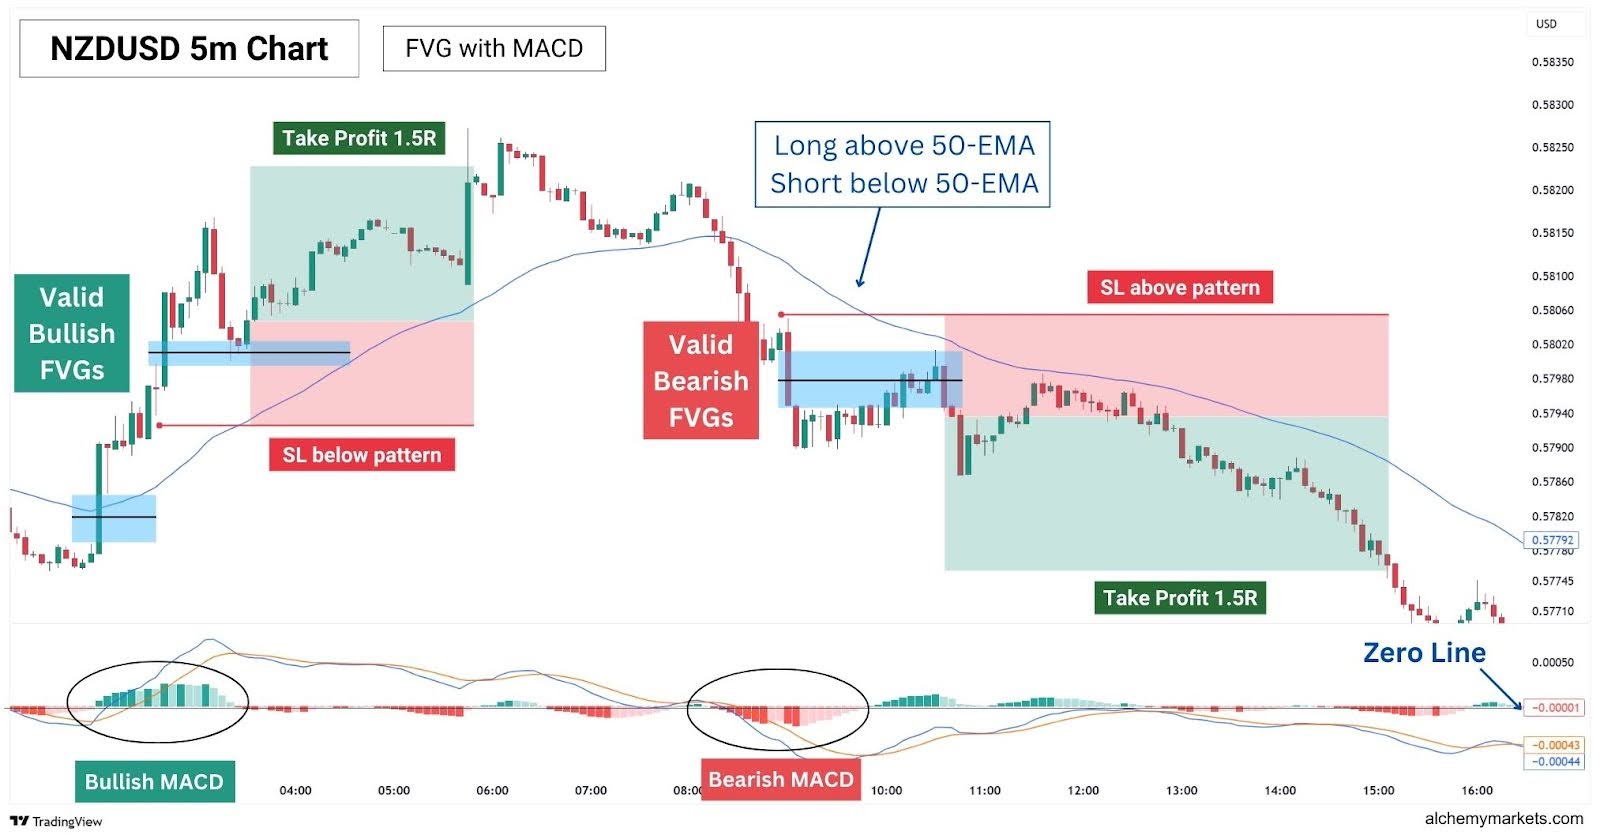
Notice how each FVG highlighted were formed in alignment with the MACD, and also in trend with the 50-EMA. Here’s how it works in a few simple steps:
- Trend filter: If the price is above the 50-EMA, look only for bullish FVGs. If below, look for bearish FVGs.
- Trend flip: If the MACD Line crosses above the Signal Line, it signals a bullish trend flip. If it crosses below, it signals a bearish flip. The cross should happen in alignment with the 50-EMA’s trend.
- Short term momentum: If the MACD histogram bar is green, it means there is bullish momentum. If it’s red, bearish momentum.
- Alignment: The EMA-trend, MACD cross direction, and histogram should all align in order for a FVG to be valid. Once validated, we can trade these FVGs as usual.
With these multiple layers of confirmation, this strategy is particularly effective on smaller timeframes like the 5-minute chart, where price movements tend to be noisier.
| Long trade 🌱 | Short trade 🐻 | |
| MACD | Default settings – Fast Length-12, Slow Length-26, Signal Smoothing 9 | |
| Moving Average | 50-EMA | |
| Setup | Price is above 50-EMA. Fair Value Gaps are formed with bullish MACD cross, and green histogram. | Price is under 50-EMA. Fair Value Gaps are formed with bearish MACD cross, and red histogram. |
| Entry Conditions | Go long when the price retests the CE, or shifts above the FVG with a green/bullish candlestick. | Go short when the price retests the CE, or shifts below the FVG with a red/bearish candlestick. |
| Take Profit (TP) | 1:1.5 Risk-to-Reward | 1:1.5 Risk-to-Reward |
| Stop Loss (SL) | Below the first candle of the FVG | Above the first candle of the FVG |
Fair Value Gap with Relative Strength Index (RSI)
RSI Divergence signals can work hand-in-hand with Fair Value Gaps (FVGs), as a divergence can signal the start of a potential reversal, while the FVG provides a logical and timely entry point.
Here’s how they synergise together:
- When an Relative Strength Index (RSI) divergence lines up with the formation of a FVG, it can mark the beginning of a pivot move—giving us an early confirmation of an impulsive move.
- An RSI divergence can also hint at the creation of an Inverse Fair Value Gap (IFVG). This adds context and helps filter out FVGs that are less likely to hold, and more likely to turn into an IFVG.
When put together, this is how it would look:
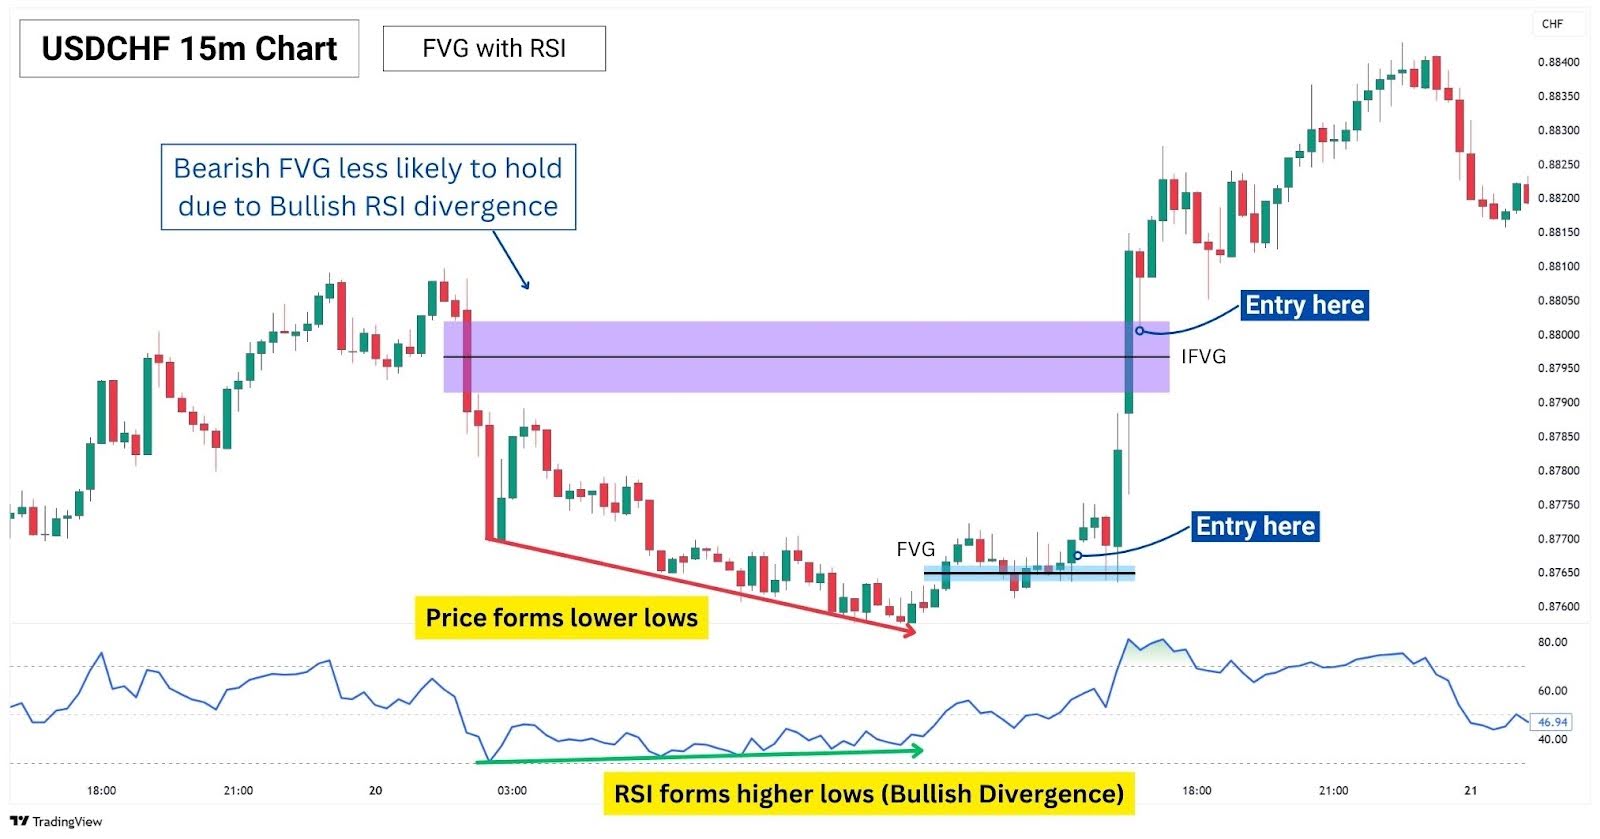
Notice how the earlier bearish FVG failed to hold, and instead transformed into an IFVG. This demonstrates how an RSI divergence can provide traders a deeper understanding of market conditions, and alert us early to this possibility.
In this trade setup, traders could have entered at the FVG formation following the bullish RSI divergence, anticipating a reversal.
Then, instead of fully taking profits at the bearish FVG, partial profits could be taken, anticipating a breakthrough of the FVG and further continuation. This deeper understanding of market conditions can produce trades with risk-to-reward ratios higher than 1:2.
| Long trade 🌱 | Short trade 🐻 | |
| RSI | Default settings – 14-length, source: close or hlc3 | |
| Setup | When the price is dropping, look for a regular bullish or hidden bullish divergence on the RSI. | When price is rising, look for a regular bearish or hidden bearish divergence on the RSI. |
| Entry Conditions | Go long on the retest of a bullish FVG or IFVG, following the creation of a bullish divergence. | Go short on the retest of a bearish FVG or IFVG, following the creation of a bearish divergence. |
| Take Profit (TP) | 1:2 or at next resistance | 1:2 or at next support |
| Stop Loss (SL) | Below the first candle of the FVG | Above the first candle of the FVG |
Fair Value Gap with Fibonacci Retracement Levels
Fibonacci Retracement is a tool used to identify key levels between a swing high and swing low, especially when an impulsive move has occurred. In a way, they are very similar to FVGs, which naturally occur when dramatic price swings emerge.
Therefore, it’s not uncommon for Fibonacci retracement levels to overlap with FVGs, creating powerful key points of interest.
The strongest Fibonacci levels are typically the 32.8% (when price is very bullish), 50%, and 61.8%—the most important retracement level to watch, where a bounce is typically expected in a trend.
By pairing this with FVGs, we can identify where price is most likely to experience a pivot. For this strategy, we will only focus on trading FVGs at the 50% retracement or beyond. This is because bounces at the 38.2% only occur during times of extreme momentum, which is much rarer compared to a retracement back to the 50% or 61.8%.
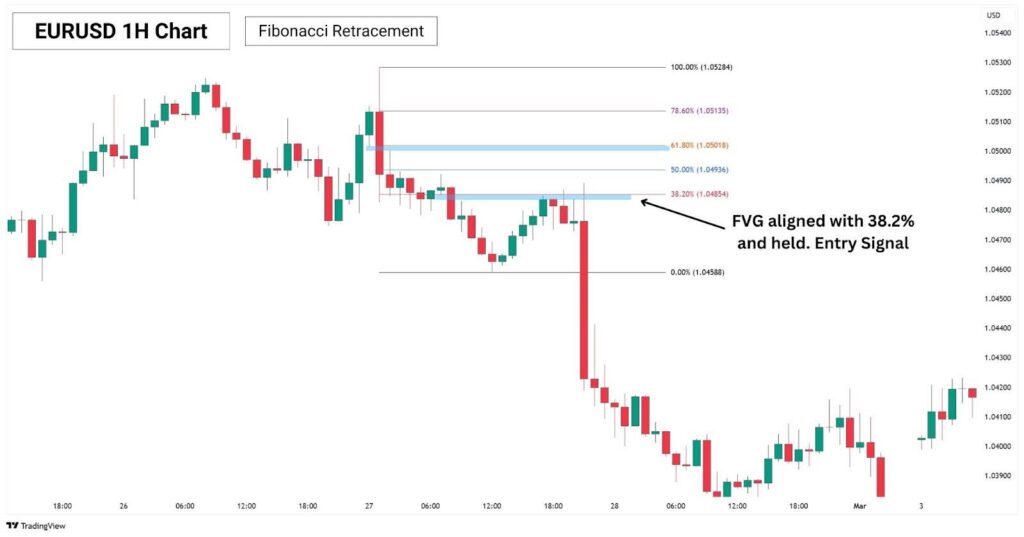
To illustrate this, have a look at this EURUSD 1H chart:
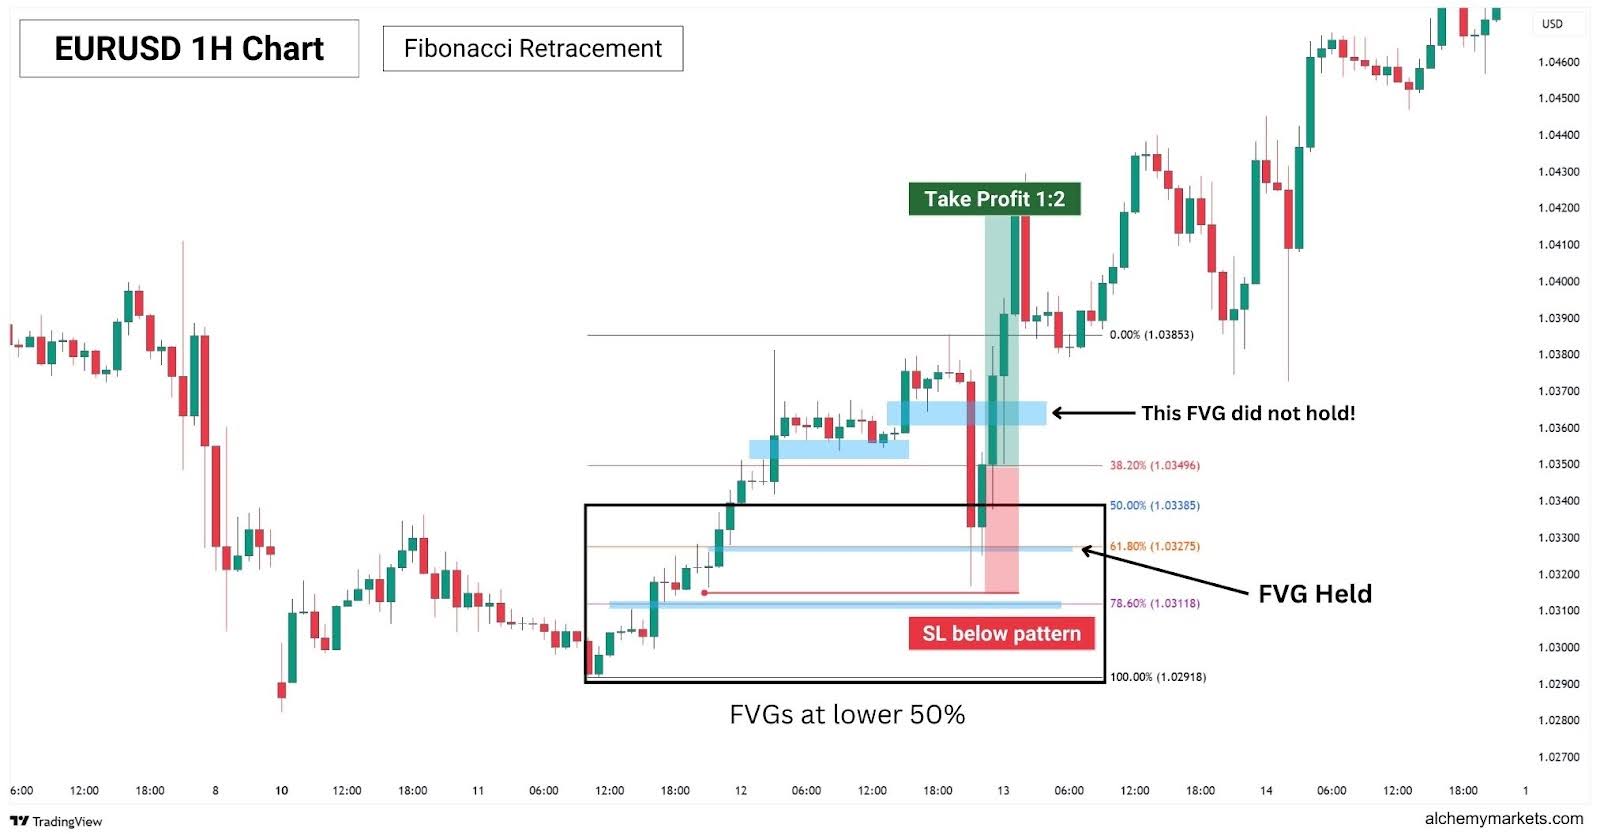
Notice how the price did not respect the 38.2% FVG, while it bounced almost perfectly at the FVG aligned with the 61.8% FIbonacci retracement. This highlights how prioritisng your FVGs beyond the 50% retracement can be quite beneficial..
That being said, it does not disqualify trades from the 38.2% FVG—as long as you see a clear rejection from the CE of the FVG or shift out of the FVG zone:
Overall, combining Fibonacci retracement levels with the FVG can be a simple, yet effective way of finding strong points of interest to trade continuations. The key here is to wait for a confirmation and clear reaction, before risking a trade.
| Long trade 🌱 | Short trade 🐻 | |
| Setup | When there is a new high created, draw a Fibonacci Retracement from swing low to swing high. Then, focus on FVGs that align with 50% Fib or beyond. | When there is a new low created, draw a Fibonacci Retracement from swing high to swing low. Then, focus on FVGs that align with 50% Fib or beyond. |
| Entry Conditions | Go long when price bounces off the CE of a FVG that lines up with the 50%, 61.8%, or 78.6% Fib retracement, or after it closes above the gap. | Go short when price rejects at the CE of a FVG that lines up with the 50%, 61.8%, or 78.6% Fib retracement, or after it closes below the gap. |
| Take Profit (TP) | 1:2 | 1:2 |
| Stop Loss (SL) | Below the first candle of the FVG | Above the first candle of the FVG |
What are the key metrics to consider when trading Fair Value Gap?
It’s important to consider a few factors when trading FVGs to improve your consistency in trading them. Doing so will help you find the best FVG setups, and improve your overall trade quality.
Consider the following:
- Timeframe — Prioritise higher timeframe FVGs over small timeframes, especially when they are signalling opposite directions.
- Reaction — Avoid using limit orders at FVGs, as their viability is based on the reaction it provides.
- Type of FVG — Understanding what a PFG, BFG, RFG, and IFVG means will help you make better trade decisions.
- Location of FVG — Recommended to trade FVGs beyond 50% retracement of a price swing.
- Market Structure — When a FVG aligns with a broken support, resistance, or another SR level, its reliability is improved.
- Mitigation Status — FVGs that are mitigated are less likely to hold, reducing their reliability.
Advantages of Trading on the Fair Value Gap
Fair value gaps can provide extra insights into the market, giving traders a logical point of entry and confirmation into a trade. This core advantage is the reason why traders love trading FVGs so much, giving rise to its popularity in technical analysis.
- Market Context: FVGs signal institutional activity, which increases the likelihood for a reaction to happen when the FVG is revisited. This understanding can add confidence to our technical analysis and help us take trades at logical points in the chart.
- Trade confirmation: When a FVG appears at a SR zone, traders can see this as a confirmation that the SR zone is likely to hold. Then, the FVG itself provides a logical point of entry.
- Versatility: FVGs can appear on any timeframe, any asset, and be combined with a variety of technical analysis styles. It also does not require an indicator, making FVGs able to slot into almost any strategy.
Disadvantages of Trading on the Fair Value Gap
Despite its advantages, FVGs can be inaccurate and sometimes even confusing to trade. This is due to the frequency of signals, and therefore, will require more nuance from the trader to execute with consistency.
- Hard to spot: Unlike a traditional market gap where a gap in the price chart is visually obvious, a FVG can be difficult to spot as it’s a gap within three candlesticks.
- High frequency: Fair Value Gaps can occur frequently and also in opposing directions, this makes trading them a little confusing for a newcomer to technical analysis. Understanding the overall trend, IFVGs, and market structure is required for trading FVGs.
- Requires Technical Expertise: Understanding market structure, momentum, and the type of FVG will be critical to your success in using Fair Value Gaps in trading. This can be a little more difficult for beginners.
Inverse Fair Value Gap
An inverse fair value gap, also known as an IFVG, occurs when a fair value gap is cut right through. This failure signals the presence of Smart Money pushing the price past a point of interest, and could mean the Smart Money is ready to reverse the price action.
IFVGs are more effective on higher timeframes as they strongly suggest the presence of Smart Money, and often are created with an overlap with a FVG—creating a strong point of interest for a trade.
Fair Value Gap vs Inverse Fair Value Gap
A fair value gap appears when there is rapid buying or selling in the chart. However, an inverse fair value gap occurs when a fair value gap is then reversed, invalidating its previous role as a support or resistance.
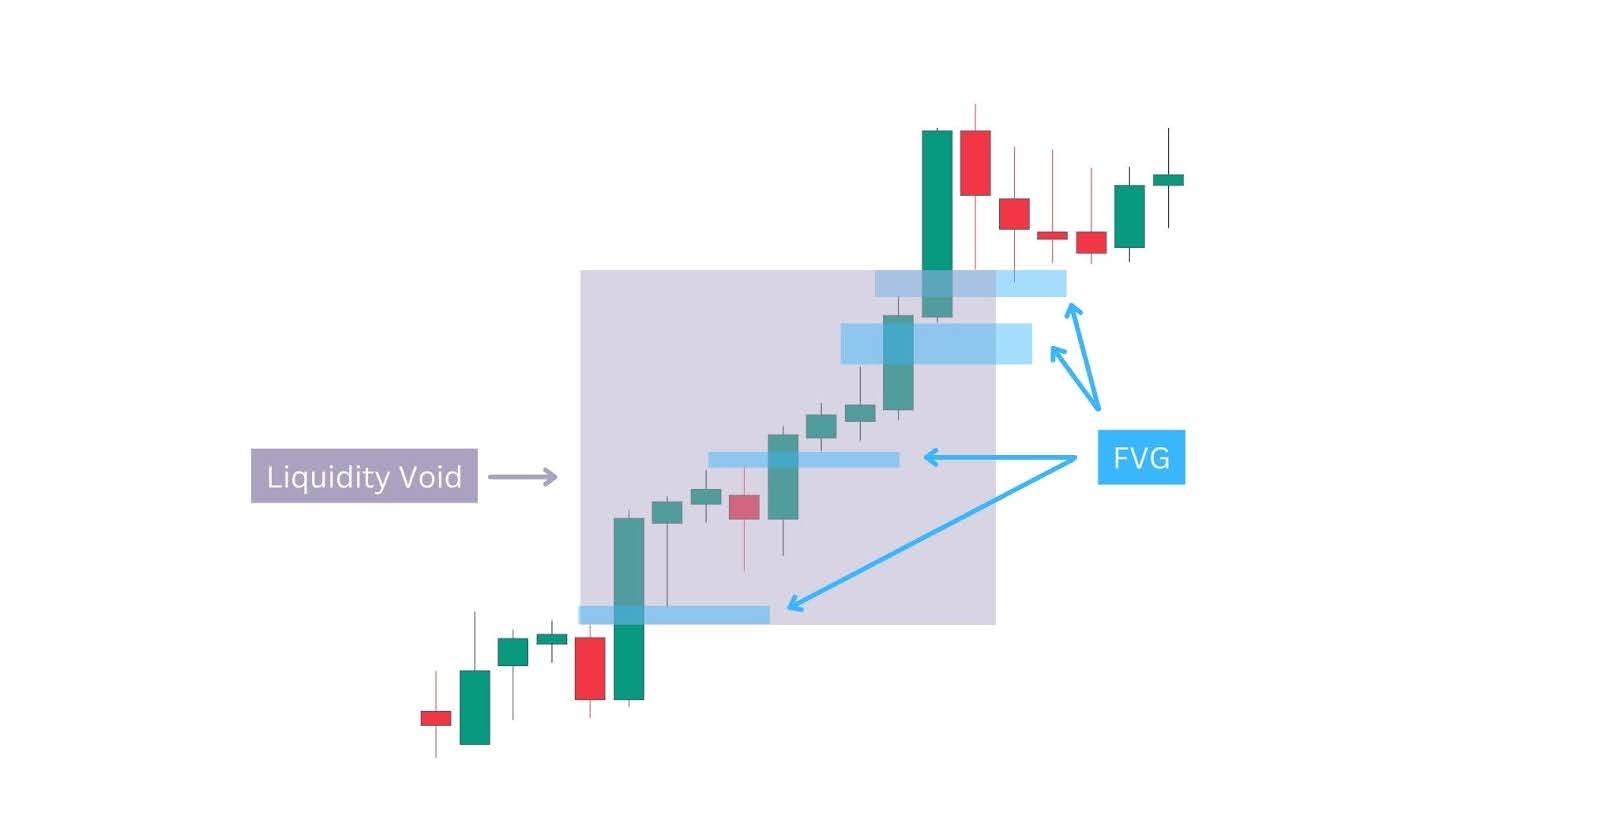
Fair Value Gap vs Liquidity Voids
Liquidity voids refer to dramatic, uninterrupted price movements, typically marked by large-bodied candles with minimal wicks. Like Fair Value Gaps (FVGs), they highlight areas of price imbalance where orders may have been skipped.
The key difference lies in structure: while a Fair Value Gap is defined by a specific three-candle pattern, a liquidity void can stretch across multiple candles, covering a much broader range.
Interestingly, a liquidity void can contain multiple instances of Fair Value Gaps, making them synergistic tools. An SMC trader could first spot a liquidity void, then narrow in on the FVGs it contains to pinpoint high-probability zones for price reaction.
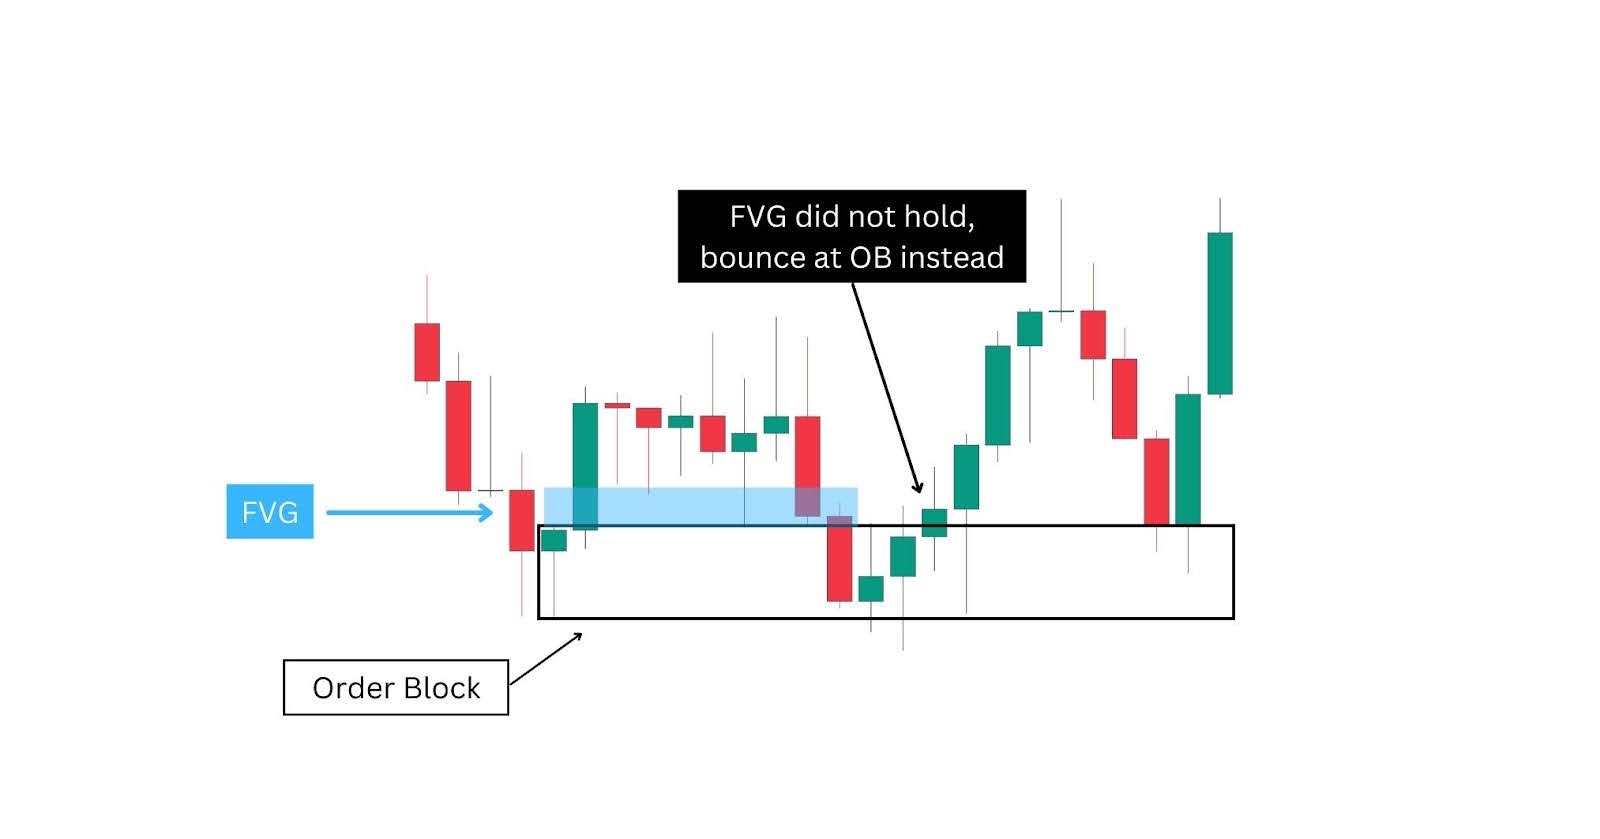
Fair Value Gap vs Order Block
Similar to FVGs, order blocks signal where a large number of limit orders are gathered, acting as a support and resistance zone. They are marked by the price range of the last candle before a pivotal swing.
These two concepts work hand-in-hand in finding high probability setups for support/resistance trading:
- A fair value gap can form when the price revisits an order block.
- If a FVG fails, the order block can act as the next line of support/resistance, giving us another point of interest.
Fair Value Gaps vs. Other Price Gaps
There are many types of gaps in price trading, with fair value gaps being one of them. Let’s explore the most interesting and different gaps to be aware of.
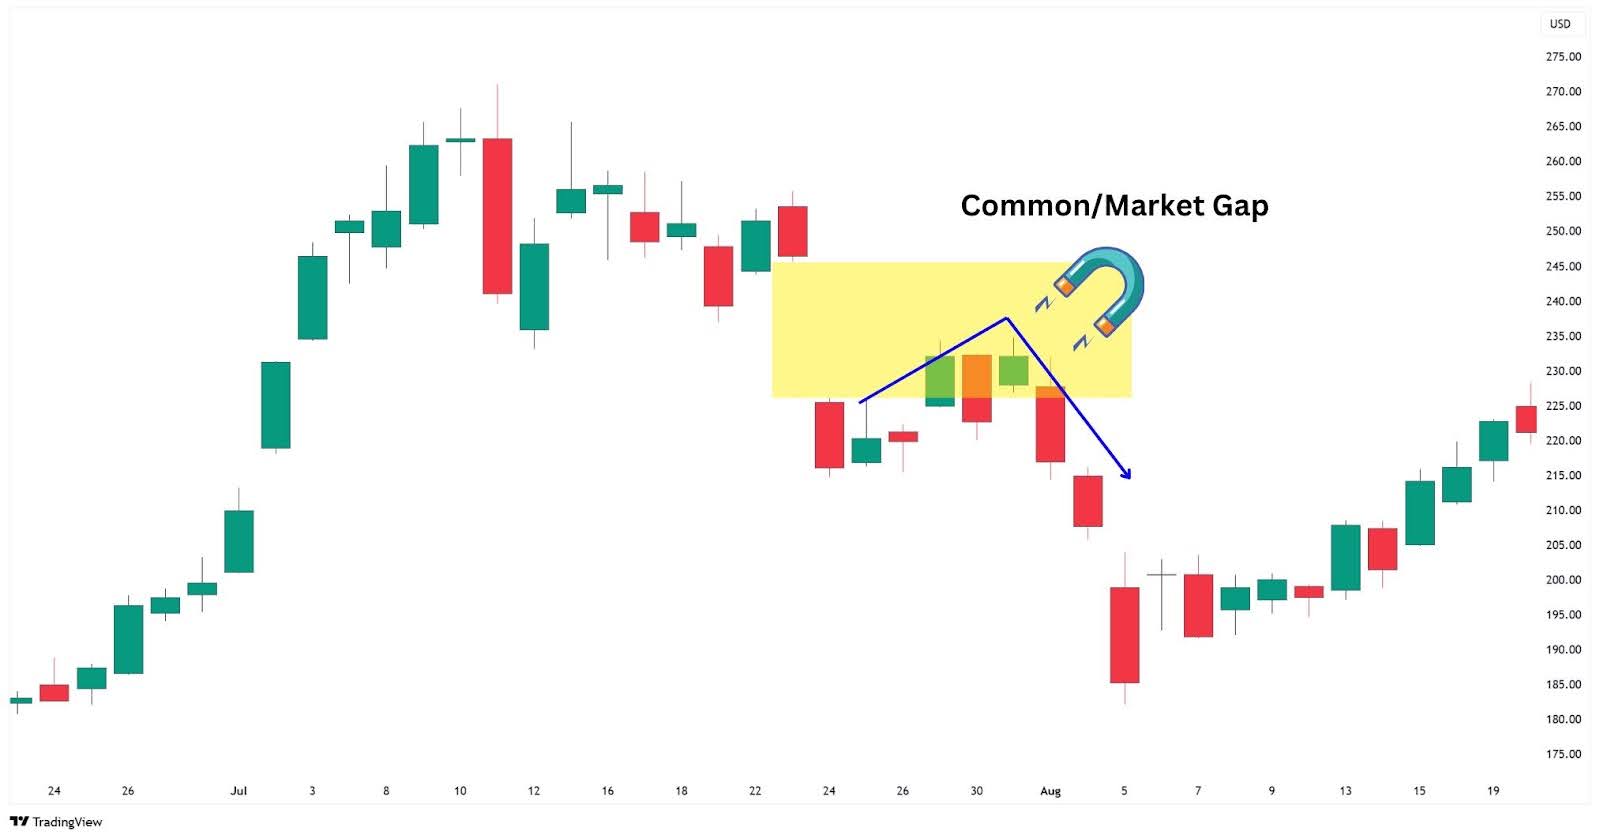
Fair Value Gaps vs. Common Gaps
A common gap is a price jump up or down that leaves a blank space on the chart. Many traders believe gaps act like magnets, pulling price back to fill the zone before continuing. This is especially common in stocks, where earnings reports or weekend market closures can cause sharp moves at the next open.
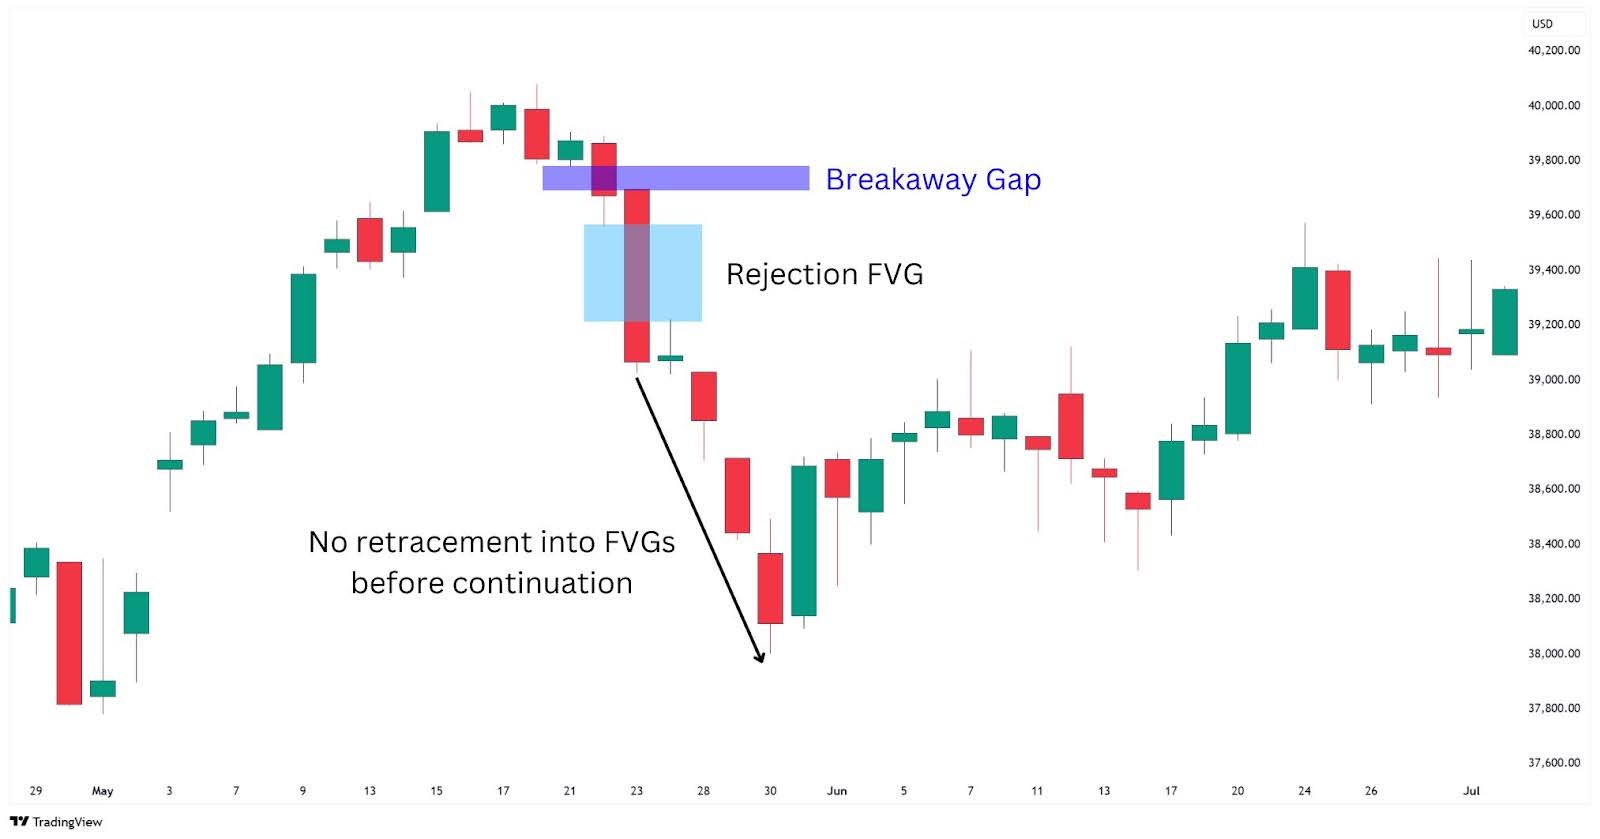
Fair Value Gaps vs. Breakaway Gaps
Breakaway gaps (BFGs) typically occur at the start of a strong trend, breaking out of a consolidation zone with high volume. In contrast, Fair Value Gaps are imbalances left behind during sharp moves and often act as areas price may return to before continuing in the trend.
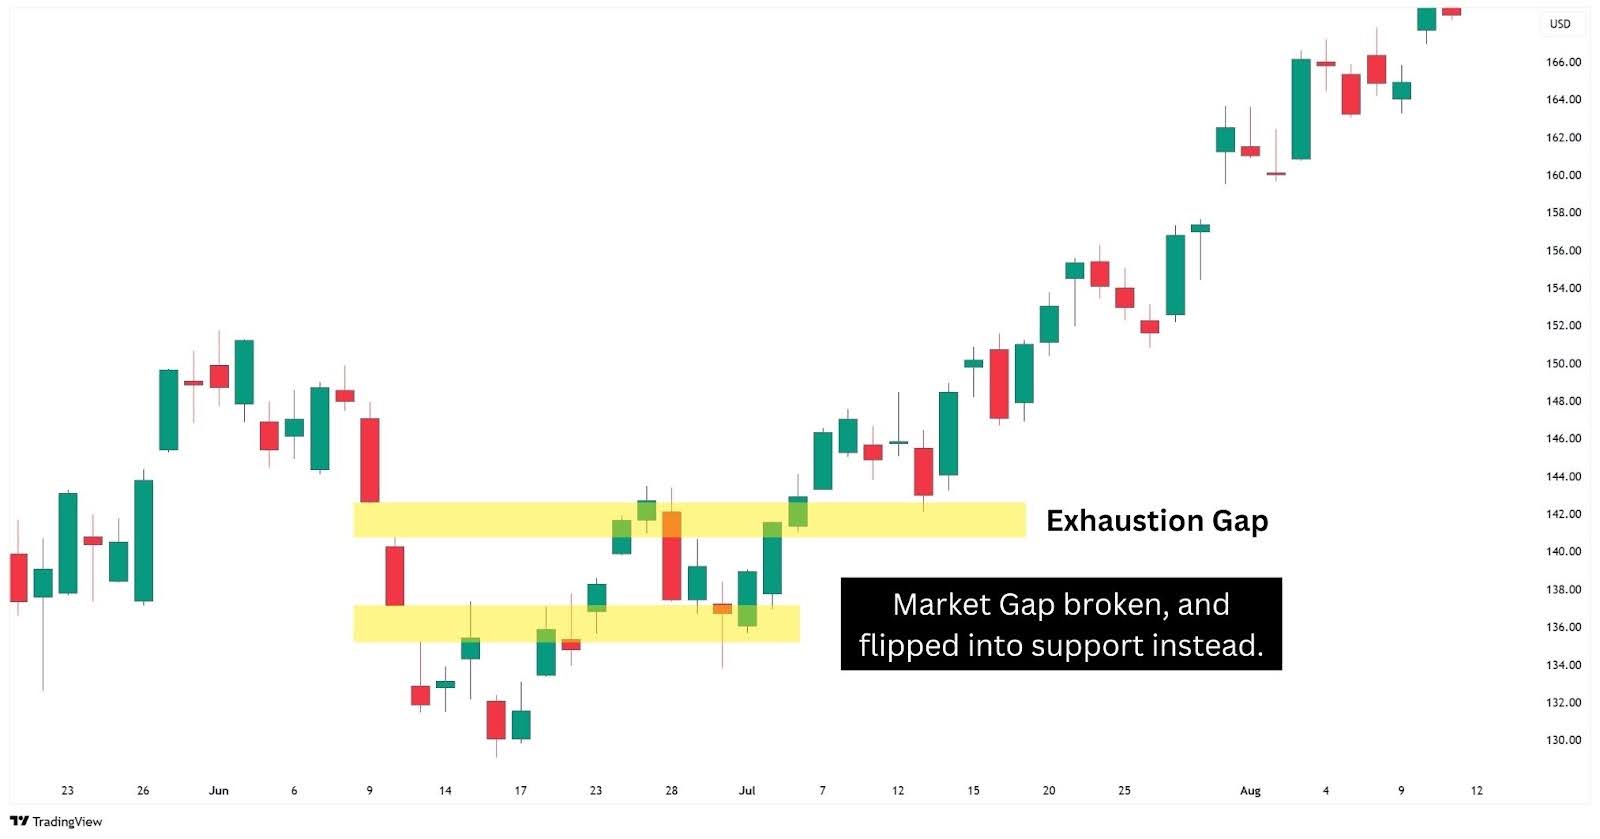
Fair Value Gaps vs. Exhaustion Gaps
Exhaustion gaps show up near the end of a trend, signalling a possible reversal as momentum fades. They are most similar to IFVGs, where when broken, will flip in its role as a support or resistance, signalling a reversal from the initial gap direction.
What makes a Fair Value Gap valid?
A valid FVG usually forms between three candles, with a clear gap between the first and third. It gains strength if it aligns with key levels like order blocks or Fibonacci zones, and if price reacts cleanly when it returns to the gap. The mitigation status of a FVG also reflects its validity; if a FVG is fully mitigated then pivoted away from, it is unlikely to hold as support or resistance the next time it is revisited.
FAQ
What is the theory behind FVGs?
Fair Value Gaps reflect price imbalances caused by aggressive buying or selling—typically by institutions. The idea is that price moved too quickly to fill all orders, so it may return to that gap to rebalance.
Is a Fair Value Gap the Same as an Imbalance?
Yes—FVGs are a type of imbalance, specifically formed between three candles when the price skips over a zone, leaving a visible gap.
Can Fair Value Gap trading be automated?
Definitely. Since FVGs follow a clear structure (three-candle pattern with no overlap), they can be coded into bots or indicators for automated setups.
How does Fair Value Gap differ from other strategies?
FVGs focus on price inefficiencies left behind by Smart Money, while most strategies just react to price levels or indicators. It’s more about why price moves, not just where.
How does market volatility affect Fair Value Gap trading?
Volatility can both create and validate FVGs. High volatility often leads to strong, clean gaps—but it can also cause false signals if the market is too erratic.
Can fair value gaps be used across different markets?
Yes, FVGs work on forex, stocks, crypto, and even commodities. As long as there’s volume and clean price action, you’ll find FVGs.
What are the Common Fair Value Gap Mistakes to Watch Out
Trading every gap blindly. Not all FVGs are equal—check for confluence, mitigation status, and trend alignment before entering.
What Is the Best Time Frame To Use for Fair Value Gap?
Higher timeframes (4H and above) offer cleaner, more reliable FVGs. Lower timeframes can work too—but they’re often noisier and need more confirmation.
What stocks or securities are best for fair value gaps (FVGs)?
Liquid stocks that react to news—like tech, financials, or anything with strong institutional activity—are ideal for spotting FVGs.
How accurate are fair value gaps (FVGs)?
They’re not guaranteed, but when combined with market structure and confluence, FVGs can offer high-probability setups. Their strength lies in context.
Who first identified the Fair Value Gap ?
The term gained popularity through Smart Money Concepts traders, especially in the ICT (Inner Circle Trader) community.
What is the smart money concept of FVG?
It’s the idea that big players (banks, hedge funds) leave “footprints” in the form of FVGs. These gaps hint at institutional positioning and future price intent.
Is the Fair Value Gap Bullish or Bearish Pattern?
It depends. A bullish FVG forms during upward moves and often acts as support. A bearish FVG forms during down moves and can act as resistance.