


Written by:

Reviewed by:

Bearish
- February 28, 2025
- 29 min read
Hidden Bearish Divergence Comprehensive Guide
What is a Hidden Bearish Divergence?
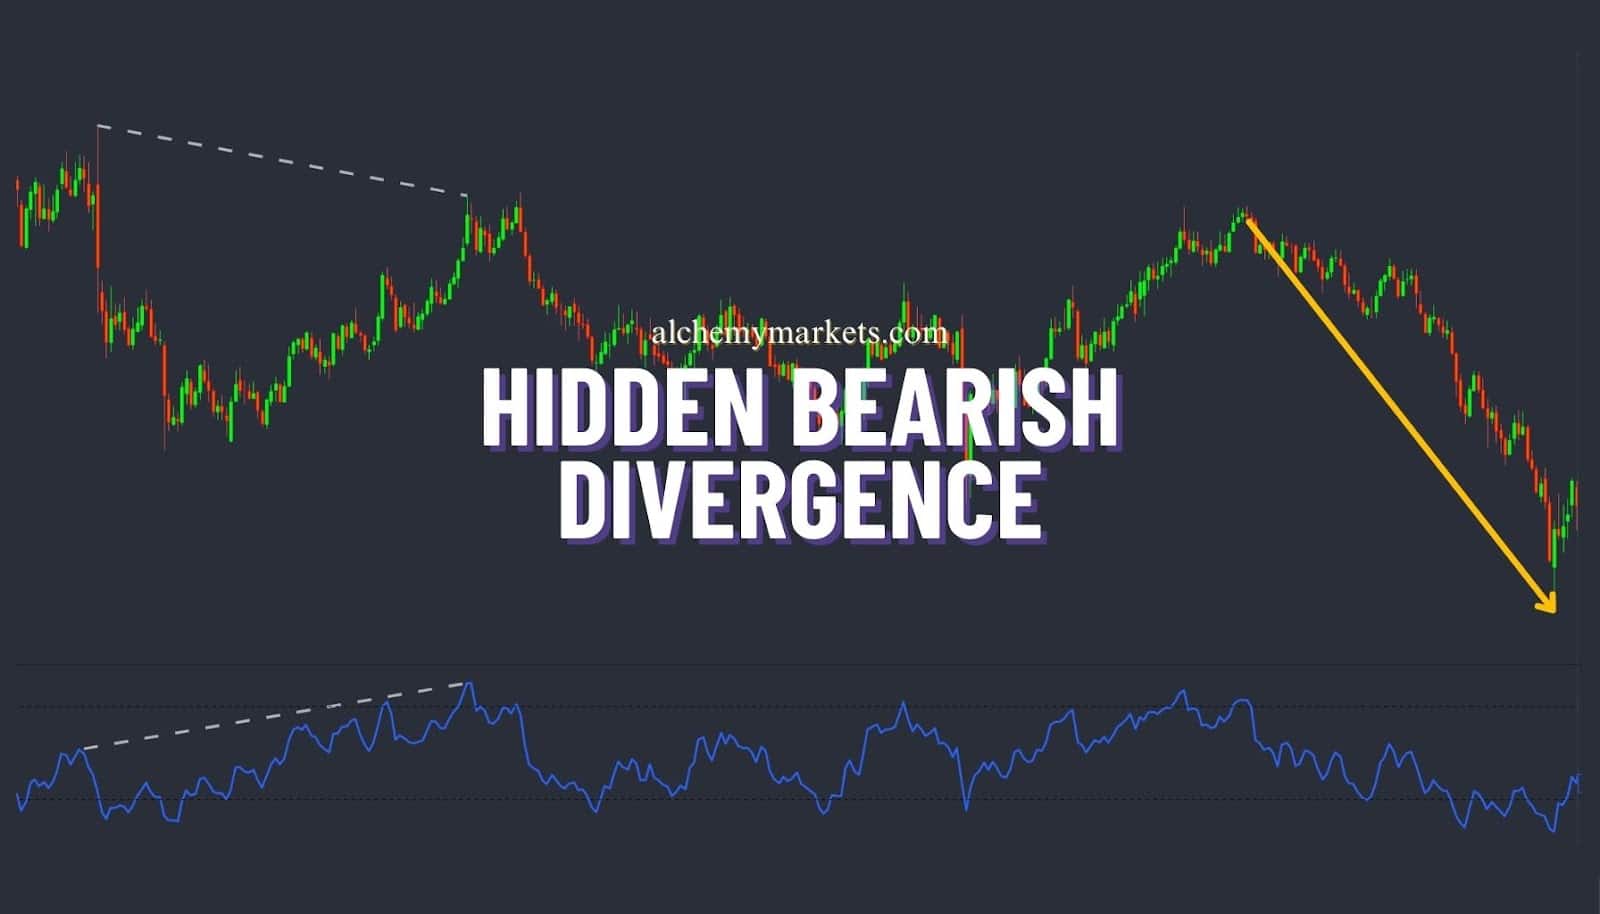
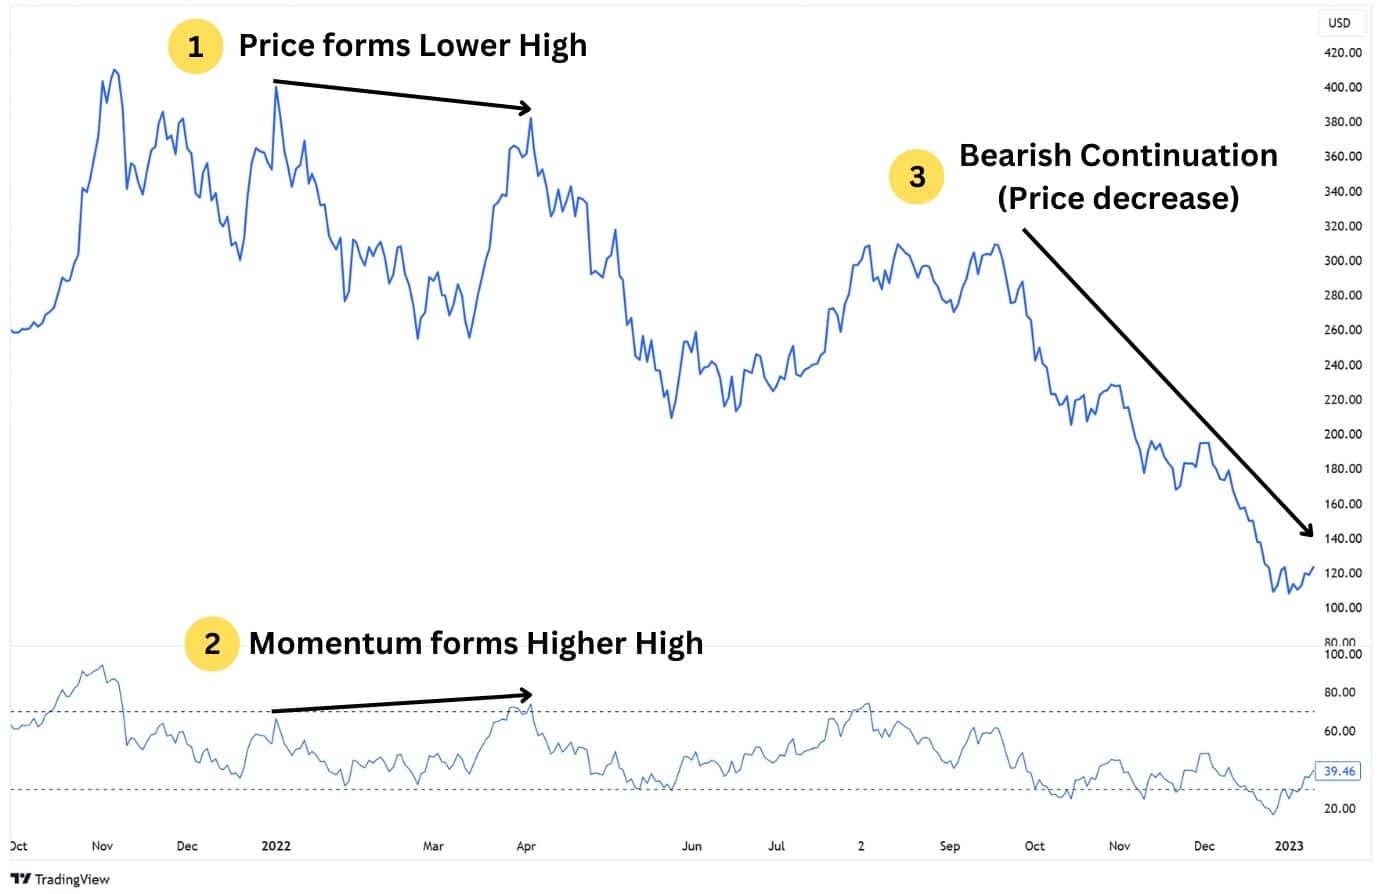
Hidden bearish divergence, also known as bearish hidden divergence, occurs when the price forms a lower high while a momentum indicator, such as RSI or MACD, forms a higher high. This discrepancy suggests weakening bullish momentum and a potential continuation of the broader downtrend.
Hidden bearish divergence is often used by technical traders to gauge the probabilities for continuation during a downtrend.
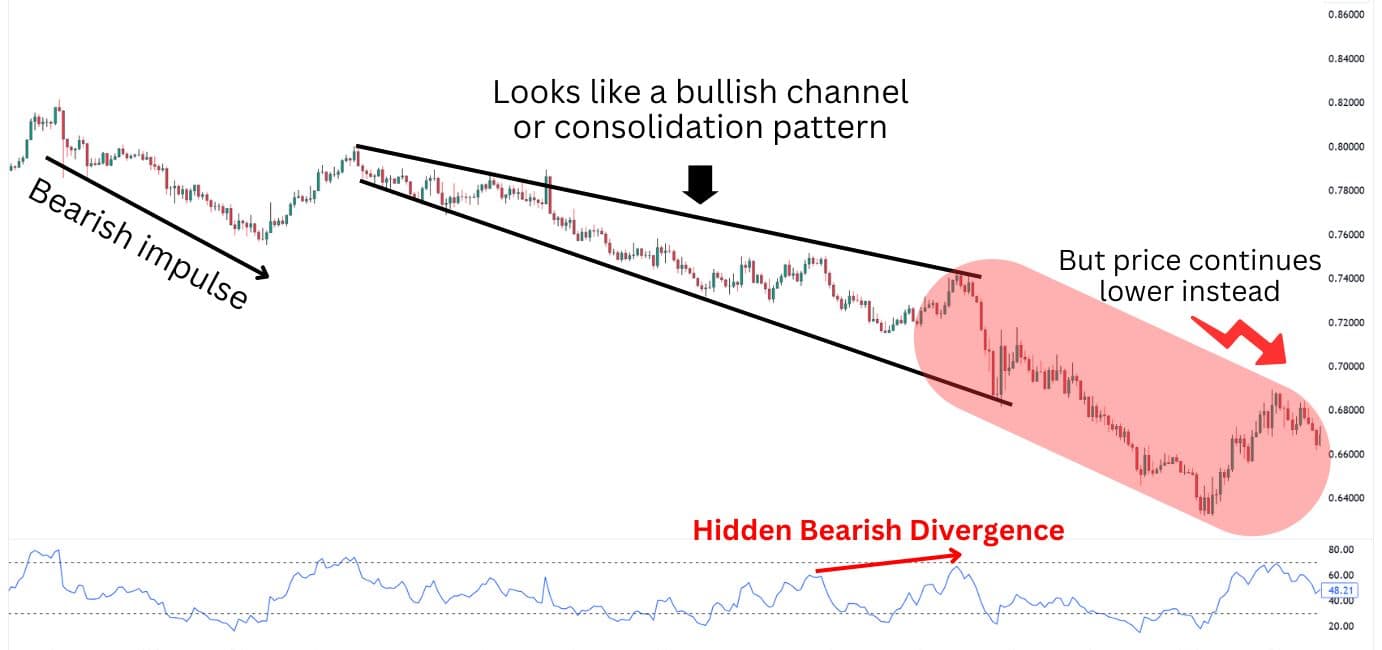
Sometimes, a hidden bearish divergence can appear in seemingly bullish consolidation patterns, such as a falling wedge, or downwards descending channel (pictured below). Inexperienced traders may fall for the false bullish signals, and choose to long (buy) instead of looking for a sell position.
What is Hidden Divergence?
Divergences can signal a reversal or a continuation of the broader trend. Hidden divergences in particular signal trend continuation amidst a broader uptrend or downtrend. Hidden divergence patterns are crucial in technical analysis as they help traders identify the continuation of trends rather than reversals.
Hidden bearish divergence specifically signals the continuation of the broader downtrend.
What Is a Regular Divergence?
Also known as a regular or classic divergence, the regular divergence is a trend reversal signal. It suggests that the current trend’s momentum is weakening, thus improving the conditions for a reversal
A regular bearish divergence refers to a trend reversal of the current uptrend, marking the beginnings of a downswing.
How to Identify the Hidden Bearish Divergence?
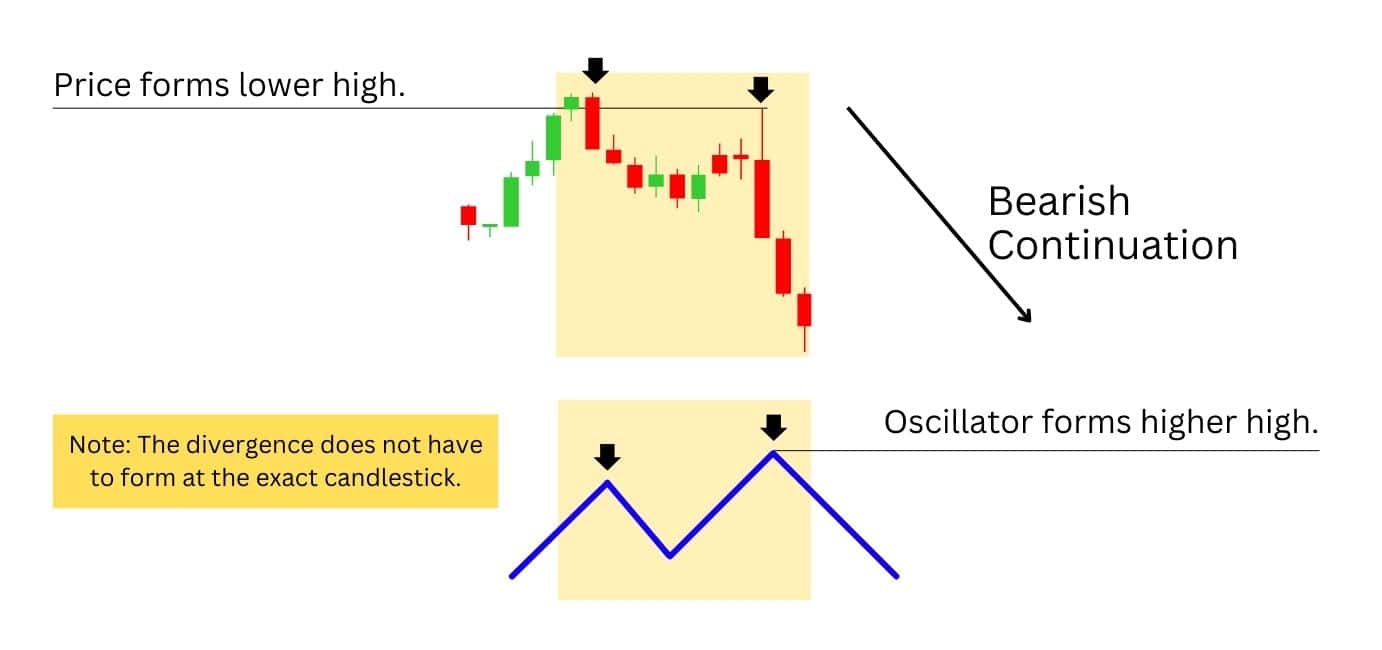
To find a hidden bearish divergence, observe the highs of the price chart and momentum indicator. The price should form a lower high, as the momentum forms a higher high – creating the unique hidden bearish divergence pattern.
Let’s break it down step by step:
- Look for a downtrend, which needs to have lower lows, and lower highs.
- Notice where the price forms a lower high.
- Add on an oscillator (momentum indicator), such as RSI, MACD, Stochastics, or Rate of Change etc.
- Notice if the oscillator forms a higher high – which, combined with the price’s lower high, creates the hidden bearish divergence.
Note that: The price and momentum highs don’t need to align perfectly, just close in their locations. Momentum indicators often use smoothing, which can slightly shift peaks and troughs compared to price action.
What Does a Hidden Bearish Divergence Tell You
This divergence highlights that bulls are struggling to push prices higher, even with stronger momentum. It often signals that sellers are still in control, making it useful for traders looking to confirm a downtrend continuation or notice weakening market strength before a drop.
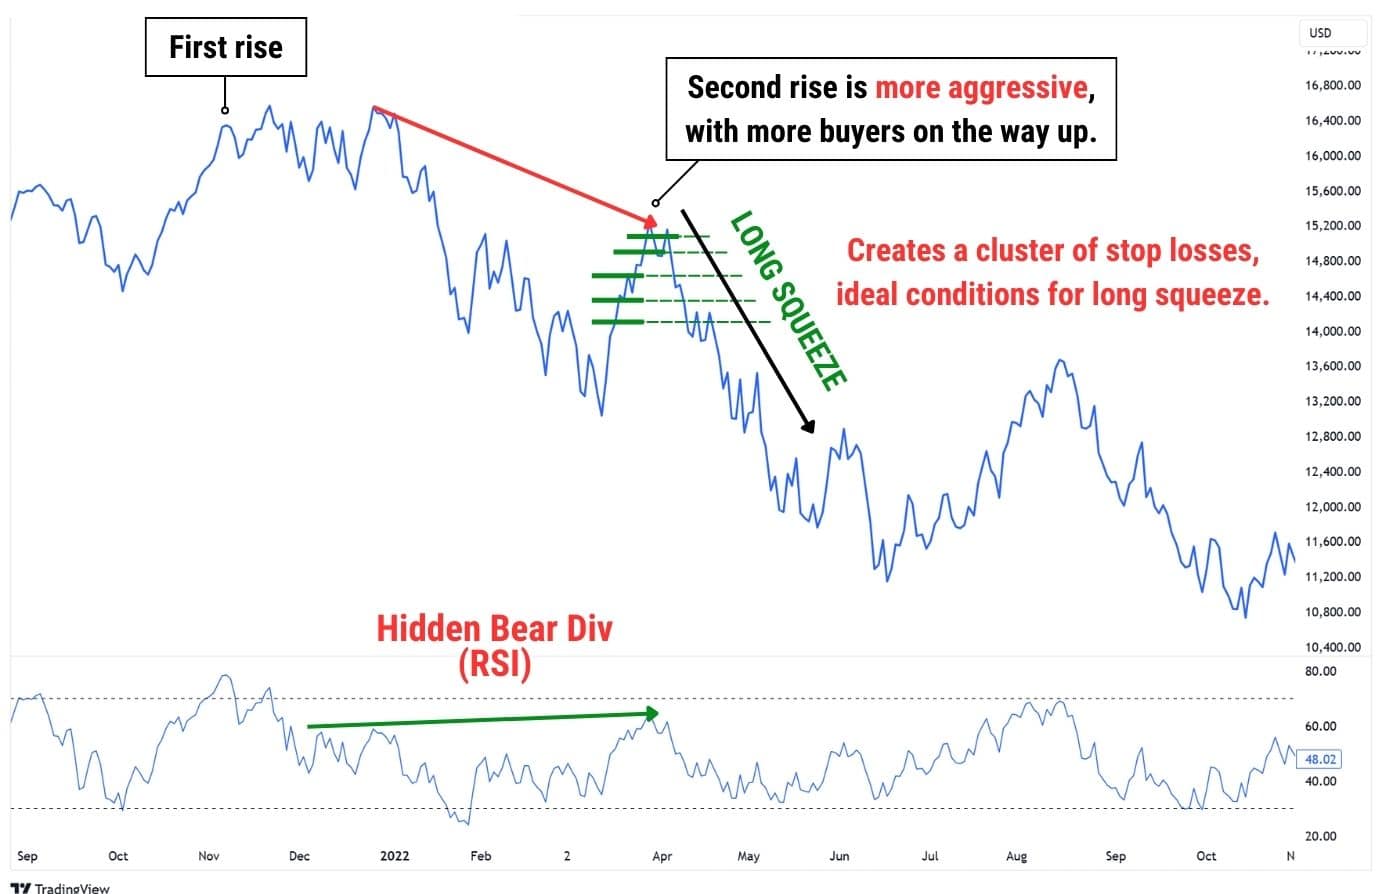
Additionally, the increased momentum reveals the likelihood that many long positions have opened during the second rise. This also means stop losses and liquidation points are gathered around this price level. If the price starts to fall, these stop losses can get triggered, potentially triggering a long squeeze.
A long squeeze happens as price drops and triggers the stop loss of long positions, these bulls are forced to sell their positions, leading to increased selling pressure. This takes prices lower and triggers even more stops, which reinforces the selling, and so on.
Importance of Hidden Bearish Divergence
Hidden divergence is a crucial concept in technical analysis, as it helps signal potential trend continuation in a downtrend. It occurs when the price forms a lower high while the momentum indicator makes a higher high, suggesting weaker buying pressure despite increased bullish momentum.
Being able to recognize hidden bearish divergence can keep traders out of riskier long trades and instead pivot their attention to a potential price drop. This pattern is particularly useful across various markets, including stocks, commodities, indices, and currency pairs in forex trading.
In forex, hidden bearish divergence can help traders anticipate the continuation of a bearish trend in currency pairs, allowing them to refine their entries and avoid false bullish signals. By applying this concept across different asset classes, traders can enhance their technical analysis toolkit and improve their decision-making process.
Hidden Bearish Divergence Example
Following an initial downtrend, a hidden bearish divergence forms on this Silver 1H Chart from July 25th to August 1st, 2024.
The RSI indicator clearly formed a higher high – indicating increased bullish momentum, yet the price formed a lower high – indicating weakness. After a brief moment of consolidation, Silver eventually sees a drop by over 9.30% towards the $26.500 price zone.
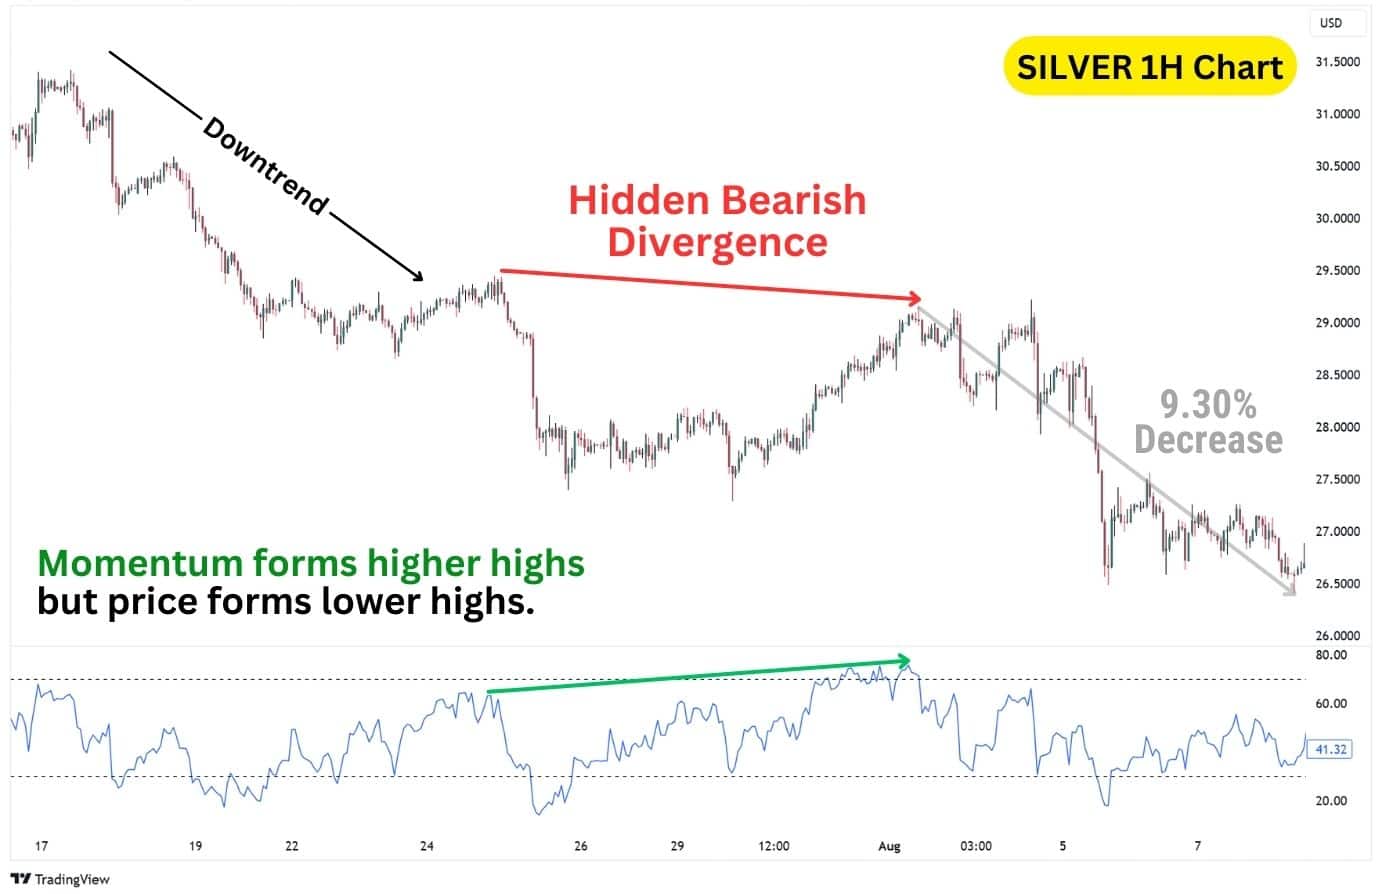
Hidden divergences often take longer to develop, with this 1H hidden divergence taking over five trading days to fully play out. Because of this extended formation time, hidden divergence signals are generally stronger than regular divergences.
Take a look at this EUR/USD daily chart, which shows both a hidden bearish divergence and a regular bullish divergence—two conflicting signals. The regular bullish divergence suggests a potential trend reversal, while the hidden bearish divergence indicates the downtrend is likely to continue.
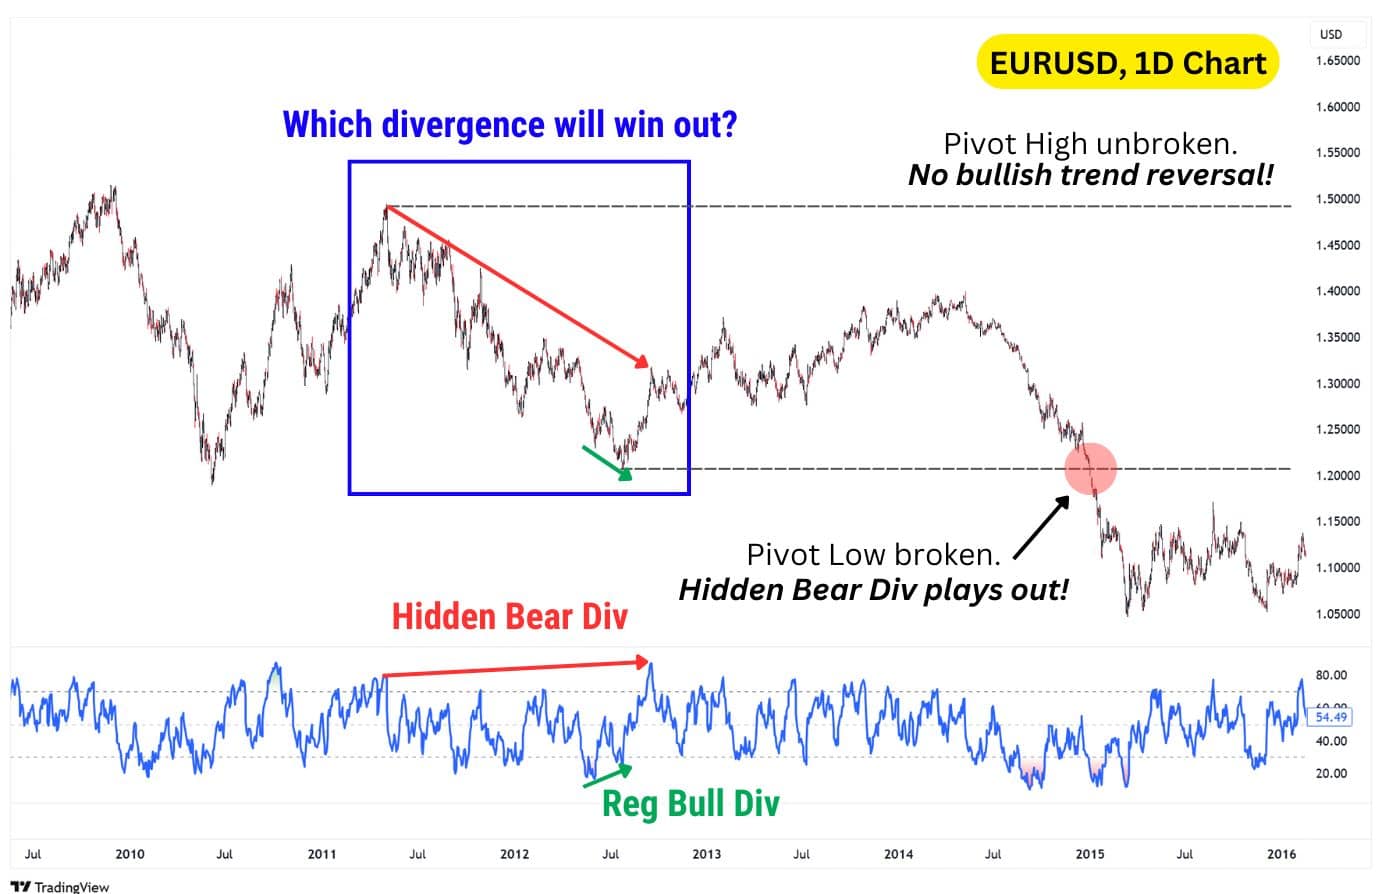
As the price moves up from the lows, notice how the rally is simply a pullback within the broader downtrend. The key pivot high remains unbroken, confirming there’s no bullish trend reversal. Meanwhile, the price breaks the pivot low, validating the hidden bearish divergence signal for the downtrend’s continuation.
Hidden Bearish Divergence Technical Indicators
Divergences are most commonly spotted by using oscillators, otherwise known as momentum indicators. Well-known indicators include RSI, MACD, and Stochastics, but lesser known indicators such as Rate of Change, OBV, and the Money Flow Index can also be used for identifying and trading these divergences.
Functionally, these indicators would work in the same manner for discovering hidden bearish divergences:
- Momentum indicator forms a higher high.
- Price chart forms a lower high.
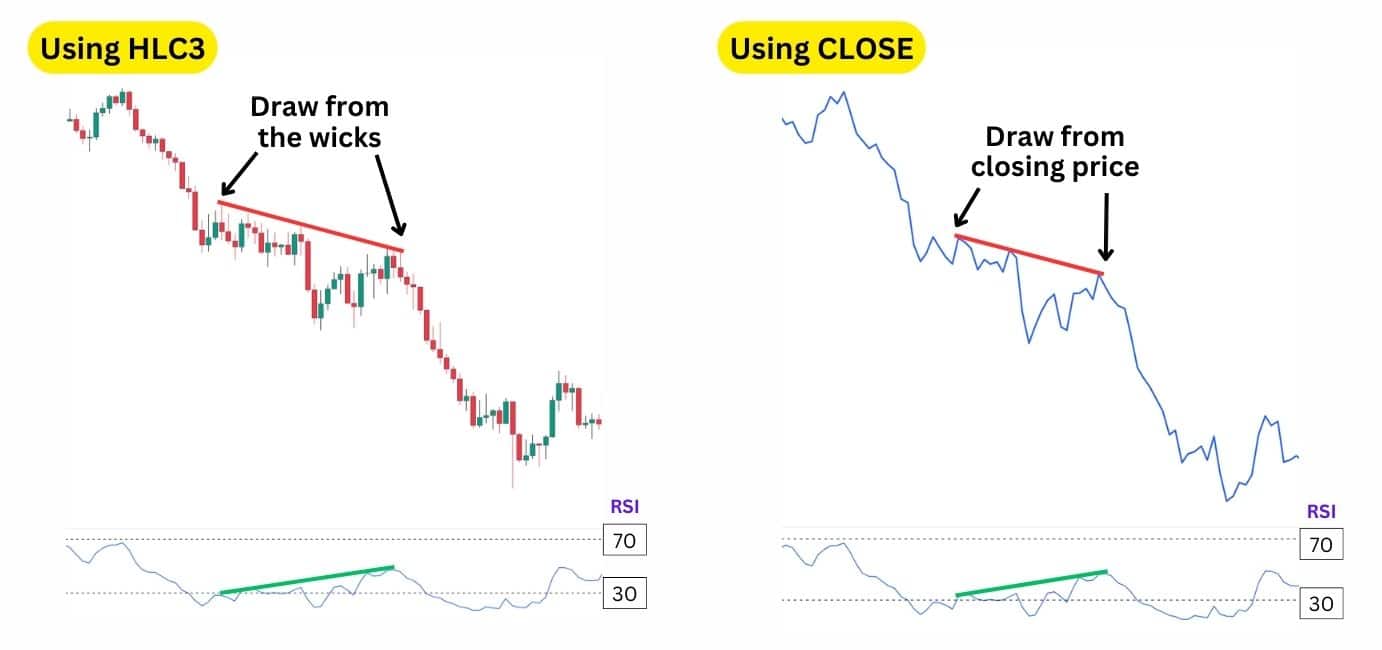
| An important tip: The source setting of your indicators matter. The source dictates whether your indicator uses candle bodies, or candle wicks for its calculation. To align better with wick-based divergence analysis, traders can set these indicators’ source to “HLC3” (High, Low, Close). This setting includes price wicks, fitting the common practice of using wick-based trendlines. However, if you are using line charts for your technical analysis, then the default “Close” source works perfectly fine as there are no wicks on line charts. |
To see the difference between using the HLC3 and CLOSE settings, observe this illustration below:
William’s %R
Williams Percentage Range (W%R) calculates the momentum of an asset, by plotting how far the price is from the highest high, and the lowest low within the last 14 candlesticks. The higher the Williams %R indicator is, the closer the price is towards its highest price. Conversely, the lower the W%R is, the closer the price is towards its lowest low.
| 0 Level: Indicates the highest price within the period. |
| -20 Level: When the W%R is above -20, it indicates potentially overbought conditions. |
| -100 Level: Indicates the lowest price within the period. |
| -80 Level: When the W%R is under -80, it indicates potentially oversold conditions. |
Example breakdown: The US30 (Dow Jones) daily chart price prints a lower high, while the W%R creates a higher high. Following a short consolidation, US30 finally moves lower in a continued bearish trend.
Money Flow Index (MFI)
Money Flow Index, or MFI, measures the inflow and outflow of trade volume on an asset, then plots it within a value of 0 to 100. Visually, it is quite similar to the RSI indicator, so some traders consider this a “Volume-Weighted RSI”.
| 80 Level: If the MFI goes above 80, it suggests the asset might be overbought. This hints at potential buyer exhaustion. |
| 20 Level: If the MFI goes under 20, it suggests the asset might be oversold. This hints at potential seller exhaustion. |
Example breakdown: Following a downtrend, the Amazon (AMZN) 4H Chart prints a lower high in price, while the MFI prints a higher high. Then, as the price breaks below the lowest low in the Hidden Bearish Divergence, we see further continuation to the downside.
Commodity Channel Index (CCI)
The Commodity Channel Index (CCI) calculates how far the price is from the 14-SMA, then plots it within the values of -200 and 200. Similar to the MFI and RSI, this indicator offers overbought signals, which can enhance the probability of a hidden bearish divergence.
| Zero Line: Represents the 14-SMA. |
| Upper Line (+100): Represents when price is significantly above average, signals overbought conditions if surpassed. |
| Lower Line (-100): Represents when price is significantly below average, signals oversold conditions if surpassed. |
Example breakdown: The multi week hidden divergence occurs on the Gold Weekly Chart, where the price of Gold has been dropping from $500 to $350 across months. Then, on a slight multi-week recovery, Gold finally forms a hidden bearish divergence, which continues the bearish trend for about 2 years.
Average Directional Index (ADX)
The ADX is an interesting oscillator with three major components: the ADX line, the -DI line, and the +DI line. These components work together to tell the directional bias and the momentum of an asset.
| ADX Line: Measures momentum as a whole. Moves higher with increasing momentum, and lower with decreasing momentum. |
| -DI Line: Represents bearish momentum. |
| Lower Line (-100): Represents bullish momentum. |
Example breakdown: The hidden divergence occurs on the Dow Jones (US30) 1H Chart, where the price has been dropping from $44,700 to $44,300. During this time, the -DI Line has crossed above the +DI Line, telling us that bears are in control. The ADX has also risen past 25, representing strong momentum. Eventually, the price of US30 continues lower to $43,400.
On-Balance Volume (OBV)
On-Balance Volume (OBV) tracks bullish volume as a line that moves with price changes. When the price closes higher, the OBV adds that candle’s volume. If the price closes lower, it subtracts the volume, causing the line to drop.
This unique method of calculating momentum takes into account the entire available data of the asset, and will theoretically keep rising over time. This means unlike the MFI, RSI, CCI and ADX, the OBV does not provide oversold or overbought signals.
| Bullish OBV: Represented by the OBV moving higher, and is an accumulation of volume. |
| Bearish OBV: Represented by the OBV moving lower, signalling an erasure of volume. |
Example breakdown: The F40, or CAC (French Stock Market Index), is showing signs of a bearish continuation as the price consolidates after a significant drop.
Some traders may view this consolidation as a signal for a bullish reversal, identifying a double bottom pattern in the process. However, keen eyed traders would notice the hidden bearish divergence, allowing them to seek out a short trade instead.
Force Index
The Force Index (FI) measures bullish and bearish momentum using both price changes and volume. It takes the difference between the opening and closing prices and multiples it by the volume.
Though similar to the OBV in its considerations of volume, the FI has the addition of a zero line, making it easier to identify trend shifts. Positive values represent bullish momentum, while negative values indicate bearish momentum.
| Bullish Force: Represented by the FI moving higher. The higher it is, the stronger the bullish momentum. |
| Bearish Force: Represented by the FI moving lower. The lower it is, the stronger the bearish momentum. |
Example breakdown: The USOIL 8H chart presents a huge shorting opportunity with this hidden bearish divergence. This comes after a two week downtrend, and signals there is potential for more downside on oil.
Balance of Power
Balance of Power (BOP) is an indicator that measures the averaged speed of price changes across a 14-period. The raw values are calculated using a complex formula, which can be simplified to the following equation:
| BOP = (Close – Open) / (High – Low) |
This method, combined with the moving average, measures momentum on a scale from -1 to 1, where a direction is suggested based on where the BOP is plotted.
| 0 Level: No price change and no directional momentum |
| 1 Level: Represents high bullish momentum |
| -1 Level: Represents high bearish momentum |
When spotting hidden bearish momentum, the BOP can reveal momentum spiking towards 1 while the price forms a lower high.
Hidden Bearish Divergence Trading Strategies
Like all divergence signals, the pattern alone should not be your sole reason to enter a trade. Divergences can fail, and they only simply represent an improvement of reversal or continuation conditions.
Therefore, a confirmation factor is required to trade divergence signals reliably.
In this section, we’ll break down several ways you can consider trading the hidden bearish divergence, using a confirmation factor, stop loss, and take profit methodology.
Trendline Break Hidden Divergence Strategy
This strategy uses a trendline break as the confirmation factor for a hidden bearish divergence signal. Giving us a clear guideline on when to enter a short trade with higher probability.
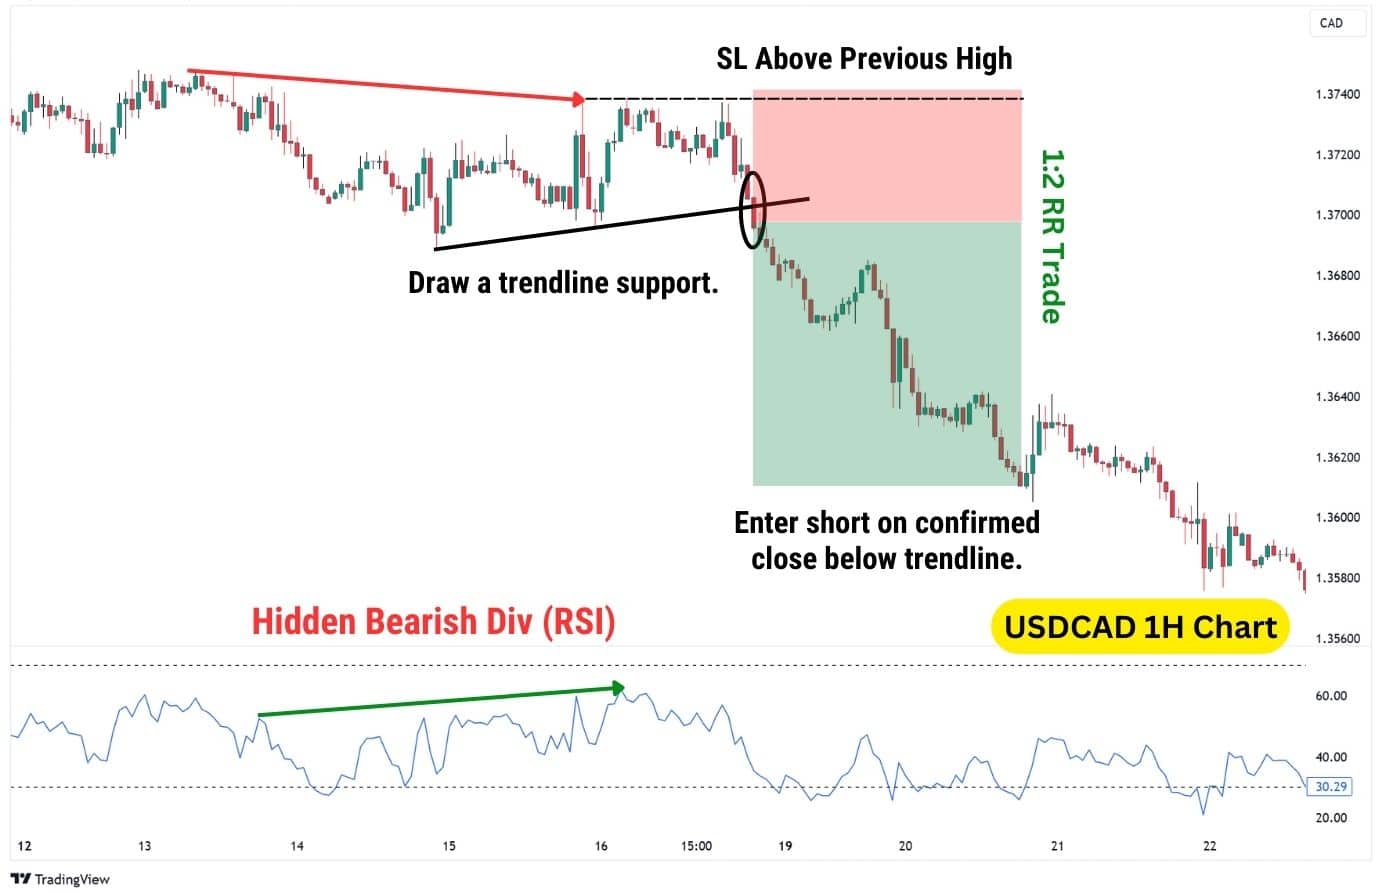
Support trendlines often occur during the formation of a hidden bearish divergence, often sloping upwards diagonally, or purely horizontal. A break below the support trendline can signal that the consolidation period is over, and that the price is ready to drop lower.
This strategy allows us to enter a short trade relatively safely with clear entry signals and confirmations.
| Indicators Required | Line-based oscillator such as the RSI, MFI, CCI or OBV |
| Timeframe | 1H or Higher |
| Steps | 1. Draw a trendline connecting the lows on the price chart, during the hidden bearish divergence’s formation. 2. When the price breaks below the support trendline with a successful close, enter a short. 3. Stop Loss above the highest high of the hidden bearish divergence. 4. Take Profit targeting a 1:2 risk to reward. |
As support trendlines tend to be more reliable on higher timeframes, it is recommended to use this strategy on timeframes 1H or higher.
Hidden Bearish Divergence with the MACD
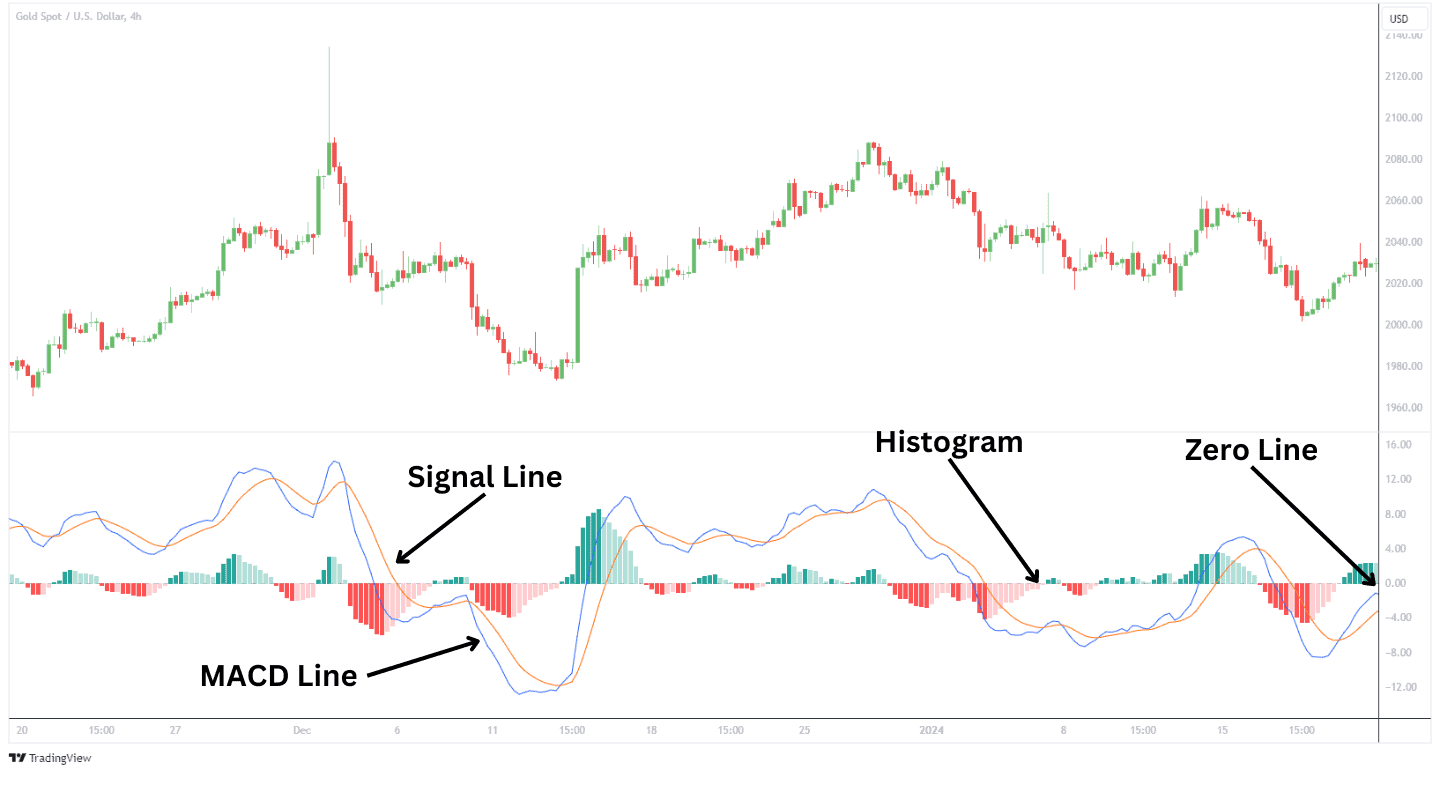
The MACD (Moving Average Convergence Divergence), consisting of the histogram and MACD Line, provides traders with tools to identify both short-term and long-term hidden bearish divergences. The main ways of identifying divergences with the MACD include the MACD Line, and the Histogram.
- MACD Histogram: Displayed as bars, it visualises the difference between the MACD Line and the Signal Line, indicating short-term momentum shifts.
- MACD Line: Reflects longer-term momentum changes, making it more suitable for higher timeframes.
This strategy combines the trendline break with the MACD indicator, allowing us to trade a wider variety of divergence signals, while still maintaining that disciplined approach the trendline break confirmation brings.
Here’s how it would work on a MACD Histogram divergence:
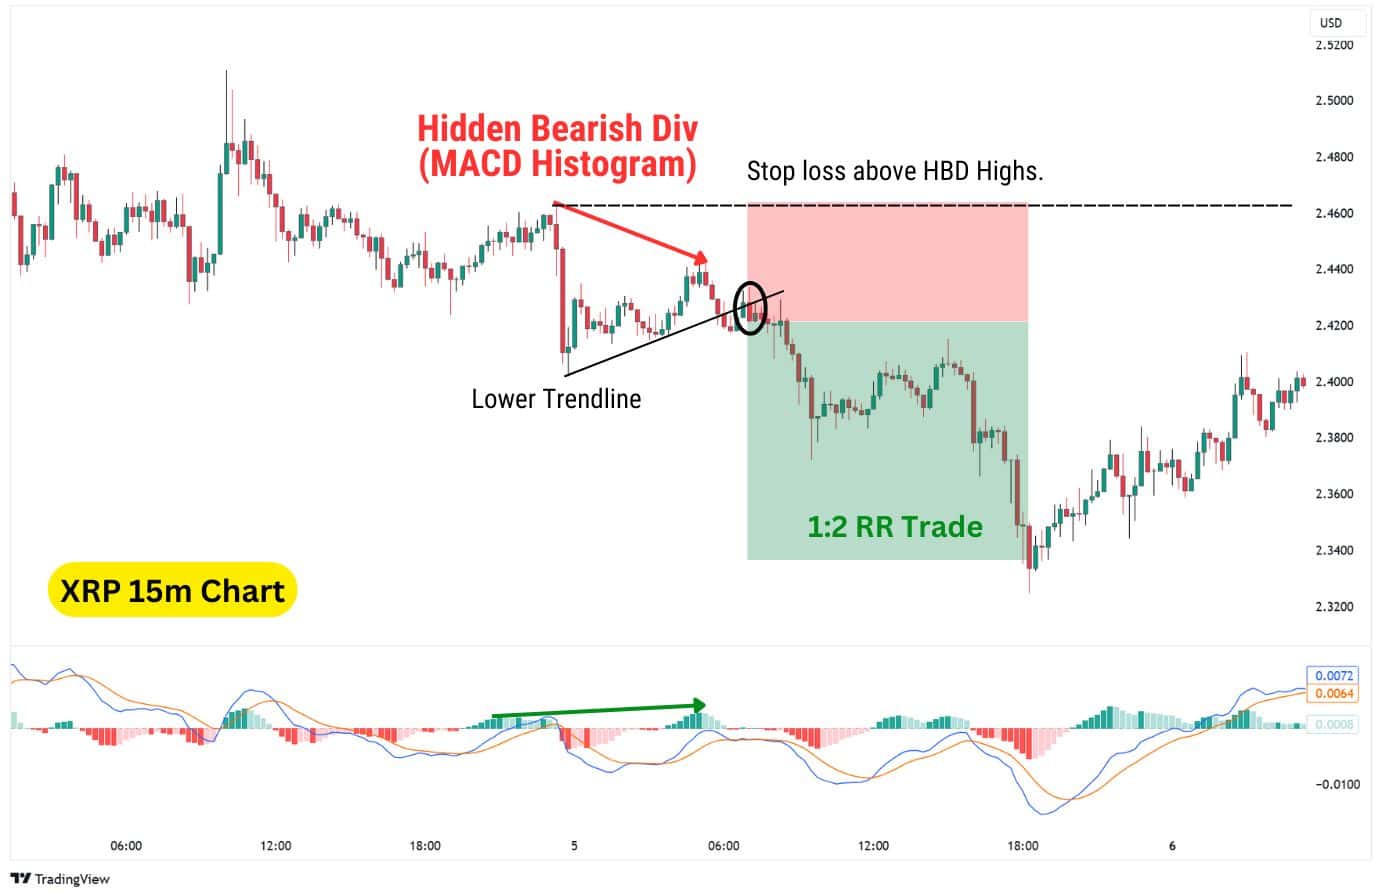
The MACD Histogram, due to its sensitivity, is more effective for short-term momentum changes and works best on lower timeframes like the 1H or lower. Its rapid response means signals appear more frequently, though they may be less reliable.
However, the advantage is that you’ll enjoy a smaller stop loss, since the price range during hidden bearish divergence is smaller. This allows us to also risk 1:2 RR to trade signals found with the MACD Histogram.
Simply place the stop loss above the highest high in the hidden bearish divergence, and set the take profit to 2 times the distance!
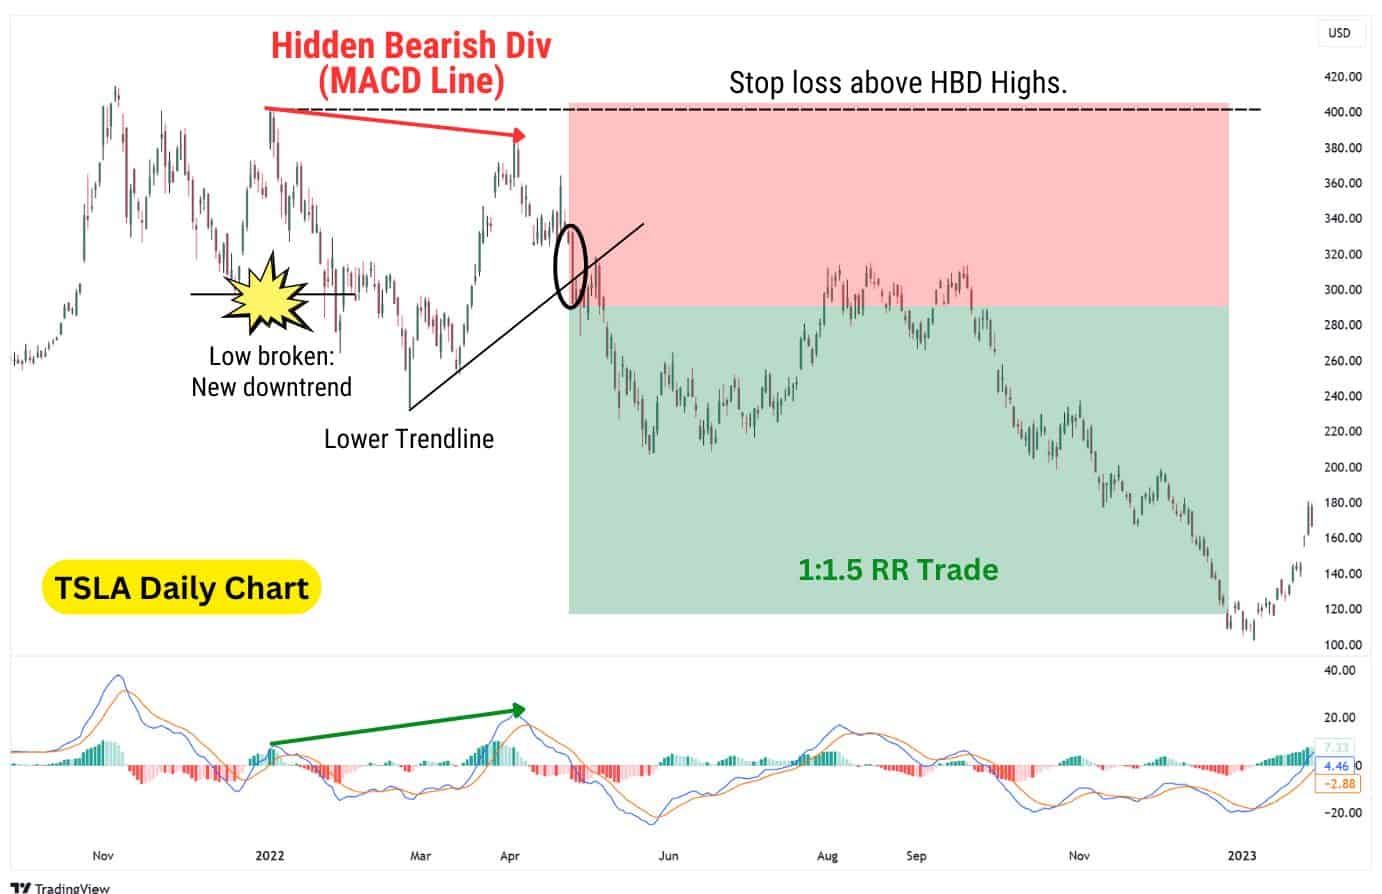
In contrast, divergences identified with the MACD Line are better suited for higher timeframes, such as the 4H or higher. Since the MACD Line reflects longer-term momentum, it can lead to wider stop losses due to broader price swings, but can provide a more reliable signal.
With the MACD Line divergence, it’s best to trade using a 1:1.5 RR as the stop loss distance is fairly wide.
| Indicators Required | MACD |
| Timeframe | Histogram: 1H or LowerMACD Line: 4H or Higher |
| Steps | 1. Spot a hidden bearish divergence is spotted with the MACD. 2. Draw a trendline connecting the lows on the price chart, during the hidden bearish divergence’s formation. 3. Enter Short when the price breaks the trendline with a close, or when a successful rejection occurs at the trendline when the price rises to retest it. 4. Stop Loss above the highest high of the hidden bearish divergence. 5. Take Profit targeting a 1:2 risk to reward. |
Double Confirmation Hidden Divergence Strategy
The Double Confirmation Hidden Divergence Strategy combines key technical tools to help traders identify and capitalise on high-probability bearish continuation setups.
By layering multiple forms of analysis, it improves confidence in trade decisions and timing.
- Confirmation Tool 1 – Fibonacci Retracement: Provides hidden support and resistance levels.
- Confirmation Tool 2 – Bollinger Bands®: Helps time your entry after spotting a hidden bearish divergence.
- Momentum Tool – Relative Strength Index: To spot hidden bearish divergences. Can be swapped with other oscillators.
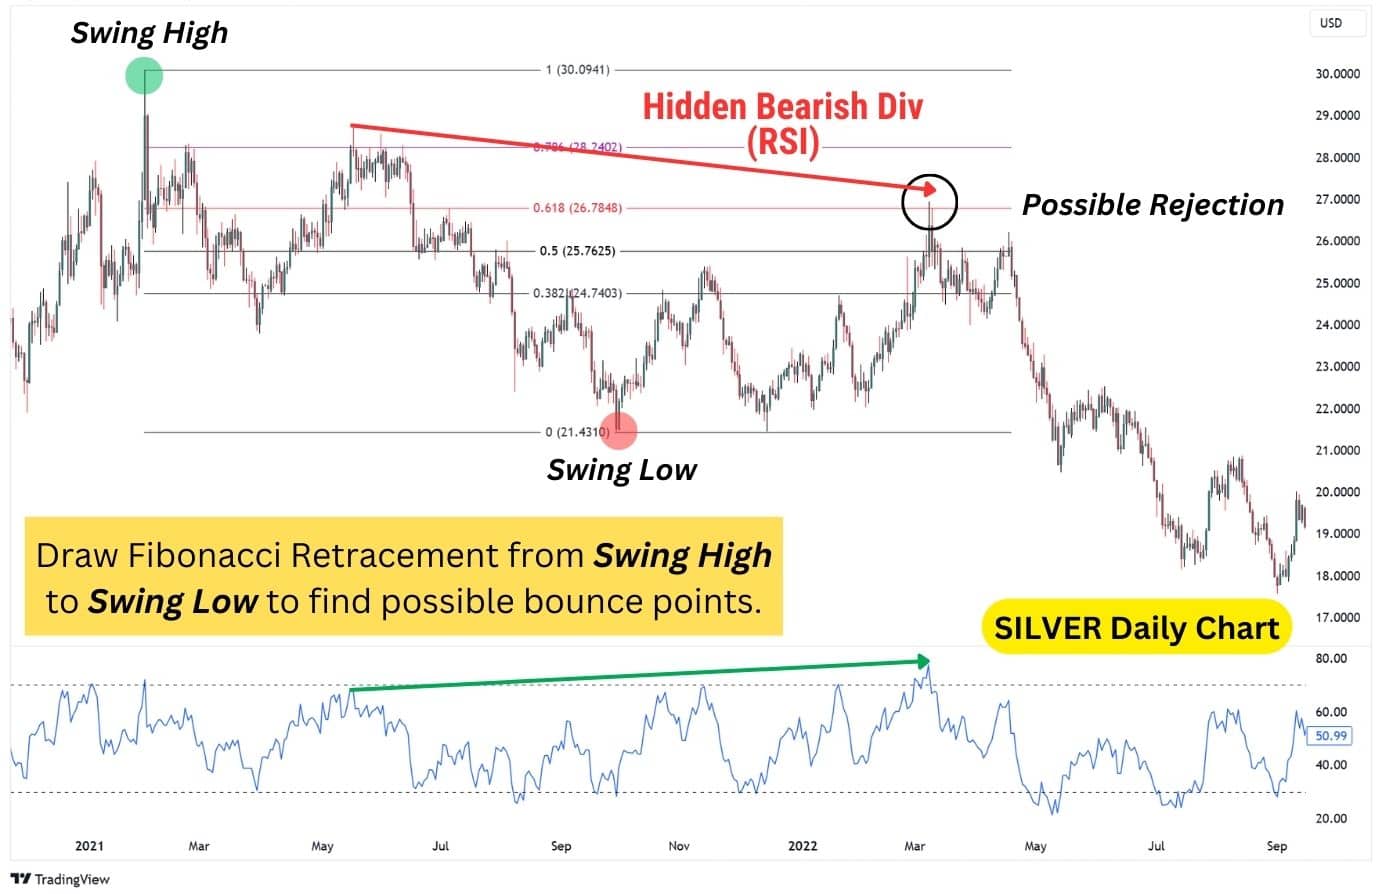
Identifying Rejection Points and Divergence
- Draw a Fibonacci retracement from the Swing High to the Swing Low.
- Watch for price rejection at key levels: 0.50, 0.618, or 0.786 Fibonacci retracement levels.
- The 0.50 to 0.618 zone, also called the ‘Golden Pocket,’ is the primary area to monitor for rejection.
- If price overshoots the 0.618 level, the 0.786 Fib becomes the final level to watch for rejection.
- Confirm if a hidden bearish divergence forms at these levels using the RSI or another momentum oscillator.
- Hidden bearish divergence occurs when the price forms lower highs while RSI forms higher highs.
Next, we’ll use the Bollinger Bands to confirm the rejection, and find a short trade entry. This indicator can serve as a trend filter, allowing us to identify when the price is most probable to begin a downward trend.
Set the mid-line of the Bollinger Bands to 20 Exponential Moving Average, and the Standard Deviation to 1.
When price drops below the standard deviation bands, it tells us that price has made a drastic move (with bigger momentum), and increases the likelihood of a downtrend beginning.
Example
Following the rejection at the 0.618 Fib Retracement, the Silver price actually consolidated and chopped around – making a clear entry difficult to identify. However, once the price dropped below our custom Bollinger Bands, the downtrend resumed.
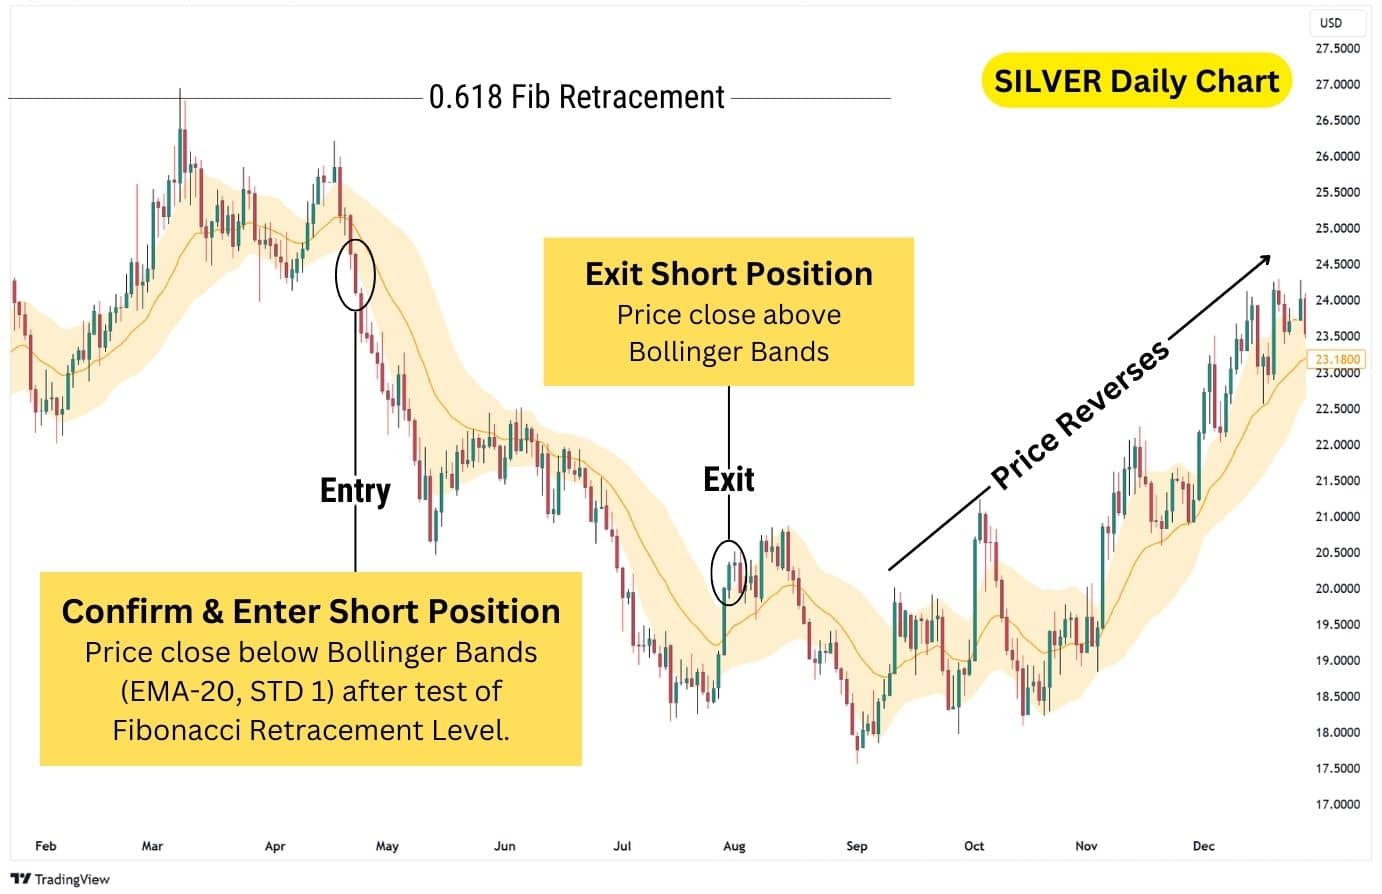
Finally, close your trade position when the price breaks above the Bollinger Bands. This is an indication that the downtrend is potentially coming to an end, and getting out early with this signal will help us secure more profits in the long run, rather than holding onto the trade in hopes of extra potential profits.
This dual confirmation approach improves trade accuracy by combining Fibonacci retracement, RSI for momentum shifts, and Bollinger Bands for precise entry and exit timing.
| Indicators Required | Bollinger Bands (EMA-20, Standard Deviation-1) |
| Timeframe | 1H or Higher |
| Steps | 1. Draw a Fibonnaci Retracement from Swing High to Swing Low. 2. Observe a rejection from the 0.50, 0.618 or 0.768 Fib Level, along with increased momentum on the RSI – forming a hidden bearish divergence. 3. Enter a short position when the price closes below the Bollinger Bands entirely, with the midline set to EMA-20 and standard deviation (STD) set to 1. 3. Exit the trade when the price closes above the Bollinger Bands, signalling a potential end to the downtrend. |
Spotting Hidden Divergence Using Stochastics
The stochastics is an indicator that has two major components – the fast line (%K Line) and slow line (%D Line).
The fast line captures the raw momentum values, but is a bit too choppy to use for finding divergences. The slow line, on the other hand, smooths out the fast line’s values, allowing us to capture divergences.
Key notes:
- Use the slow line to find the hidden bearish divergence.
- Use the fast line to find an entry, after the hidden bearish divergence has been spotted.
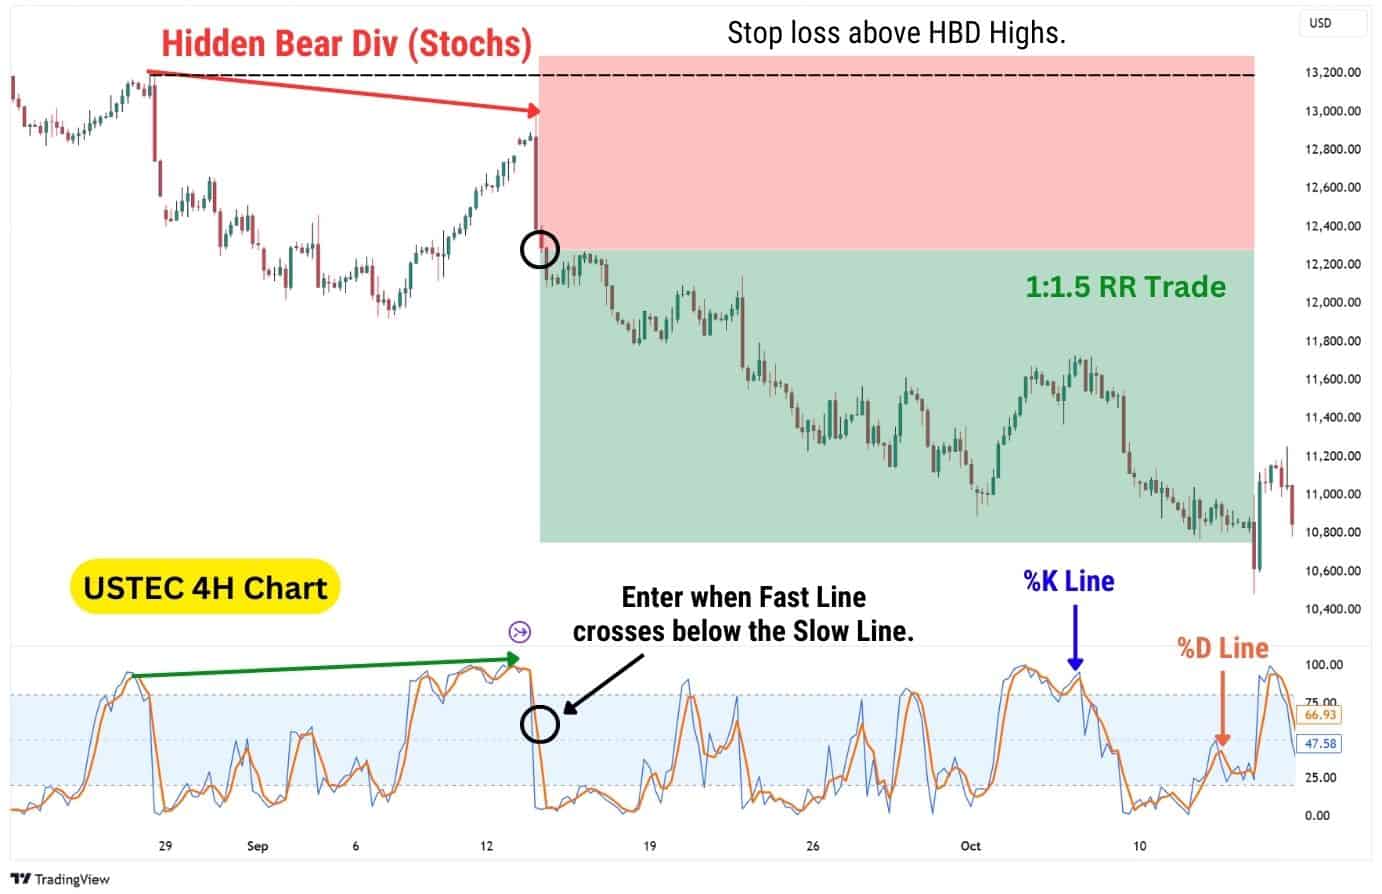
The stochastics indicator by itself can provide both the divergence signal and the entry signal. You simply have to wait for the fast line to cross BELOW the slow line, indicating a powerful downtrend.
However, this trend shift can take a while to confirm on the indicator; or even be difficult to spot at first. Due to these factors, it’s best to trade this strategy with a 1-to-1.5 RR, rather than the usual 1-to-2 RR.
| Indicators Required | Stochastics |
| Timeframe | 1H or Higher |
| Steps | 1. Find the slow line (in orange) forming a higher high, and the price forming a lower high. 2. Wait for the fast line (in blue) to cross BELOW the slow line. 3. Enter a short with the stop loss above the highest high during the hidden bearish divergence’s formation. 4. Take profit set to 1:1.5 Risk-to-Reward. |
Volume Profile Hidden Divergence Strategy
The volume profile tool identifies key price levels where significant trading occurred, highlighting three levels:
- Value Area High (VAH): Highest price with notable traded volume.
- Value Area Low (VAL): Lowest price with notable traded volume.
- Point of Control (POC): Price level with the most traded volume.
You can apply volume profile in two ways:
- Anchored Volume Profile: Starting from a selected date.
- Fixed Range Volume Profile: Covering a specific range with a start and end date.
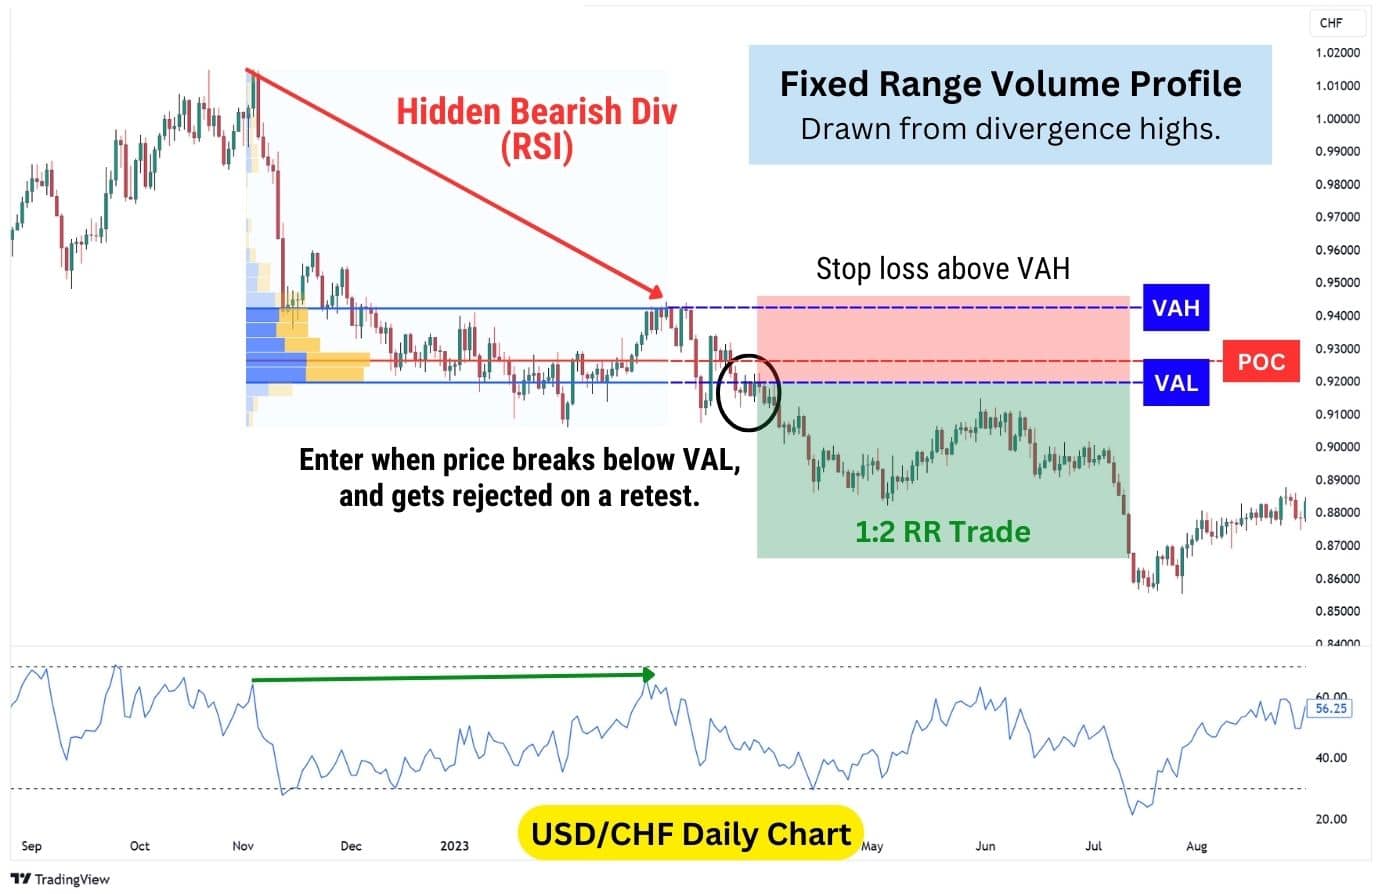
This strategy uses the Fixed Range Volume Profile (FRVP) between the two highs of the hidden bearish divergence to identify key volume-weighted price levels.
Depending on where the price breaks, our trade is either invalidated, or confirmed:
- Break above VAH: Bearish signal invalidated, early short exit.
- Break below VAL: Bearish signal confirmed, short entry point.
Unlike other setups using the highest high as the stop loss, this one uses the VAH, a volume-based resistance. If price breaks above, it signals potential bullish reversal, making the trade invalid. This approach reduces stop loss size while maintaining a consistent 1:2 risk-reward ratio.
| Indicators Required | RSI, Fixed Range Volume Profile |
| Timeframe | Any, but more reliable on 4H or higher due to more traded volume per candlestick. |
| Steps | 1. Find a hidden bearish divergence using the RSI indicator (or via an oscillator of your choice). 2. Draw a FRVP between the two highs of the hidden bearish divergence. 3. Enter a short trade when a candle closes BELOW the VAL. 4. Set the stop loss just above the VAH, and take profit to 1:2 Risk-to-Reward. |
Spot Bearish Divergence using Rate of Change
The Rate of Change (ROC) provides a view of how sharply price has changed over the last 9 candlesticks. It’s great at identifying hidden bearish divergences, and spotting conditions which favour a long squeeze – leading to a bearish continuation.
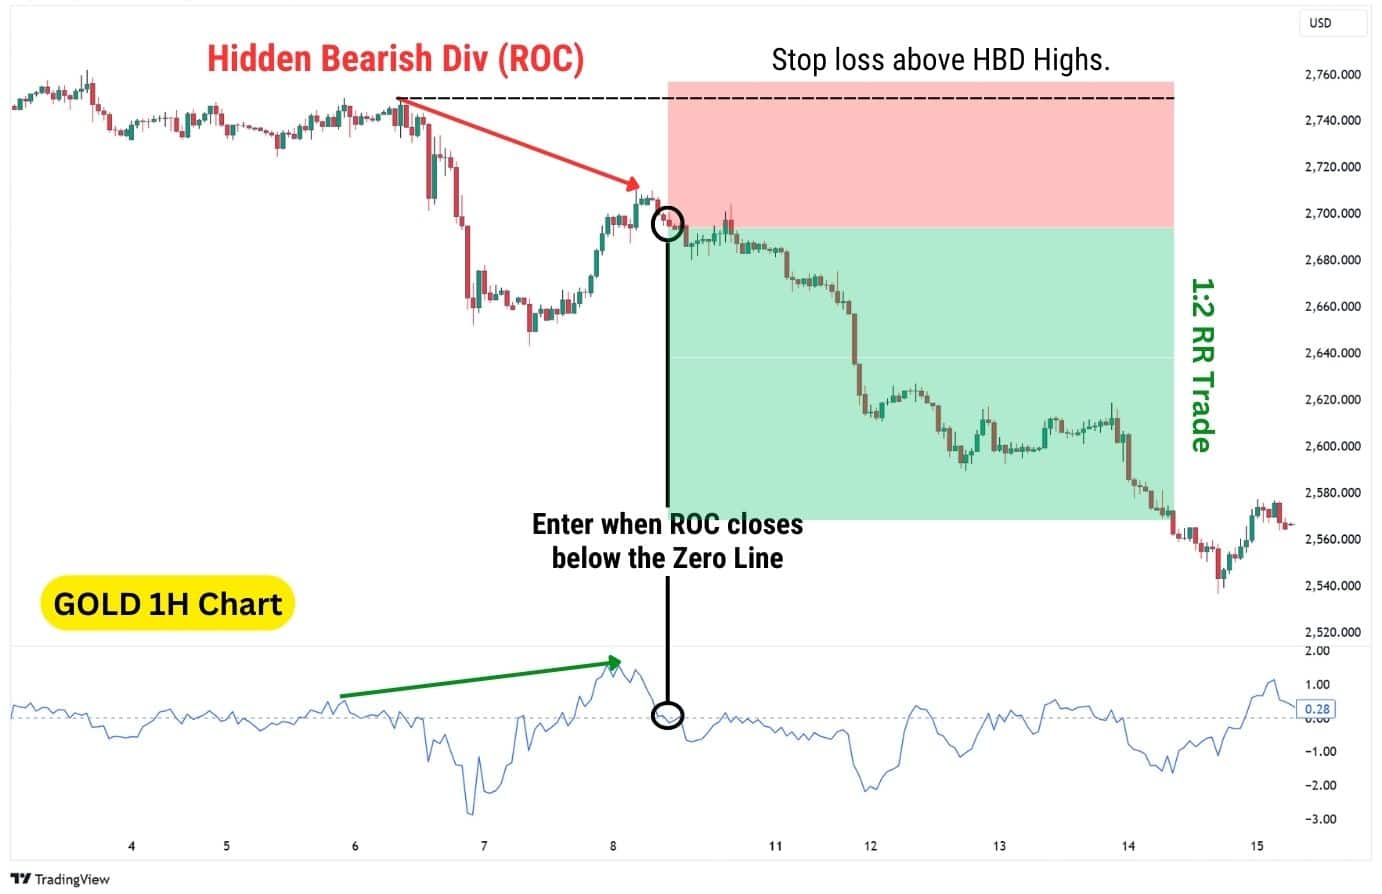
The oscillator moves around the zero line, going between positive and negative values. The sharper the line moves to either side, the sharper the momentum is:
- Zero Line: This represents no percentage change in price compared to the past period.
- Above Zero Line: Represents positive price change in the specified period.
- Below Zero Line: Represents negative price change in the specified period.
For this strategy, we’ll use positive momentum spikes on the ROC indicator, followed by a close below the zero line, to confirm our shorts.
| Indicators Required | Rate of Change |
| Timeframe | Any |
| Steps | 1. Spot a hidden bearish divergence with the ROC indicator. 2. When the ROC dips below the zero line with a confirmed close, enter a short position. 3. Set the stop loss just above the highest high of the divergence. 4. Set take profit to 1:2 Risk-to-Reward. |
Spot Bearish Divergence using Awesome Oscillator
The Awesome Oscillator, or AO, is similar to the MACD histogram in that it visualises momentum with bars. There are three components to this popular indicator:
- Zero Line: When the AO is near this area, it means the momentum is low and in neutral territory (can shift up or down).
- Above Zero Line: The higher the AO is above this line, the more bullish the momentum is.
- Below Zero Line: The lower the AO is below this line, the more bearish the momentum is.
During a downtrend, when there are two peaks in the AO (with the second peak being higher), it signals a hidden bearish divergence.
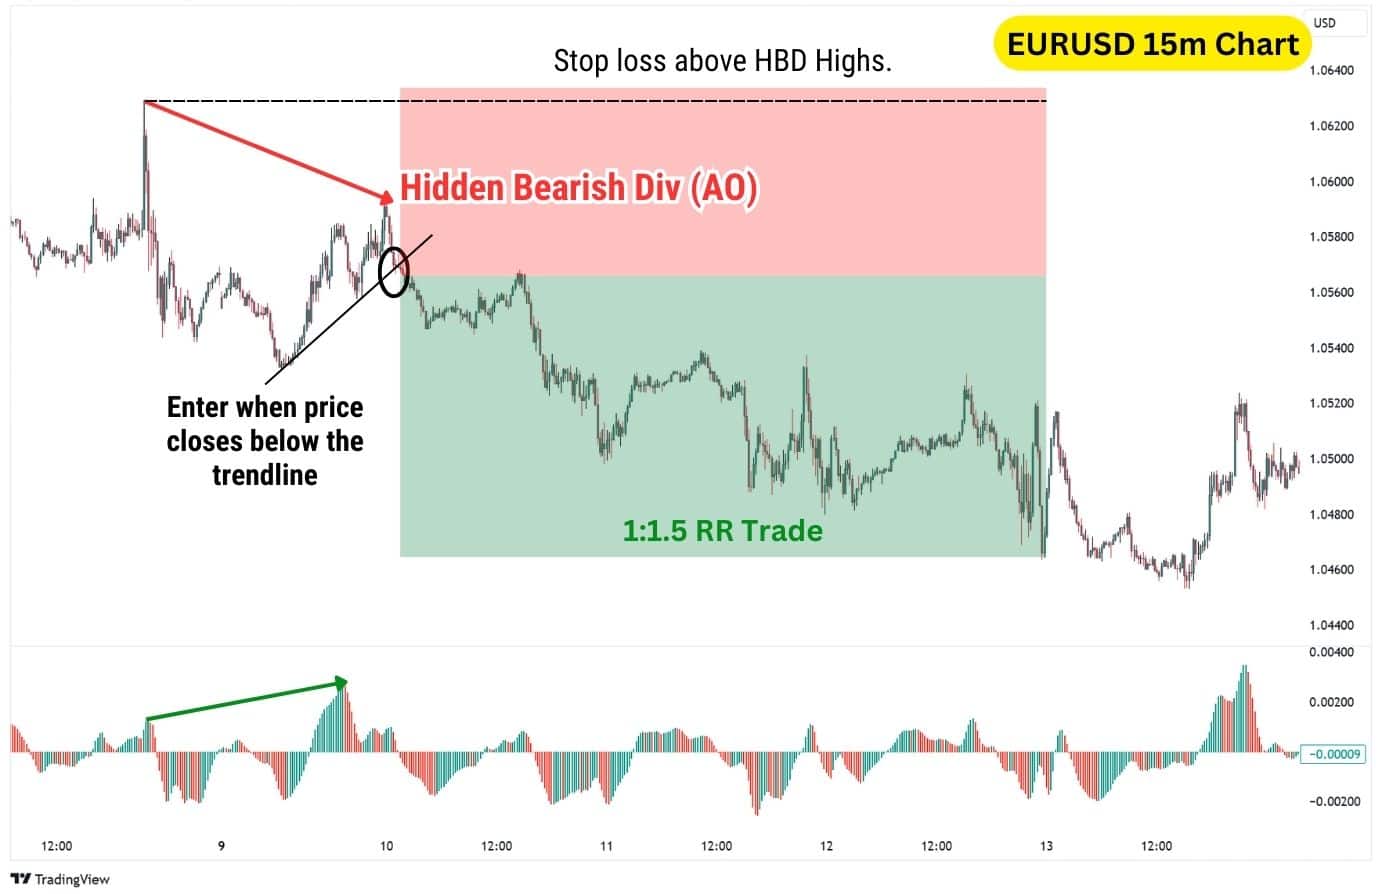
For this strategy, we will combine the trendline break with the AO to find a decent short trade entry. Following a divergence, if the price breaks below a support trendline, the divergence signal is confirmed and we’ll enter a short trade.
| Indicators Required | Awesome Oscillator |
| Timeframe | Any |
| Steps | 1. Spot a hidden bearish divergence with the AO indicator. 2. Draw a trendline connecting the lows of the upswing leading into the second high. 3. When the price closes below the trendline, enter a short trade. 4. Set the stop loss just above the highest high of the divergence. 5. Set take profit to 1:2 Risk-to-Reward. |
Hidden Bearish Divergence with the RSI
Finally, we have the RSI, or relative strength index. This classic indicator is referenced almost everywhere because of how reliable and simple it is to understand. The RSI measures momentum from a scale of 0 to 100, with overbought and oversold levels that provide signals for possible buyer/seller exhaustion.
When the RSI spikes up quickly, it means a lot of buying momentum has entered the market. Then, if the RSI is over 70, it means the asset is overbought, and buyers are potentially out of significant funds to push the price higher.
While this strategy does not require the RSI to go over 70 (Overbought), the RSI’s overbought signals will strengthen the hidden bearish divergence’s signal.
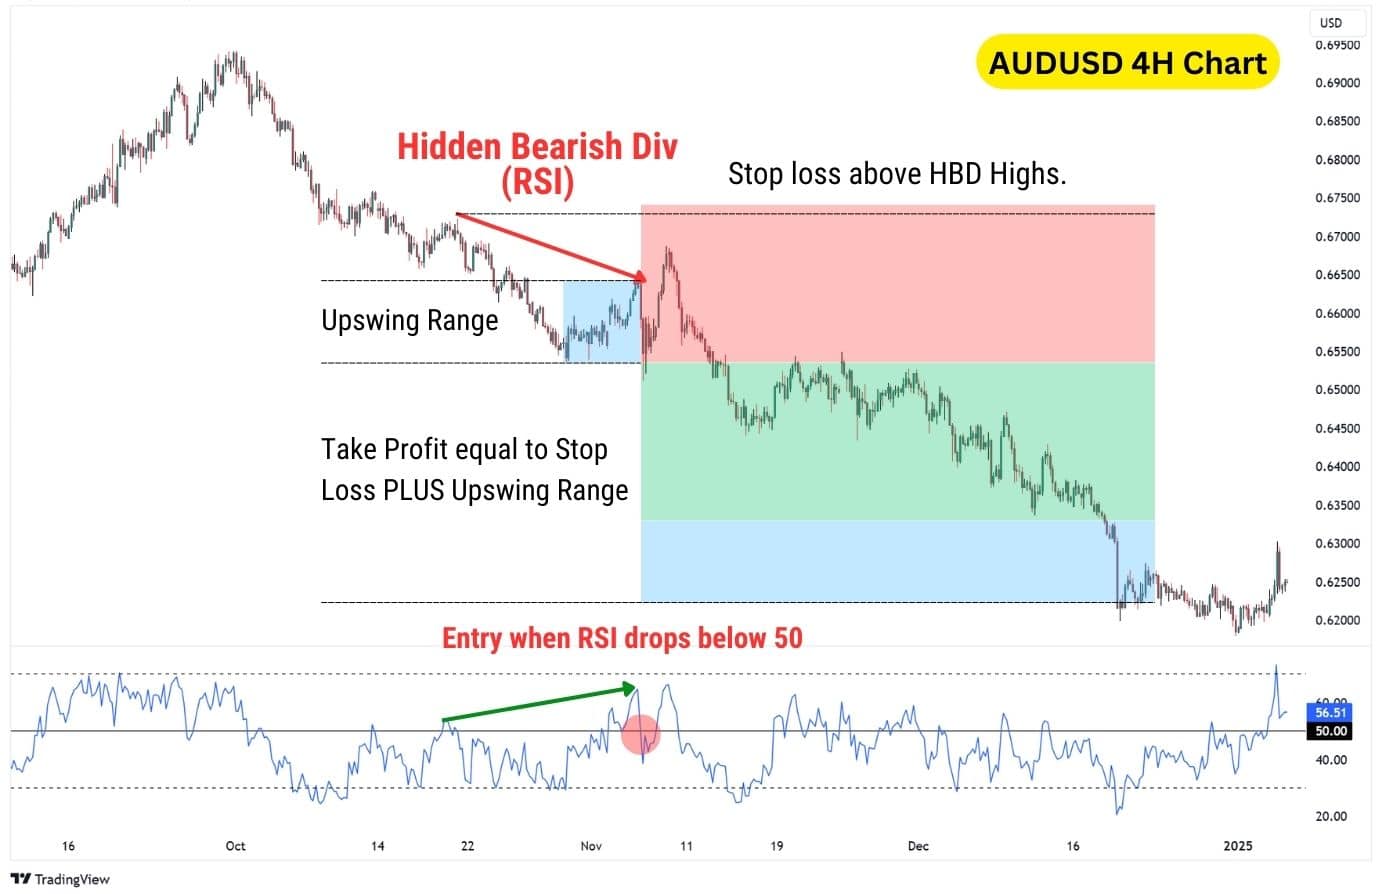
To use this strategy, identify a hidden bearish divergence where the RSI crosses above the 50 midpoint. Once the RSI drops back below 50, it signals bearish momentum re-entering the market, increasing the likelihood of a continuation to the downside.
For our take profit, combine a 1:1 risk-to-reward ratio with the range of the upswing leading into the second high. This ensures your trades exceed a basic 1:1 RR while keeping profit targets realistic, balancing win rate with a solid risk-to-reward approach.
| Indicators Required | RSI |
| Timeframe | Any |
| Steps | 1. Find a hidden bearish divergence with the second high exceeding 50 on the RSI. 2. When the RSI drops below 50, enter a short position. 3. Set the stop loss just above the highest high of the divergence. 4. Set take profit to equal to the stop loss (1:1 RR) plus the range of the upswing which forms the second high. |
Advantages of Trading on the Hidden Bearish Divergence
Oftentimes, descending consolidations are viewed as bullish signals – however, being able to spot a hidden bearish divergence can help traders remain level-headed in their technical analysis, considering both upside and downside scenarios.
- Avoid False Reversals: During a downtrend, many retail traders will look for a bullish reversal to trade. A hidden bearish divergence can tell traders to avoid being overly eager on a long position, even if it looks like price is breaking out (upwards).
- Trade Long Squeezes: The phrase “staircase up, elevator down” describes how prices often rise gradually but can drop rapidly. Long squeezes often trigger these sharp declines, and hidden bearish divergences are excellent for signalling such moves.
- Trade With The Trend: Hidden divergences trade with the overarching trend, which tips the probabilities in their favour as opposed to trading reversals.
- Clear Invalidation: The pattern is clearly invalidated when a higher high forms in the price chart. This simple rule of thumb gives us a clear location to set our stop loss.
Disadvantages of Trading on the Hidden Bearish Divergence
Hidden bear divergences can be difficult for beginners to spot, or even understand. However, knowing these disadvantages will put you at an advantage, because you’ll know what to expect, and what to look for when trading these divergences.
- Wide Stop Loss: Due to the structure of a hidden bearish divergence, where the second high is a lower high, the stop loss often has to be placed quite far away. Traders would need to adapt their lot size accordingly to the stop loss distance.
- Takes time to form: Hidden divergences tend to take time to form, and even after that, may take some time before the continuation move plays out.
- Difficult to spot: Hidden divergences can be difficult to spot at first glance, especially for beginners. This is because the first high can go further back than expected, leading many traders to miss out on these signals.
How Market Conditions Impact Hidden Bearish Divergence Effectiveness
The effectiveness of hidden bearish divergence depends heavily on market conditions, particularly whether the market is trending or ranging. In strong downtrends, hidden bearish divergence tends to be a more reliable signal, as it aligns with the prevailing momentum and helps traders anticipate continuation moves. However, in ranging or choppy markets, the pattern can generate false signals since price movements lack sustained directional bias. Traders need to consider the broader trend context before acting on divergence signals to avoid being misled by short-term fluctuations.
Volatility also plays a crucial role in the formation and success of hidden bearish divergence. In highly volatile conditions, sharp price swings can distort indicator readings, making it harder to distinguish genuine divergence from noise. Large price spikes can temporarily inflate momentum indicators, leading to misleading divergence signals that fail to produce a meaningful trend continuation. On the other hand, in stable market conditions with moderate volatility, hidden bearish divergence tends to be more effective, providing clearer signals that align with the dominant trend. Understanding these dynamics allows traders to apply divergence analysis more effectively and filter out lower-probability setups.
What indicator is best to trade with a Hidden Bearish Divergence?
For most traders, line-based indicators like the RSI and OBV are the easiest to use for spotting a hidden bearish divergence, because they clearly display peaks and troughs that diverge from price action. By contrast, column-based indicators such as the MACD and Awesome Oscillator are more difficult to spot hidden bearish divergences with, as some columns do not form with significant heights, making it difficult to identify peaks. However, there is ultimately no best indicator for trading hidden bearish divergences with; the effectiveness comes down to your strategy, timeframe, and asset you’re trading.
Hidden Bearish Divergence vs Regular Bearish Divergence
While the hidden bearish divergence signals a bearish price continuation, the regular bearish divergence signals a bearish trend reversal. They are both bearish patterns, suggesting that prices will head lower in the imminent term.
The pattern structures differ as follows:
- Hidden Bearish Divergence: Lower high on price, higher high on oscillator.
- Regular Bearish Divergence: Higher high on price, lower high on oscillator.
Bearish divergences are measured from the highs of both the price chart, and the momentum indicator.
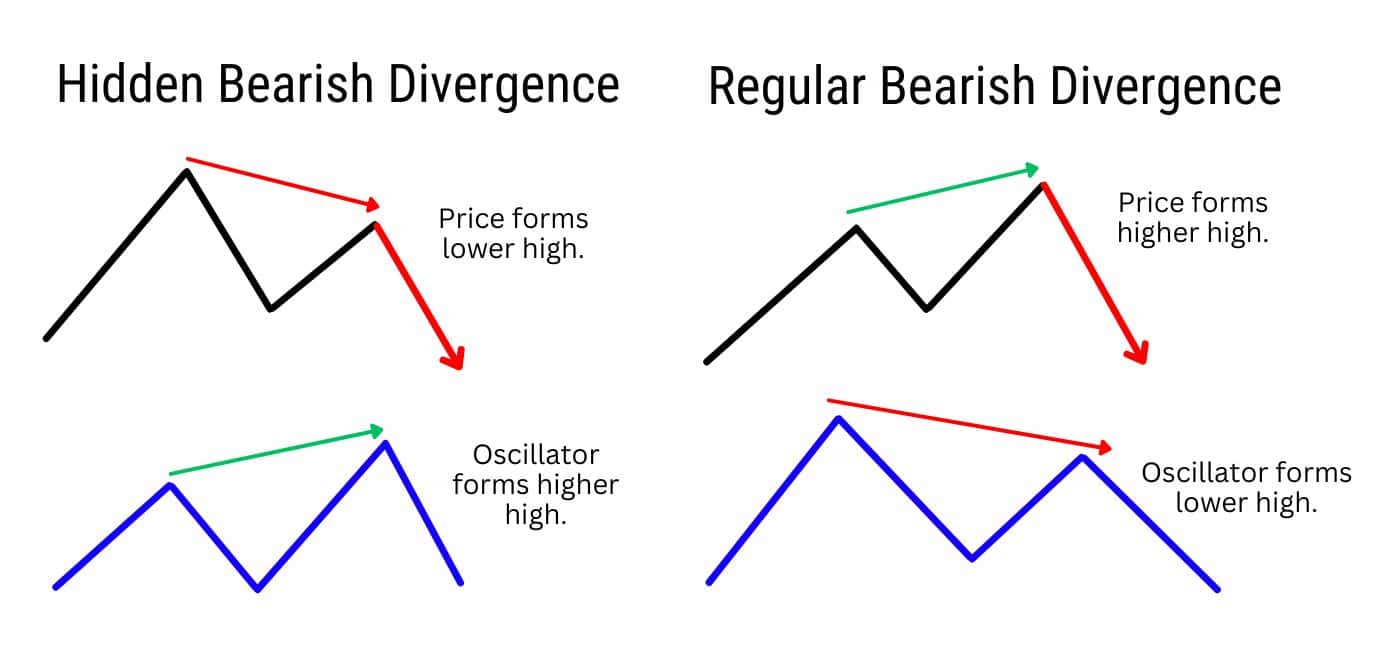
Important Note: Hidden bearish divergences typically take longer to develop, often leading to stronger signals due to their longer term vision, and the fact they are trading with the overarching trend. Regular bearish divergences on the other hand are considered more short term, which may not result in larger downswing
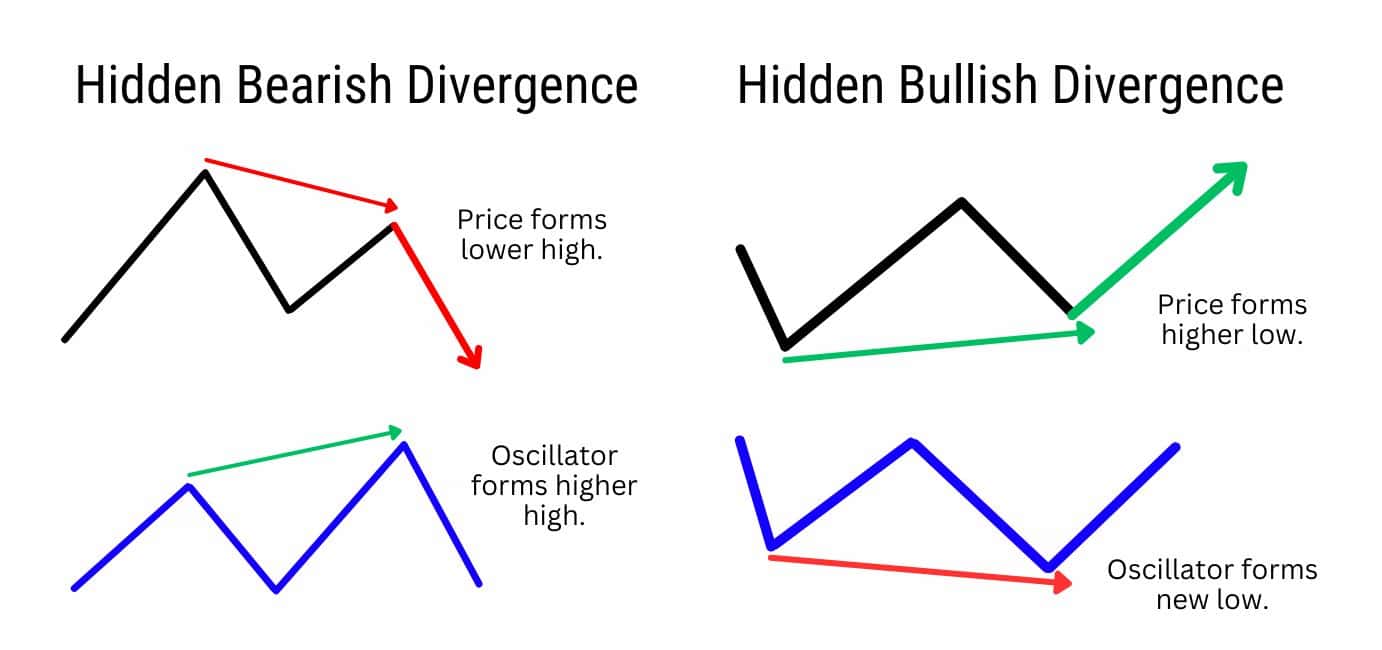
Hidden Bearish Divergence vs Hidden Bullish Divergence
These two hidden divergences are continuation patterns, signalling that the price may continue to move in its current trend direction. While the hidden bearish divergence is measured from the highs, the bullish hidden divergence is measured from the lows.
The pattern structures differ as follows:
- Hidden Bearish Divergence: Lower high on price, higher high on oscillator.
- Hidden Bullish Divergence: Higher low on price, lower low on oscillator.
Bullish divergences, unlike bearish ones, are measured from the lows on the price chart and oscillator.
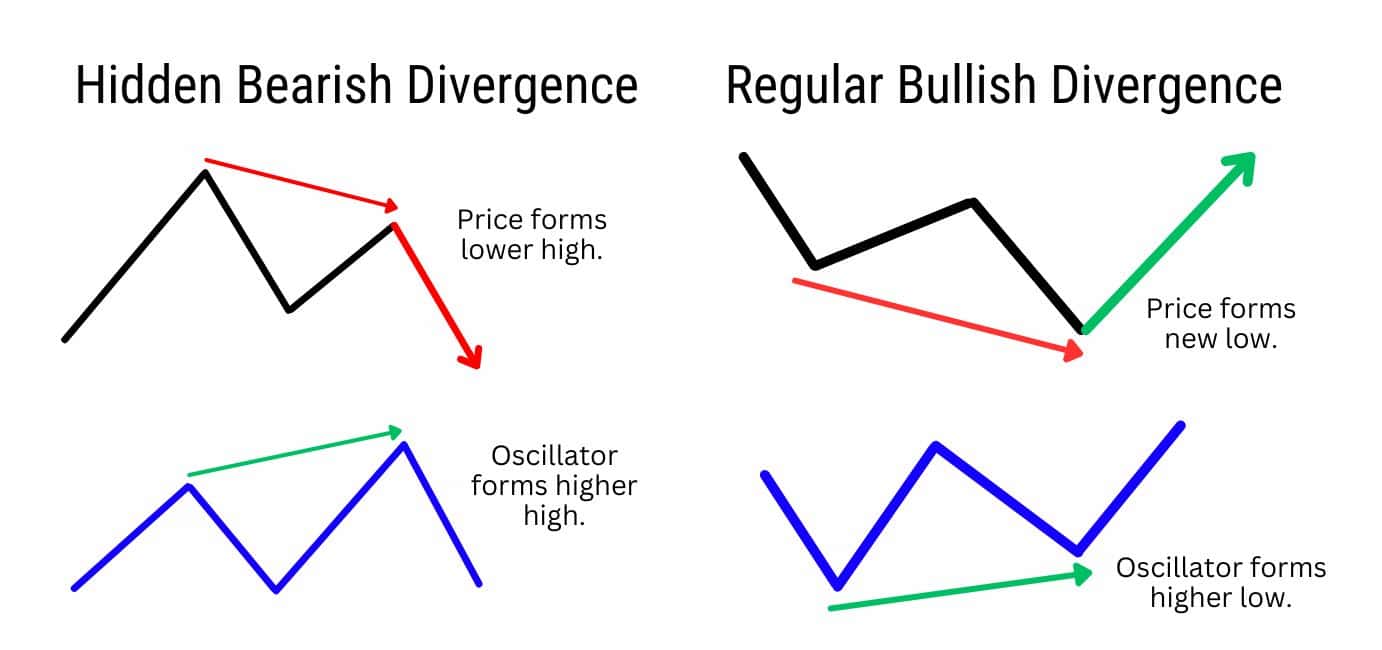
Hidden Bearish Divergence vs Classic Regular Bullish Divergence
Structurally, the hidden bearish divergence and the classic/regular bullish divergence are extremely similar. Both of these patterns can share a lower high on the price, and also a higher low on the oscillator.
The pattern structures differ as follows:
- Hidden Bearish Divergence: Lower high on price, higher high on the oscillator.
- Regular Bullish Divergence: Lower low on price, higher low on the oscillator.
The trick for telling them apart is to where to draw the divergences from: the hidden bearish divergence is measured from the highs, while the regular bullish divergence is measured from the lows.
Sometimes, a regular bullish divergence and a hidden bearish divergence can form at the same time, adding a degree of complexity to the analysis. Will the price now experience a bullish trend reversal? Or will the bearish trend continuation play out?
The key here is to understand clear invalidation levels of both divergences:
- Classic bullish divergence confirmed — If the highest high of the hidden bearish divergence breaks, that means a bullish trend reversal is more likely to occur.
- Hidden bearish divergence confirmed — If the lowest low of the regular bullish divergence breaks, that means a bearish continuation is more likely to occur.
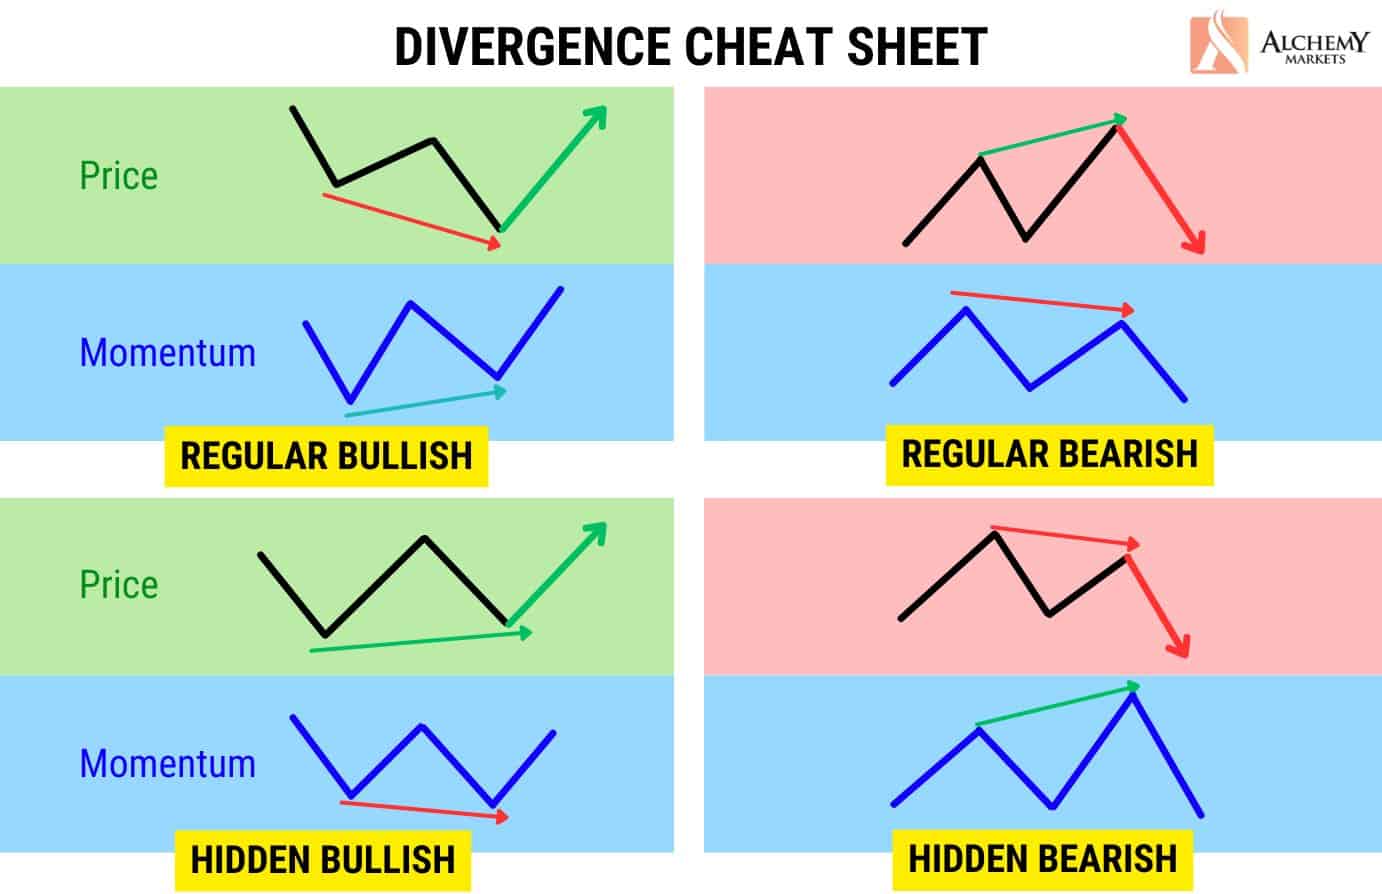
Divergence Cheat Sheet
Use this divergence cheat sheet to identify the different divergences immediately.
FAQ
What are common hidden bearish divergence mistakes to watch out for?
Many traders forget that a hidden bearish divergence merely tells us that buyers are potentially exhausted, and that conditions for a long squeeze are improving. However, it’s never a 100% guaranteed signal for a bearish price continuation.
For example, if two boxers are fighting, and one is clearly exhausted – it does not indicate that the exhausted boxer will lose the fight. However, it does mean the odds are indeed stacked against them.
That’s why, it’s highly important to use confirmation factors such as trendline breaks, indicators, and market structure to swing the odds in your favour when trading the hidden bearish divergence.
How reliable is the Hidden Bearish Divergence?
The hidden bearish divergence is more reliable during broader downtrends, rather than local (smaller) downtrends amid uptrends. Additionally, the signal’s reliability is enhanced by the presence of significant resistance levels, and also confirmation factors such as a trendline break or break of a support level.
Can a Hidden Bearish Divergence occur in both uptrends and downtrends?
A hidden bearish divergence appears during downtrends, but can also appear within a downtrend in a broader uptrend. It all depends on the timeframes you’re looking at. For example, the S&P 500 is technically bullish on the monthly timeframe, but when examined on the daily timeframe, a downtrend can be observed. During this daily downtrend, a hidden bearish divergence could appear.
The same logic applies when trading intraday; even though the hourly timeframe is in an uptrend, the 1-minute timeframe could be in a downtrend – and within that 1-minute timeframe, a hidden bearish divergence could form and be traded.
Is regular or hidden divergence better?
Theoretically, hidden divergence is more reliable since it aligns with the broader trend continuation. However, in practice, neither is inherently superior. Their effectiveness depends on how well you use confirmation factors like support/resistance levels, volume, and additional indicators.
Is stochastic good for divergence?
Yes, the Stochastic Oscillator is effective for spotting divergence due to its clear peaks and troughs. It’s especially useful for identifying overbought and oversold conditions alongside divergence signals.
Is RSI divergence good?
Yes, RSI divergence is widely used and effective, as it clearly highlights momentum shifts through its defined overbought and oversold zones. Its line-based structure makes it easy to spot divergences.
What is the best time frame for applying hidden divergence?
Hidden divergence is an effective tool that can be applied to any chart time frame across intraday, daily, and weekly charts. Do note that chart time frames shorter than 15 minutes may be more prone to false and inaccurate signals. This is due to markets being illiquid and not moving much during slow portions of the day.


