Bullish
- September 2, 2024
- 36 min read
Inverse Head and Shoulders Pattern Trading Guide
Learn how to trade using the inverse head and shoulders pattern, a powerful tool in technical analysis, with our comprehensive guide for identifying and utilising this pattern effectively.
What Is the Inverse Head and Shoulders Pattern?

The inverse head and shoulders pattern is a pattern used in technical analysis that signals a potential trend reversal from a downtrend to an uptrend.
The inverse head and shoulders pattern is characterised by three consecutive troughs, with the middle trough (the head) being the lowest and the two outside troughs (the shoulders) being higher and approximately equal. This formation suggests that a downtrend is nearing its end, and a reversal to an uptrend may be imminent. Recognising this pattern can provide traders with a valuable signal to enter a new long position or exit bearish trades, making it an essential component of technical analysis.
Inverse head and shoulders pattern is the opposite of the head and shoulders pattern. Both formations are widely followed by technical traders due to their distinct shape and clear signals as a trend reversal pattern.
While the head and shoulders formation is a bearish reversal chart pattern, indicating the end of an uptrend, the inverse head and shoulders pattern signals a bullish reversal, marking the end of a downtrend. Understanding both patterns can significantly improve a trader’s ability to anticipate market movements and make strategic trades.
How Does an Inverse Head and Shoulder Pattern Work?

Tesla, Inc. (TSLA) Daily Chart:
The inverse head and shoulders pattern forms through three distinct phases on the price chart: the left shoulder, the head, and the right shoulder. Each phase reflects a specific shift in market sentiment, leading to the overall trend reversal.
Left Shoulder:
In the first phase, the left shoulder forms as the price declines and then experiences a small upward bounce. This bounce is often seen as a selling opportunity within the ongoing downtrend, reinforcing the bearish sentiment. Traders still believe the downtrend will continue, and selling pressure remains strong.
Head:
The second phase is the formation of the head, where the price dips further to a new low, representing the lowest point of the pattern. Despite this new low, the selling pressure starts to wane. Oscillator divergence, such as the RSI or stochastic indicators, often appears during this phase, suggesting that the bearish momentum is weakening. The sentiment is still bearish, but smart money begins to pull out, anticipating a potential reversal.
Right Shoulder:
In the final phase, the right shoulder forms as the price dips once more but not as deeply as during the head phase. This higher low indicates that buyers are starting to gain strength. The price then rises again, approaching the neckline. Sentiment shifts to a more neutral stance as market participants recognise the potential for a trend reversal.
Once the three phases are completed, the key element to trading the pattern is the neckline. The neckline is basically a trend line or resistance line formed by the peaks between the two shoulders.
You can draw a neckline by connecting the peaks between the left shoulder, head, and right shoulder. When the price breaks above this neckline resistance, it signals a bullish trend reversal and traders may consider a long position. A downward-sloping neckline, as shown in the chart, helps confirm the trend reversal once the price breaks above it.
How to Identify the Inverse Head and Shoulders Pattern?
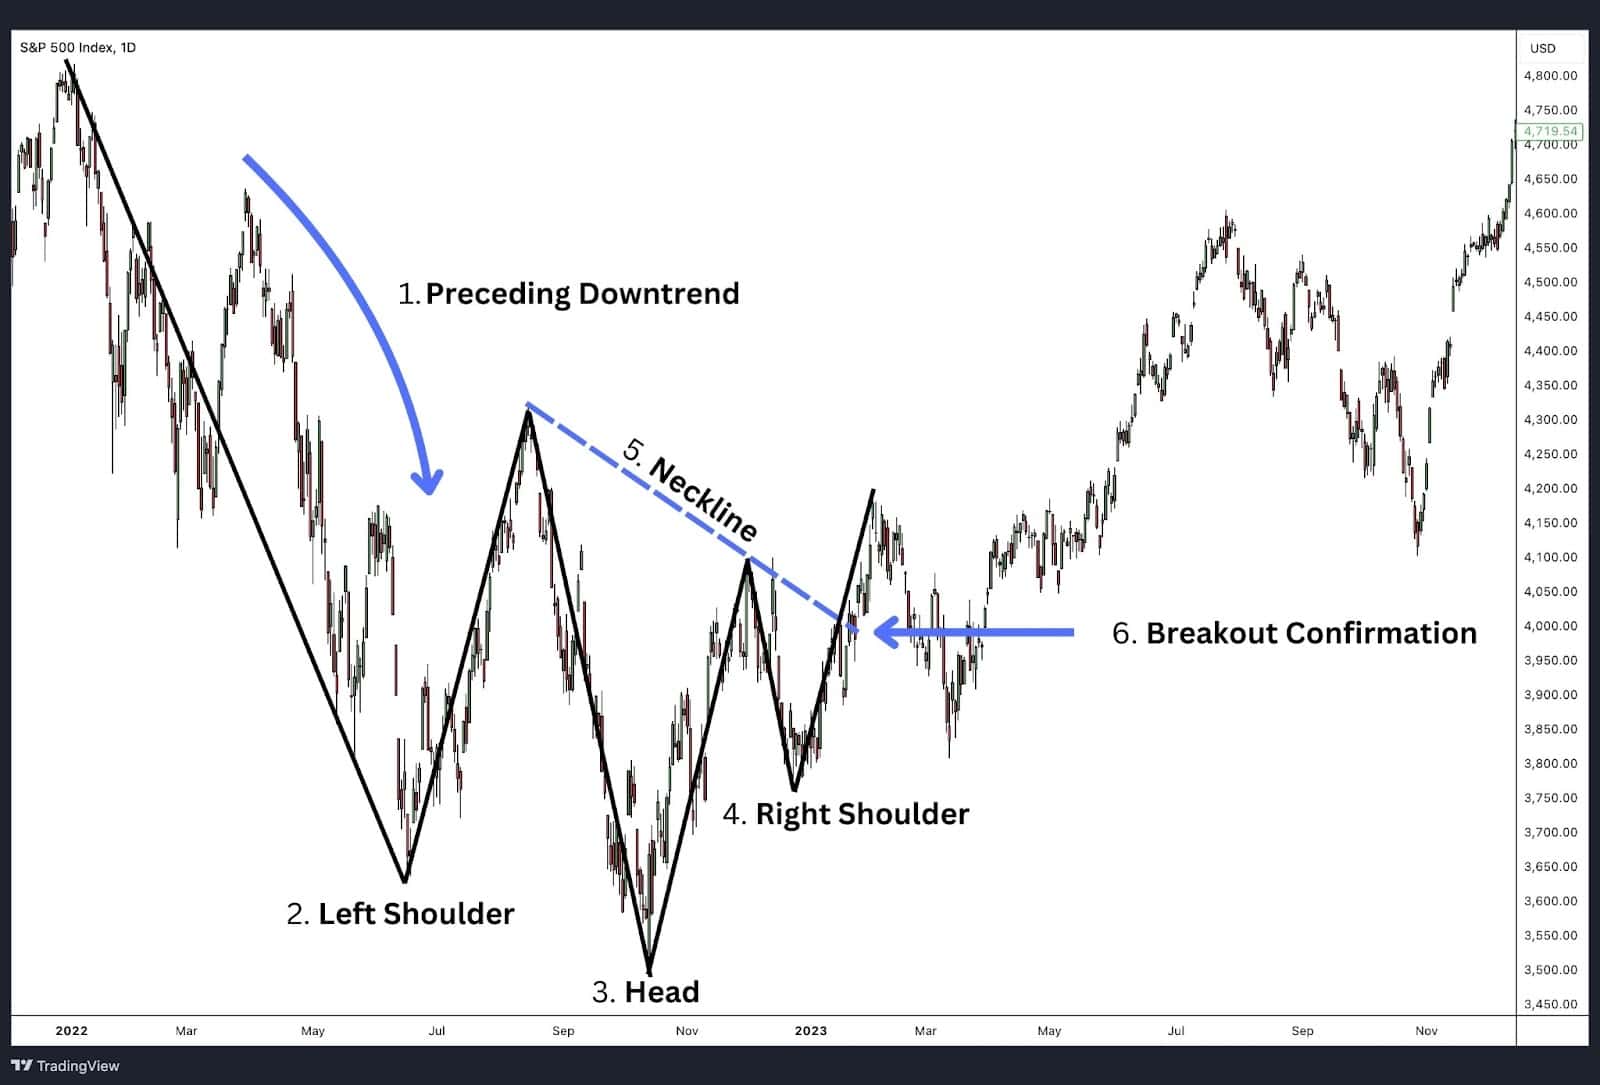
The inverse head and shoulders pattern is a classic reversal pattern signalling a shift from a downtrend to an uptrend. This pattern is found by spotting these six components.
- Preceding Downtrend: The inverse head and shoulders pattern begins with a significant downtrend.
- Left Shoulder: Identify the first trough followed by a peak, which sets the initial resistance level.
- Head: Observe a deeper trough forming, followed by a rise to a similar level as the first peak.
- Right Shoulder: Look for a third trough that is higher than the head but approximately near the same price level as the left shoulder, followed by another rise.
- Neckline: Draw a line connecting the peaks after the left shoulder and before the right shoulder. The neckline must either be horizontal or with a slight downward slope. It must not be sloping in an ascending fashion. More on this down below.
- Breakout Confirmation: Wait for the price to break above the neckline, confirming the pattern and signalling a potential upward reversal.
By following these steps, traders can effectively spot the inverse head and shoulders pattern and use it to make informed trading decisions.
Common Mistakes to Avoid When Trading the Inverse Head and Shoulders Pattern
1. Neckline Slope
One common mistake traders make is not paying attention to the slope of the neckline. For the inverse head and shoulders pattern to be valid, the neckline should slope downwards or remain horizontally level. If the neckline slopes aggressively upwards, it suggests that the trend has already reversed, rendering the pattern useless in trading. A downward or horizontal slope ensures that the trend reversal is still questionable, and a bullish breakout above this neckline confirms the trend reversal to the upside.
Additionally, the trigger of the bullish reversal pattern is to enter on a break of the neckline. If you review the incorrect example above, it would be very difficult to enter this trade and if you did the trade would include a terrible risk to reward ratio. Neither scenario is what a consistent trader is looking for.
2. Ignoring the Overall Trend
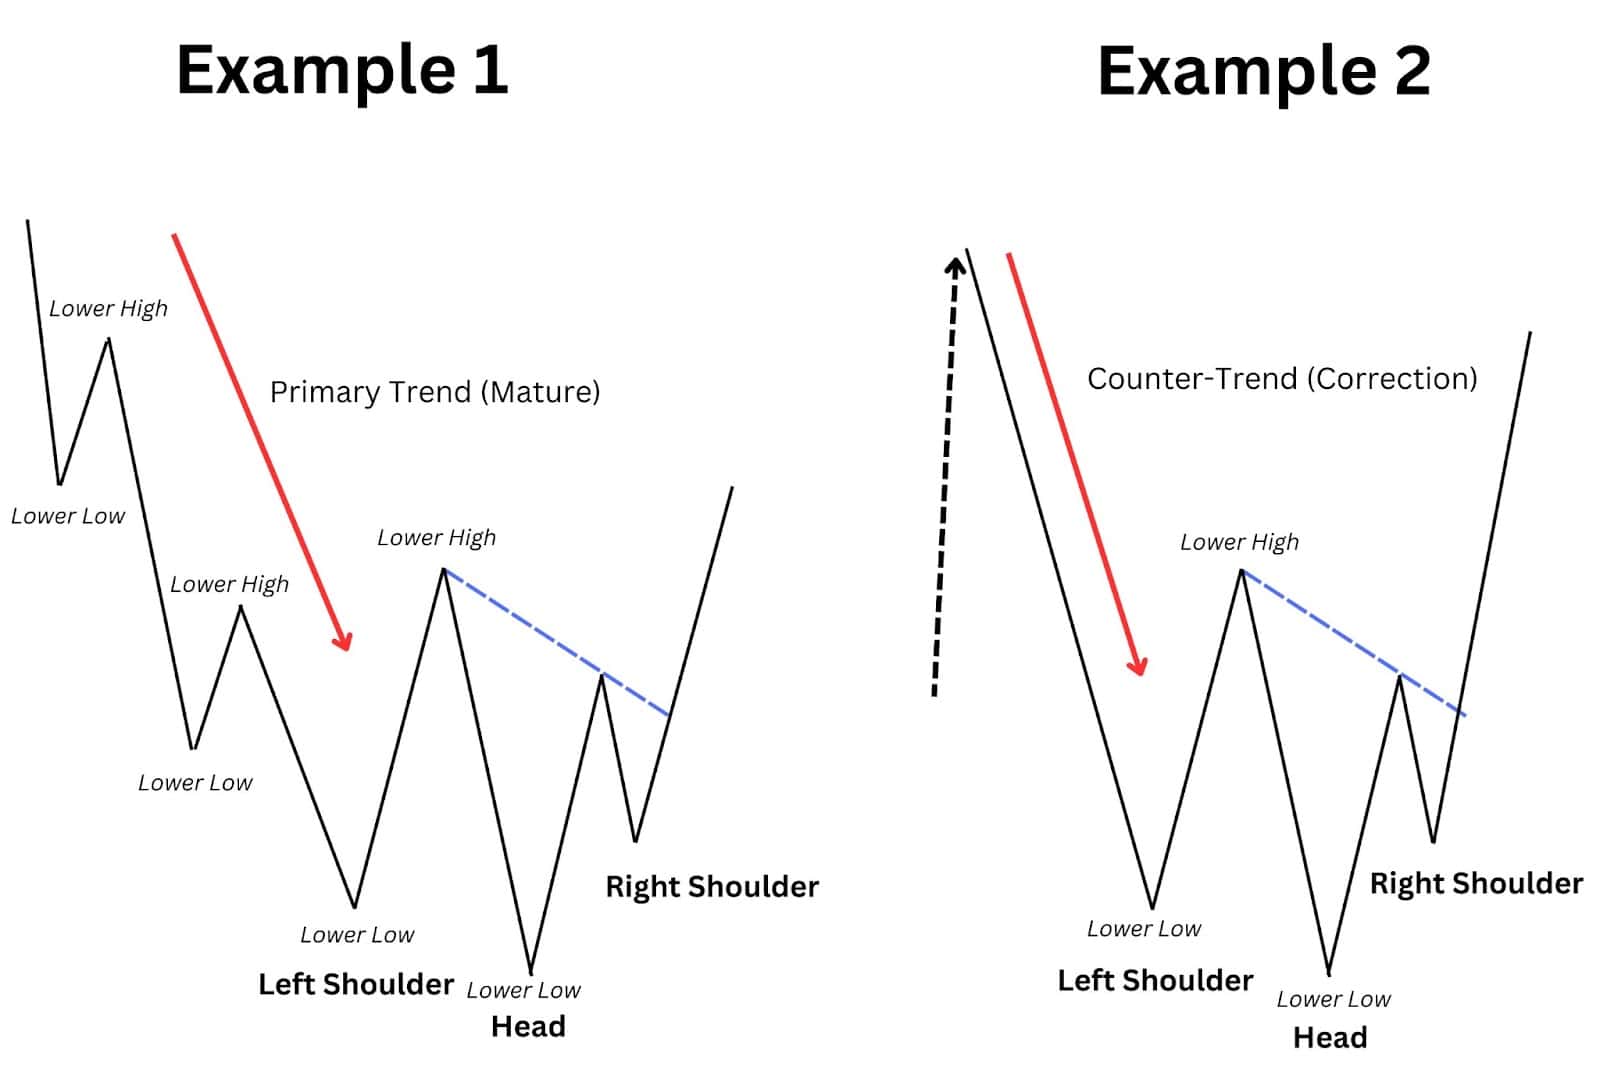
Ignoring the overall trend is a critical error that can invalidate the pattern. The inverse head and shoulders pattern occurs after a pre-existing downtrend, whether it’s a primary trend or a counter-trend, to be meaningful. Without a preceding downtrend, the pattern lacks context and significance, making it unreliable for predicting reversals. Traders must ensure that the pattern aligns with the broader market structure to avoid false signals. Here are two examples to illustrate how the overall trend can affect the formation of the inverse head and shoulders pattern:
Example 1: Primary Trend
In this scenario, the current trend is already mature and pointed downward for some time. The lowest point of this downtrend forms the inverse head and shoulders pattern. This setup is mostly spotted within bearish markets in all asset types such as equities, FX and commodities. As the pattern completes, it signals the end of the downtrend and the beginning of a potential uptrend, providing a clear reversal signal in a bearish market environment.
Example 2: Downward Counter-Trend
In the second example, the overall trend is bullish, but the market is experiencing a downward counter-trend correction. The inverse head and shoulders pattern forms as part of this downward correction, not all of the downward correction. This is where many traders make a mistake as there is no previous downward trend.
Once the pattern completes, it signals that the correction is over, and the market is ready to resume its primary bullish trend. This setup is common in the equities markets during a bull run but can also be observed in FX and commodities when a correction phase is in play. The pattern helps traders identify the end of the correction and the resumption of the primary uptrend.
By understanding these two scenarios, traders can better evaluate the validity of the inverse head and shoulders pattern and align their trading strategies with the broader market context. This approach helps avoid false signals and enhances the reliability of trend reversal predictions.
3. Misalignment of the Shoulders
One common mistake traders make when identifying the inverse head and shoulders pattern is the misalignment of the two shoulders. This error can lead to unreliable trading signals and poor decisions.
The Mistake: Misaligned Shoulders
For the inverse head and shoulders pattern to be reliable, the shoulders must form a symmetrical and in a similar horizontal price zone. Often, traders misidentify the pattern by not ensuring proper alignment of the shoulders. If the left shoulder creates a lower low and a lower high, while the right shoulder does not form a higher low and a higher high before breaking the neckline, the pattern may be invalid. Misaligned shoulders can lead to a false sense of a reversal and result in unsuccessful trades.
How to Correct It
- Ensure Symmetry: The left shoulder should create a lower low and a lower high, while the right shoulder should form a higher low and a higher high. This symmetry indicates that the market is setting up for a potential reversal. Proper alignment helps in filtering out less reliable patterns.
- Check Price Action: The price action into the head and from the head to the neckline should be strong and impulsive, not choppy and sloppy. Impulsive moves indicate strong market sentiment, reinforcing the pattern’s validity.
- Avoid Misinterpretations: Be cautious not to confuse the inverse head and shoulders pattern with other patterns like triangles or triple bottoms. Ensure the distinct characteristics of the pattern are present, such as the formation of three distinct troughs and the neckline.
By paying attention to these details and ensuring the shoulders are properly aligned, traders can avoid the common mistake of misidentifying the inverse head and shoulders pattern and make more informed trading decisions.
4. Confusing the Pattern with Triangles or Triple Bottoms

Traders often confuse the inverse head and shoulders pattern with other patterns such as triple bottoms or descending triangles. This confusion can lead to incorrect trading decisions. Here’s how to identify the differences:
The Problem: Confusing with Triple Bottoms
For triple bottom patterns, the confusion arises because each price low is at a similar level. This similarity makes the supposed “head” (point #2 above) indistinguishable from the shoulders. This lack of a distinct head and the equal lows across the pattern differentiate a triple bottom from an inverse head and shoulders, underscoring the importance of accurate pattern identification.
The Problem: Misidentifying Descending Triangles
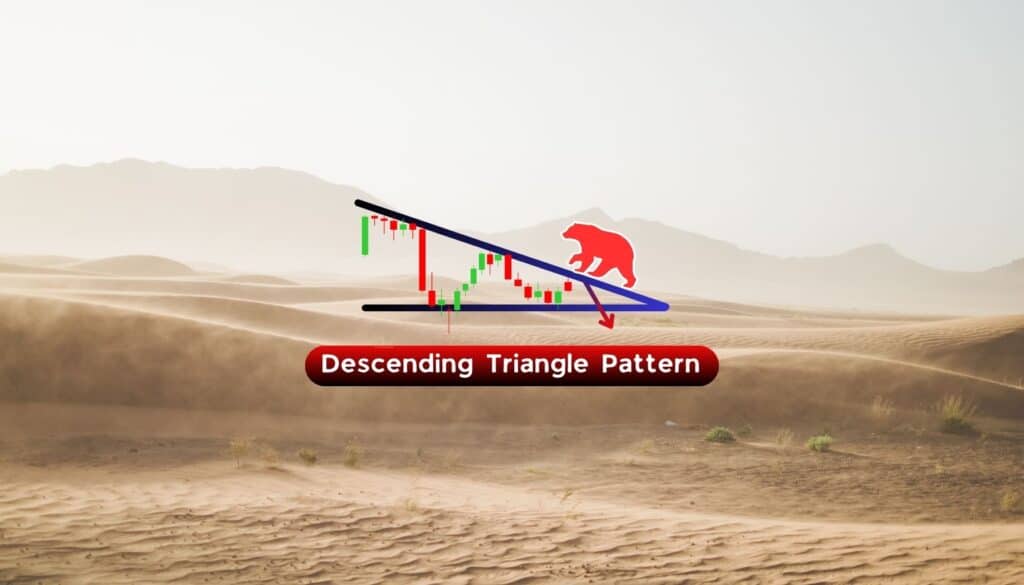
With a descending triangle, each of the three lows are at similar price levels. The descending “neckline” may mislead traders into believing it is an inverse head and shoulders pattern. However, unlike the inverse head and shoulders, a descending triangle features converging trendlines and typically signals a bearish continuation. The key issue here is that there is no distinct head in the middle trough, which is a defining characteristic of the inverse head and shoulders pattern. This lack of a prominent head differentiates a descending triangle from an inverse head and shoulders pattern, emphasising the need for careful identification.
The Solution
To avoid these misidentifications, ensure that the head is clearly visible and lower in price than the shoulders flanked on each side for an inverse head and shoulders pattern. The head should form a distinct low point, with the left and right shoulders being relatively higher and symmetrical. Additionally, the neckline should be clearly defined and break decisively to confirm the pattern.
In the case of triple bottoms, be aware of the equal lows and the absence of a distinct, deeper middle trough that characterises the head in an inverse head and shoulders pattern. For descending triangles, focus on the converging trendlines and the equal lows, which differentiate them from inverse head and shoulders patterns.
5. Improper Stop-Loss Placement
Proper stop-loss placement is essential for managing risk. Place stop-loss orders below the right shoulder or the head, depending on your risk tolerance and how conservative you trade. Regardless, be mindful of your risk to reward ratio.
Ensure there’s enough room for price fluctuations but not so much that potential losses are too high. This helps protect your capital while allowing for some market volatility. This will be discussed further down the page.
6. Unrealistic Profit Targets
Setting realistic profit targets is crucial for successful trading. Measure the distance from the neckline to the head and project this distance upwards from the breakout point for a reasonable profit target. Adjust your targets based on current market conditions and other resistance levels. This approach helps ensure that your profit expectations are aligned with market realities. This will be discussed further down the page.
By avoiding these common mistakes, traders can effectively utilise the inverse head and shoulders pattern to enhance their trading strategies and increase their chances of success.
Importance of Inverse Head and Shoulders Pattern
The inverse head and shoulders pattern is important for traders because it effectively spots reversals in a downtrend, whether it’s the main trend or a counter-trend. This pattern is highly valuable for catching the next bull run in the equities market or identifying an impending uptrend in a forex pair.
This chart pattern is important because it helps traders:
Spot Bullish Reversals: The primary importance of the inverse head and shoulders pattern lies in its ability to signal the end of a downtrend. By recognising this pattern, traders can anticipate the transition from bearish to bullish market sentiment. This foresight allows traders to position themselves advantageously for the upcoming trend reversal.
Avoid False Bottoms: One of the key benefits of this pattern is that it prevents traders from prematurely attempting to catch the bottom. The formation of the head (the lowest trough) and the subsequent right shoulder allow the price of the new trend to mature slightly. This means traders can enter the market with greater confidence after the price has formed a right shoulder and breached the neckline, indicating a more reliable trend continuation.
Strategically Time Trades: By waiting for the breakout above the neckline, traders ensure that the new uptrend is more established, reducing the risk of entering too early. This strategic timing is particularly beneficial when taking profits in a short position, as it provides a clear signal that the downtrend is over, and a new uptrend is beginning.
Versatility: This pattern is versatile and can be applied across a variety of chart time frame and various markets including equities, forex, and commodities. Its ability to signal trend reversals makes it a valuable addition to any trader’s toolkit, helping to identify potential opportunities for entering long positions in diverse trading scenarios.
Inverse Head and Shoulders Pattern Example
Bitcoin (BTC/USD) Chart

The chart above illustrates a classic example of the inverse head and shoulders pattern in Bitcoin (BTC/USD) on the weekly time frame. Here’s a breakdown of the key features:
- Prevailing Trend: The pattern forms after a significantly matured downward trend, which is essential for validating the inverse head and shoulders as a reversal pattern. In this case, Bitcoin experienced a clear downtrend before the pattern began to form.
- Neckline Slope: The neckline is horizontal, which is ideal for this reversal pattern. This slope helps confirm the trend reversal once the price breaks above it, indicating strong bullish sentiment.
- Entry Point: The entry is triggered at the break of the neckline. This breakout signals the beginning of a new uptrend, offering a clear entry point for traders. As shown in the chart, the price broke above the neckline decisively, confirming the pattern.
- Stop-Loss Placement: The stop-loss is placed beneath the right shoulder, providing a safety net if the price action invalidates the pattern and continues downward. This helps manage risk and protect against potential losses.
- Take Profit: The take profit target is based on the next resistance area. After breaking the neckline, the price continued to rise, reaching the next significant resistance level. This approach helps traders set realistic profit targets by using historical resistance levels to gauge where the price might encounter selling pressure.
In summary, the inverse head and shoulders pattern in Bitcoin’s weekly chart exemplifies a textbook trend reversal setup. By understanding and identifying these key features, traders can make informed decisions and potentially capitalise on the new uptrend.
Nvidia (NVDA) Chart

The chart above illustrates a classic example of the inverse head and shoulders pattern in NVIDIA Corporation (NVDA) on the daily time frame. Here’s a breakdown of the key features:
•Prevailing Trend: The pattern forms after a significantly matured downward trend, which is essential for validating the inverse head and shoulders as a reversal pattern. In this case, NVIDIA experienced a clear downtrend before the pattern began to form.
•Neckline Slope: The neckline is sloping downwards, which is ideal for this reversal pattern. This slope helps confirm the trend reversal once the price breaks above it, indicating strong bullish sentiment.
•Entry Point: The entry is triggered at the break of the neckline. This breakout signals the beginning of a new uptrend, offering a clear entry point for traders. As shown in the chart, the price broke above the neckline decisively, confirming the pattern.
•Stop-Loss Placement: The stop-loss is placed beneath the right shoulder, providing a safety net if the price action invalidates the pattern and continues downward. This helps manage risk and protect against potential losses.
New Zealand Dollar / U.S. Dollar (NZD/USD) Daily Chart

The chart above illustrates another example of the inverse head and shoulders pattern in the NZD/USD forex pair on the daily time frame. Here’s a breakdown of the key features:
- Prevailing Downward Trend: The pattern forms after a significant downward trend, which is essential for validating the inverse head and shoulders as a reversal pattern.
- Neckline Slope: The neckline is sloping downwards, which is ideal for this reversal pattern. A downward-sloping neckline helps confirm the trend reversal once the price breaks above it.
- Entry Point: The entry is triggered at the break of the neckline. This breakout signals the beginning of a new uptrend, offering a clear entry point for traders.
- Stop-Loss Placement: The stop-loss is placed beneath the right shoulder, providing a safety net if the price action invalidates the pattern and continues downward.
- Take Profit: The take profit level is set by measuring the distance from the neckline to the head and projecting this distance upwards from the breakout point. This ensures that the profit target is realistic and based on the pattern’s formation – more on this later.
New Zealand Dollar / U.S. Dollar (NZD/USD) 4-Hour Chart
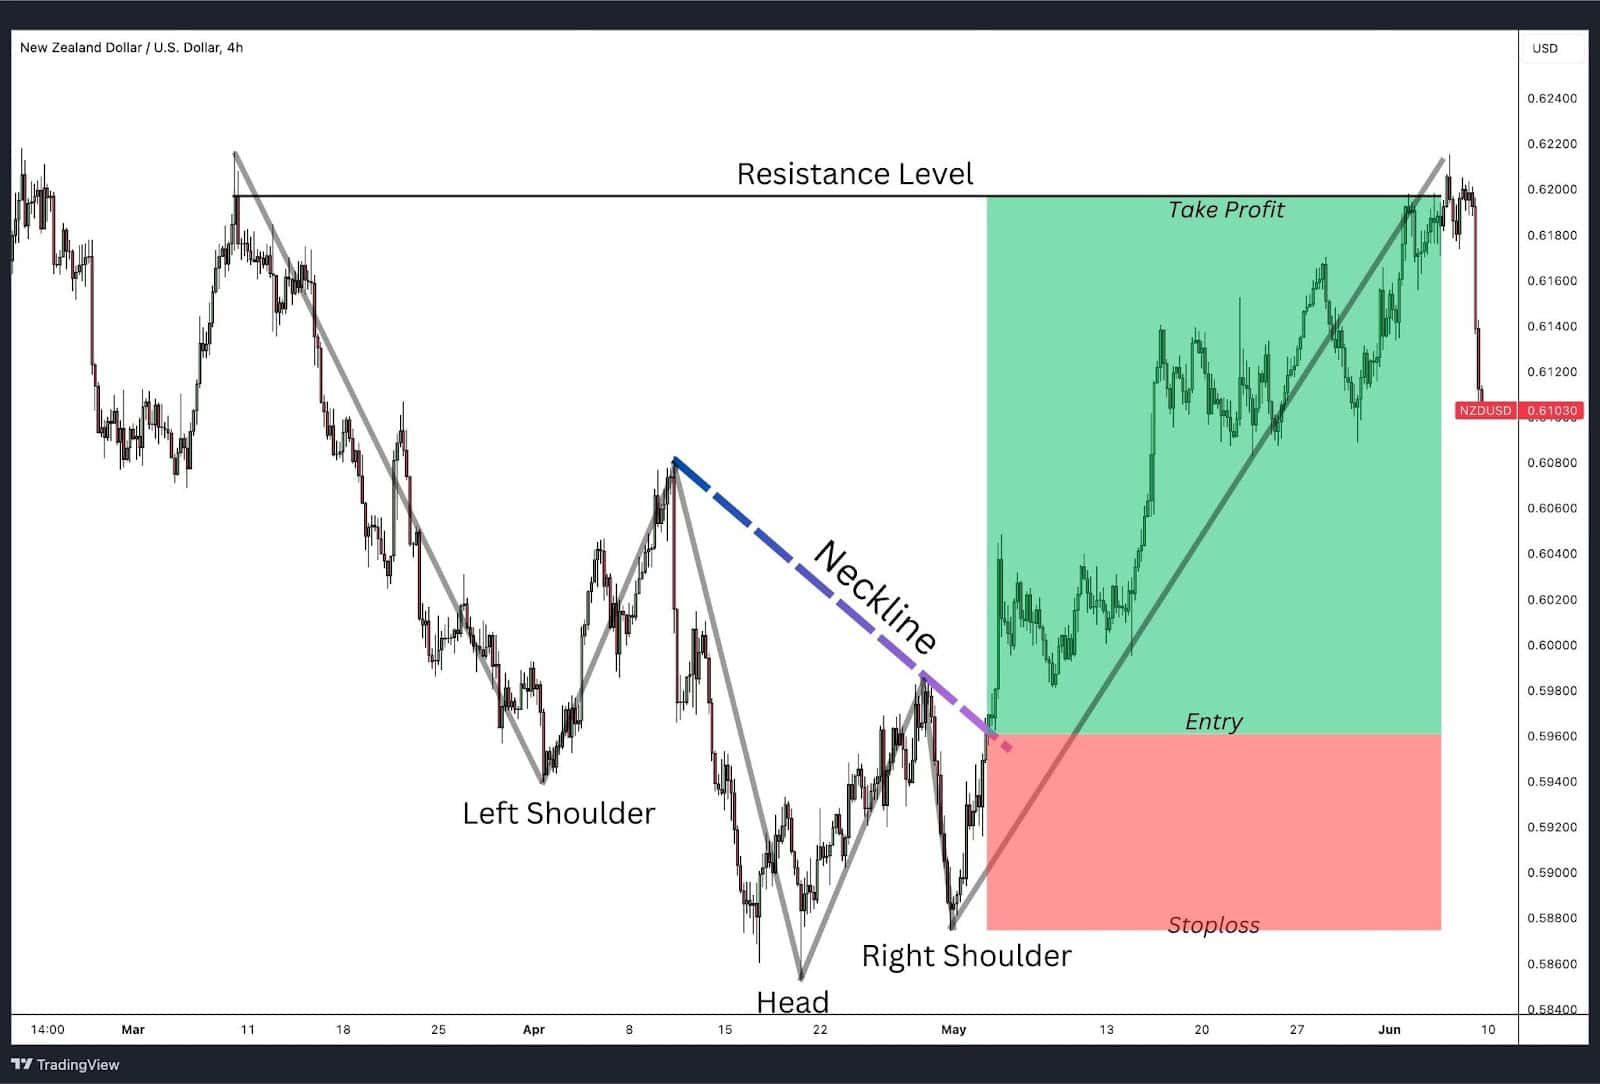
The chart above yet another NZDUSD inverse head and shoulders example, but on the 4-hour time frame. Here’s a breakdown of the key features:
- Prevailing Trend: The pattern forms after a significant downward trend, which is essential for validating the inverse head and shoulders as a reversal pattern.
- Neckline Slope: The neckline is sloping downwards, which is ideal for this reversal pattern. A downward-sloping neckline helps confirm the trend reversal once the price breaks above it.
- Entry Point: The entry is triggered at the break of the neckline. This breakout signals the beginning of a new uptrend, offering a clear entry point for traders.
- Stop-Loss Placement: The stop-loss is placed beneath the right shoulder, providing a safety net if the price action invalidates the pattern and continues downward.
- Take Profit: The take profit level is set at the resistance level, ensuring that profits are secured as the price reaches a key level of interest.
These examples highlight the importance of the neckline’s slope, appropriate stop-loss placement, and realistic profit targets to maximise trading success.
Inverse Head and Shoulders Risk Reward Ratio
When trading the inverse head and shoulders pattern, such as the NZD/USD example, adhering to a structured approach can yield a favourable risk-reward ratio (RRR). Here’s how to set it up:
Trade Setup:
- Stop-Loss Order: Place it below the right shoulder to manage risk.
- Entry Point: Enter the trade near the neckline for an optimal position.
- Profit Target: Aim for the measured move of the pattern.
Understanding Risk-Reward Ratio (RRR):
- Definition: The RRR compares the potential profit of a trade to its potential loss.
- Minimum Target: Aim for a minimum RRR of 2:1. This means the potential profit should be at least twice the potential loss.
- Example: If the stop-loss is set 50 pips below the entry point, the target profit should be at least 100 pips above the entry.
Benefits of a Good RRR:
- More Forgiving: Allows you take on some losing trades without jeopardising the overall strategy as you’ll have larger winning trades compared to the size of the losing trades
- Risk Management: Helps maintain a disciplined approach to trading, reducing the impact of potential losses.
Inverse Head and Shoulders Pattern Trading Strategies
In this section, we will discuss effective trading strategies for the inverse head and shoulders pattern. We will focus on two primary approaches: trading the neckline breakout and trading the retest of the neckline. These strategies will be supported by a few examples to illustrate their practical application.
Trading the Neckline Breakout
Tesla Inc (TSLA)

The chart above illustrates a classic inverse head and shoulders pattern for Tesla, Inc. (TSLA) on the daily time frame. Here’s a technical breakdown of the pattern and its key features:
Prevailing Trend
Prior to the formation of the inverse head and shoulders pattern, Tesla was in a significant downward trend. This downtrend is crucial for validating the inverse head and shoulders as a reversal pattern. It establishes the context for the potential shift from bearish to bullish sentiment.
Formation Process
- Left Shoulder: The left shoulder forms as the price declines to a new low and then bounces back up, creating a lower high. This initial bounce is seen as a temporary correction within the broader downtrend.
- Head: The price then dips further to create the head, which is the lowest point of the pattern. This deeper low is crucial as it signifies the last strong push by sellers. However, during this phase, the selling pressure starts to weaken.
- Right Shoulder: Finally, the right shoulder forms as the price makes a higher low compared to the head, indicating that buyers are starting to gain strength. The right shoulder’s formation suggests a shift in market sentiment, from bearish to more neutral or slightly bullish.
Neckline
The neckline is drawn by connecting the peaks between the left shoulder, head, and right shoulder. In this example, the neckline is slightly sloping downwards, which is ideal for confirming the trend reversal once the price breaks above it.
Entry Point
The entry is triggered when the price breaks above the neckline. This breakout signals the beginning of a new uptrend, offering a clear entry point for traders. In the case of Tesla, the price decisively broke above the neckline, indicating strong bullish sentiment.
Trading the Neckline Re-test

The chart above illustrates an inverse head and shoulders pattern for the S&P 500 Index (SPX) on the daily time frame. Here’s a detailed technical analysis of this pattern, with a focus on the retest before the execution:
Prevailing Trend
Before the inverse head and shoulders pattern formed, the S&P 500 was in a significant downtrend. This established a bearish context, essential for validating the inverse head and shoulders as a reversal pattern. The downtrend provided the necessary backdrop for the potential shift in market sentiment from bearish to bullish.
Formation Process
- Left Shoulder: The left shoulder forms as the price declines to a new low and then rebounds, creating a lower high. This initial bounce is perceived as a temporary correction within the ongoing downtrend.
- Head: The price then falls further, forming the head, which is the lowest point of the pattern. This deeper low signifies the last strong effort by sellers, but the selling pressure starts to weaken.
- Right Shoulder: Finally, the right shoulder forms when the price makes a higher low compared to the head, indicating that buyers are gaining strength. The right shoulder’s formation suggests a shift in market sentiment, from bearish to more neutral or slightly bullish.
Neckline
The neckline is drawn by connecting the peaks between the left shoulder, head, and right shoulder. In this case, the neckline is slightly sloping downwards, which is ideal for confirming the trend reversal once the price breaks above it.
Entry Point and Retest
The entry point is triggered when the price breaks above the neckline. However, a crucial aspect of this particular pattern is the retest of the neckline before the price continues to rise. After breaking above the neckline, the price pulled back to retest the neckline, which acted as a new support level. This retest provided additional confirmation of the breakout’s validity, allowing traders to enter the trade with greater confidence. The successful retest of the neckline reduced the likelihood of a false breakout and reinforced the pattern’s reliability.
Advantages of Trading the Inverse Head and Shoulders Pattern
Market Structure Alignment

One of the main advantages of trading the inverse head and shoulders pattern is that it aligns well with market structure during a reversal. This pattern offers a reliable indication that a downtrend is ending and an uptrend is beginning, allowing traders to enter the market at a more mature and confirmed stage of the trend reversal rather than attempting to catch the exact bottom.
Ease of Identification

The inverse head and shoulders pattern is relatively easy to spot on price charts. The formation of three distinct troughs, with the middle trough (the head) being the lowest, makes this pattern straightforward to identify. This clarity helps traders avoid ambiguity and ensures that they can recognise the pattern with confidence.
Clear Entry and Exit Points

Another significant advantage is that the pattern provides clear entry and exit points. The neckline serves as a definitive entry point once the price breaks above it, and the stop-loss can be placed below the right shoulder to manage risk. Additionally, profit targets can be set based on the distance between the head and the neckline, offering a systematic approach to trading.
Disadvantages of Trading the Inverse Head and Shoulders Pattern
False Signals
Like all technical patterns, the inverse head and shoulders can produce false signals. The price might break the neckline but then fail to continue upwards, leading to potential losses for traders who entered on the breakout. This is particularly common in highly volatile markets or during periods of market uncertainty.
Subjectivity in Identification
Identifying an inverse head and shoulders pattern can be somewhat subjective. Traders may have different interpretations of where the shoulders are and the resulting neckline, which can lead to inconsistent results. This subjectivity can result in missed opportunities or entering trades based on misidentified patterns.
Delayed Confirmation
Waiting for confirmation of the pattern, such as a breakout above the neckline, might result in a higher priced entry point. Entering the position at a higher price would mean less trend left over to profit from. This becomes more noticeable if the market doesn’t fully travel the measured move.
The Significance of False Breakouts in the Inverse Head and Shoulders Chart Pattern
False breakouts are a critical aspect to consider when trading the inverse head and shoulders pattern. A false breakout occurs when the price breaks above the neckline but fails to sustain the upward momentum, subsequently falling back below the neckline. Although we cannot eliminate false breakouts entirely, here are four ways we can reduce the likelihood of a false breakout and their impact.
Confirmation of the Breakout
A false breakout often results in significant losses for traders who enter positions too early without waiting for neckline confirmation. To avoid this, it’s essential to wait for confirmation of the breakout. This confirmation is typically signalled by a sustained price movement above the neckline accompanied by higher trading volume. Here are some additional strategies to ensure the breakout is valid:
Confirm Breakout with Green Candle Close Above the Neckline

One way to reduce the number of false breakouts is to confirm the breakout. After a breakout occurs, wait for a green (bullish) candle to close above the neckline. This indicates that buyers have successfully pushed the price above the resistance level and are maintaining control. This method prevents a temporary spike higher in prices that cannot be sustained. A single candle close may not be sufficient, so some traders prefer to wait for two or three consecutive green candles to confirm the breakout.
Confirm Breakout with Retest of the Neckline

After the initial breakout, a retest of the neckline can provide further confirmation. If the price pulls back to the neckline and then bounces back up, treating the neckline as a new support level, it reinforces the validity of the breakout. This retest allows traders to enter the trade with more confidence, knowing that the breakout has been tested and confirmed.
Risk Management
False breakouts highlight the importance of proper risk management strategies. Placing stop-loss orders just below the right shoulder can help mitigate potential losses if the breakout fails. A breakout with low volume is more likely to be false, while a breakout with high volume indicates stronger buyer commitment and a higher chance of the trend continuing upwards.
Market Sentiment and Volatility
False breakouts can also reflect broader market sentiment and volatility. In highly volatile markets, the probability of false breakouts increases due to erratic price movements. Traders should consider the overall market environment and use additional technical indicators to validate the breakout and enhance their trading decisions.
What Happens After an Inverse Head and Shoulder False Breakout?
After an inverse head and shoulders false breakout, the price typically retreats back below the neckline, failing to sustain the upward momentum. This often results in the price declining further, potentially falling below the peak of the right shoulder. Such a move indicates that the bullish reversal has not materialised, and the bearish trend may continue.
How to Mitigate the Risk of False Breakouts in the Inverse Head and Shoulders Chart Pattern
Mitigating the risk of false breakouts in the inverse head and shoulders pattern involves a combination of price action analysis and using other technical indicators.
Price Action
- Impulsive Moves: The price action from the left shoulder to the head and from the head to the right shoulder should be impulsive, characterised by strong and trending movements rather than choppy and corrective price action. This indicates a genuine shift in market sentiment and increases the reliability of the pattern.
- Strong Breakout: The breakout above the neckline should also be strong and decisive. Avoid entering trades on weak or choppy breakouts as these are more prone to failure. A robust breakout signals strong buying interest and a higher likelihood of a sustained upward move.
Momentum Indicators
- Momentum Indicators: Indicators like the Relative Strength Index (RSI) can be helpful in confirming the strength of the breakout. An RSI reading above 50, moving upwards during the breakout, adds confidence to the trade. Additionally, other momentum indicators like the MACD can also be used to validate the breakout’s strength.
Retest of the Neckline
A retest of the neckline after the breakout can provide additional confirmation and help prevent false breakouts. If the price breaks above the neckline and then retests it as support without falling back below, it confirms the neckline as a new support level and validates the pattern. This approach helps traders enter the trade with greater confidence, reducing the risk of false signals.
When focusing on impulsive price action, confirming with volume and momentum indicators, and waiting for a neckline retest—traders can effectively mitigate the risk of false breakouts when trading the inverse head and shoulders pattern.
What Indicators Are Best to Trade With An Inverse Head and Shoulders Pattern?
Utilising technical indicators alongside the inverse head and shoulders pattern can enhance the reliability of trading signals and provide additional confirmation for entry and exit points. Here are some of the best indicators to use in conjunction with this pattern:
Inverse Head and Shoulders Pattern with Moving Averages
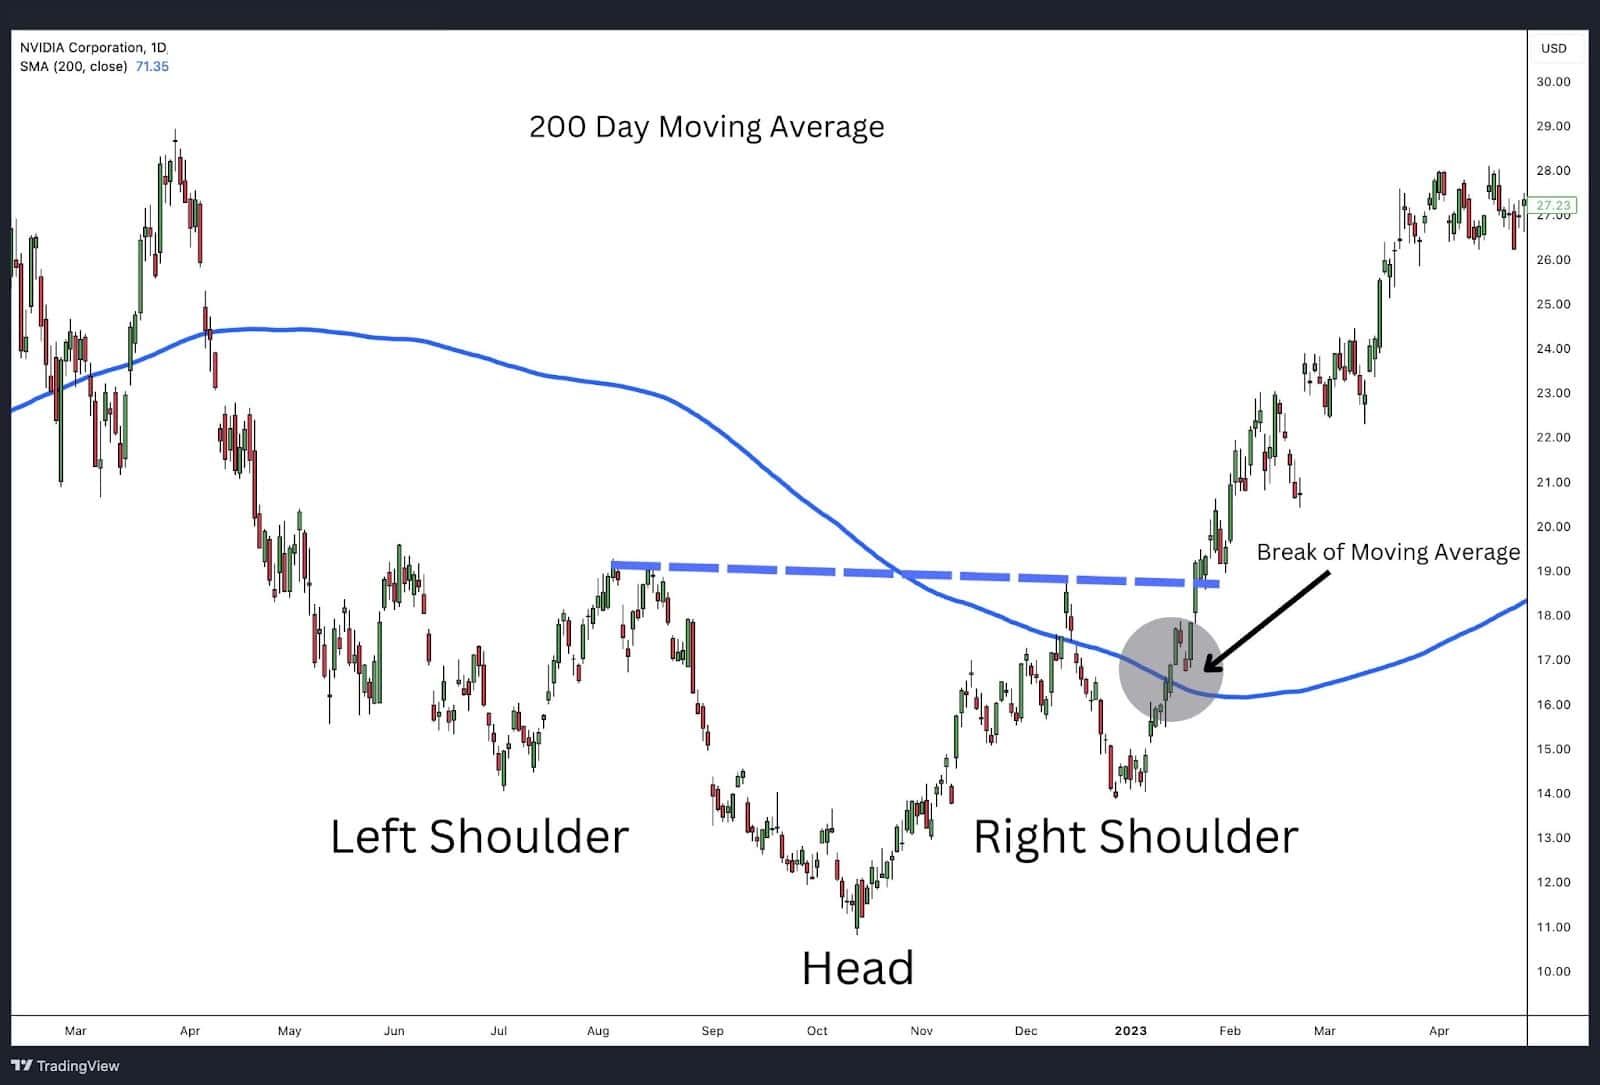
The chart above shows an inverse head and shoulders pattern for NVIDIA Corporation (NVDA) on the daily time frame. The pattern includes a clear left shoulder, head, and right shoulder, indicating a potential bullish reversal. An important aspect of this pattern is the interaction with the 200-day simple moving average.
As the price breaks above the neckline, it also surpasses the 200-day moving average, adding a significant layer of confluence. This dual breakout not only confirms the pattern but also suggests a strong shift in market sentiment, reinforcing the likelihood of a sustained upward trend. The moving average acts as additional confirmation, increasing trader confidence in the new bullish phase.
Inverse Head and Shoulders Pattern with MACD
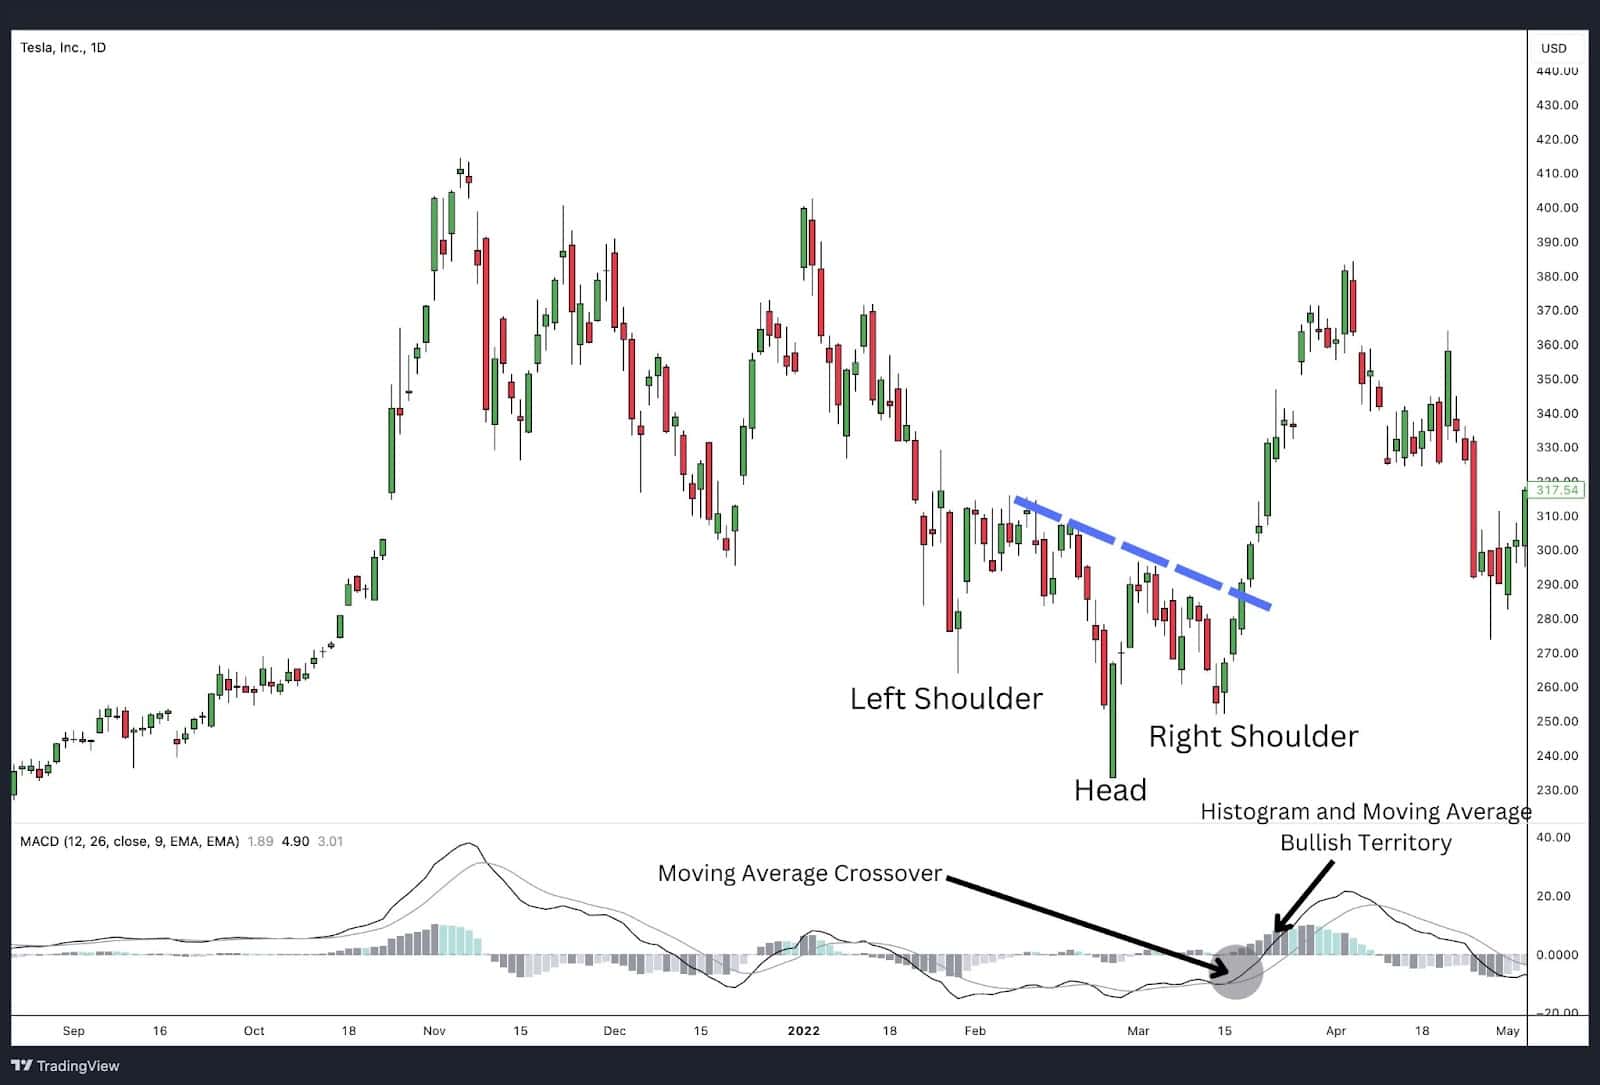
The Moving Average Convergence Divergence (MACD) is a momentum indicator that helps identify changes in the strength, direction, momentum, and duration of a trend. When trading the inverse head and shoulders pattern, a bullish MACD crossover (when the MACD line crosses above the signal line) can confirm the upward momentum and strengthen the signal to enter a trade after the neckline breakout.
In the example above, notice how the MACD cross up appeared just before price broke above the neckline. The MACD cross up is an indication that the downtrend is shifting from down to up.
Inverse Head and Shoulders Pattern with RSI
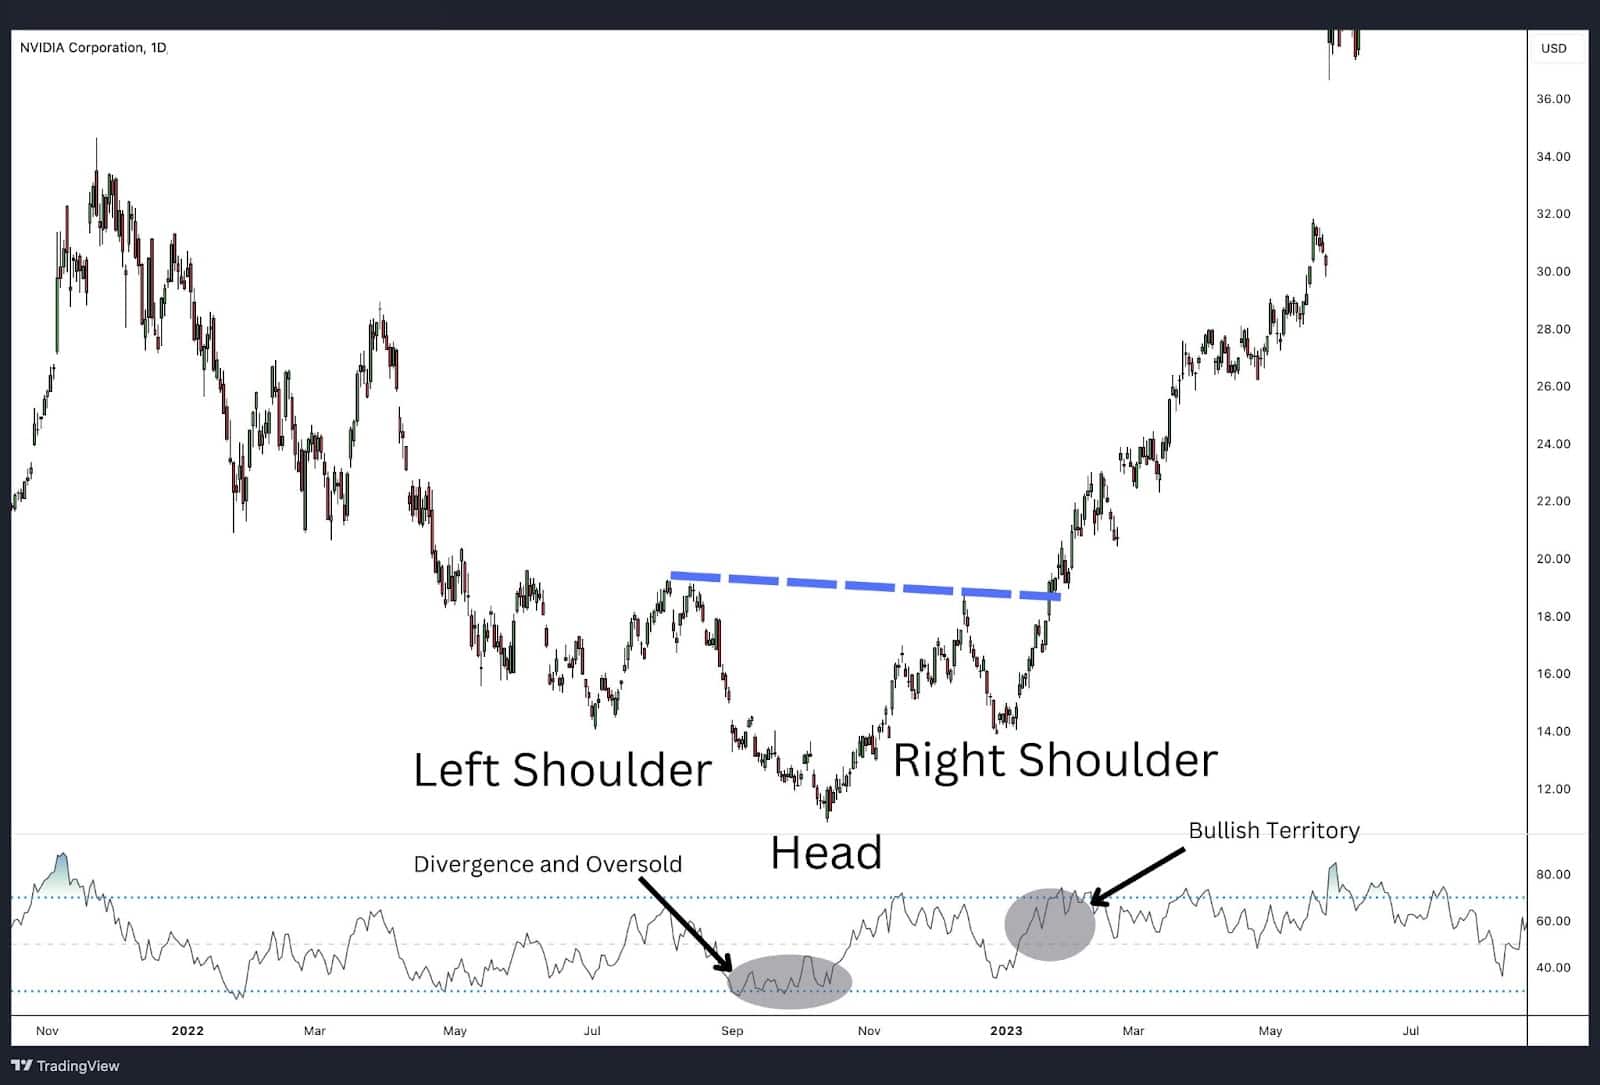
The chart above shows an inverse head and shoulders pattern for NVIDIA Corporation (NVDA) on the daily time frame, with the Relative Strength Index (RSI) providing additional insights. During the formation of the pattern, the RSI typically exhibits bullish divergence, especially when the head is forming. This indicates that while the price is making lower lows, the RSI is forming higher lows, suggesting that the downtrend is losing momentum.
As the right shoulder develops, the RSI rises from oversold levels, often crossing above 30, indicating increasing buying interest. When the price breaks above the neckline, the RSI usually moves into bullish territory, confirming the breakout and signalling a potential upward trend. This progression of the RSI helps traders validate the inverse head and shoulders pattern and enhances confidence in a bullish reversal.
Inverse Head and Shoulders Pattern with Volume Oscillator

Volume can play an important role in validating the inverse head and shoulders pattern. The Volume Oscillator can help track volume changes and confirm the pattern. Ideally, you want to see higher volume on the breakout above the neckline, indicating strong buying interest. Additionally, increasing volume during the formation of the left and right shoulders, with a decrease of volume sandwiched in during the head formation, can further confirm the pattern’s reliability.
Inverse Head and Shoulders Pattern with Fibonacci Retracement

Fibonacci retracement levels help identify hidden levels of support and resistance. This can be particularly useful in determining how deep the right shoulder may form. For instance, prior to a neckline breakout, the price might retrace to a Fibonacci level before continuing the uptrend.
In the example above, we can see the right shoulder retraces 61.8% the length of the head.
Also, Fibonacci retracement levels can provide realistic targets for taking profits when you use it as an expansion tool. When the neckline has a slight slope to it, the -100% level is a common target. You see, the -100% level is the price zone for a measured move when the distance from the head to the neckline is projected at the point of breakout. As you can see, the Fib tool is versatile and helps manage trader expectations.
Inverse Head and Shoulders Pattern with Bollinger Bands
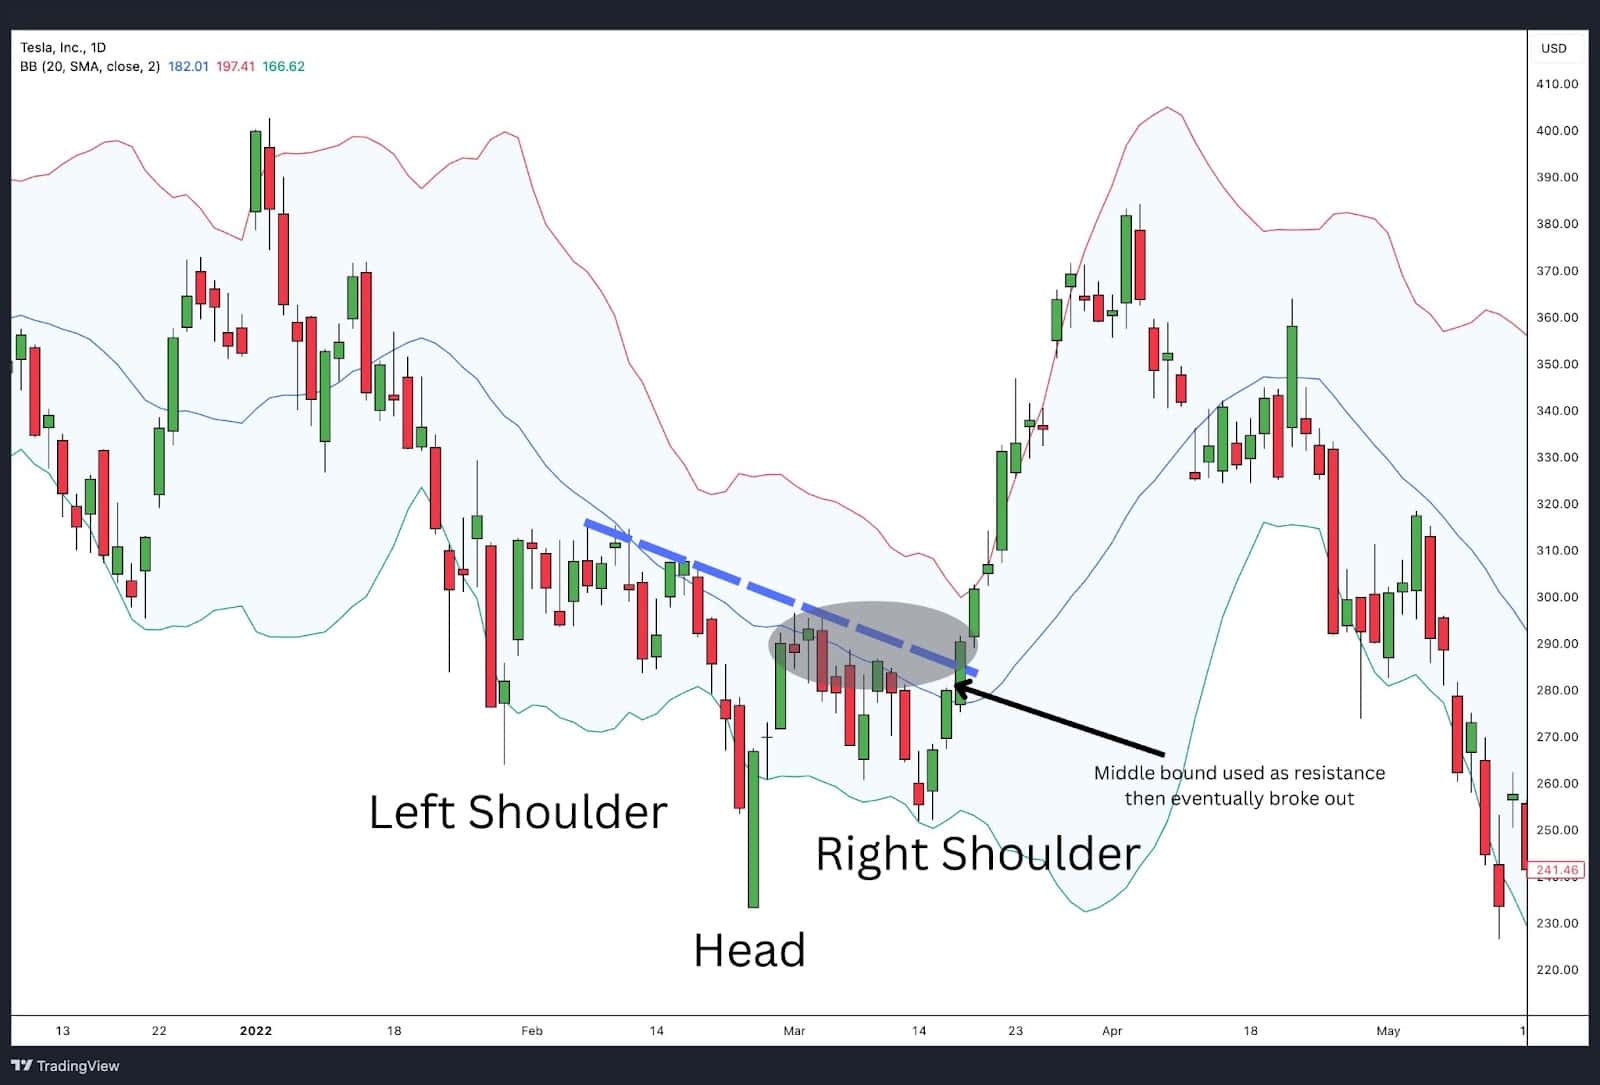
Bollinger Bands® measure market volatility and provide dynamic support and resistance levels. It is common for the lower band to support the head and shoulders of the inverse head and shoulders pattern.
After the pattern forms, a breakout above the neckline likely coincides with a move to the upper half of the bands. A break or test of the upper Bollinger Band can signal strong bullish momentum. Additionally, the bands’ expansion can indicate increased volatility, supporting the validity of the breakout.
Inverse Head and Shoulders Pattern with Stochastic Oscillator
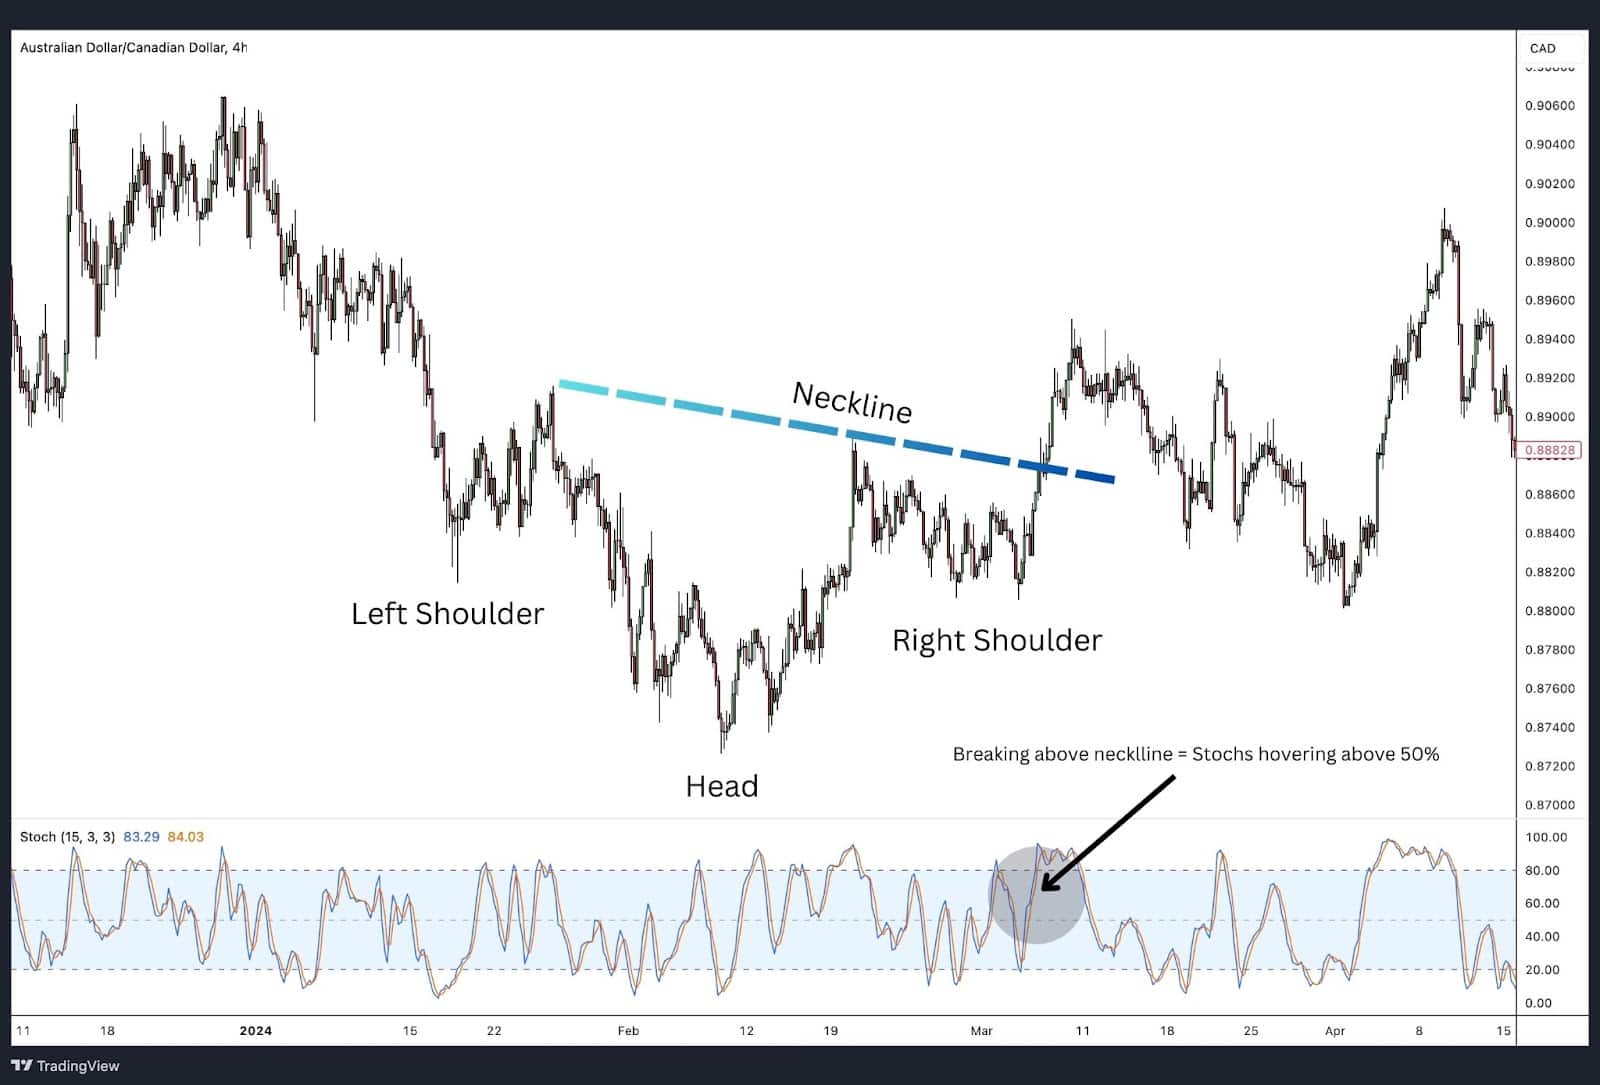
The chart above shows an inverse head and shoulders pattern for the Australian Dollar/Canadian Dollar (AUD/CAD) on the 4-hour time frame, with the Stochastic Oscillator providing additional confirmation. As the pattern developed, the stochastic indicator displayed notable behaviour.
When the price broke above the neckline, the stochastic values were hovering above the 50 mark, indicating bullish momentum. This suggests that buying interest is increasing, further validating the breakout and the potential for a sustained upward trend. The alignment of the stochastic oscillator with the neckline breakout provides traders with an additional layer of confidence in the pattern’s reliability.
Inverse Head and Shoulders vs Head and Shoulders

The beauty of the head and shoulders pattern lies in its versatility, making it tradable within both bullish and bearish trends.
The original head and shoulders pattern is particularly ideal for the stock market as it helps predict when a bull run is coming to an end. Investors and speculators spot this pattern to understand when to take profits or consider short positions. When the head and shoulders pattern forms, it signals a bearish reversal, indicating that the upward trend is likely to reverse and a downtrend may commence.
On the other hand, the inverse head and shoulders pattern, despite being a reversal pattern, forecasts and provides traders with an opportunity to ride the next bull run. This pattern is invaluable in the stock market as it signals a bullish reversal. When traders identify an inverse head and shoulders pattern, they can anticipate the end of a downtrend and position themselves to benefit from the ensuing upward momentum.
In the FX market, traders can utilise these patterns to take advantage of both buying and selling opportunities. The head and shoulders pattern allows traders to sell or short currencies by predicting the end of an uptrend, while the inverse head and shoulders pattern provides opportunities to buy or go long by signalling the end of a downtrend. This dual capability makes these patterns highly valuable in forex trading.
Overall, the head and shoulders pattern signals a bearish reversal, indicating the potential for a downward trend after a period of rising prices. Conversely, the inverse head and shoulders pattern signals a bullish reversal, suggesting the likelihood of an upward trend following a period of declining prices. Both patterns offer clear signals for traders, enabling them to make informed decisions with their trading strategies.
What is the psychology behind the Inverse Head and Shoulders pattern?
The inverse head and shoulders pattern is a technical analysis pattern that signals a potential reversal from a downtrend to an uptrend. The psychology behind this pattern involves several key stages that reflect the changing sentiment and behaviour of market participants:
Formation Stages and Psychological Aspects:
- Left Shoulder Formation:
- Psychology: The asset price falls to a new low, followed by a short-term rally. At this stage, the market sentiment is predominantly bearish. However, some buyers start to step in, thinking the price has hit a temporary low, causing a minor upward movement.
- Head Formation:
- Psychology: The price drops again, reaching a lower low than the left shoulder. This reinforces the bearish sentiment, and sellers dominate the market. This phase often shakes out weak hands and induces panic selling. Despite the increased selling pressure, some astute buyers begin to accumulate at these lower levels, recognising the potential for value.
- Right Shoulder Formation:
- Psychology: The price rises from the head’s low, then declines again but only to the level of the left shoulder, not as low as the head. This suggests that the selling pressure is diminishing. The formation of the right shoulder indicates that buyers are stepping in sooner, and there is increased buying interest at higher lows. This change in behaviour reflects a shift in market sentiment from bearish to more neutral or cautiously optimistic.
Completion and Confirmation:
- Neckline Breakout:
- Psychology: The pattern is confirmed when the price breaks above the neckline (a resistance level connecting the highs of the left shoulder, head, and right shoulder). This breakout signifies a significant shift in sentiment from bearish to bullish. Traders who were previously short start covering their positions, and new buyers enter the market, driving the price higher.
Key Psychological Insights:
- Bearish Exhaustion:
- The pattern begins with strong selling pressure and slowing down momentum between the left shoulder and head but shows diminishing downward momentum on the right shoulder. This indicates that bears are losing control.
- Buyer Accumulation:
- Smart money and value investors often start accumulating during the head formation, recognising undervalued conditions.
- Shift in Sentiment:
- The higher low of the right shoulder reflects a psychological shift. Buyers are more willing to step in, and sellers are less aggressive.
- Breakout Confirmation:
- The neckline breakout serves as a final confirmation that the sentiment has turned bullish. This breakout often triggers a surge in buying interest as more traders recognise the reversal signal.
Implications for Traders:
- Bullish Signal:
- The pattern is considered a strong bullish reversal signal. Traders often enter long positions upon the neckline breakout, expecting further upward movement.
- Stop-Loss Placement:
- A common strategy is to place stop-loss orders below the right shoulder or the head, managing risk in case the pattern fails.
- Volume Consideration:
- Increasing volume on the breakout adds to the reliability of the pattern, indicating strong conviction behind the price movement.
FAQ
What Is the best time frame settings to use for the inverse head and shoulders pattern?
The higher the time frame the better, such as a daily or weekly chart. Lower time frames increase the possibility of pattern failures due to market noise. The pattern can be easily found on 1 hour to 8 hours time frames too providing a balance of reliability and practicality.
Who first identified the inverse head and shoulders pattern?
The head and shoulders pattern, including its inverse version, was first identified by technical analysis pioneer Richard W. Schabacker in his 1932 book “Technical Analysis and Stock Market Profits.”
How reliable is the inverse head and shoulders pattern?
A study published in the book Encyclopedia of Chart Patterns suggests head and shoulders trigger off 81% of the time and trends 16% on average making it a relatively reliable indicator for trend reversals. The reliability of the head and shoulders pattern in general varies by asset class.
Is inverse head and shoulders pattern bullish or bearish?
The inverse head and shoulders pattern is bullish. It signals a potential reversal from a downtrend to an uptrend.
How to identify failed inverse head and shoulders pattern?
To identify a failed inverse head and shoulders pattern, observe if the price fails to break above the neckline or if it breaks but then falls back below it. Additionally, lack of supporting volume during the breakout and failing to see impulsive moves from the shoulders to the head can also indicate a false pattern.


