


Written by:

Reviewed by:

Bearish
- October 21, 2025
- 24 min read
Dead Cat Bounce: Comprehensive Guide for Traders
What is a Dead Cat Bounce?
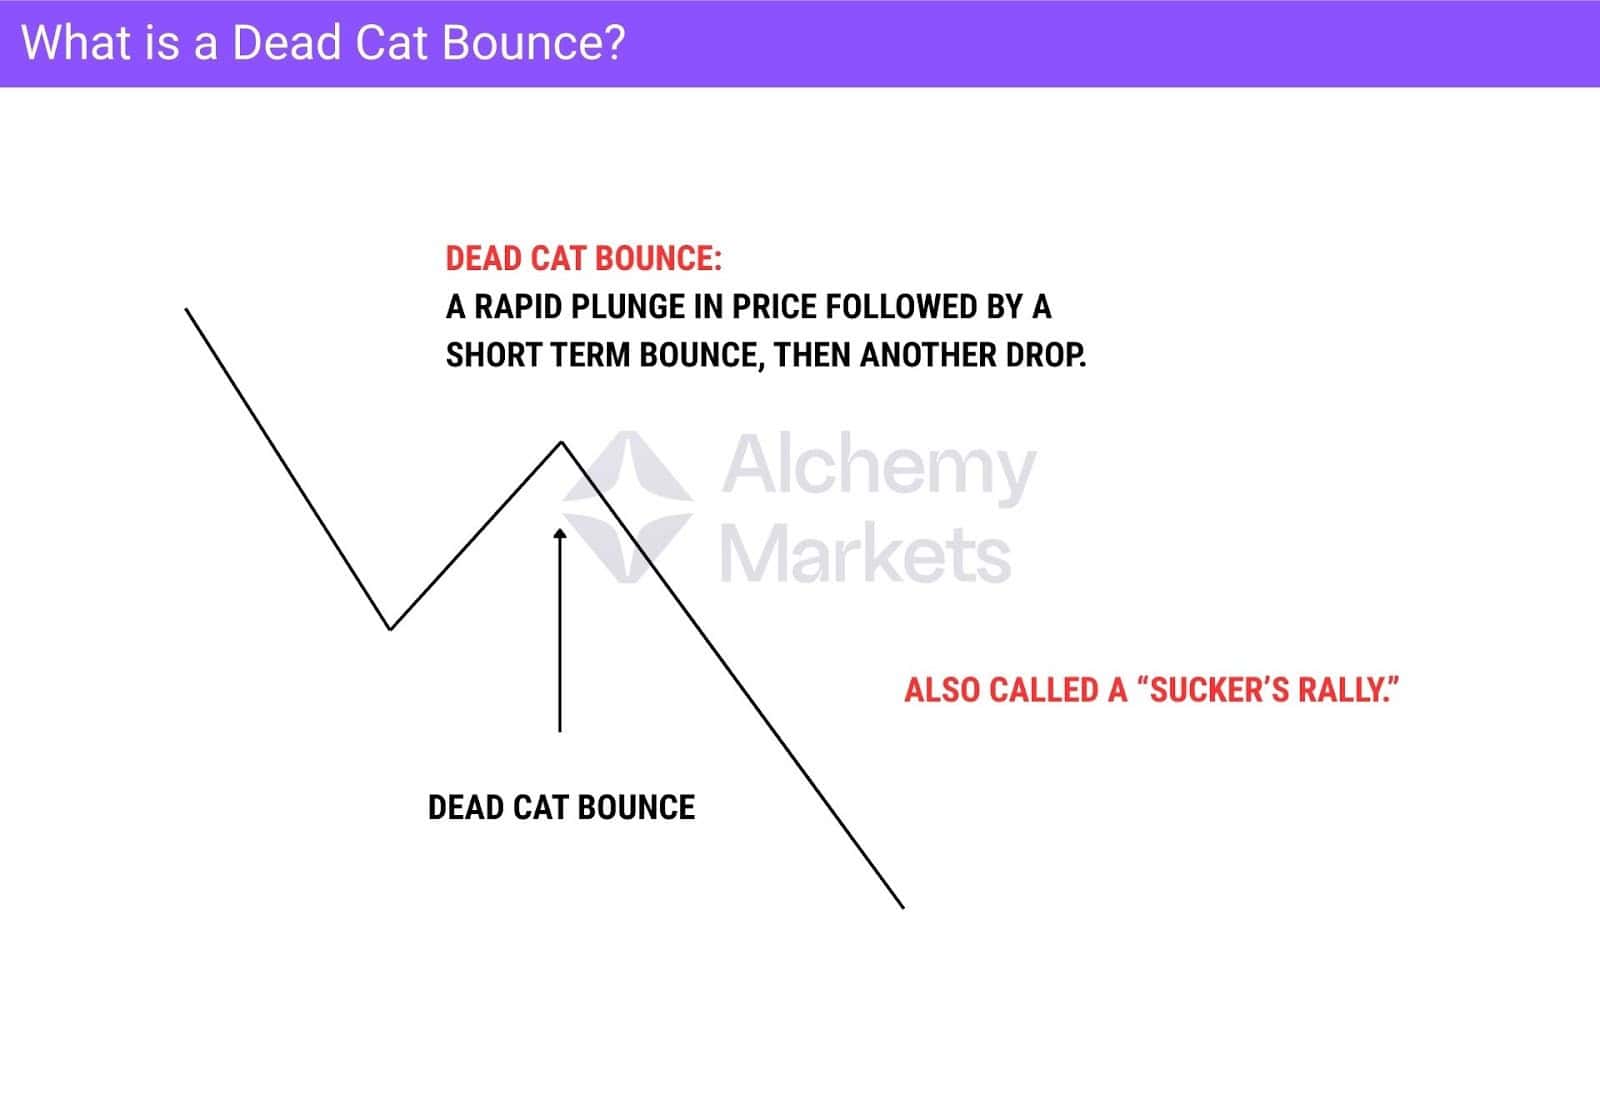
A “dead cat bounce” is best described as an asset falling rather rapidly from higher levels at an extreme velocity. Eventually, the market bounces quite drastically, through the process of either buyers stepping in to support what they think is an asset that has “fallen too far”, or those who have shorted the asset and are looking to take profit.
The best way to describe it is an extreme drop, followed by an equally violent bounce. The prolonged decline of an asset will eventually see a bit of a correction. While there is no actual ratio to measure a dead cat bounce, it is a general term that suggests an asset either recovers temporarily or simply loses momentum due to the selling pressure.
That being said, the recovery in price is temporary and suggests that there are much larger losses to be had in what is becoming a bear market.
Why is it Called a Dead Cat Bounce?
The phrase “dead cat bounce” is an old expression from Wall Street, which typically comes from the suggestion that a drop from far enough of a height, “even a dead cat will bounce.” There are several theories as to where the phrase came from, some suggesting that it came from the United Kingdom in the 1980s; however, there are some mentions of this phrase from previous American literature. Simply put, it’s just slang that seems to have stuck with traders.
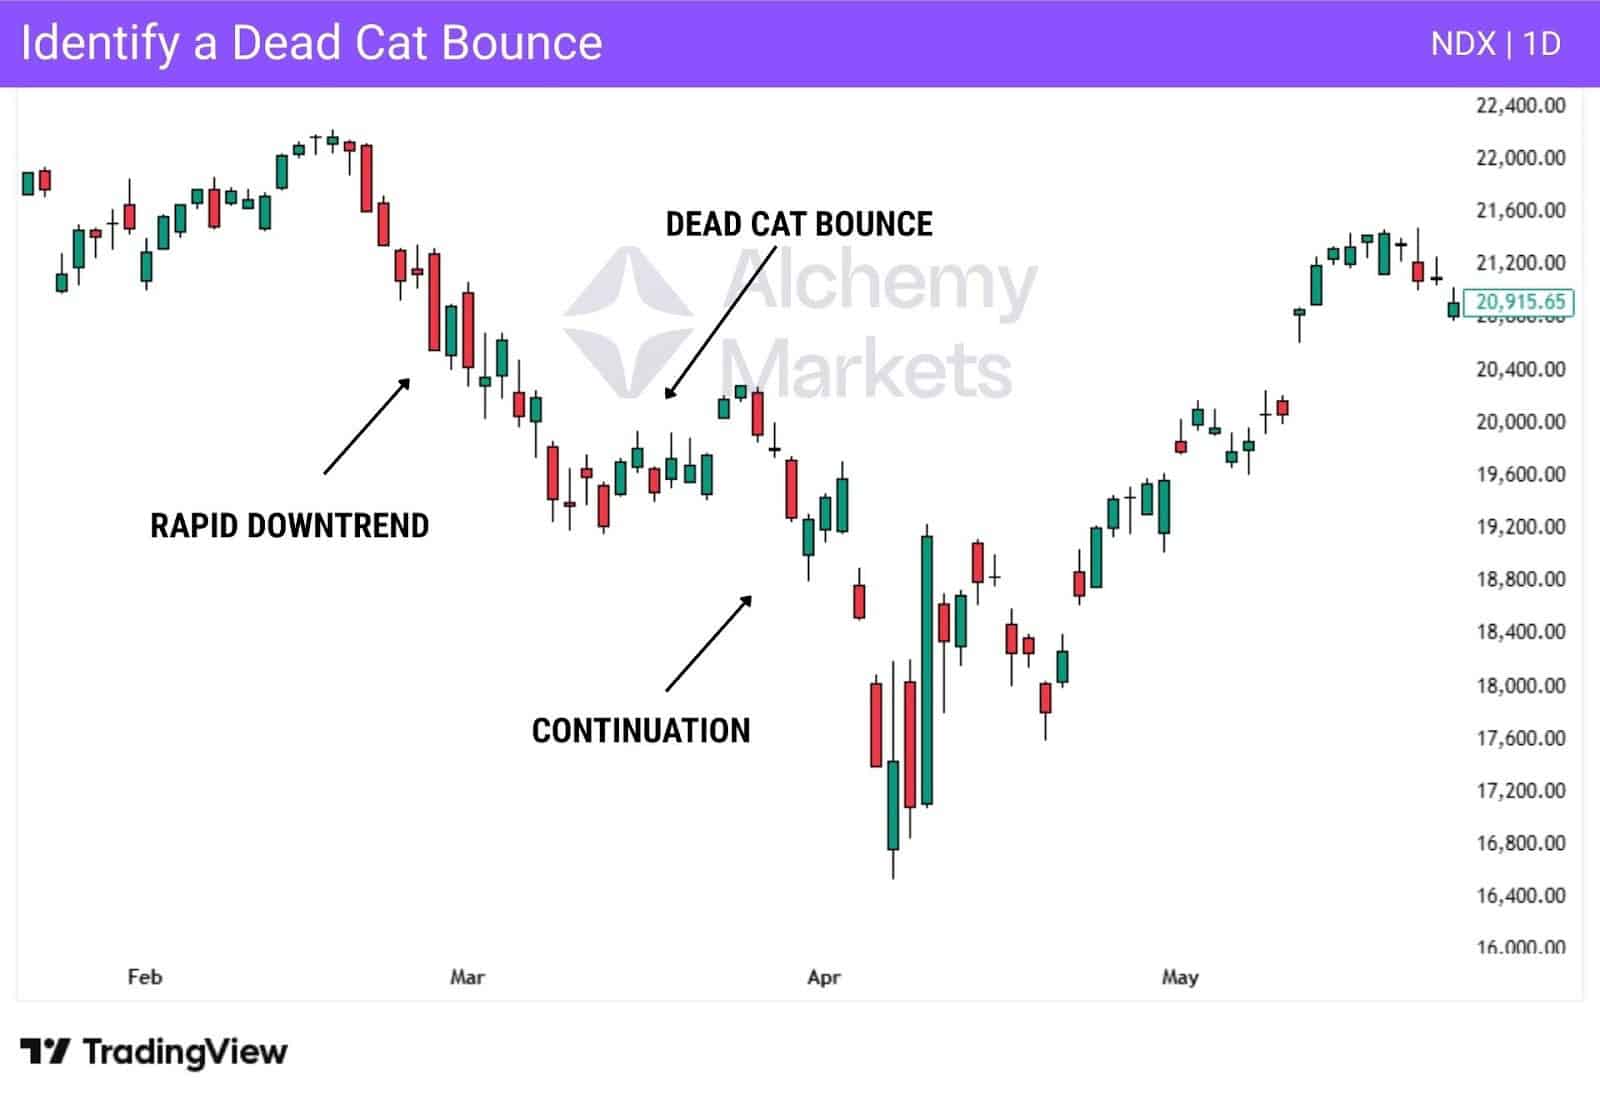
How to Identify a Dead Cat Bounce?
A dead cat bounce is simply a slight bounce in an otherwise aggressively negative market. This is something that can be best identified after the fact, but the simplest way to figure it out is if the market rallies for a short time and then falls below the initial push lower. The velocity of the downward pressure in the first leg of the move should be strong.
Key Characteristics of Dead Cat Bounce Pattern
While there is no specific verifiable price pattern that is specific to a dead cat bounce, there are a few things that can be signs of it dead cat bounce potentially happening. To begin with, you need significant selling pressure. Sometimes, this can even include a gap down, meaning that the price opens significantly lower than it closed during the previous session. Obviously, this is more likely to happen in stock trading, but not so much in 24-hour markets.
There is a steady decline in the asset over time. That being said, the dead cat bounce part is when the price of the asset rises, typically done very quickly, kicking off what some will call a “sucker’s rally”, which is quickly followed by further selling pressure. It is simply when investor sentiment collapses, followed by a quick bounce, and then the market continues to see further selling. The next phase is the final leg, which occurs once the market has fallen below the initial drop, making a “lower low.” The final leg of selling pressure can be as rapid as the first leg of the drop, but doesn’t have to be.
The main concern is that the prolonged decline continues.
How Does a Dead Cat Bounce Work?
The dead cat bounce works by sellers taking profit, or perhaps traders out there looking to find value in a stock or other asset that has fallen “too far” and has got “cheap.” However, it is important to remember that things can get cheaper, and the market was losing value for a reason to begin with. This is confirmed when the price has made a fresh, new low.
What Does a Dead Cat Bounce Tell You
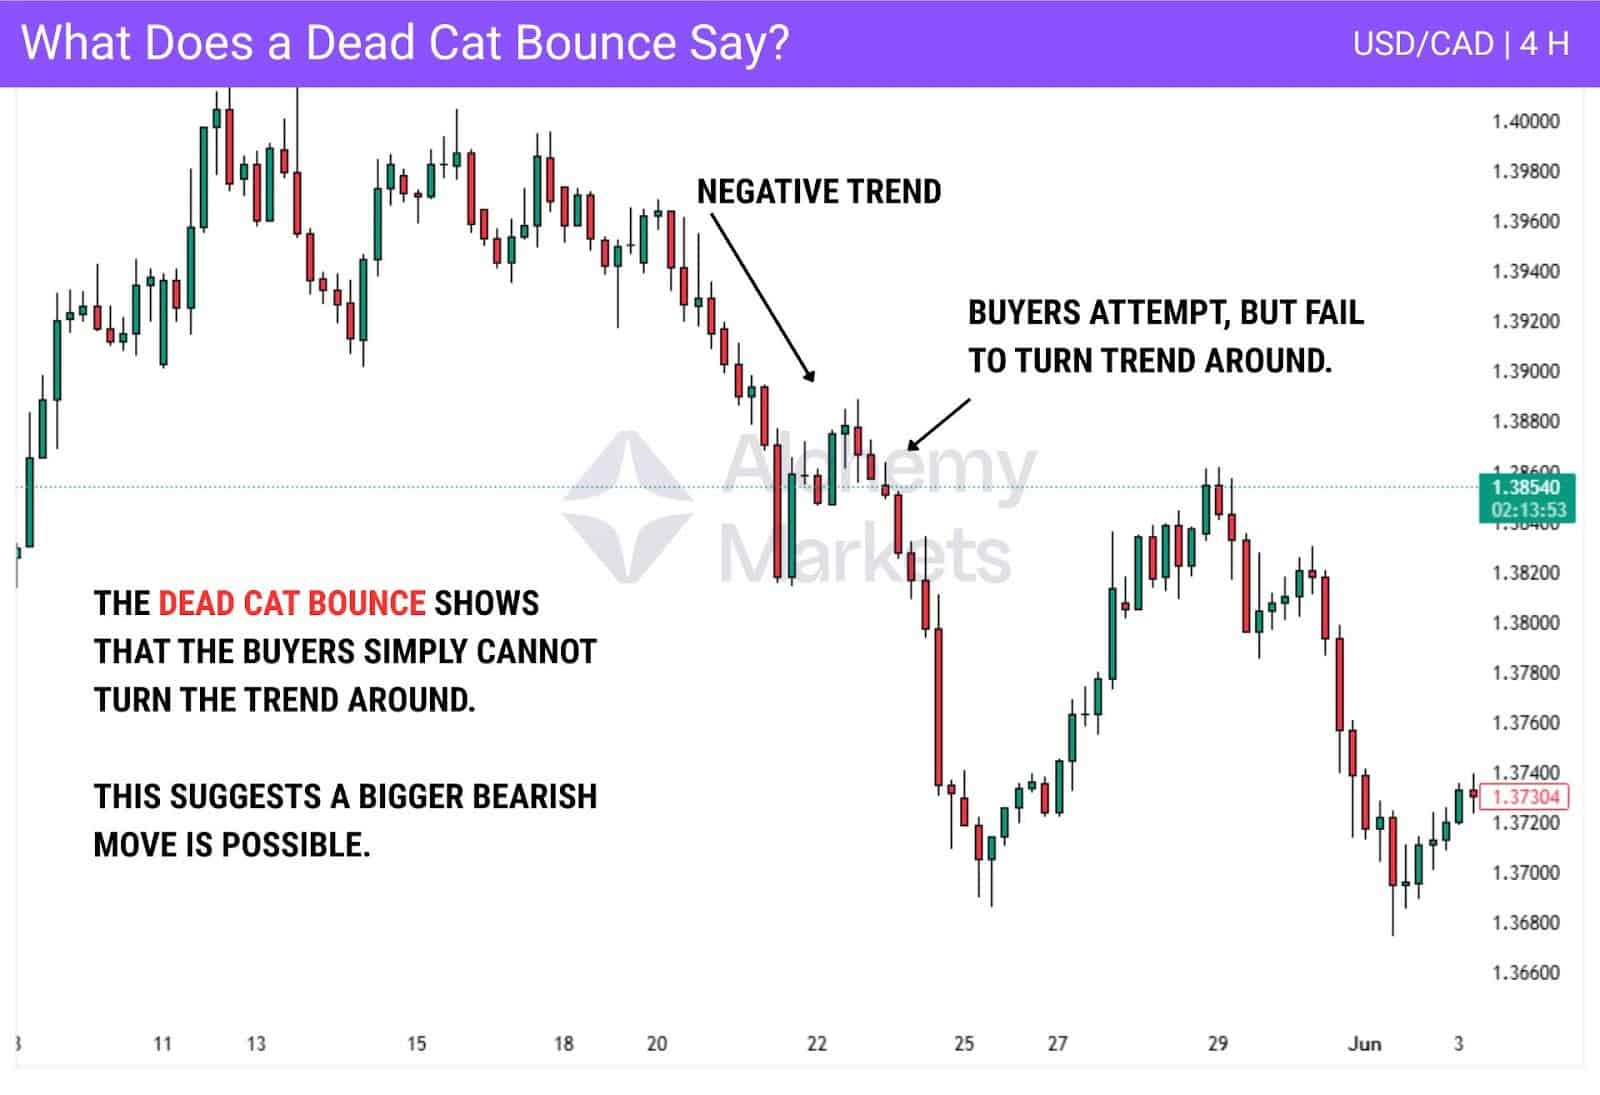
Whilst it is difficult to identify a dead cat bounce while it is occurring, the reality is that when you see a potential “sucker’s rally” occur after a massive sell-off, as the market makes a new low, it shows that the dead cat bounce did in fact occur. This suggests that further selling is coming, as those who went long on the bounce will be in a losing position, while those who sold are gaining more confidence.
Technical analysts typically have a hard time predicting when it is a dead cat bounce, or a move higher becomes a rally. The price movement looks very similar, at least until the price continues to fall.
A dead cat bounce can also take shape as part of a bearish continuation pattern. For example, a bear flag forming after a steep decline. In these cases, the bounce is weak by design, serving only as a pause before the next leg lower.
What Causes a Dead Cat Bounce?
There are a multitude of reasons for a dead cat bounce to occur, such as investors getting rid of short positions in a bearish market, other investors believing that the bottom has been put in, or value investors stepping in to find cheap assets. Generally speaking, the dead cat bounce is a simple technical analysis term for something that happens after the fact.
As a general rule, when volatility disappears, a market can start to form a longer-term trend. Until then, it typically will have investors on edge. Analysts have a hard time calling a move a dead cat bounce until there is a decline to a fresh, new low. This is because quite often, a bottoming pattern can be quite messy.
Dead Cat Bounce Example
An example of a dead cat bounce can be seen in the US Oil market. The market had been trading in early 2025 near the $80 level, an area that had been important multiple times in the past.
However, sellers became aggressive, sending the price of oil down to the $66 level by early March. After this, the buyers came in, perhaps to try to pick the bottom, or it could have been some profit-taking by those who went short at higher levels. This had the market rising to the $72 level.
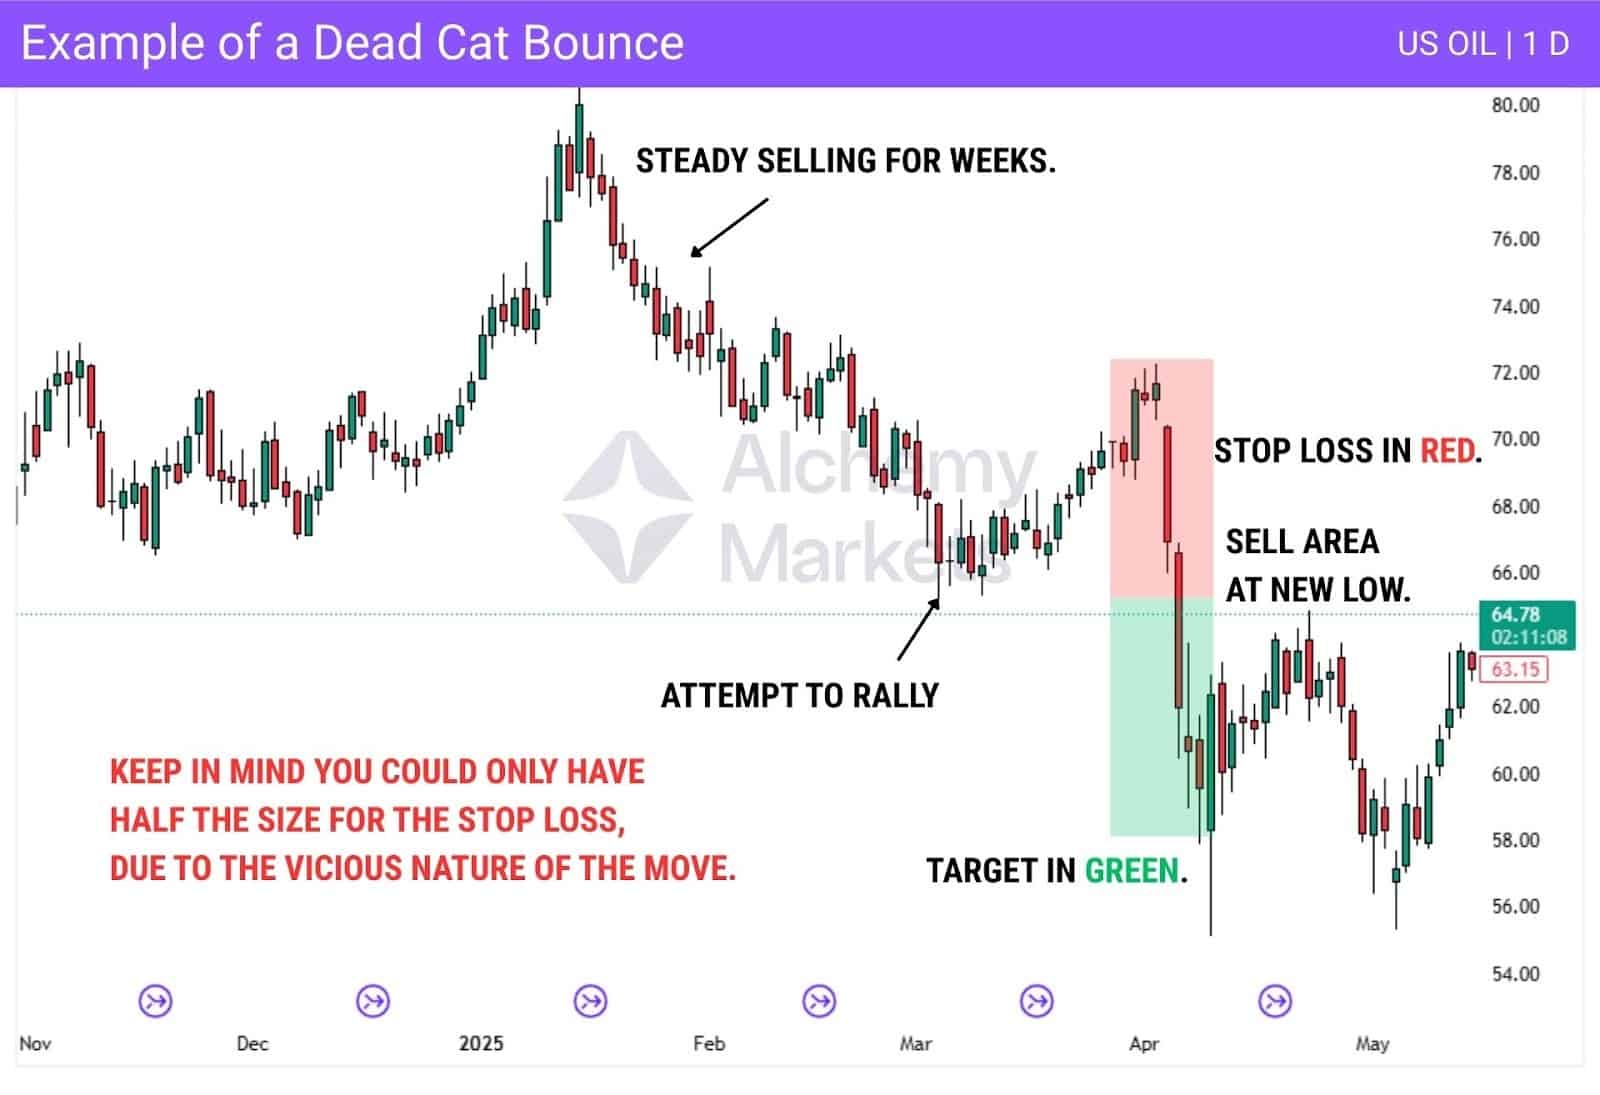
It was at this point that the massive selling pressure kicked into high gear. The break below $70 was rapid, showing increasing bearishness. Once the market broke below $66, this confirmed the dead cat bounce, and traders increased selling pressure.
The stop loss could have been placed in several spots, but the most common would have been at the top of the dead cat bounce, with an entry just below the crucial $66 level. The target should be roughly the same size as the bounce/stop loss at the very minimum.
That being said, the 1:1 risk-to-reward ratio, while possible, isn’t “optimized.” This example can bring a few issues, but this makes the oil setup interesting. This means that while you can have this issue, there are other ways to approach risk.
It is possible that with such a strong red candle, one could simply put a stop loss at roughly 50% of the first red candle, with the thought process that if it were broken above, this is a sign that the trade was in serious trouble.
By doing it this way, you get a 1:2 risk-to-reward ratio, and it also allows you to have a reasonable position size, as the larger stop loss will demand more risk, and therefore a smaller position.
Dead Cat Bounce Trading Strategies
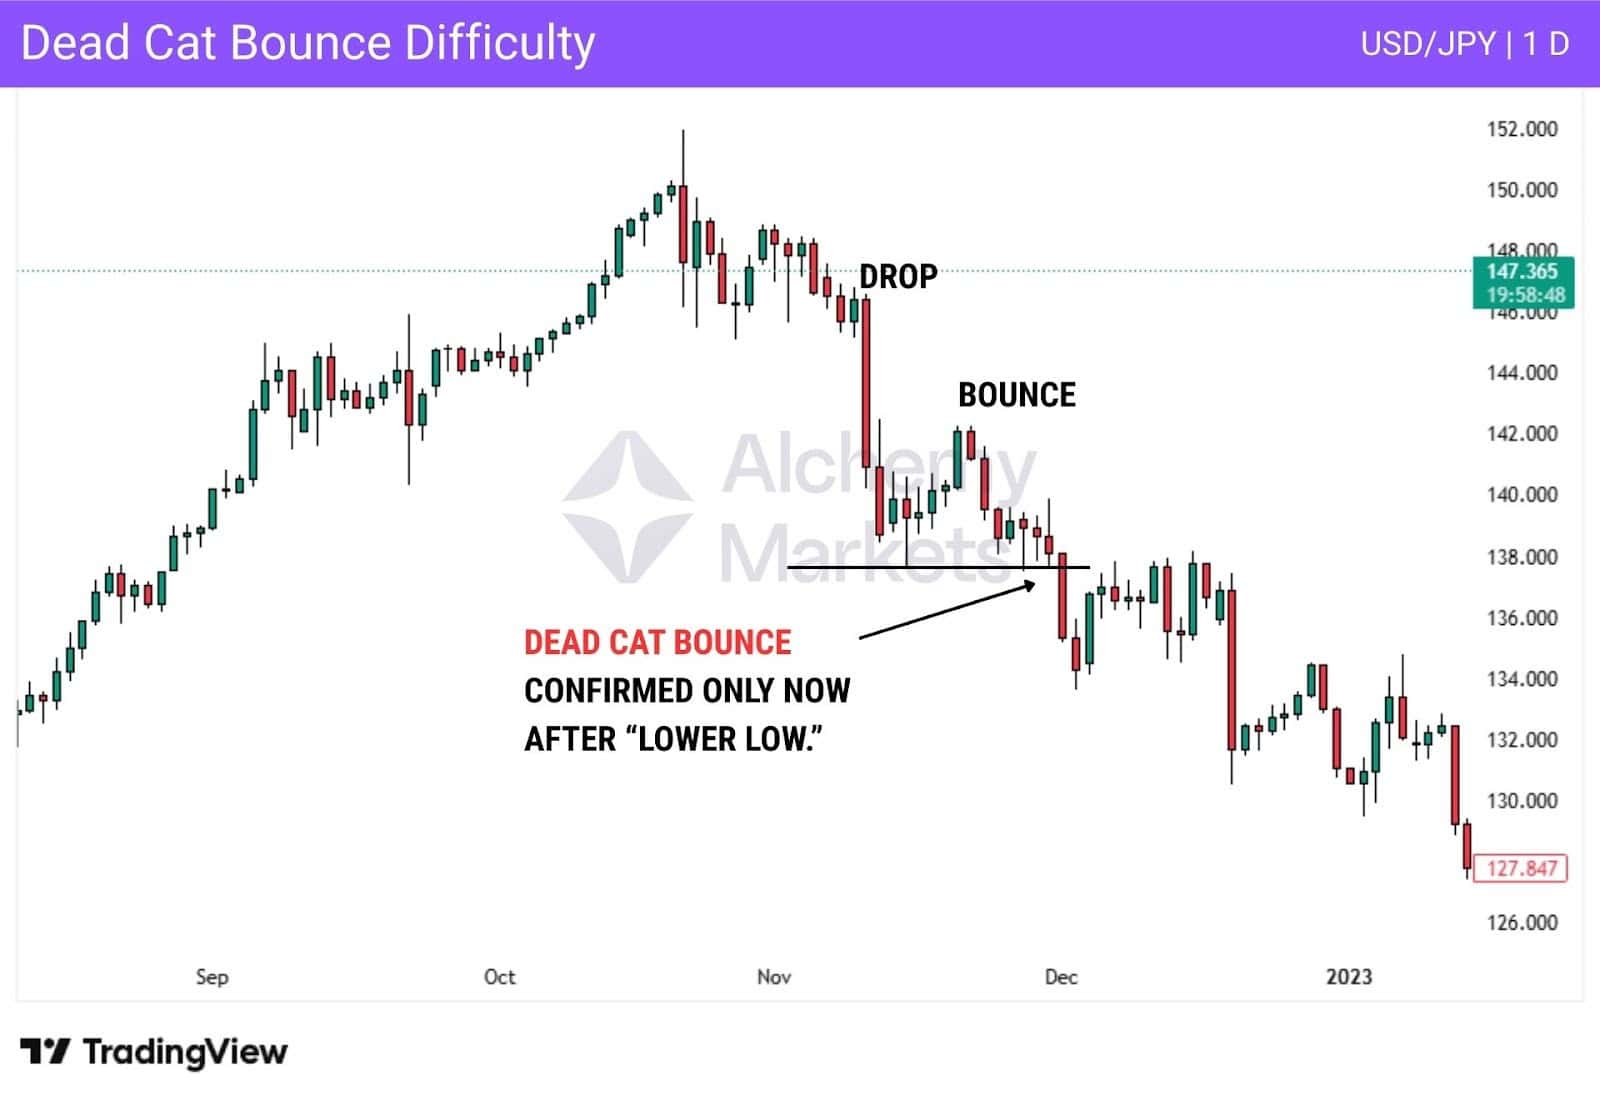
Dead Cat Bounces are best seen as a diagnosis, not a clear trading signal. For it to be called a real DCB, three steps must happen:
- A new low forms — showing the uptrend is broken.
- Price bounces — a small rally after the drop (usually less than 50% of the fall).
- That low breaks again — proving the bounce was only temporary and a downtrend is now in play.
Until the market breaks that bounce low, it isn’t truly a dead cat bounce.
This is what makes DCBs so difficult. Buying into the bounce is like trying to catch a falling knife — it looks tempting, but you’ll usually get cut. Shorting isn’t much better; strong markets can still push higher, form a double top, or fake a reversal before finally breaking down.
So what are we actually trading here? Not the bounce itself, but rather where a weak rally is most likely to stall and flip into a downtrend.
How do we swing the odds in our favour? We keep it simple:
- 50% rule: Most DCBs don’t push past half the drop. If price stalls there, that’s your first red flag.
- Key levels: Broken support flipping into resistance, or failed retests of the 50 EMA / 200 EMA.
- Fair Value Gaps: Sharp sell-offs leave gaps, and bounces often fade right into them.
When a couple of these line up, that’s when you’re no longer guessing — you’re stacking probabilities that the bounce will fail.
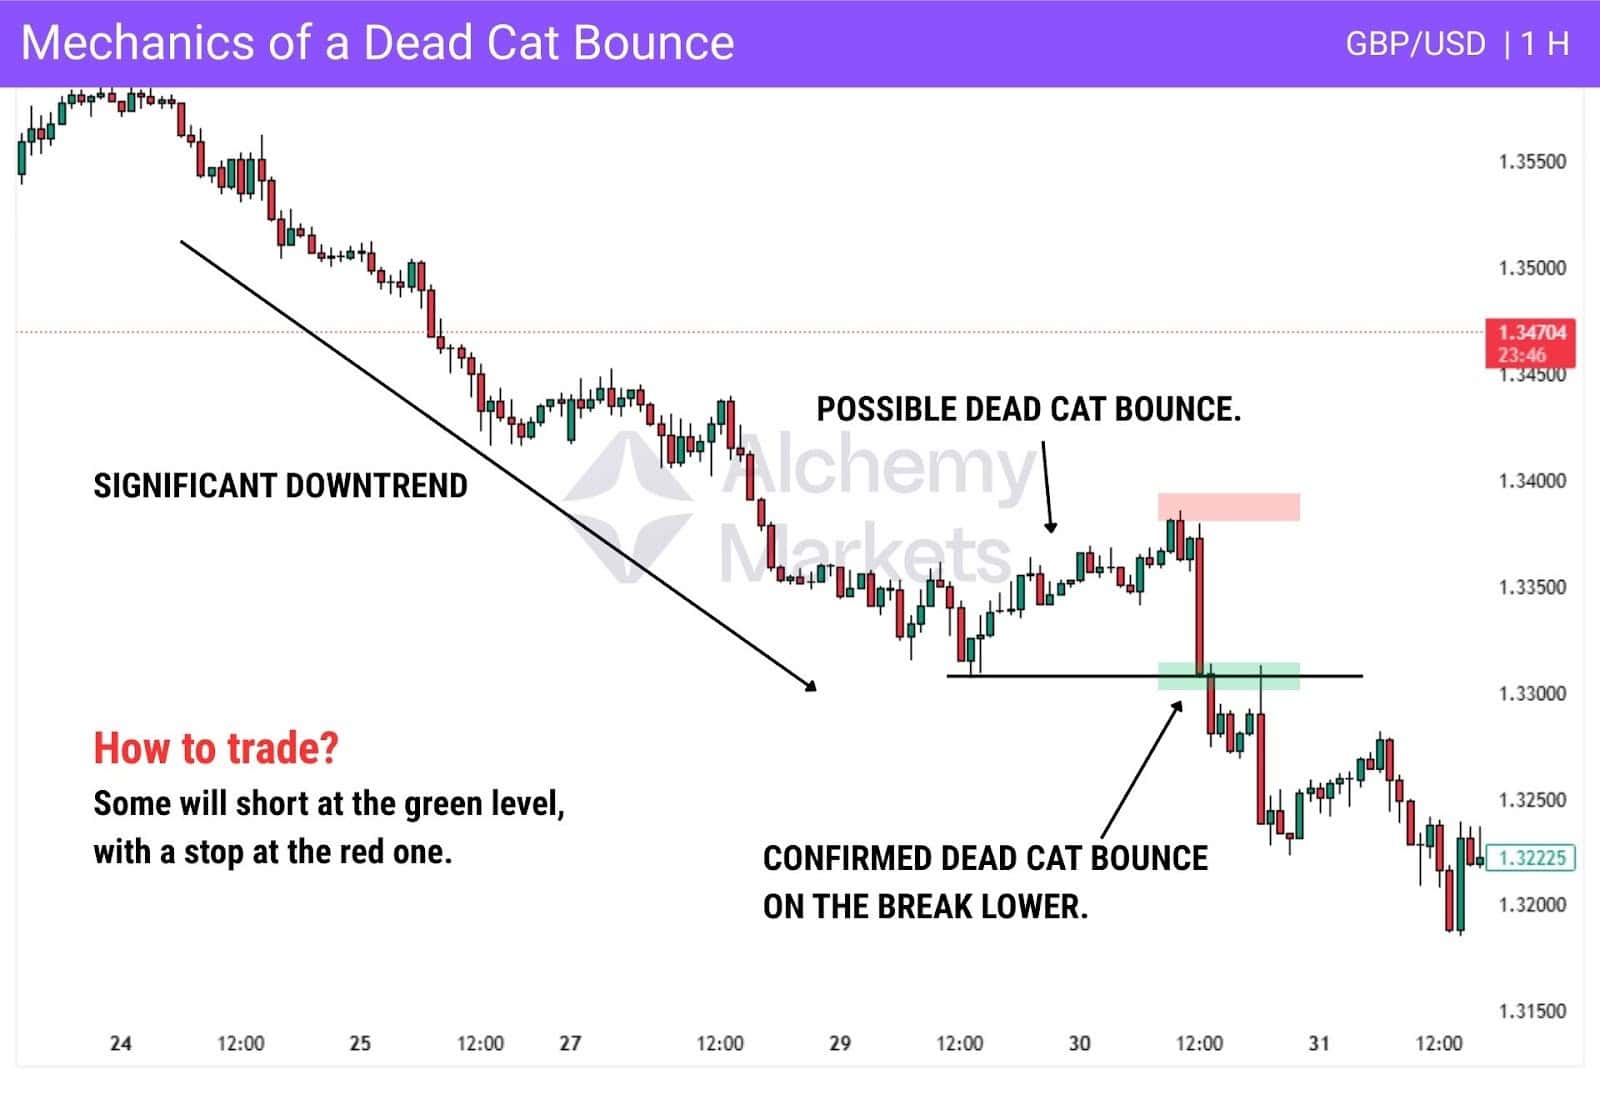
Keeping it Simple: When Support Flips into Resistance
One of the cleanest ways to trade a DCB is just good old market structure trading. If an asset breaks a previous low (support), that’s your first sign of weakness.
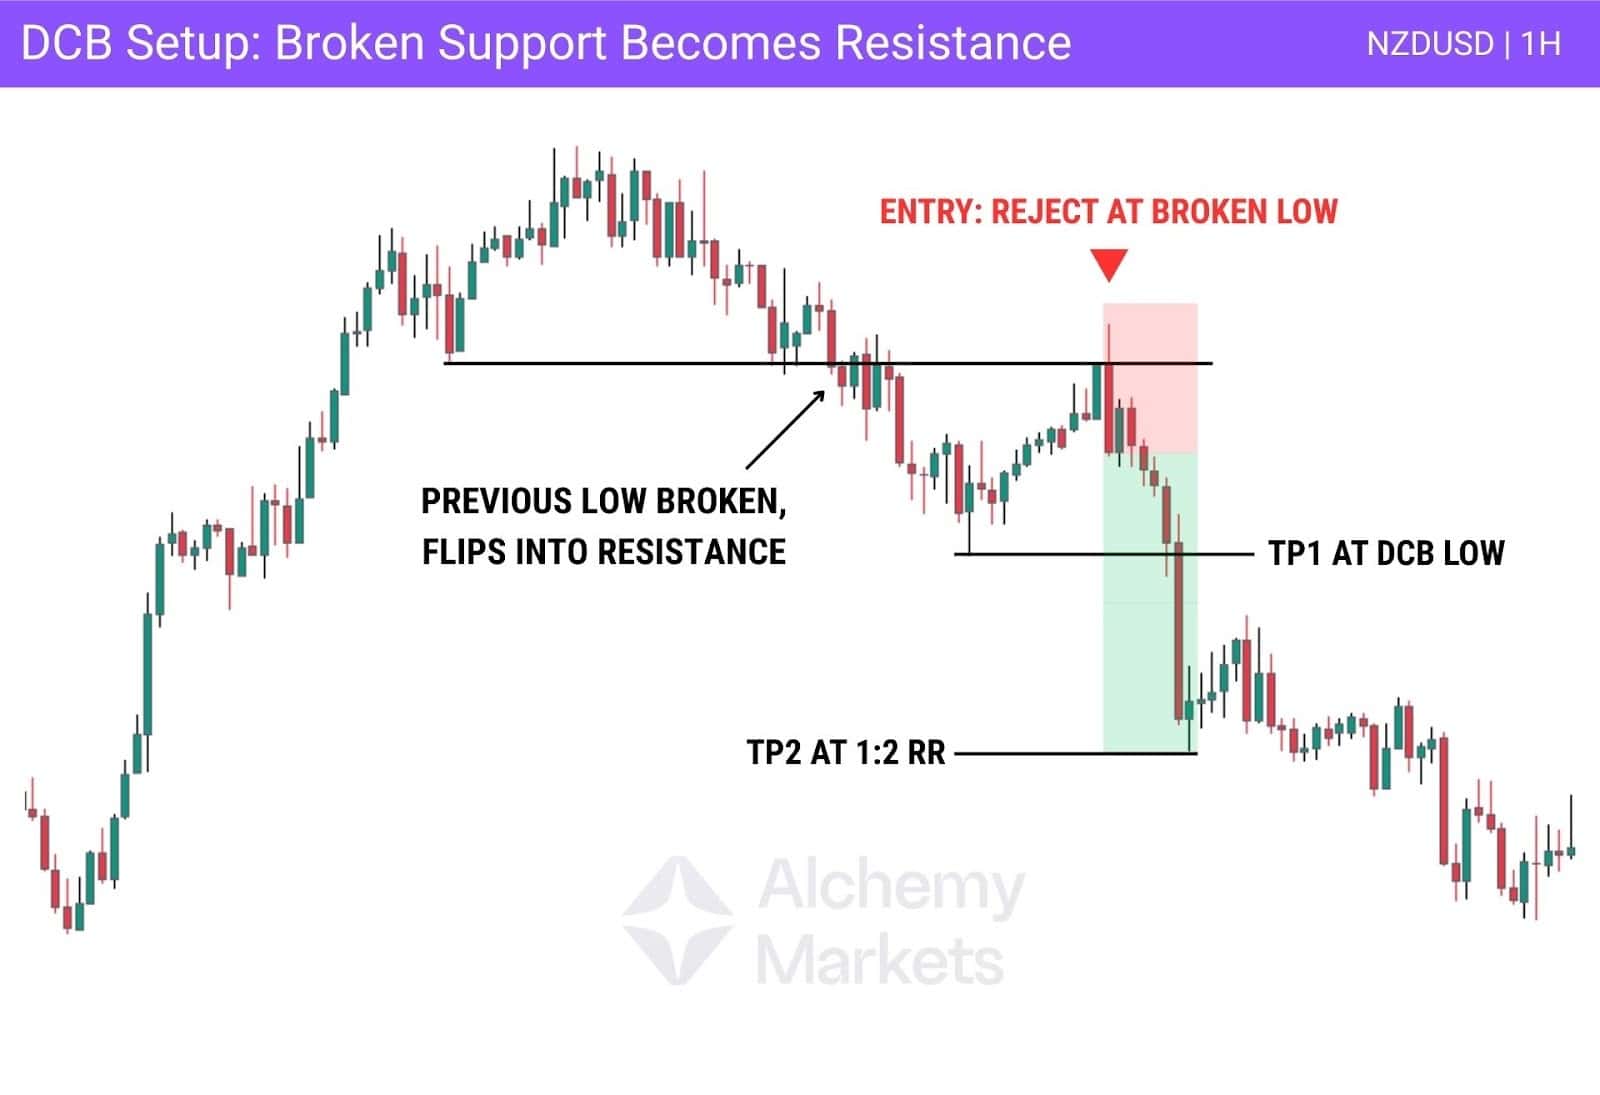
A break of a support level flips it into a resistance level — so if price revisits this level and can’t push higher, it implies a trend shift.
- Wait for a clear rejection in the form of a strong bearish candlestick, or bearish candlestick pattern.
- Short it with at least 1:2 risk-to-reward.
- Take some profits early at the DCB pivot low.
What you’re really doing here is trading the possibility of a DCB forming. But don’t forget — the market could just as easily make a double bottom at the previous low, then reverse upwards.
That’s why patience is everything. Wait for the breakdown; don’t try to outsmart it.
| Note: It helps to familiarise yourself with bearish candlestick patterns, since these often confirm reversals at resistance. Patterns like the bearish engulfing, shooting star, or evening star can strengthen the case for a dead cat bounce when they form at key levels. |
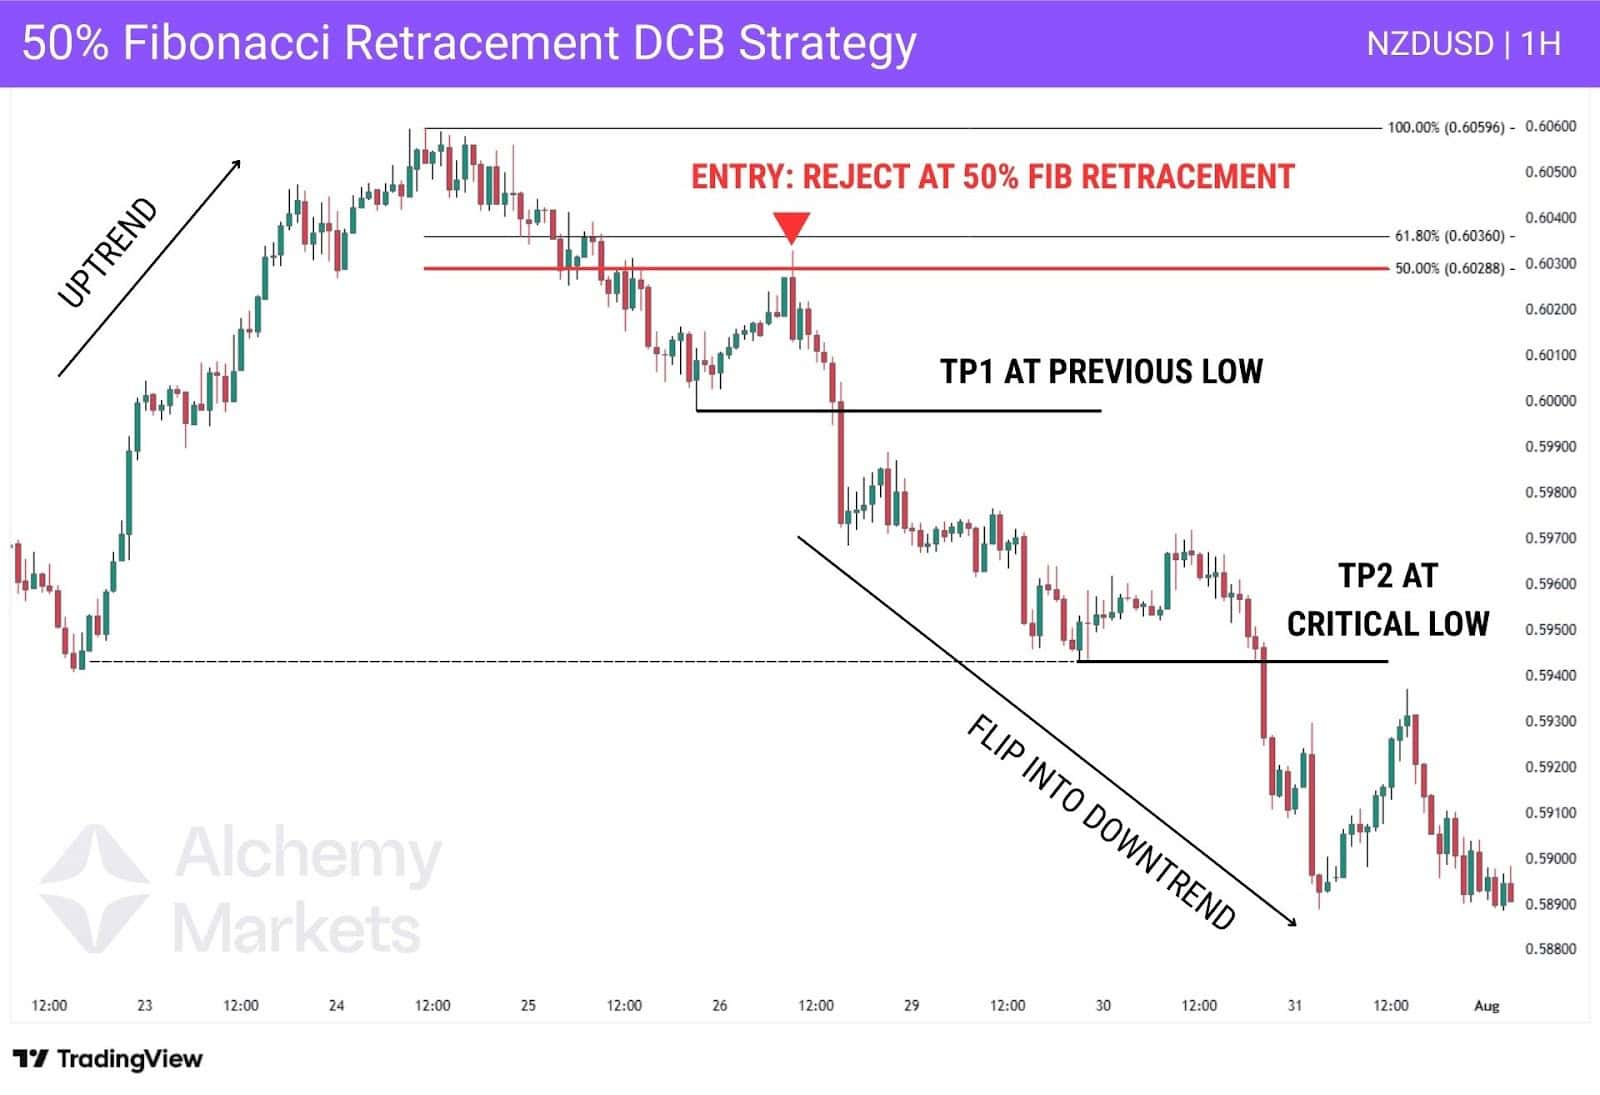
Using the 50% Rule of Thumb with Fibonacci Retracement
Many traders believe DCBs don’t make it past 50% of the sell-off, as it is a ‘weak bounce’.
This has given rise to the 50% rule of thumb, which can be traded using the Fibonacci retracement tool.
- Confirm weakness first (new low or broken trendline).
- Draw a fib from swing high to swing low.
- Watch how price reacts at the 50% retrace.
- If price rejects here, enter short with stops above the high. Aim for the DCB low or deeper.
This is an aggressive play, but it’s powerful with tight risk control. Always take partial profits at the bounce low, because you never know if the market’s about to build a double bottom instead of rolling over.
Exponential Moving Average Strategies for Dead Cat Bounces
If fibs aren’t up your alley, then Exponential Moving Averages (EMAs) are your friend. The 50 EMA and 200 EMA work great together:
- Breaking below the 50 EMA is associated with short-term weakness.
- A bounce into the 200 EMA is often where things stall.
- If price rejects the 50 EMA again with a bearish candle pattern, it could be a clean short.
Now, there are two plays you can make with the EMAs — aggressive traders fade the first rejection; conservative ones wait for an EMA cross and a new low.
Let’s start with the aggressive approach, which is about predicting a dead cat bounce, rather than first waiting for a confirmation.
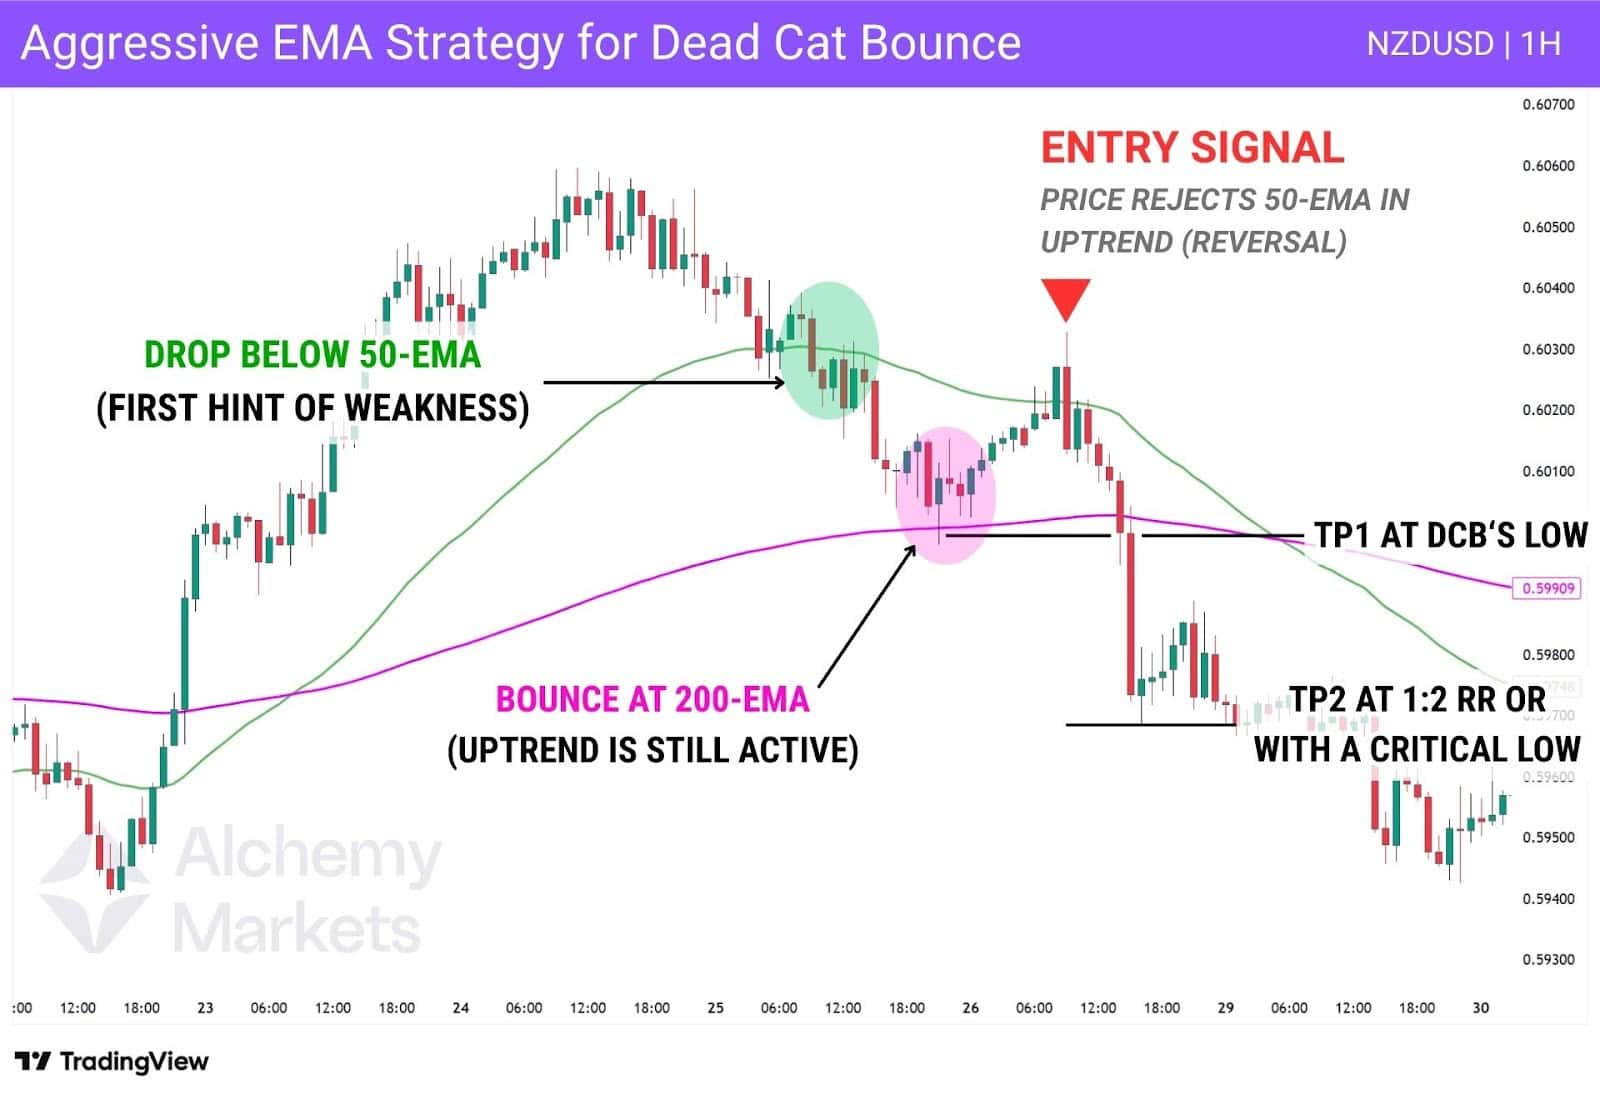
This setup aims to catch a trend shift early and ride the drop of a dead cat bounce (DCB). The reward can be big, but the risk of false signals is higher.
Here’s the play:
- Confirm the trend: 50 EMA above 200 EMA = uptrend in place.
- Spot weakness: Price slips below the 50 EMA.
- Check the 200 EMA: If price breaks this area, it’s a massive hint for a downtrend. But if it doesn’t break and bounces instead, it signals the uptrend isn’t broken yet.
- Look for rejection at the 50 EMA: If the candlestick’s closing price finishes below the EMA, it signals resistance is holding.
- Take the short: If a strong bearish candlestick pattern closes below the 50 EMA, enter at the next candle’s opening price. Place stops above the rejection high, target the DCB low first, then extend to 1:2 or deeper supports.
It’s important to at least take profit at the DCB low, since price could easily bounce there and form a double bottom instead.
Remember, this approach is built on the idea that a dead cat bounce may unfold, not on confirmed trend reversal.
Now let’s look at the conservative approach.
Unlike the aggressive setup, this method waits for the death cross (when the 50 EMA drops below the 200 EMA) as confirmation the macro trend has turned bearish.
It confirms the broader trend has turned bearish, removing much of the guesswork.
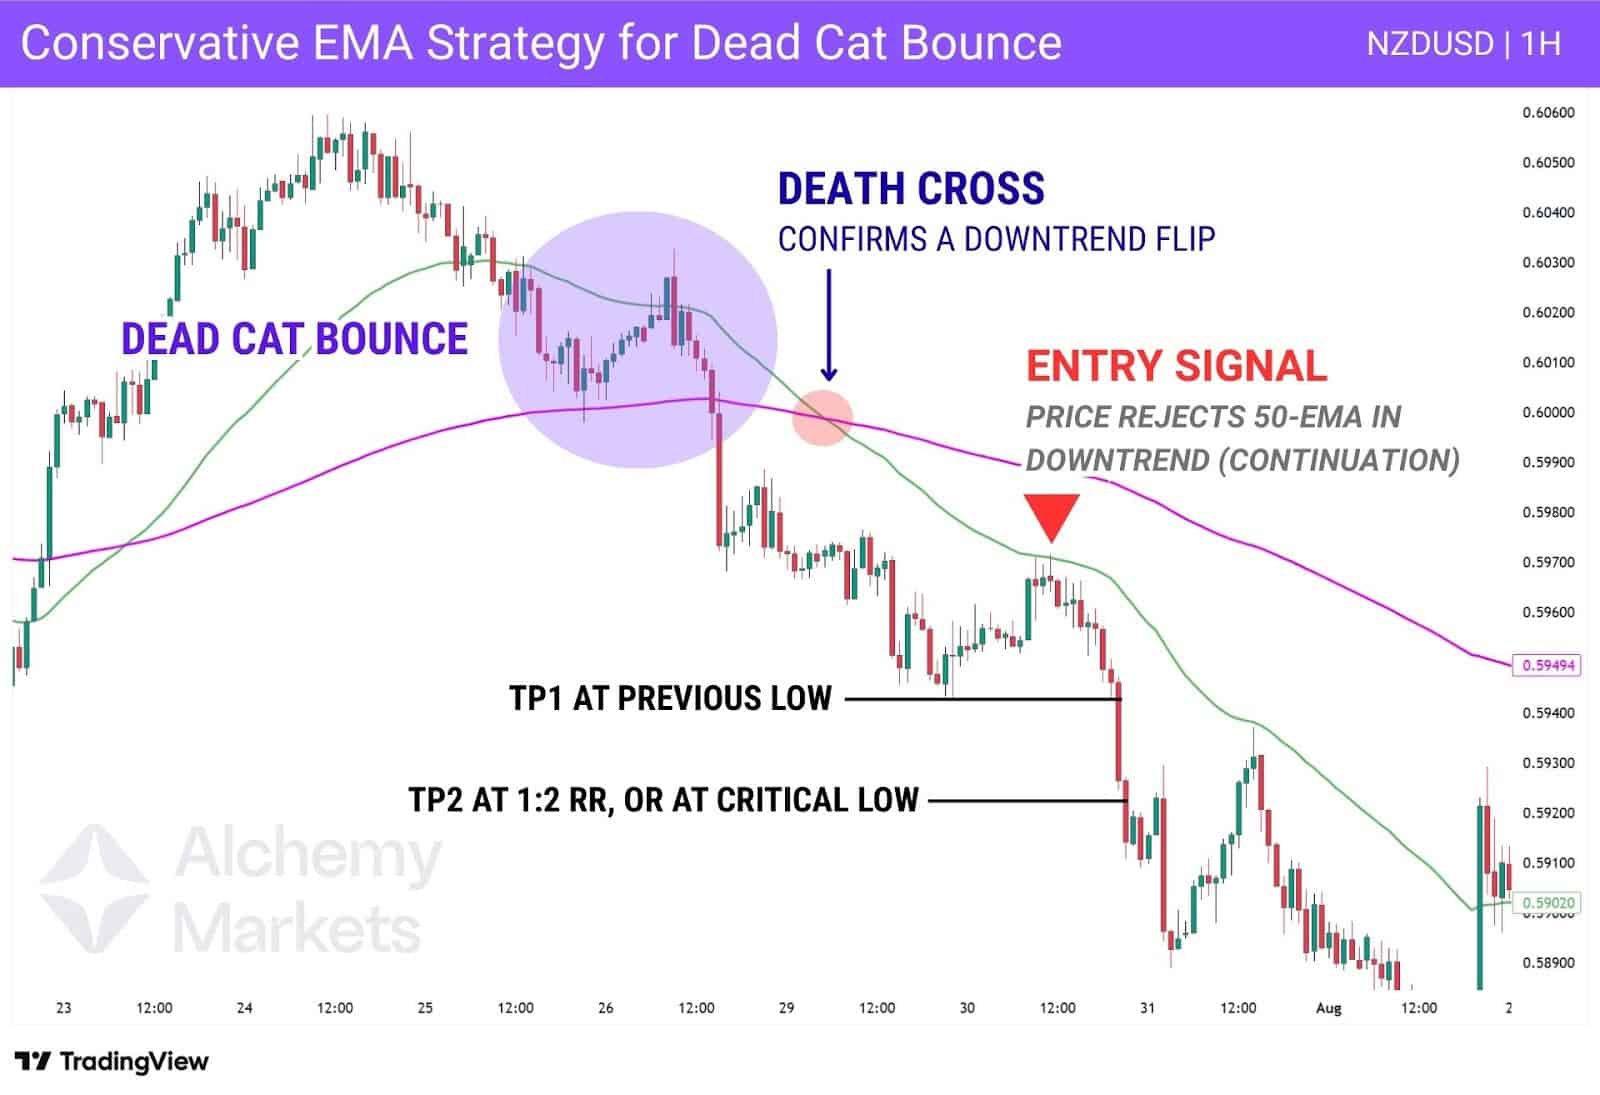
Here’s how it works:
- Wait for the break: Price falls below the 200 EMA.
- Spot the Death Cross: The 50 EMA crosses under the 200 EMA, confirming a bearish trend shift.
- Watch the retest: Price rallies back into the 50 EMA from below.
- Look for rejection: When price taps into the 50 EMA, but creates a closing price below, it signals that sellers are still in control.
- Enter the short: Take the trade at the next candle’s opening price. Place stops above the highs or 50 EMA, with targets starting at the DCB low and extending to 1:2 or deeper supports.
This style fits traders who value confirmation, sacrificing trade frequencies in exchange for a setup that carries greater conviction.
Using Fair Value Gaps to Find Entries for DCBs
Last but not least, let’s talk about the new kids on the block: Smart Money Concepts.
This is a new trading approach that’s been growing in popularity, particularly with the concept of Fair Value Gaps (FVGs).
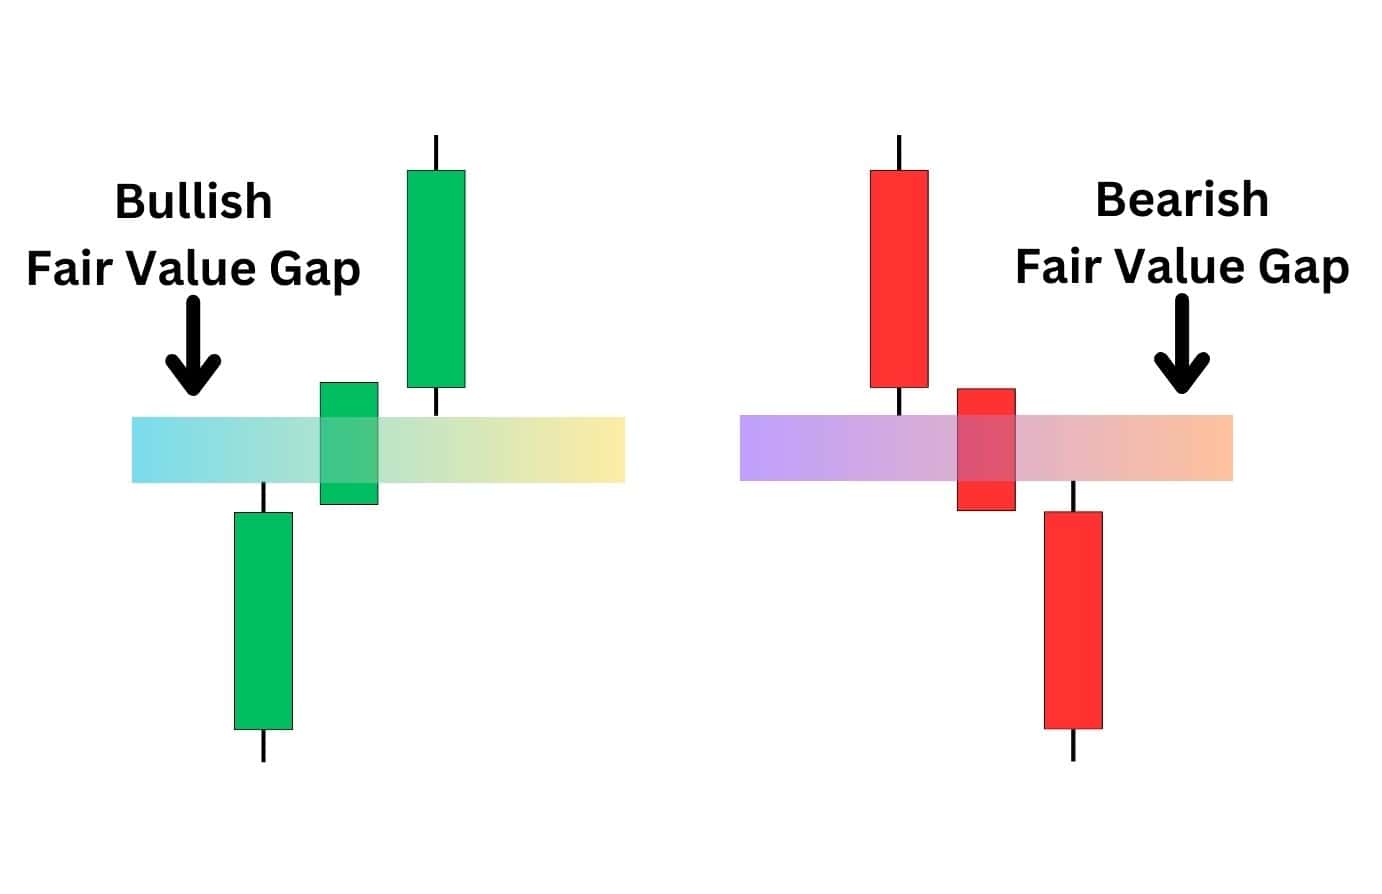
A Fair Value Gap (FVG) is a three-candlestick pattern that shows strong momentum in one direction. When price moves quickly, it leaves behind an imbalance – a zone that often pulls price back in before continuing the move.
Put simply, FVGs signal intent. They show where price wants to go, and often act like a magnet that draws price back before pushing further.
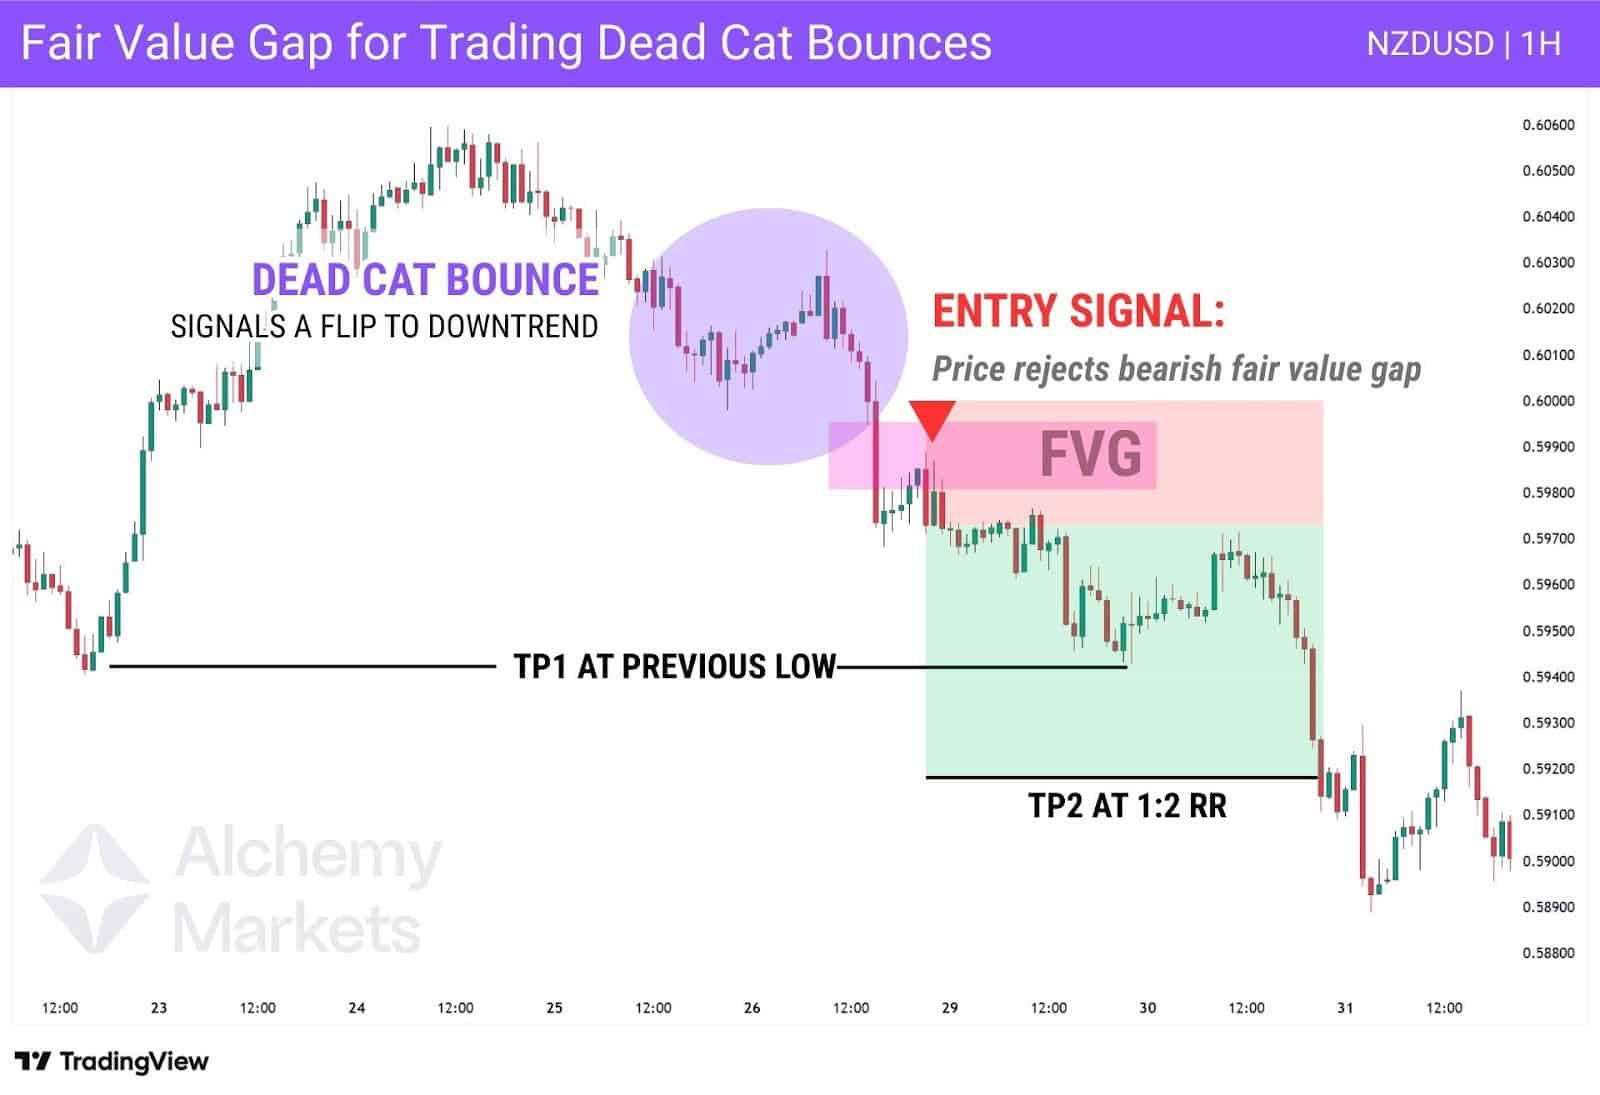
When trading a DCB, look for an FVG to form during the initial break of the DCB low. That’s a sign traders are committed to repricing lower.
On a retest of that FVG zone, a short can be taken with stops above the gap and targets set at deeper support or a 1:2 risk-to-reward.
| Note: FVGs can be powerful, but they are not foolproof. Combining them with other tools, like EMA trends or key support and resistance, gives the setup more weight. |
Key Notes: Confluence and Risk Control is Key
No matter how you slice it, trading a Dead Cat Bounce can be tricky. Again, it’s a diagnosis, not a signal.
When you initially execute a “DCB trade”, you’re effectively trading against the macro-trend; but with proper trend-based tools, and an understanding of market structure, aggressive short trades can turn into big wins that capture the beginning of a trend shift.
What really helps is combining tools instead of relying on just one.
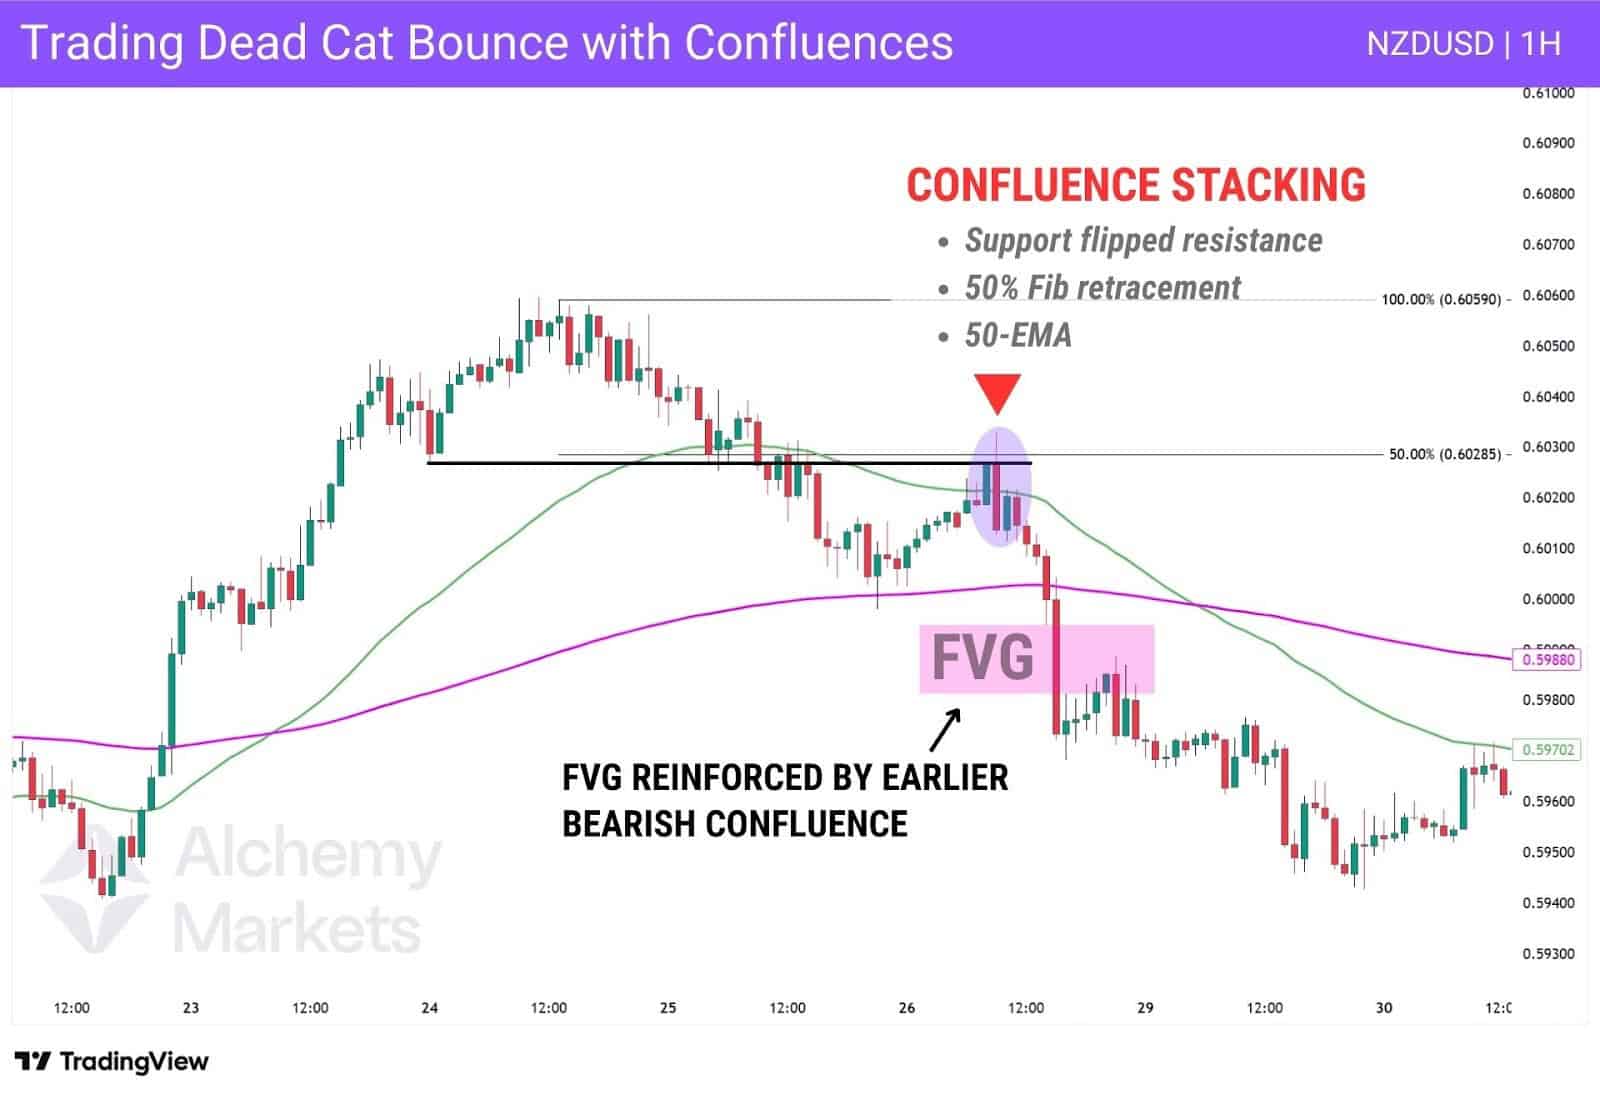
For example, if a bounce retraces to the 50% Fib level and lines up with the 50 EMA and a resistance level, that’s far stronger than seeing any of those signals on their own.
Confluence like this doesn’t guarantee the move, but it stacks the odds in your favour – and in a high-volatility setup like a DCB, that edge makes all the difference.
Average Directional Index and Dead Cat Bounce
The ADX is a useful way to separate a weak bounce from a true reversal. On its own it measures momentum, not direction, which makes it ideal for confirming the trend strength behind a move.
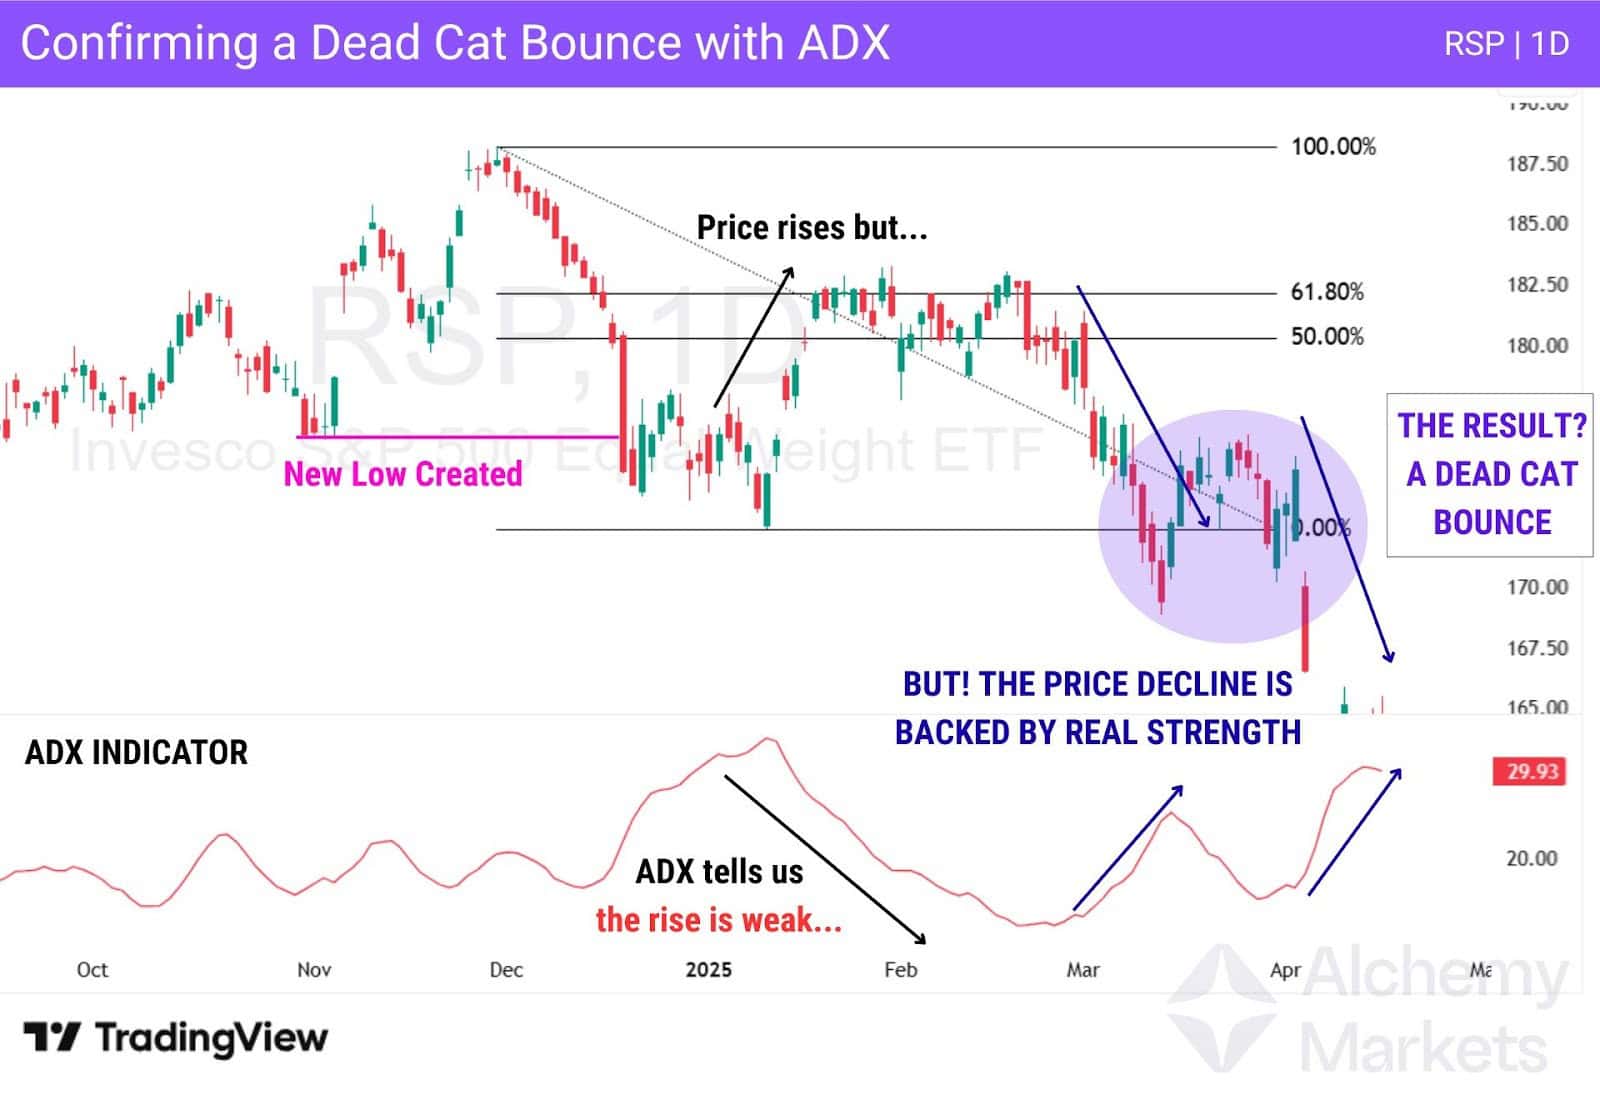
After a new low is created in an uptrend – the first requirement of a dead cat bounce – ADX helps reveal whether the rally that follows is genuine or just a retracement. In the chart above, price climbed while momentum dropped, signalling weakness.
Once price tapped the 50–61.8% fib zone and began to roll over, the setup pointed clearly toward a potential DCB. As the decline gathered pace, ADX rose, confirming that sellers were driving momentum. This shift from weak buying to strong selling pressure is a hallmark of a dead cat bounce.
In short, ADX helps traders cut through the noise and see who truly holds control – buyers or sellers.
Advantages of Trading on the Dead Cat Bounce
There are a few advantages of trading the dead cat bounce, but it is a very difficult pattern to make sense of sometimes. After all, the recovery phase could end up being a trend change, or it can be a strong opportunity to make money if the price continues to decline. Typically, the reaction in a dead cat bounce is rapid, meaning that all factors will have to be addressed quickly.
- “Weak-handed” traders can get shaken out: The majority of traders that are looking to buy the bounce are inexperienced, or just plain emotional traders. They are typcially reading to sell at the first signs of trouble for the bulls. You are trading with the trend in shorting.
- Trends tend to last: The question is often whether or not a great enough height has been achieved to entice sellers again, or if the hit to the price of the security is enough to warrant some long-term investments by speculators. In general, a fresh low is a great signal to sell again.
- Rallies can be short-lived: The rally can be rapid, only to see the price decline again as investors remain nervous and pay attention to other factors, perhaps in the overall economy or other outside forces. This allows for those patient enough to take advantage of this relief rally to start shorting again.
Disadvantages of Trading on the Dead Cat Bounce
- Difficult to Identify: A dead cat bounce is can be very hard to identify. In fact, most technical analysts cannot tell you it happened until the price has broken to a new low. Investing is difficult enough, so taking low-probability trades with a big position makes little sense, making buying them very dangerous.
- You must be nimble: This is not to give you the idea that a short-loved rally cannot be taken advantage of, just that you will need to be very nimble, and the risk-to-reward may not be there. The idea is that if the rally were to continue to reach a great enough height, it would no longer be a dead cat bounce, and it would be a new trend.
- Volatility can be immense: Volatility is also a major problem with these patterns. Quite often, the market is in a state of panic, and this can lead to massive swings in the price of an asset, and spreads can widen.. Your stop loss can be taken out, and as a result, discipline is crucial in this environment.
Dead Cat Bounce vs Market Rally
Distinguishing between a dead cat bounce and a market rally can only truly be done after the fact. After all, by its very definition, a dead cat bounce is a bounce in an otherwise sharp move to the downside, followed by further selling pressure.
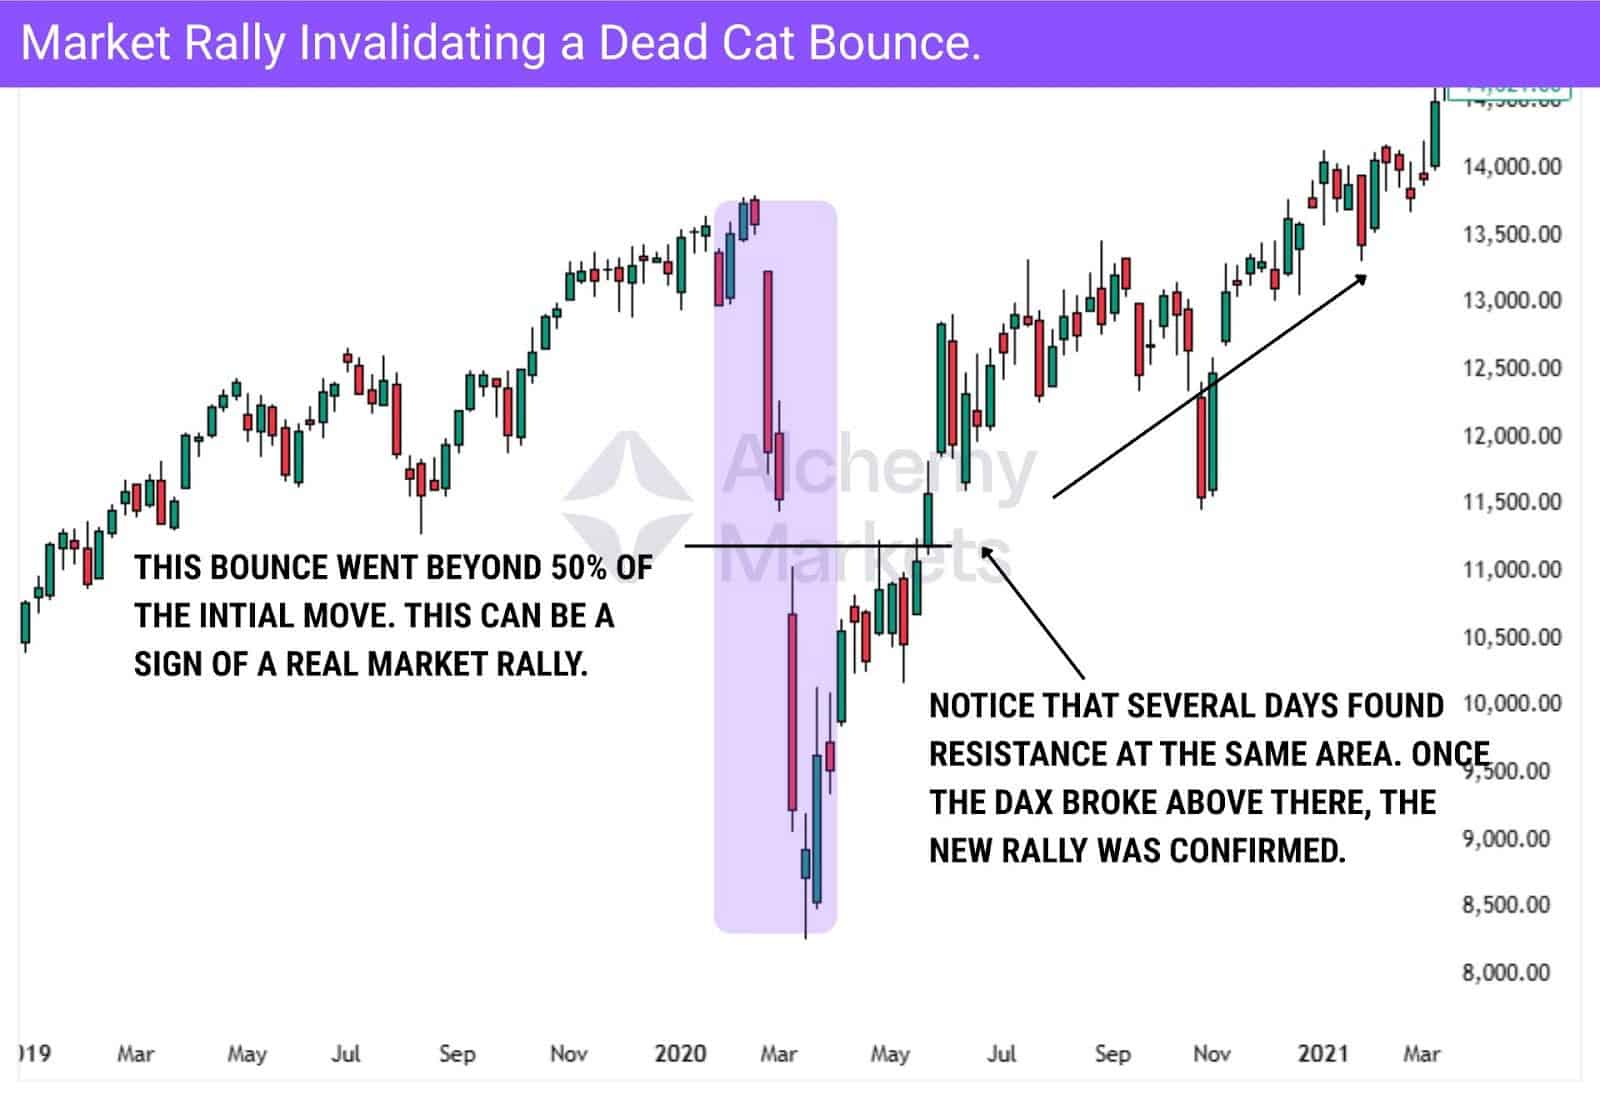
You don’t really know that it is a dead cat bounce until you have that further selling pressure, making it a bit difficult in the moment to make the distinction as to whether or not price is turning around, or price is starting to fall apart.
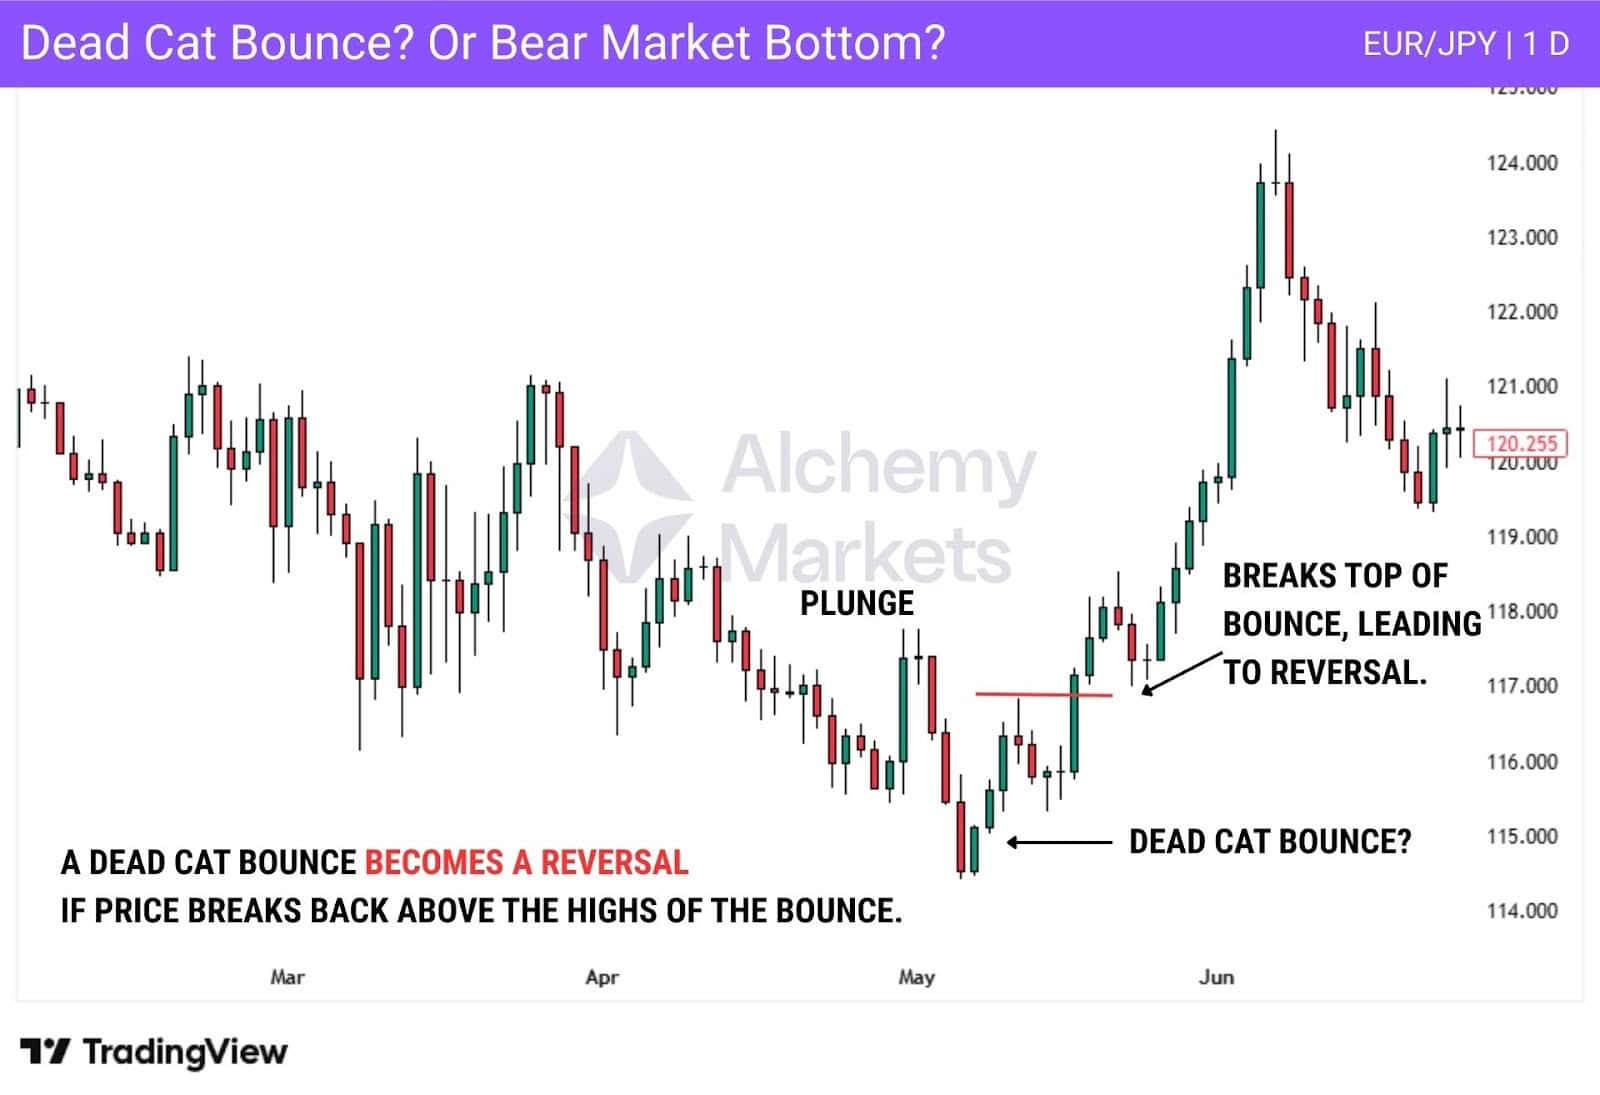
Because of this, it’s probably best to have some idea of where a bounce becomes something more important. Typically speaking, this might be a situation where the market bounces slightly, but fails to make a fresh, new low when it starts the selloff again.
At the point where it takes out the top of the initial bounce, then it becomes a market rally. If it makes a fresh, new low, then it becomes known as a dead cat bounce. Until then, you have volatility that has yet to prove itself one way or the other.
Part of the challenge in determining what you are seeing is having the patience to wait for confirmation. This is a common issue for investors. Even a dead cat bounce can fake a trader out, so the confirmation of continued bearish pressure is essential.
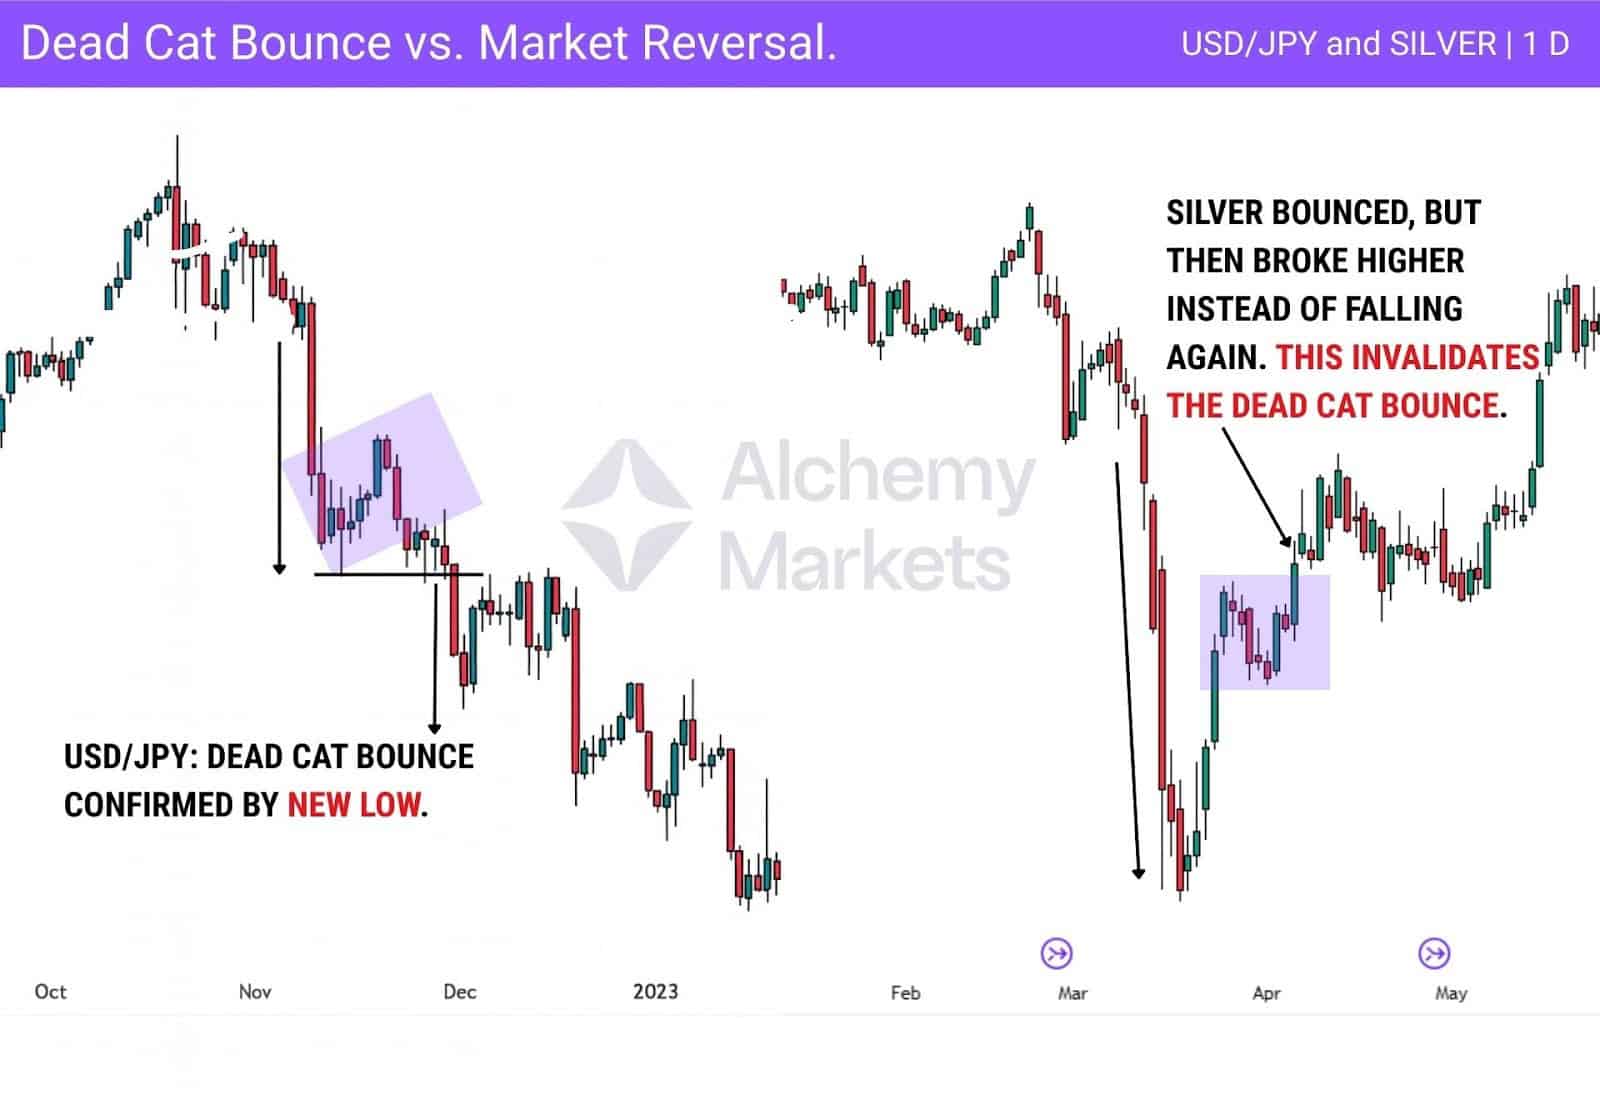
Dead Cat Bounce vs Market Reversal
A dead cat bounce is temporary, whilst a market reversal is something that lasts for quite some time. While you can make the same argument about the difference between the dead cat bounce versus market rally, the difference is that the market reversal was more permanent. The market can rally for several days and then fall again.
A market reversal is something that ends up being more of a swing trade, meaning the traders are willing to hang onto an investment. It is very difficult to discern which one of these possibilities is happening until after the fact. Suffice to say, “hindsight is 20/20” when it comes to after-the-fact technical analysis.
Keep in mind that Wall Street is full of tales of people losing their accounts trying to “front-run” a move. Recovery of a brutal sell-off is always a messy affair, no matter the outcome.
Dead Cat Bounce vs Buy Low Sell High
Most investors will be familiar with the old saying “Buy low, sell high.” However, this isn’t as cut and dry as many would believe. The idea is sound of course, but timing a short-term bounce like that is a difficult task. When you hear this phrase, it typically means over the long term, and is negated as soon as the market falls to fresh, new lows. The biggest trick is to judge the first potential pullback, as it could just be a small pullback or weakness, kicking off the dead cat bounce.
As a general rule, it makes sense to let the market pull back, create a “higher low”, and a “higher high” to eliminate the dead cat bounce idea.
Ultimately, there will be trades and investments that don’t work in your favour. This is normal. However, there are a few things you can do to mitigate some of the dangers of being caught buying a dead cat bounce.
One such strategy is to enter with a smaller-than-usual position. This allows any “fake outs” to be minimal losses. If price fails to rally, you can take a small loss, instead of piling into the market with larger trade sizes and therefore, putting your account at greater risk.
If the rally continues, there should be more opportunities later. This is especially true in the stock market, as many participants tend to be long-term investors, although the same can be said about many other markets.
Dead Cat Bounce vs Bear Market Bottom
One of the biggest difficulties in distinguishing the difference between a classic dead bounce and a significant rally is reading the risk appetite of many investors. Furthermore, the situation for a particular stock or asset may or may not warrant a short position.
When a security bounces after significant market pressure, it can be one of the most rewarding investments if momentum does, in fact, continue. This is difficult to know ahead of time, but when you get the timing correct, it is a powerful trade.
That being said, a lot of fear will still be in the market, as traders have a memory of the short position being so strong. At the first signs of trouble, it is quite often the case that we continue with the dead cat bounce. However, all trends in a market eventually come to an end, and in the case of a dead cat bounce, it can quite often be a simple over expenditure of momentum.
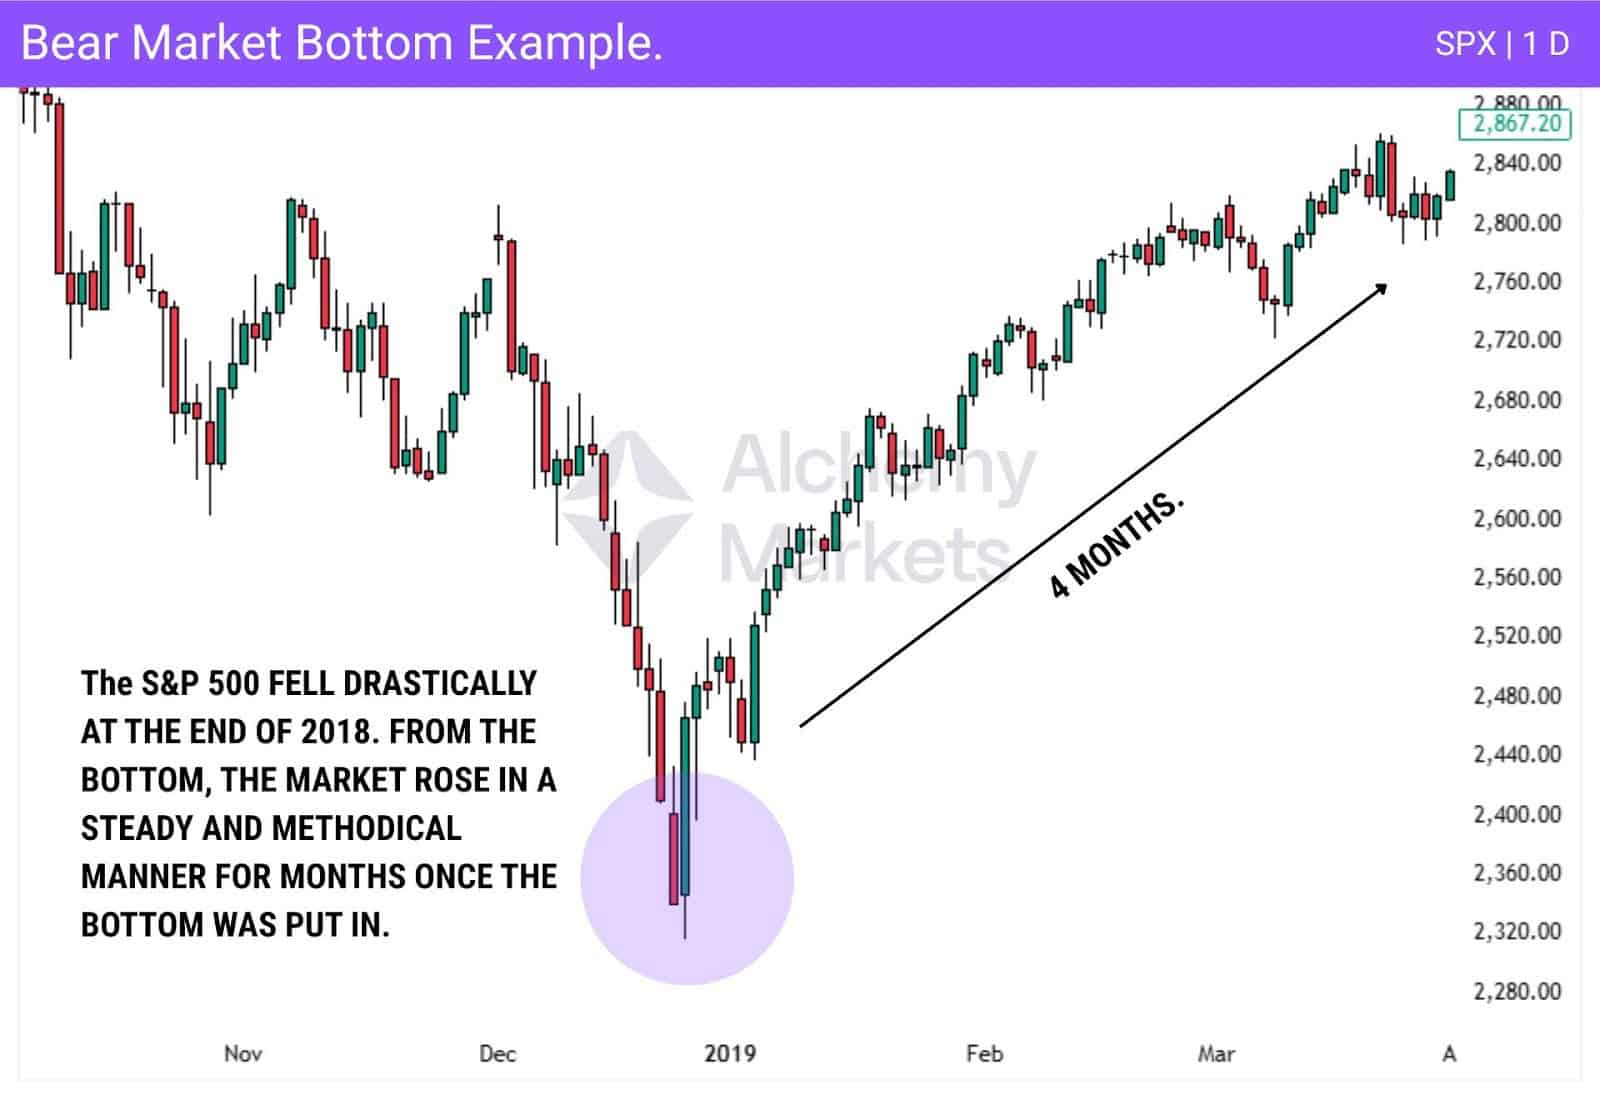
One way to think about it is that history has proven time and time again that the New York Stock Exchange will see its biggest gains within the first few months after hitting the bottom of a significant decline.
The money that can be made from these moves is well known, and this is part of why there are traders willing to jump in and buy once a market has “fallen too far.” This is often folly.
Timing is everything in a classic dead cat bounce, and many technical analysts will avoid them until there is a secondary confirmation via other sources of information, be it news or volatility waning.
Biggest Dead Cat Bounce in Recent History
There are many examples of a dead cat bounce playing out in the financial markets. However, the biggest one, the most recent past, was during the COVID-19 pandemic, as news was starting to reach investors about the disease expanding beyond China.
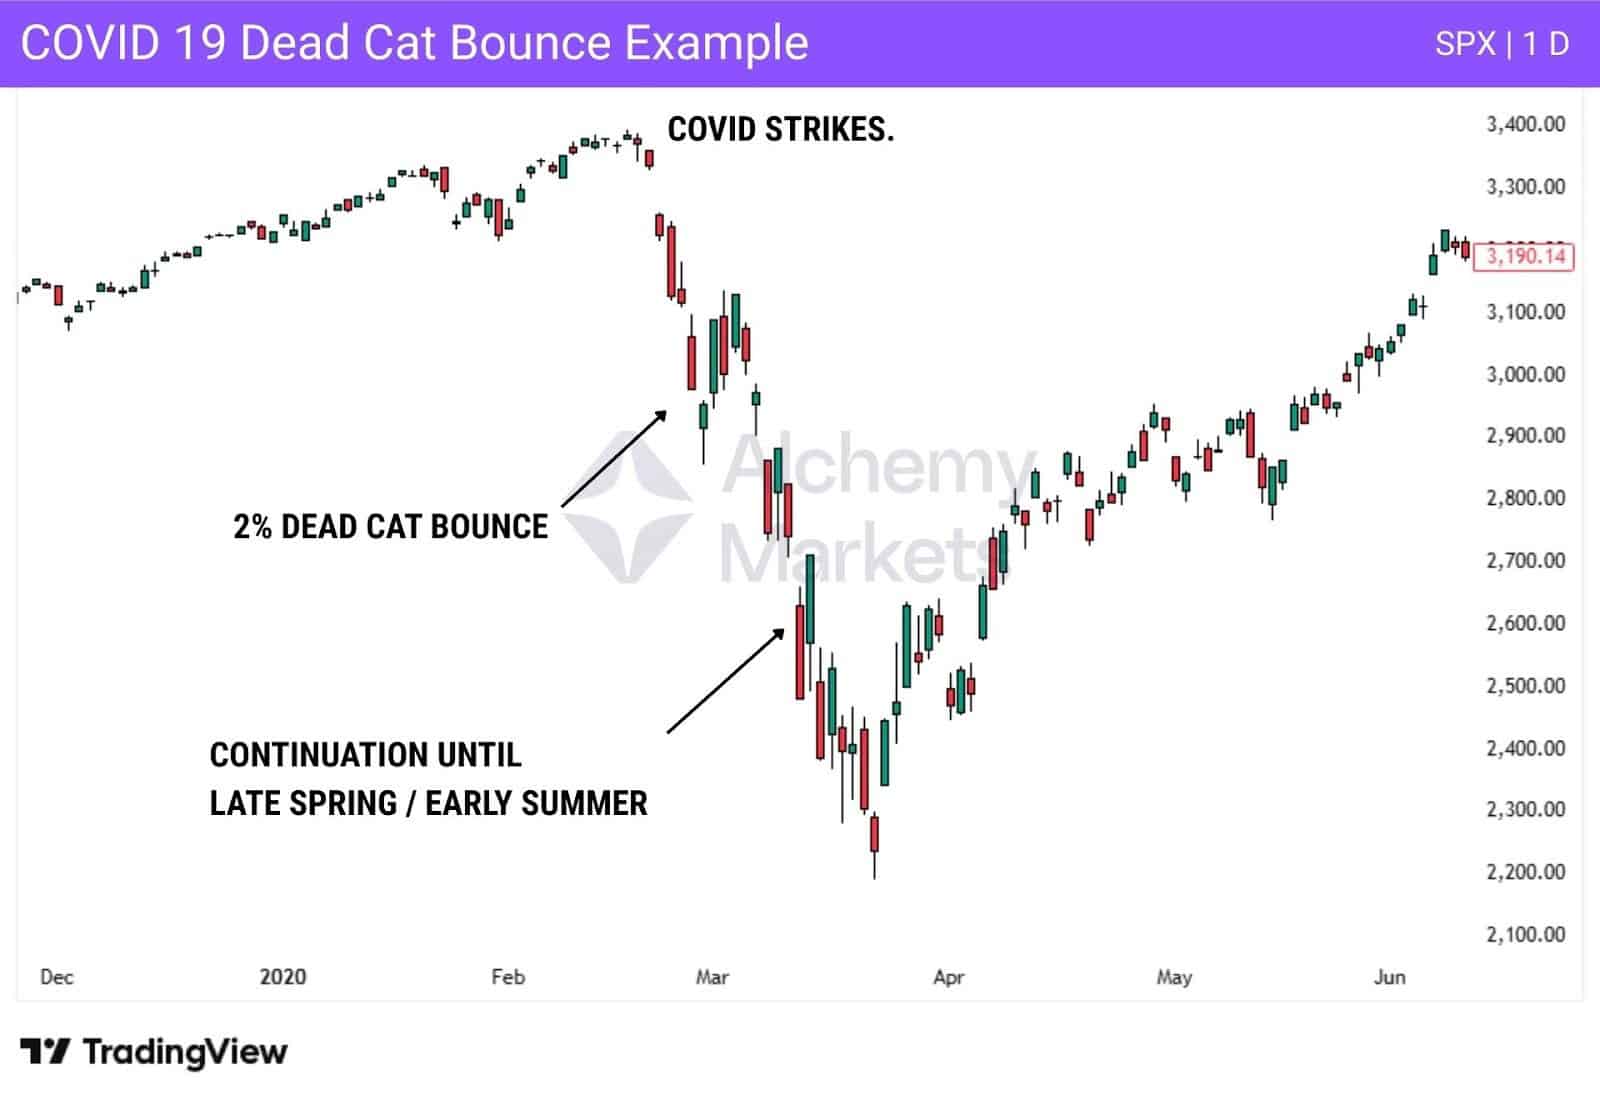
The Associated Press hit the wires with story after story of not only illness, but governments around the world shutting down borders, causing a steep decline in asset prices. This caused chaos for some time.
The overall US stock market lost roughly 12% during a week in February 2020, but gained 2% the following week. Unfortunately for traders, stock prices dipped again, not truly recovering until later in the summer season. Eventually, Wall Street started to buy specific “work from home” assets, sending some stock prices higher. This dragged a lot of the market with it at the time.
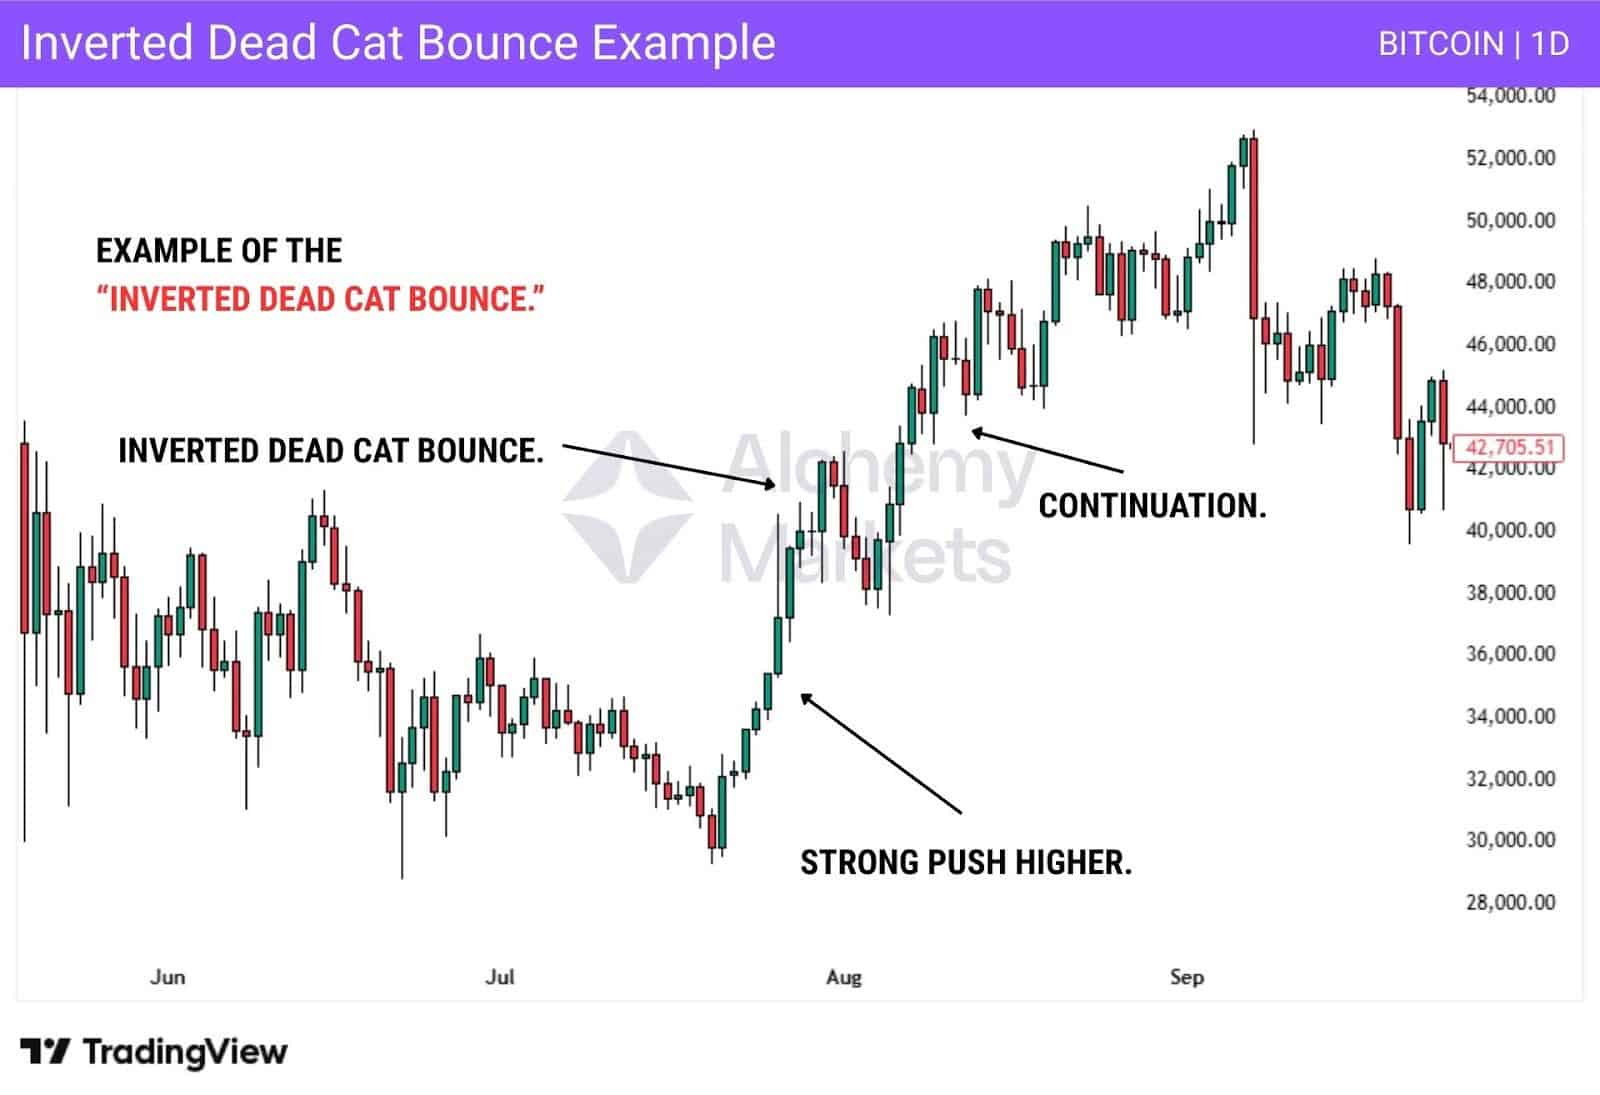
What Is the Opposite of a Dead Cat Bounce?
There is an opposite pattern to a “dead cat bounce”, known as an “inverted dead cat bounce.” That being said, this is a term that is used frequently by participants in the financial market.
An inverted dead cat bounce is simply when the price falls in the middle of a secular bull market. The inverted dead cat bounce can be just as violent as the typical dead cat bounce, just in the opposite direction.
FAQ
Is a dead cat bounce bullish or bearish?
A dead cat bounce is firmly bearish. The short-term rally can look bullish, but once the closing price breaks back below the bounce low, it signals a bearish continuation and usually leads to further downside.
What are the common mistakes to watch out for in identifying a dead cat bounce?
The first thing traders must identify is whether the price starts to decline again. A fresh low is a significant warning and a sign that the investment isn’t working out. And the dead cat bounce is confirmed.
How long does a dead cat bounce last?
As the dead cat bounce can occur on any timeframe, the main characteristic is that it is short-lived. Generally speaking, most practitioners of technical analysis will anticipate the balance lasting anywhere from 3 to 15 candlesticks. In other words, on a daily timeframe, you could be talking 3 to 15 days, but on an hourly timeframe, you would be talking 3 to 15 hours. This is not a will that is written in stone, but rather a suggestion of a basic guideline.
Is a dead cat bounce bad?
A dead cat bounce isn’t necessarily bad. After all, no asset goes in one direction forever. A dead cat bounce is simply a short-lived recovery in the price action of a prolonged decline in an asset. This can be investors closing out their short position and collecting their profit.
Furthermore, this allows those who are a bit nimbler to take advantage of the volatility, and then possibly even take advantage of what could play out as a longer-term continuation pattern.
The key is that the short-lived recovery allows for the market to “reset” in real-time, allowing those traders who find value at a new low point as a potential opportunity.
How can traders confirm a dead cat bounce?
A dead cat bounce is confirmed when the closing price falls below the lowest point of the mini-rally. This confirms the bounce was temporary and sets up a bearish continuation. If price later reclaims that level, it may have been a bear trap instead.
Who first identified the dead cat bounce?
While there is no way to know definitively who coined the term “dead cat bounce”, many believe that Raymond DeVoe Junior was the first person to coin it. He was a Wall Street analyst and newsletter writer.
He often warned against the idea of buying a dead cat bounce in what is otherwise a bear market, as it is particularly dangerous. He gave the analogy that although a dead cat dropped from a tall building may bounce a little, the cat is still dead, a perfect analogy for stock prices, or any other asset, for that matter.


