Bullish
- December 22, 2024
- 26 min read
How to Trade Bullish Divergence
What is a Bullish Divergence?
Bullish divergence is a pattern used by traders in technical analysis to identify the possible end of a downtrend, and the beginnings of a new uptrend. On a more technical level, it signals that the sellers’ momentum is weakening, and therefore the conditions for a bullish reversal are improving.
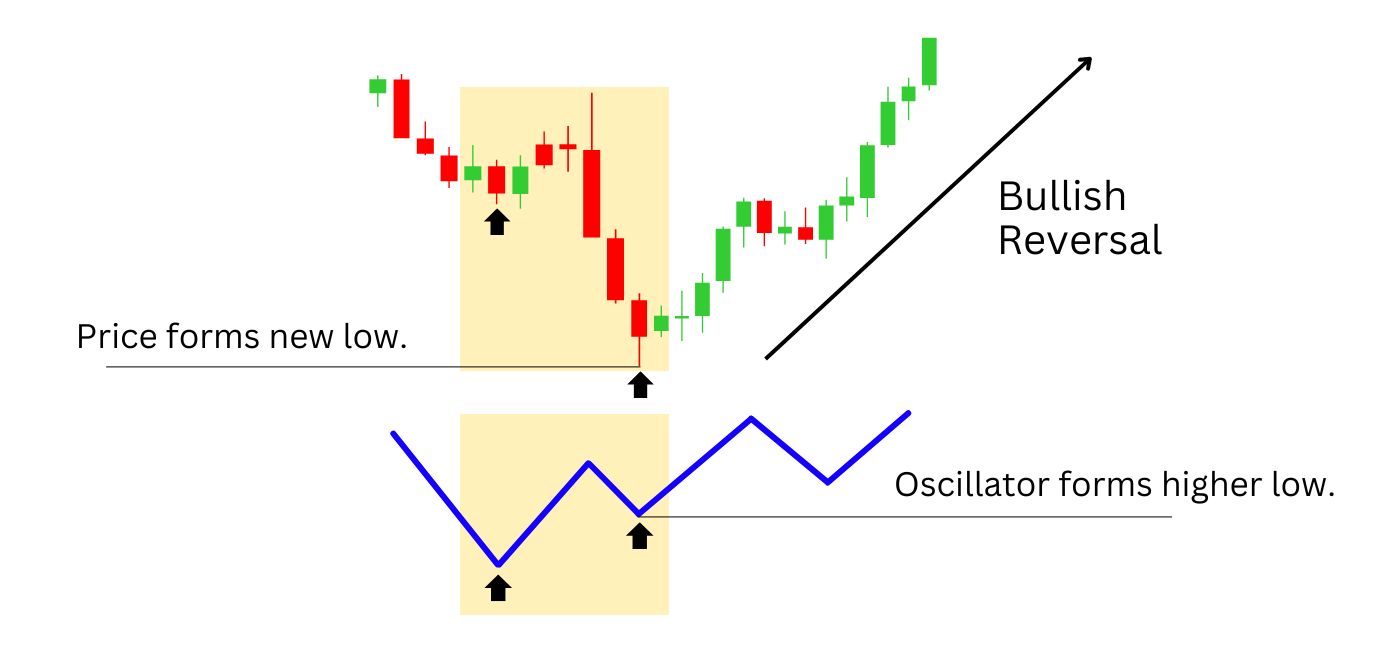
Think about momentum like fuel for a vehicle. As momentum weakens while the price is moving in a direction, this signals that the “Car” (price) is running out of “Gas” (momentum). Eventually, the car would stop moving in that direction due to the fuel depleting.
A bullish divergence simply means that the bearish trend has weakened in the market, and so it creates more likely conditions for a bullish reversal, or sideways movements to occur. There are two types of bullish divergences: regular divergence and hidden divergence. They occur when the price and technical indicator move in opposite directions.
What is a Regular Bullish Divergence?
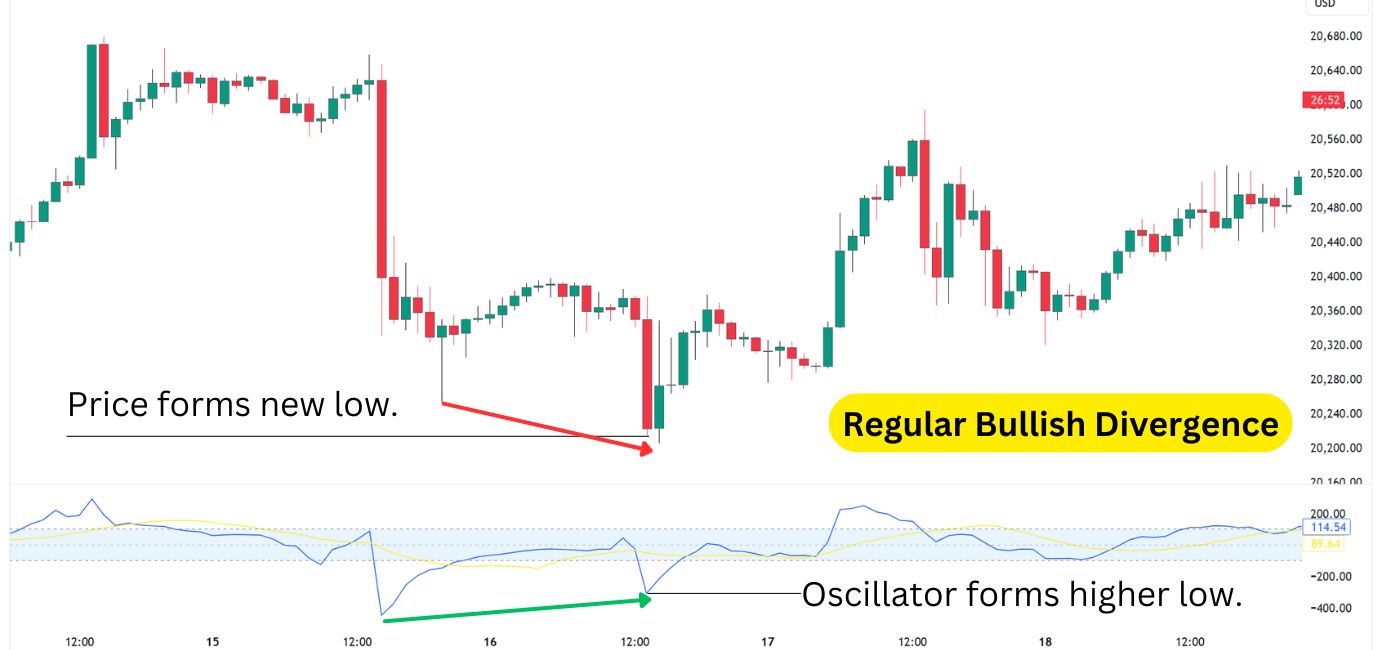
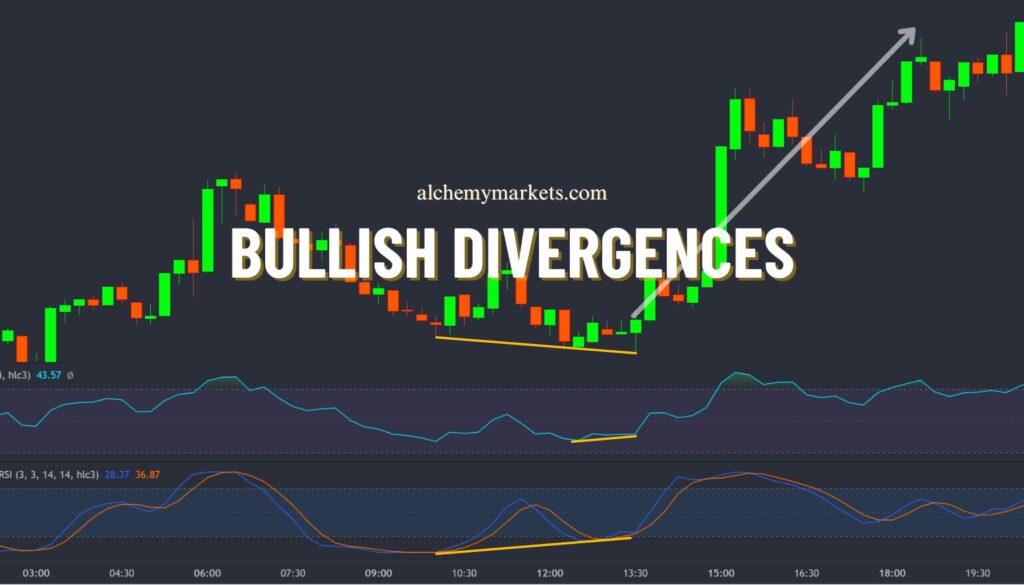
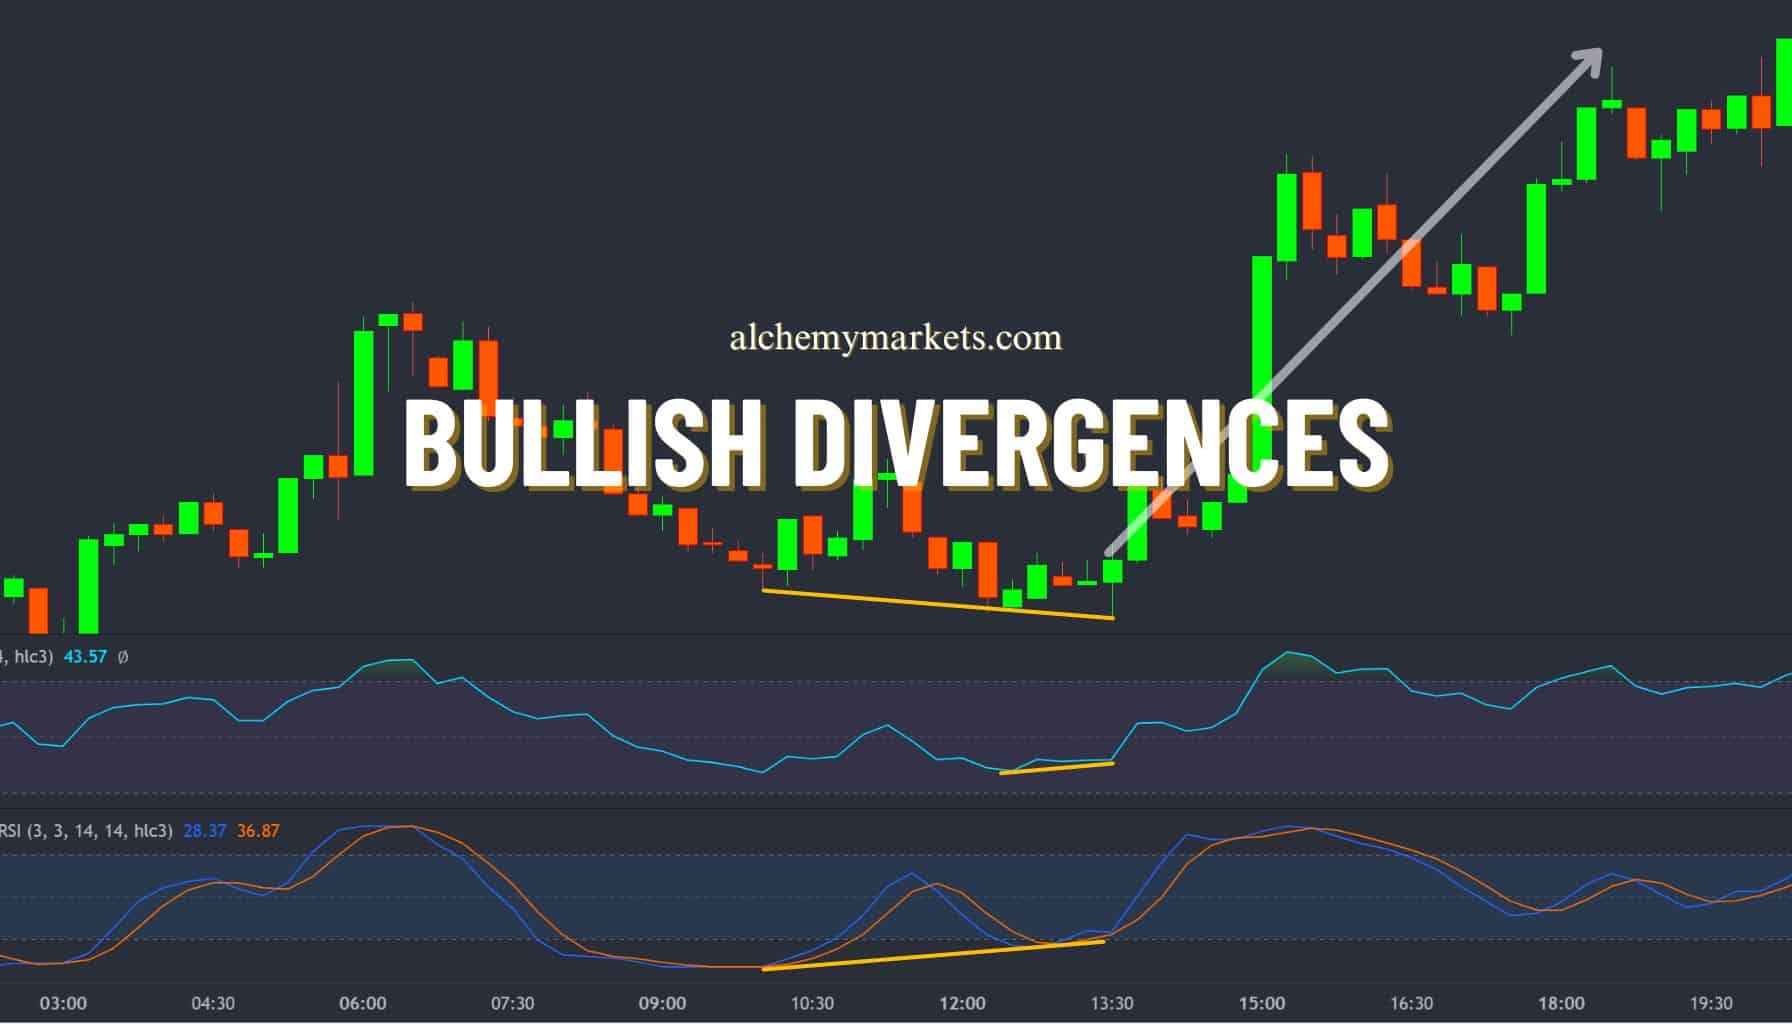
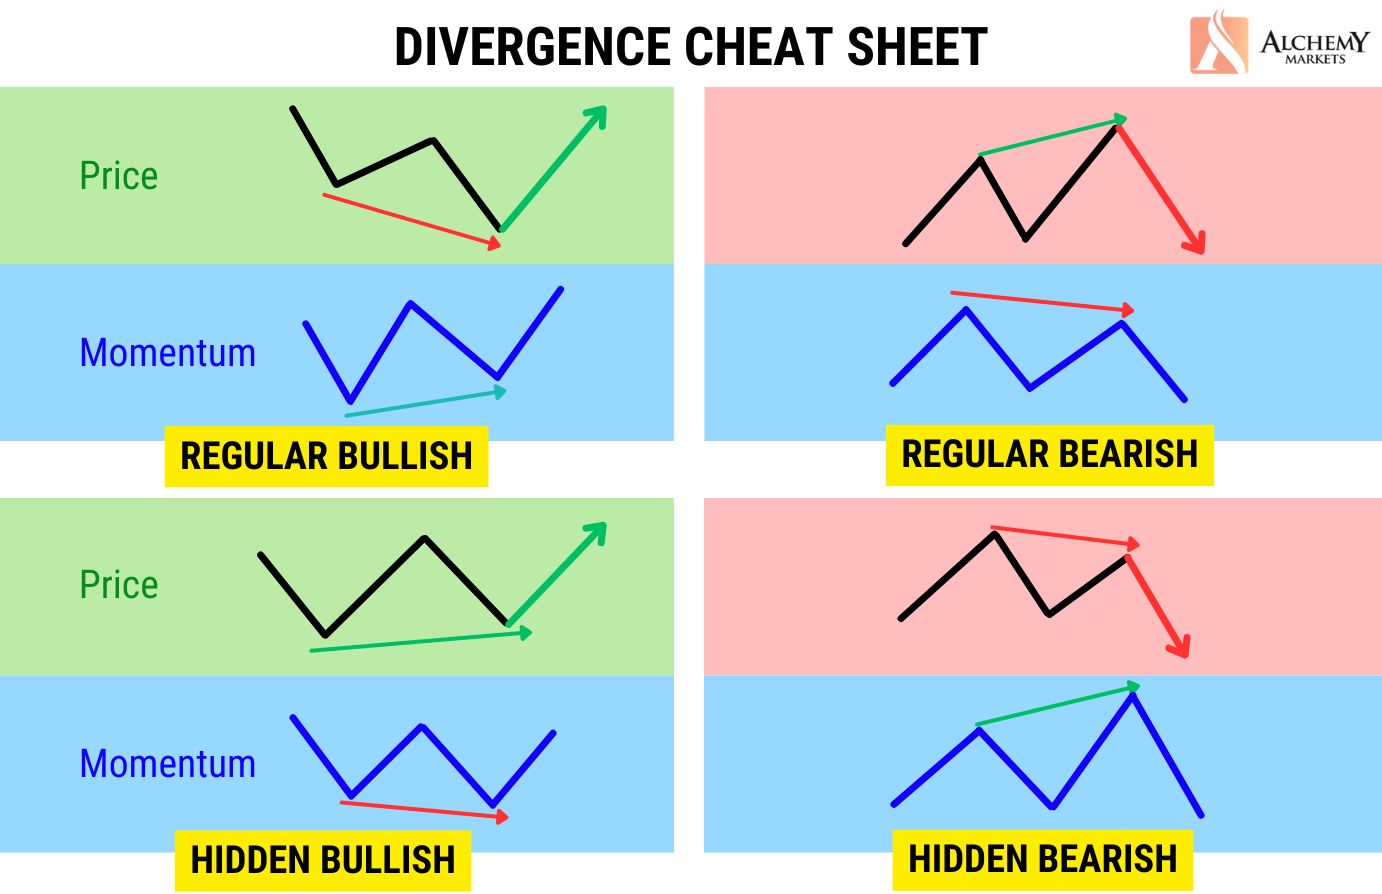
A regular bullish divergence occurs when an asset’s price forms a lower low, but the indicator forms higher lows. This signals that although price is moving lower, selling pressure is weakening – giving the asset a chance to make a bullish U-turn and reversal.
What is a Hidden Bullish Divergence?
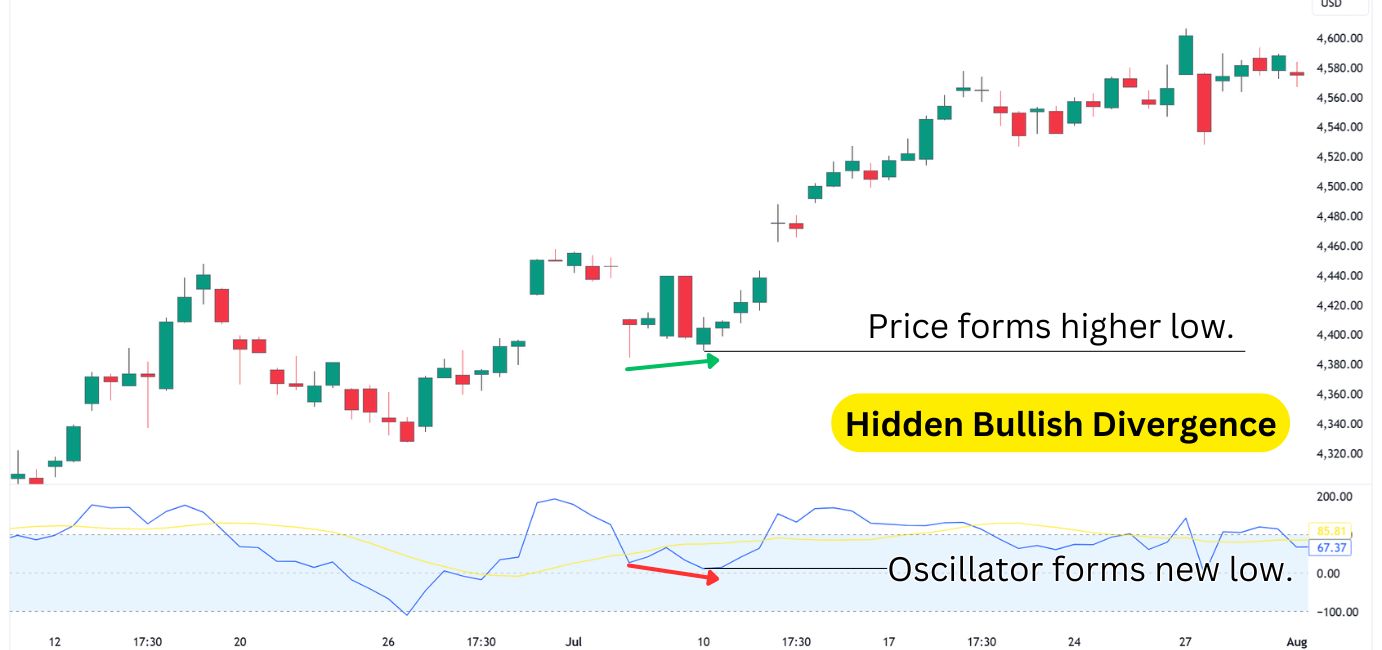
Hidden bullish divergence occurs when an asset’s price forms a higher low, but the indicator forms a lower low. This signals that, despite selling pressure, the price is holding up. This indicates that the uptrend is strong, and may continue.
What is a Bearish Divergence?
Bearish divergence occurs when there is an imminent price decline of an asset after an upswing. This can come in the form of a regular or hidden bearish divergence. A classic bearish divergence is when the oscillator forms a lower high, but the price forms a higher high.
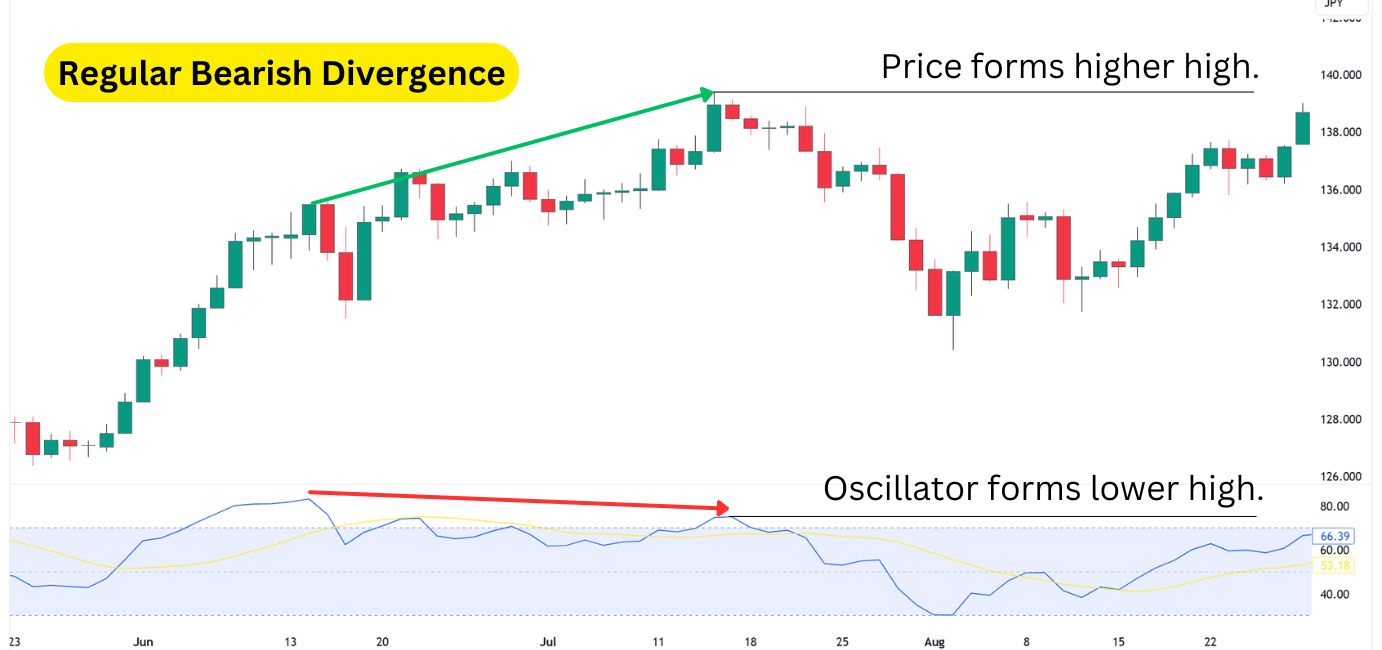
This is the complete opposite of a classic bullish divergence, where the price forms a lower low, but the oscillator forms a higher low.
How to Identify the Bullish Divergence Pattern?
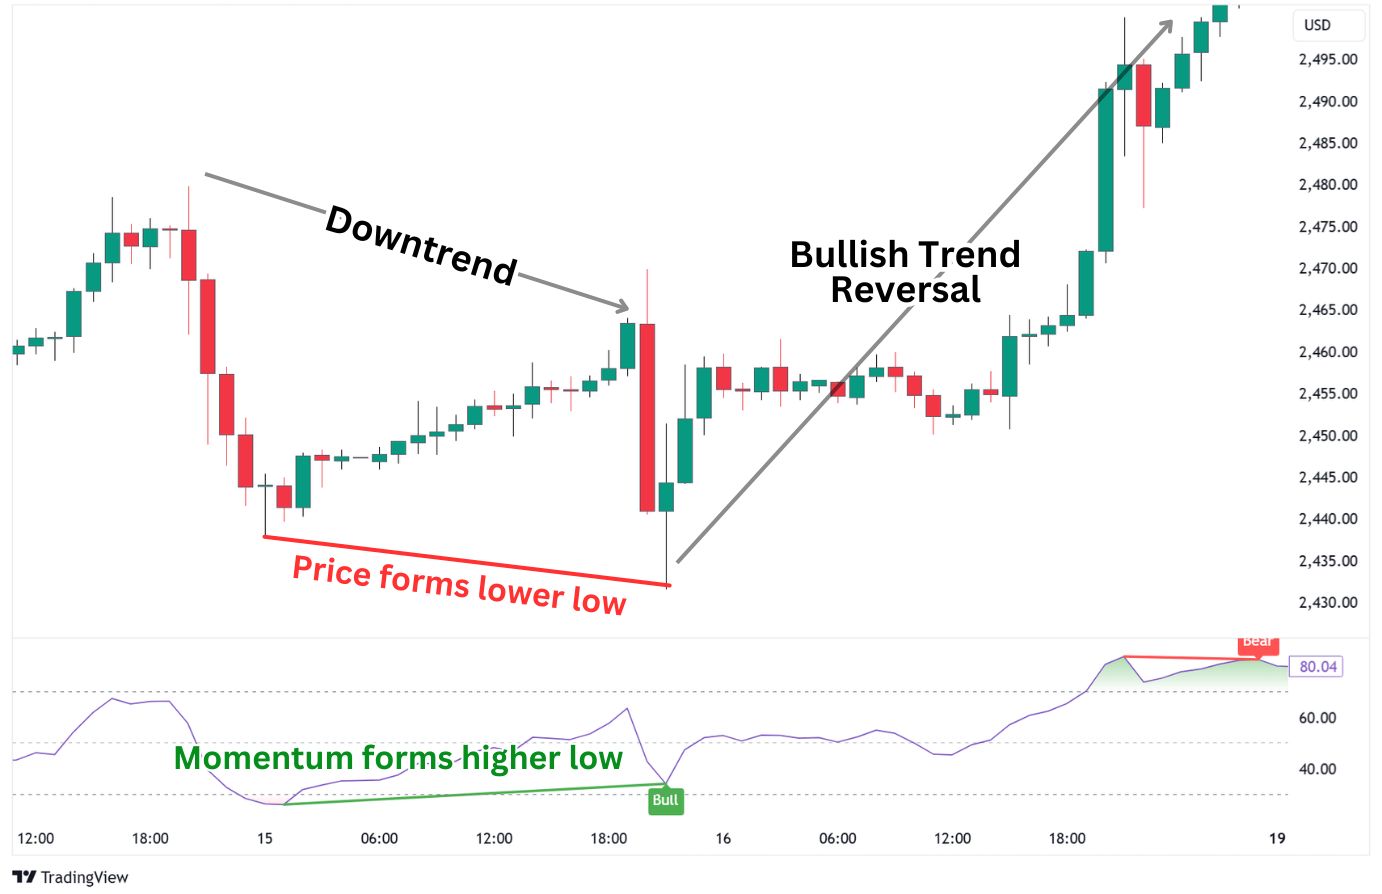
The regular or classic bullish divergence pattern is identified on the price chart when the price makes a lower low, but the technical indicator moves in the opposite direction making a higher low. The price and momentum oscillator indicator are moving in opposite directions – thereby creating what we call a divergence:
You can see this price trend play out in the Gold 1H example below, where we are using the RSI as the momentum indicator. Notice how Gold was originally in a local downtrend, forming a lower high at approximately $2465, then forming a lower low at $2430.
Then, at the second low, notice how the downward momentum, as indicated by the RSI, forms a higher low – this confirms the presence of a regular bullish divergence. Eventually, Gold breaks above its previous high, which results in a bullish trend reversal and the end of the local downtrend.
A hidden bullish divergence pattern would form differently, but is identifiable through the same components: market structure and a momentum indicator.
What Does a Bullish Divergence Indicate?
Contrary to popular belief, a bullish divergence indicates not one but two things:
- That bearish momentum is slowing, creating conditions suitable for a reversal.
- Or it is simply temporarily pausing in its bearish movement, and about to go sideways.
It’s also important to note that a bullish divergence only indicates that a pause or a reversal is likely to occur, but does not always play out or tells you when the reversal will take place. The price can still fall lower despite the bullish divergence, especially when it is formed on a lower timeframes such as 1H or lower.
Bullish Divergence Example
Note that in this section, we’ll specifically showcase a regular bullish divergence example. For hidden bullish divergences, please check out our full guide as it warrants its own piece and breakdown of corresponding strategies.
A regular divergence requires the following to be valid:
- The local trend must be a downtrend, forming lower lows and lower highs.
- The momentum indicator must be forming a higher low, while the price forms a lower low.
It’s also important to understand that regular bullish divergences may not play out immediately, and may even result in multiple lower lows in price despite its bullish signals. This is highlighted on the Bitcoin/USD 4H chart below, using the RSI indicator.
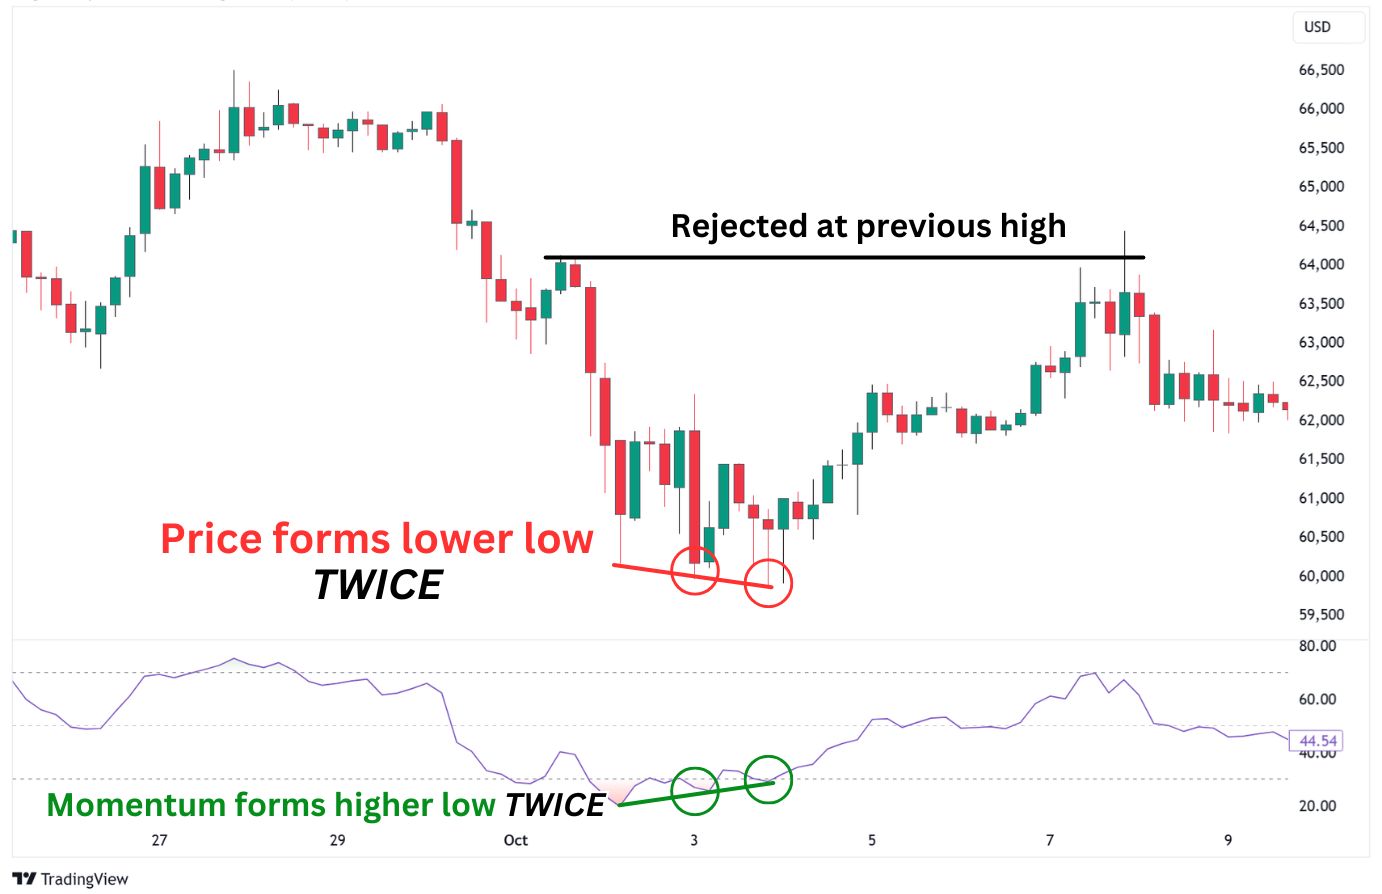
In this example, the Bitcoin price clearly forms a local downtrend with lower highs and lower lows. Next, we see two instances of regular bullish divergence between the price and RSI, hinting at a possible reversal. This tells us something interesting about the regular bullish divergence: it can form consecutively in a row.
Eventually, the price does get reversed to the upside, getting rejected once again at a previous pivot high.
Key Lessons About the Regular Bullish Divergence:
The regular bullish divergence should be traded with a level of nuance, risk management, and caution – as multiple pushes lower can occur despite its occurrence.
In our example above, if you had entered a trade solely based on the divergence, you would have gotten stopped out. So let’s put things into perspective:
- The regular bullish divergence does not guarantee a 100% chance of a bullish reversal.
- The divergence, by itself, is not a signal to enter a long trade. You need additional bullish factors to line up, which improves your entry and reduces the odds of getting stopped out.
- A regular bullish divergence does not guarantee a reversal of the overarching trend.
Remember, the trend is your friend until the end – if the trend is towards the downside, there is a strong likelihood that the reversal will be rejected at a previous high, or resistance level above.
Bullish Divergence Trading Indicators
Regular bullish divergences are most often observed with technical indicators like the RSI, MACD, or the Stochastic. These indicators may display information differently, but ultimately, they provide insights into the strength behind a bullish or bearish price movement.
In general, when the indicator shows an uptick – that means bullish momentum is increasing. When it shows a downtick, it means momentum is decreasing, or selling momentum is increasing. Simply put: up good, down bad.
| An important tip: Since most traders draw divergences from candlestick wicks, they consider the full candlestick in their analysis of bullish divergences. This approach actually differs from how most momentum oscillators calculate momentum, as they only consider the candle’s closing price, as indicated by the default source setting of “Close” on most platforms. To align better with wick-based divergence analysis, traders can set these indicators’ Source to “HLC3” (High, Low, Close). This setting includes price wicks, fitting the common practice of using wick-based trendlines. However, if you tend to draw divergences from the candle bodies or use line charts, then the default “Close” source works perfectly fine. |
Spot Bullish Divergence using Moving Average Convergence Divergence
The MACD, or Moving Average Convergence Divergence indicator is made up of four components: the MACD line, Signal line, Zero Line and the histogram.
Just like the rules laid out above, if the MACD indicator is forming higher lows while price is forming lower lows, we have a regular bullish divergence.
For spotting divergences, we want to primarily look at the histogram or the MACD line. Here is an example of how it works, using the histogram part of the indicator:
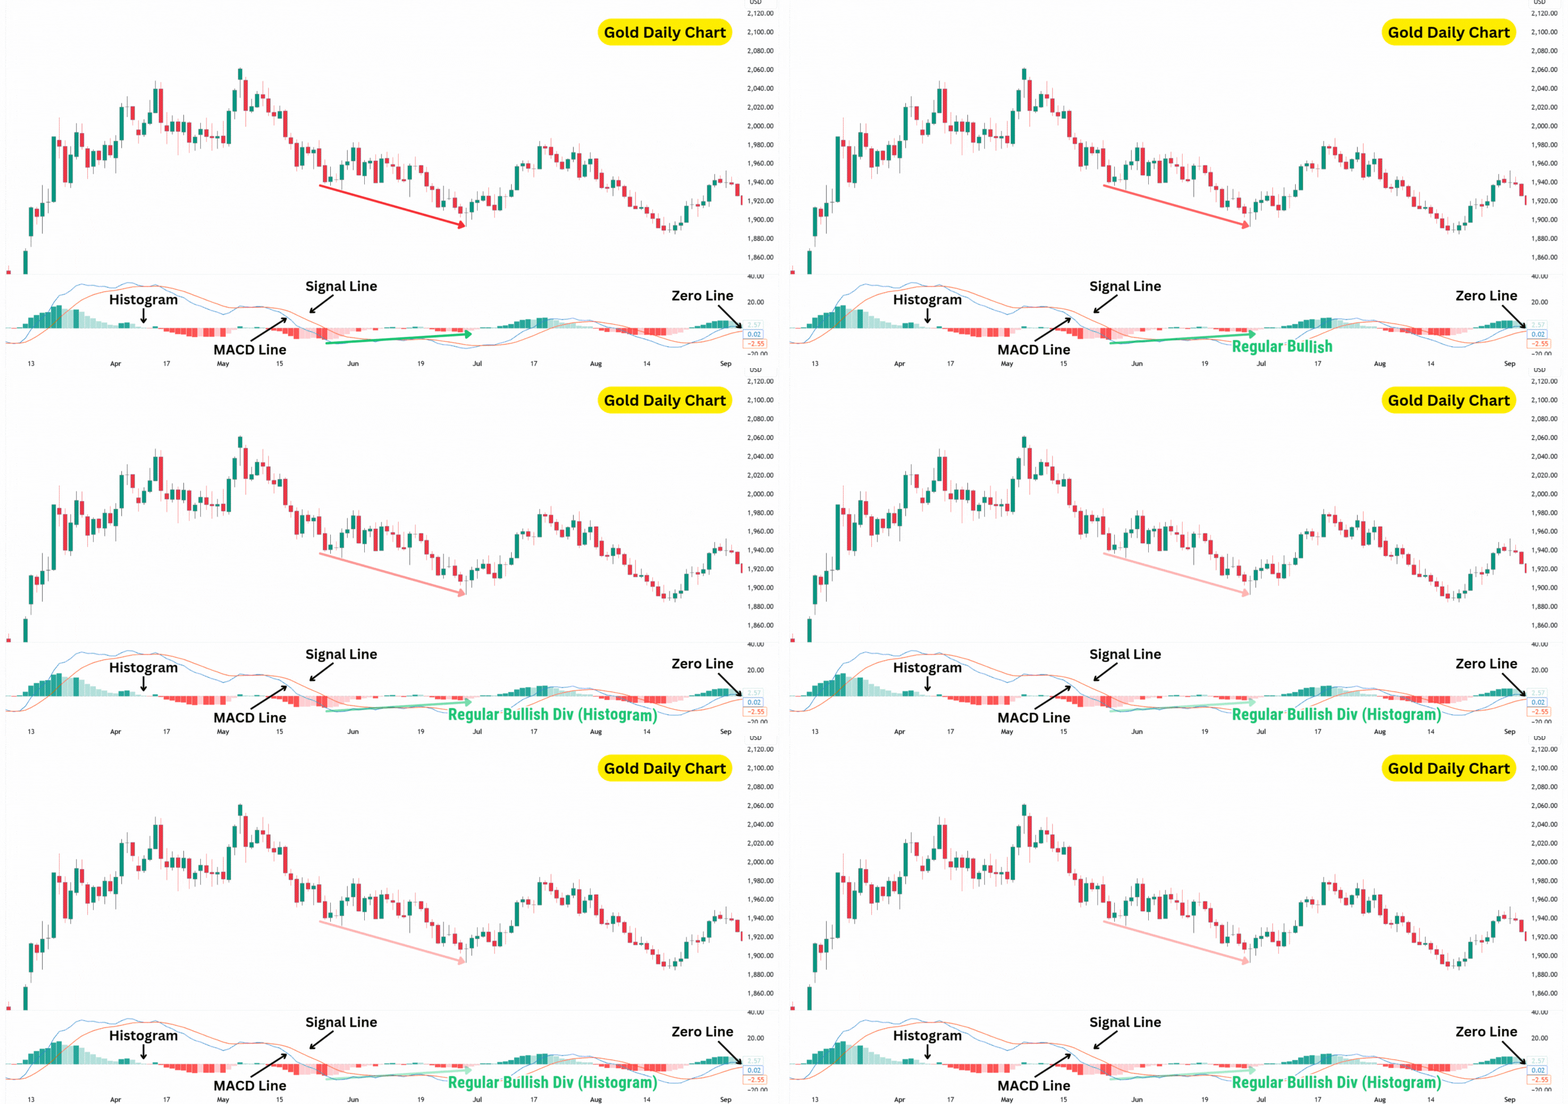
As you can see, the price managed to reverse for the following two weeks after printing a regular bullish divergence. However, we did mention that a divergence by itself isn’t considered an entry signal, you need other confluences to support the idea of a reversal.
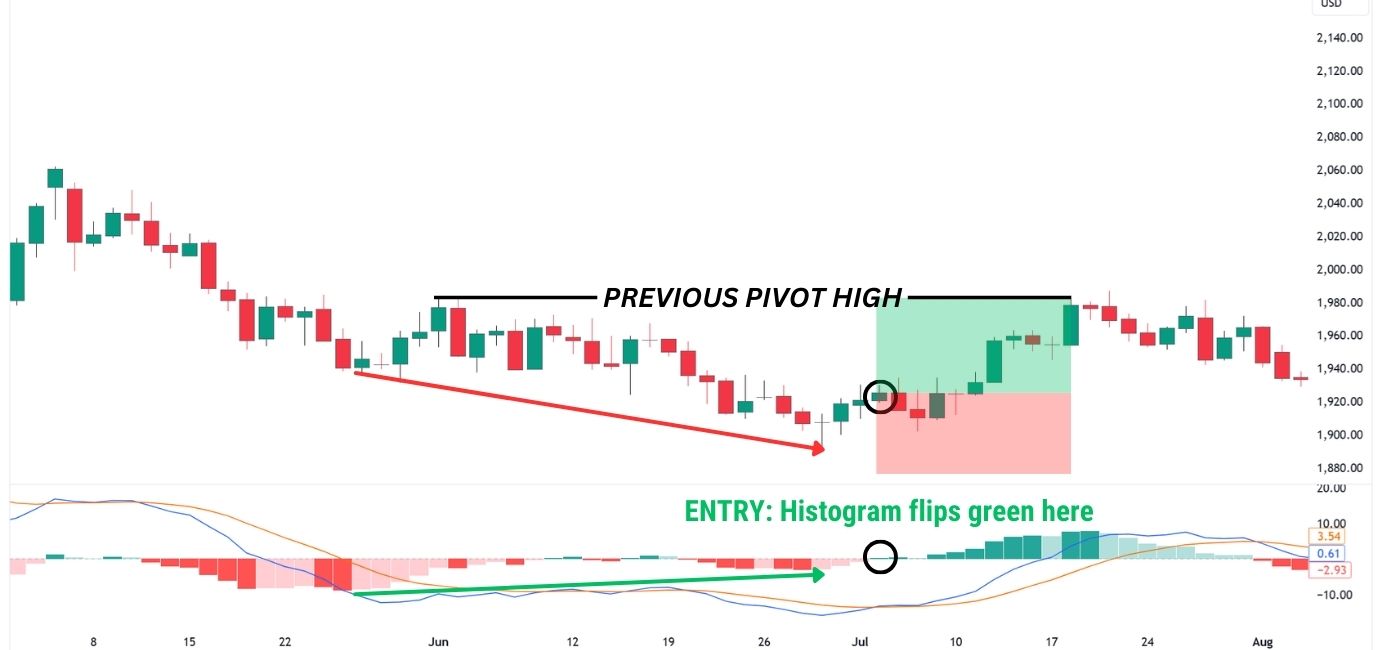
With the MACD, we can consider using the MACD histogram’s ability to indicate short-term momentum, and enter a long trade when the histogram flips green (bullish momentum in control), after the bullish divergence has occurred.
Targeting the previous pivot high, we manage to lock in a trade with approximately 1.5 reward-to-risk:
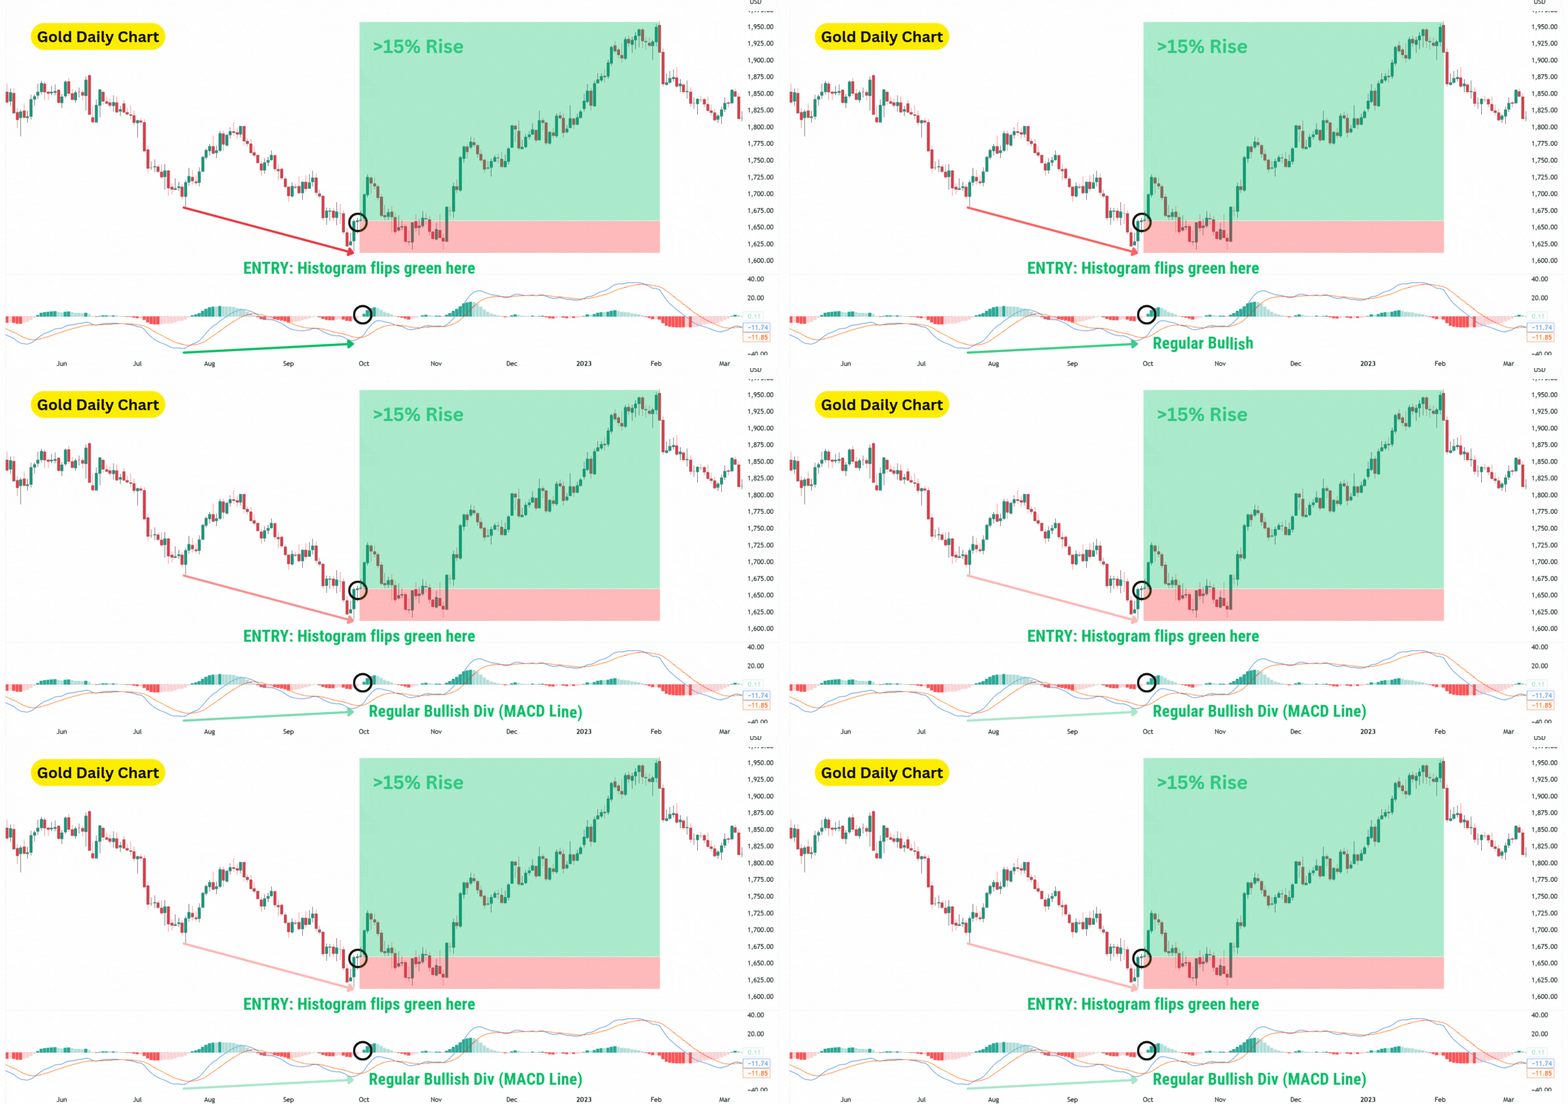
The MACD Line (visualised as a blue line) can also be utilised to find bullish divergences, when the price forms a new low, but the indicator forms a higher low.
The key differences between the MACD Line and Histogram lies in that:
- The MACD Line reflects long term momentum, and a divergence signals the possibility for more significant reversals.
- The Histogram reflects short-term momentum, and so divergences tend to signal smaller reversals.
Using this information, traders can set healthy expectations for their take profit targets. For example, we’re able to take a significant bullish reversal trade on this Gold Daily Chart, due to the MACD Line divergence signal:
Spot Bullish Divergence using Stochastic Oscillator
The Stochastic Oscillator, or simply “Stochastics,” is a momentum indicator ranging between 0 and 100. When Stochastics is above 80, it indicates overbought conditions, potentially signalling a bearish reversal. When it’s below 20, it suggests the asset is oversold, hinting at a possible bullish reversal.
There are two key points when spotting bullish divergences with Stochastics:
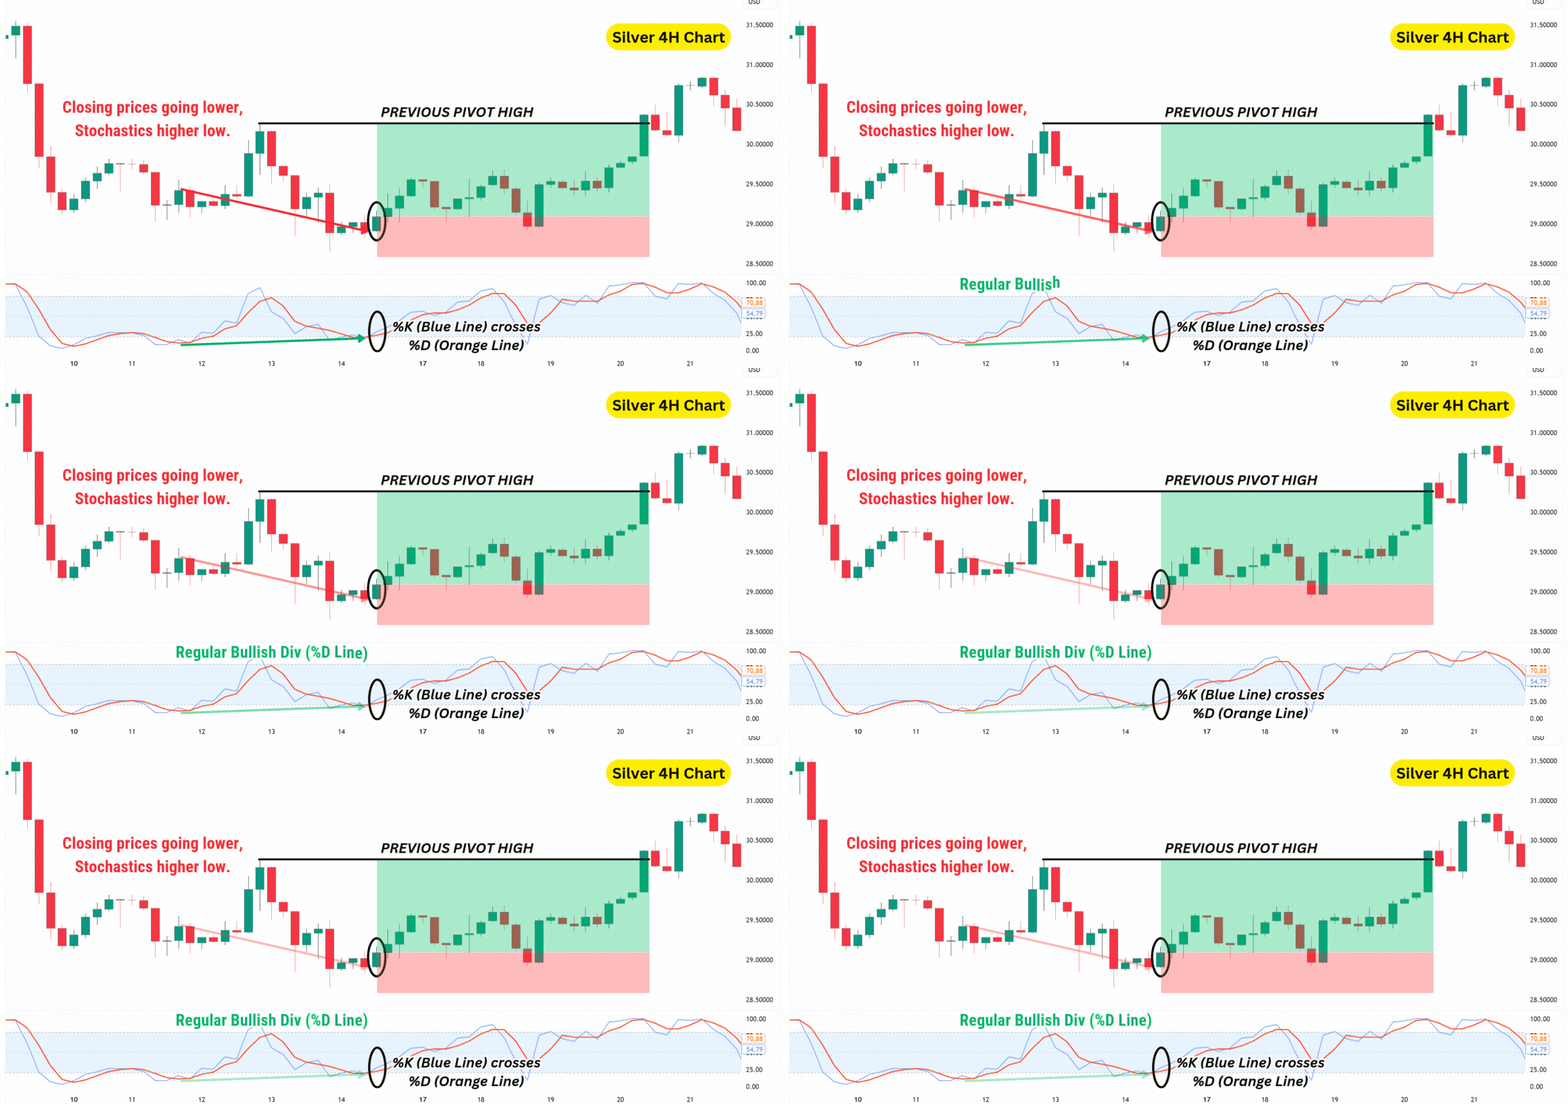
- The %D line (in orange) is smoother and is the preferred line for identifying divergences.
- Since Stochastics only considers closing prices, divergences should be based on the candlestick bodies.
Combining the stochastic oscillator with candlestick closing prices allows for spotting bullish divergences and setting up trades based on your entry criteria. In this XAGUSD (Silver) trade, we used the %K line (blue) crossing above the %D line (orange) as our long entry signal, following confirmation of a regular bullish divergence.
Spot Bullish Divergence using Relative Strength Index
The RSI, or Relative Strength Index, is a momentum oscillator that tracks the speed and direction of recent price movements, ranging from 0 to 100. A sharp rise in RSI signals a recent price jump, while a sharp drop indicates a recent decline.
Calculated by comparing recent gains to losses, RSI’s movement reflects shifts in momentum: an upward RSI suggests strengthening bullish momentum, while a downward shift shows weakening bullish momentum, with price changes favouring the downside.
A critical yet rarely mentioned tip is to switch your RSI “Source” setting to HLC3.
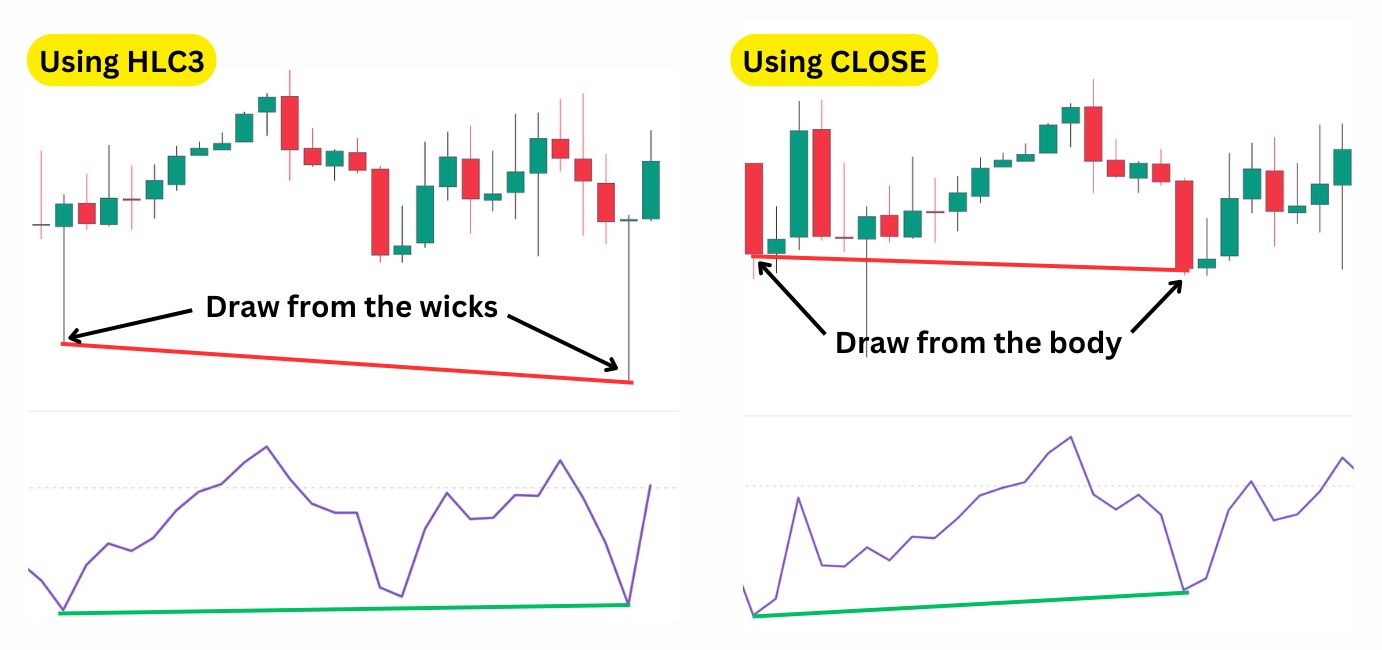
Switching RSI to the HLC3 setting allows it to account for candlestick wicks, while the default “Close” setting only measures momentum based on the candle bodies (closing prices). Since most traders use wicks to identify divergences, using HLC3 makes RSI signals more reliable. Of course, you can still draw regular bullish divergences using the “Close” source, but you would need to adjust how you mark divergences on the candlesticks:
With all that being said, let’s get into how you can spot regular bullish divergences using the Relative Strength Index:
- The general gist is the same with the MACD and Stochastics, we want the RSI to form higher lows.
- The price must instead form a lower low – showing a divergence between the momentum and price action.
Then, once a regular bullish divergence has been confirmed, we can look for a long entry when our preferred conditions are fulfilled. Remember, divergences simply tell us that the conditions for a reversal have improved, but are not entry signals by themselves.
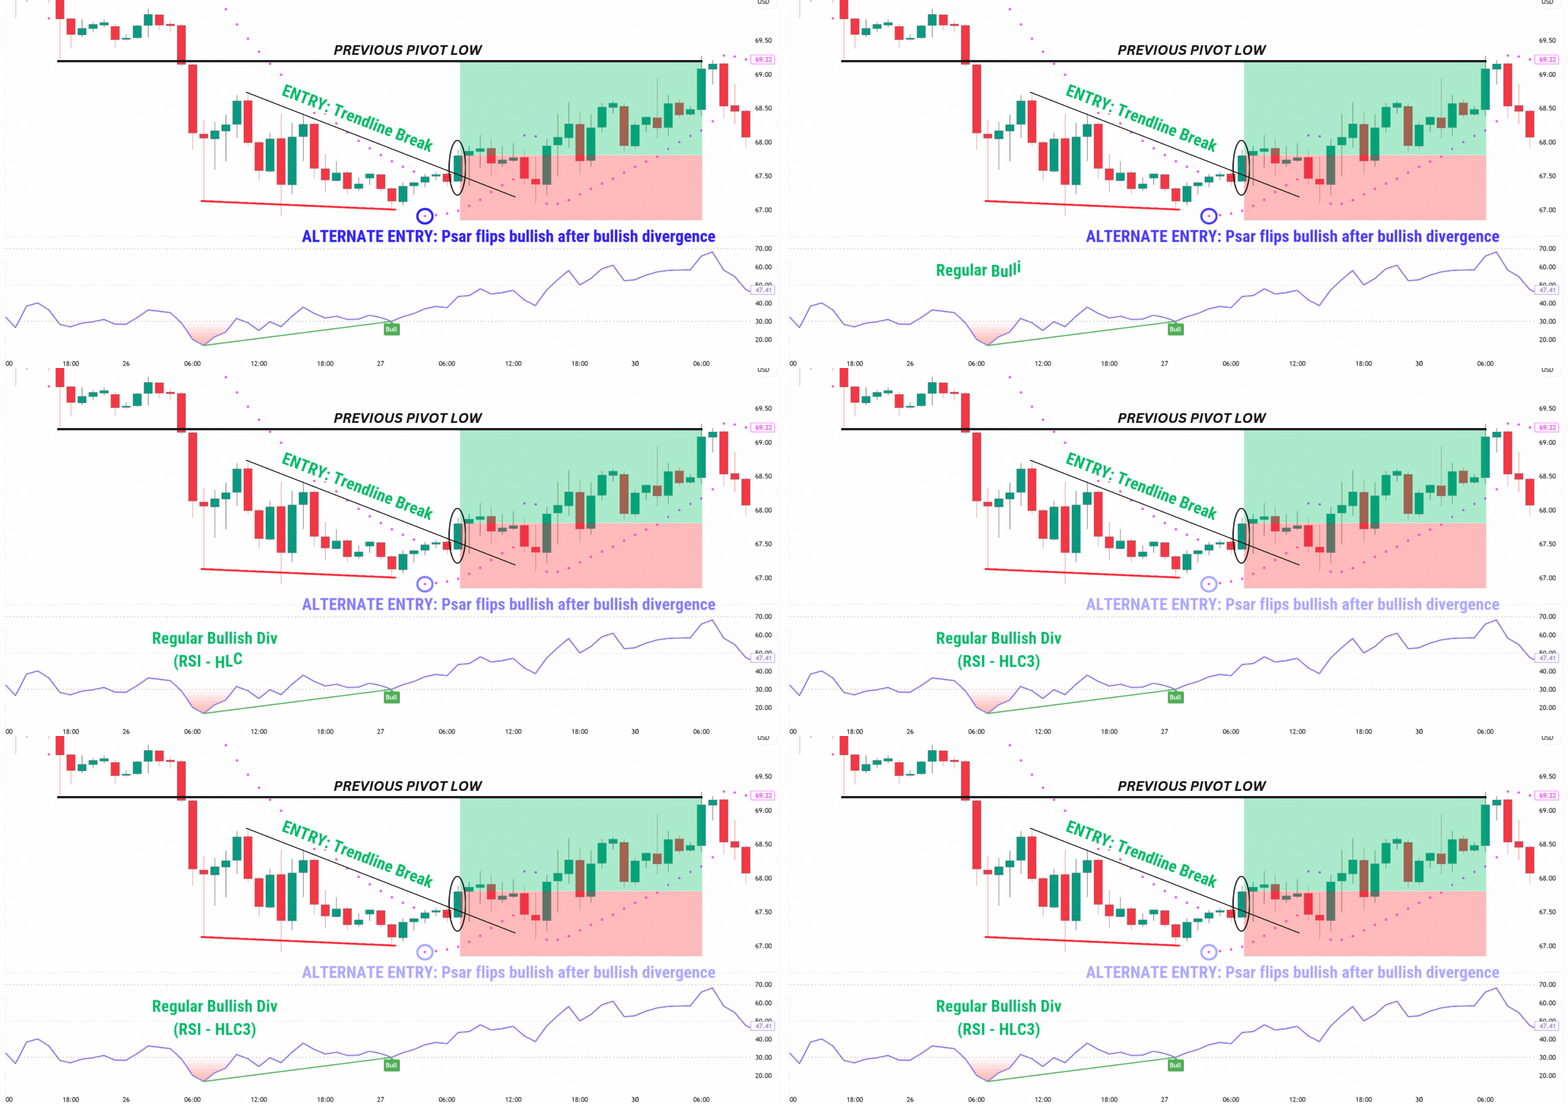
In this example, we used the break of the descending trendline as a confirmation signal to enter a long trade. However, an alternative method would be to use the Parabolic SAR to enter a long position, after the bullish divergence has formed.
This highlights that divergences can be traded in many different ways, using different setups.
Spot Bullish Divergence using Commodity Channel Index (CCI)
The CCI is an indicator developed by Donald Lambert, for analysing the current price against the average price of the asset. The average price sits at 0 in the CCI indicator, and the indicator can go either +100 or -100 away from the 0 mark.
The idea here is that if the CCI is at +100 or higher, the asset is currently in an uptrend. If the CCI is -100 or lower, it’s in a downtrend. Traders can use the lower extremes to find regular bullish divergences when the price of an asset drops harshly (falling below its previous low), but the CCI instead creates a higher low – indicating that bearish momentum is weakening.
Similarly to the RSI indicator, the CCI can be toggled to calculate using the closing prices, HLC3, or other source settings. By default, it is calculated with HLC3, which allows us to use the wicks of the price candles to find our divergence.
In practice, this is how spotting a bullish divergence with the Commodity Channel Index (CCI) would look like. Notice how the price has made a drastic shift to the downside, and yet the CCI printed a higher low – diverging from the price action. This signals that despite a price decline, the bearish momentum is slowing, hinting at a possible selling exhaustion.
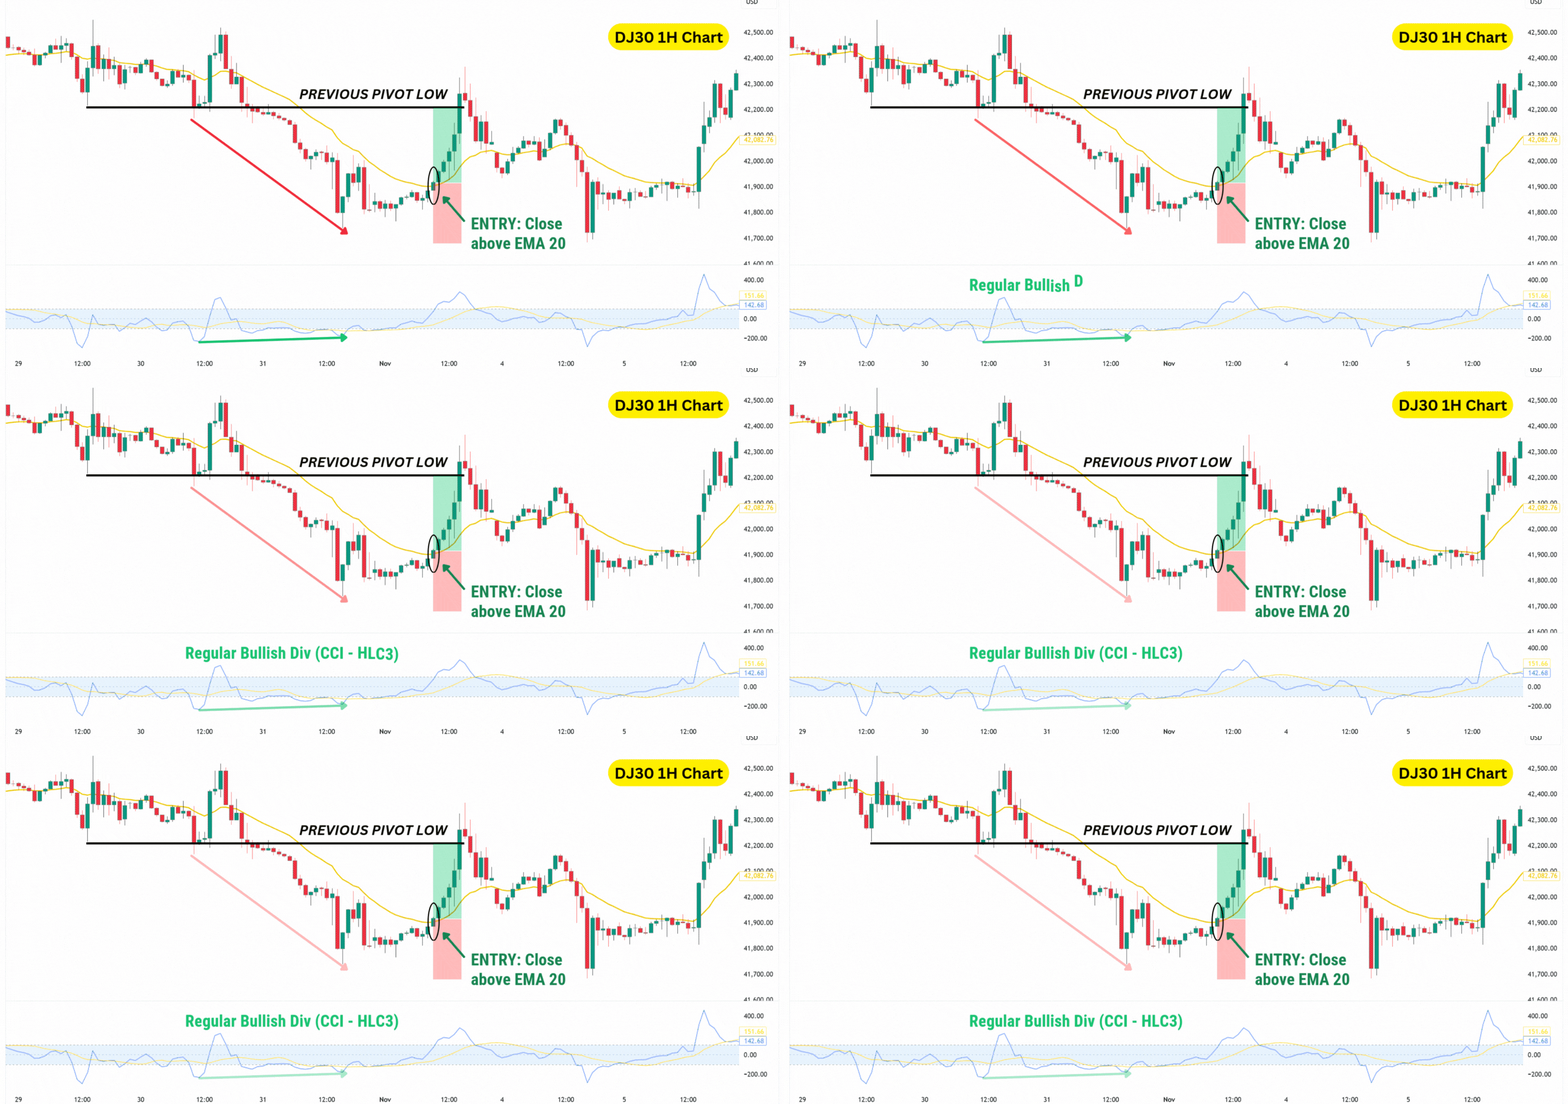
Again, the entry for this divergence trade on DJIA can be based on your own setups. In this example, we used the close of a candle above the 20-period Exponential Moving Average (EMA) as a signal. This EMA setting adapts quickly to price changes, and a close above it indicates that the price has moved above the average level over the past 20 candles.
Spot Bullish Divergence using Williams %R
Williams %R, or William Percentage Range, is an indicator used to determine overbought and oversold conditions in the market. It predicts when the markets’ momentum has potentially peaked, making a pullback likely.
Unique to the Williams %R, the indicator oscillates between the values of 0 and -100. When the value is between 0 and -20, that means the asset is overbought. When it’s between -80 to -100, that means the asset is oversold.
Since Williams %R uses the HLC3 to calculate its value, we can use the classic method of finding divergences by drawing the trendline from the candle wicks. We want to see the W%R indicator form higher lows, while the price continues to form lower lows.

In our example here, we can see the price of Bitcoin temporarily dip from $60,000 to $59,000. Meanwhile, the W%R indicator creates a higher low from -94.00 to -70.00, indicating a regular bullish divergence.
From here, Bitcoin reverses higher and breaks the highest price printed during the formation of the divergence – thus confirming a larger reversal to be in the picture. Using the break and close of price above the pivot high, we were able to get into a 1:2 risk-to-reward ratio trade, which saw Bitcoin rise from $62,000 to $70,000.
Spot Bullish Divergence using Advance-Decline Line (AD)
The Advance-Decline Line (AD Line) differs from oscillators like RSI, MACD, and Stochastics as it’s not bounded between two fixed values (e.g., 0 to 100) and doesn’t indicate overbought or oversold conditions. Instead, the AD Line is a market breadth indicator, reflecting the cumulative difference between advancing and declining stocks.
When more stocks advance than decline, the AD Line rises; if more decline, it falls.
| The formula is simply:The Previous AD Line Value + (Number of advancing stocks – Number of declining stocks) |
This indicator offers a broad view of market conditions: if the majority of stocks are trending higher, a typical stock is likely to follow suit unless it’s particularly weak.
Traders can identify a regular bullish divergence with the AD Line when an asset’s price is making lower lows, but the AD Line is forming higher lows. This setup can suggest an underlying strength in market breadth, signalling a potential reversal.
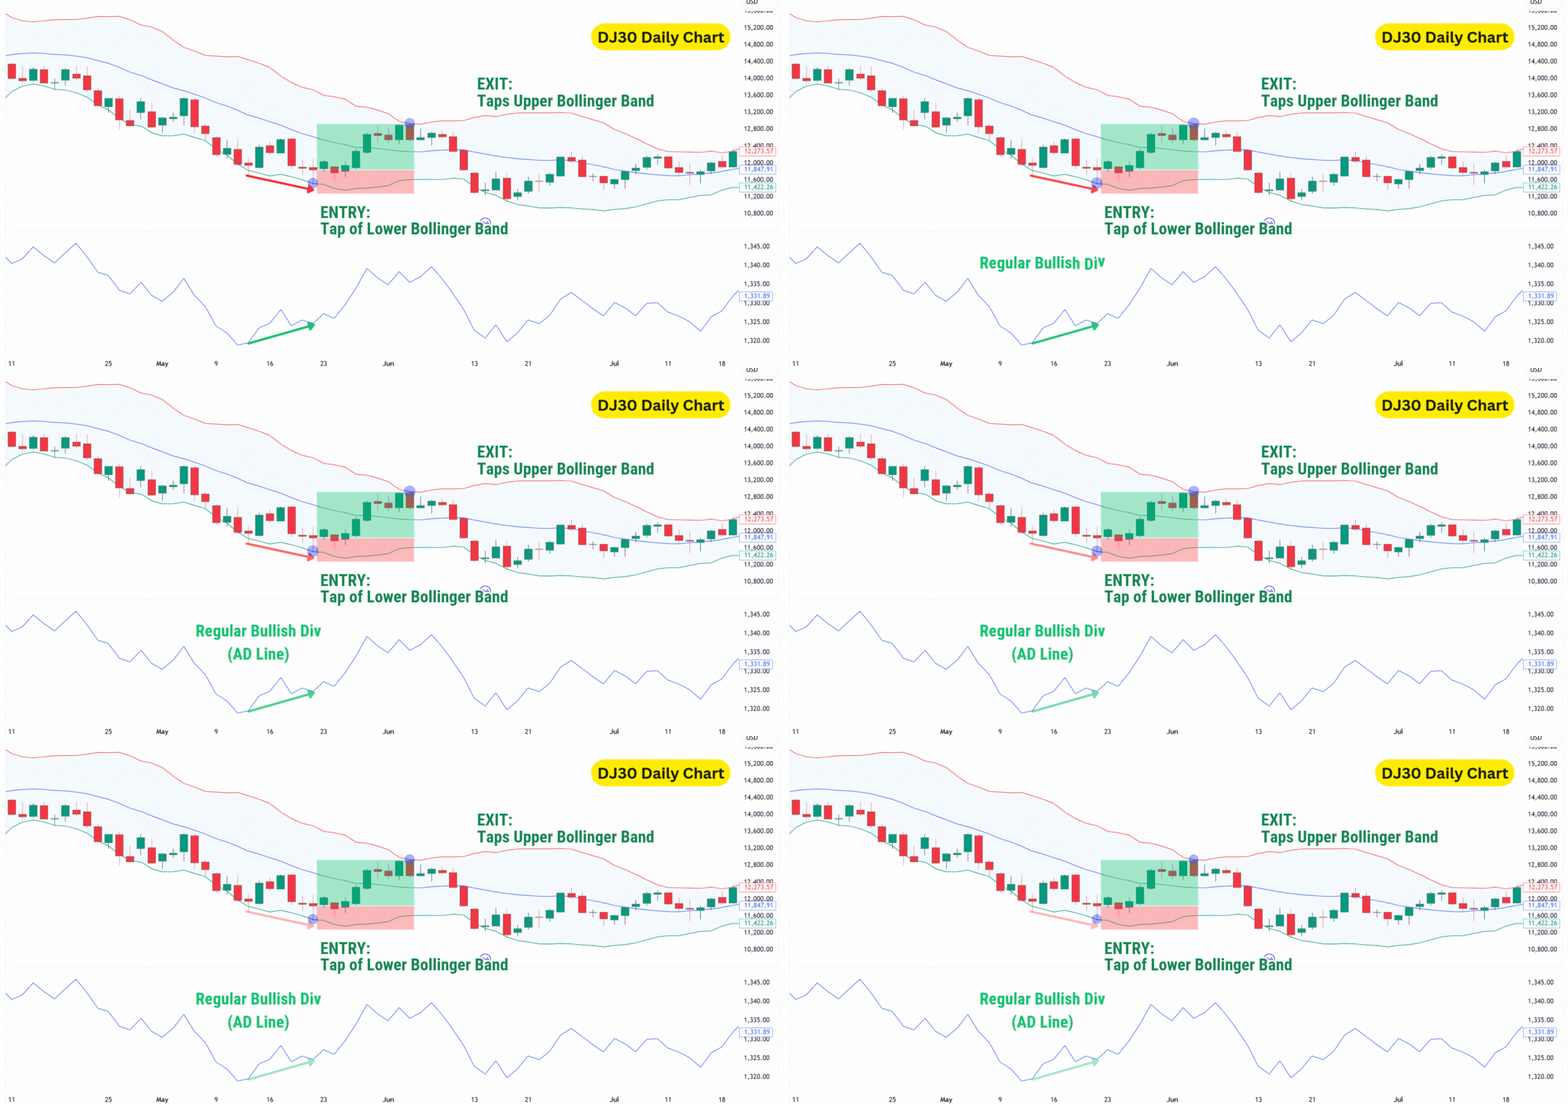
In this example, we are combining the regular bullish divergence with the Bollinger Bands®, which has a built-in feature that detects likely price bottoms or tops.
Here on Dow Jones 1D Chart, we can see that price has tapped into the lower Bollinger Band while forming a higher low. This marks a perfect entry into a long trade, targeting the midline and top of the Bollinger Band, where you can take profit.
Some key notes to remember when trading with the AD Line are that:
- Unlike momentum indicators, the AD Line doesn’t measure the speed or strength of price movements.
- Most platforms, including TradingView, base their AD Line solely on the New York Stock Exchange (NYSE). This means the AD Line will show NYSE breadth data, regardless of the specific asset chart.
- The AD Line is calculated based on the daily timeframe, and does not work well with lower time frames.
Lastly, since the AD Line provides a broad view of market sentiment, it tends to work best with stocks, indices, and even cryptocurrencies, rather than with Forex pairs and commodities.
Spot Bullish Divergence using On-Balance Volume (OBV)
The On-Balance Volume (OBV) indicator shows the flow of buying and selling volume over time. It works as a simple accumulative calculation. Say the line starts from zero – if the asset closes higher for a candle, the OBV adds that volume to its line, causing it to tick higher. If the asset closes lower for another day, it subtracts the day’s volume from the current existing calculation.
This back and forth creates a moving line which tells us how frequent an asset is bullish or bearish, and how strong the directional moves are.
In the context of a regular bullish divergence, if prices move to a new low, but the OBV forms a higher low, it means that the second push lower was not as significant as the buying volume in recent days. This indicates that buyers are stepping in, and that sellers are potentially exhausted out of their funds. Combined, this creates the perfect opportunity for a bullish reversal.
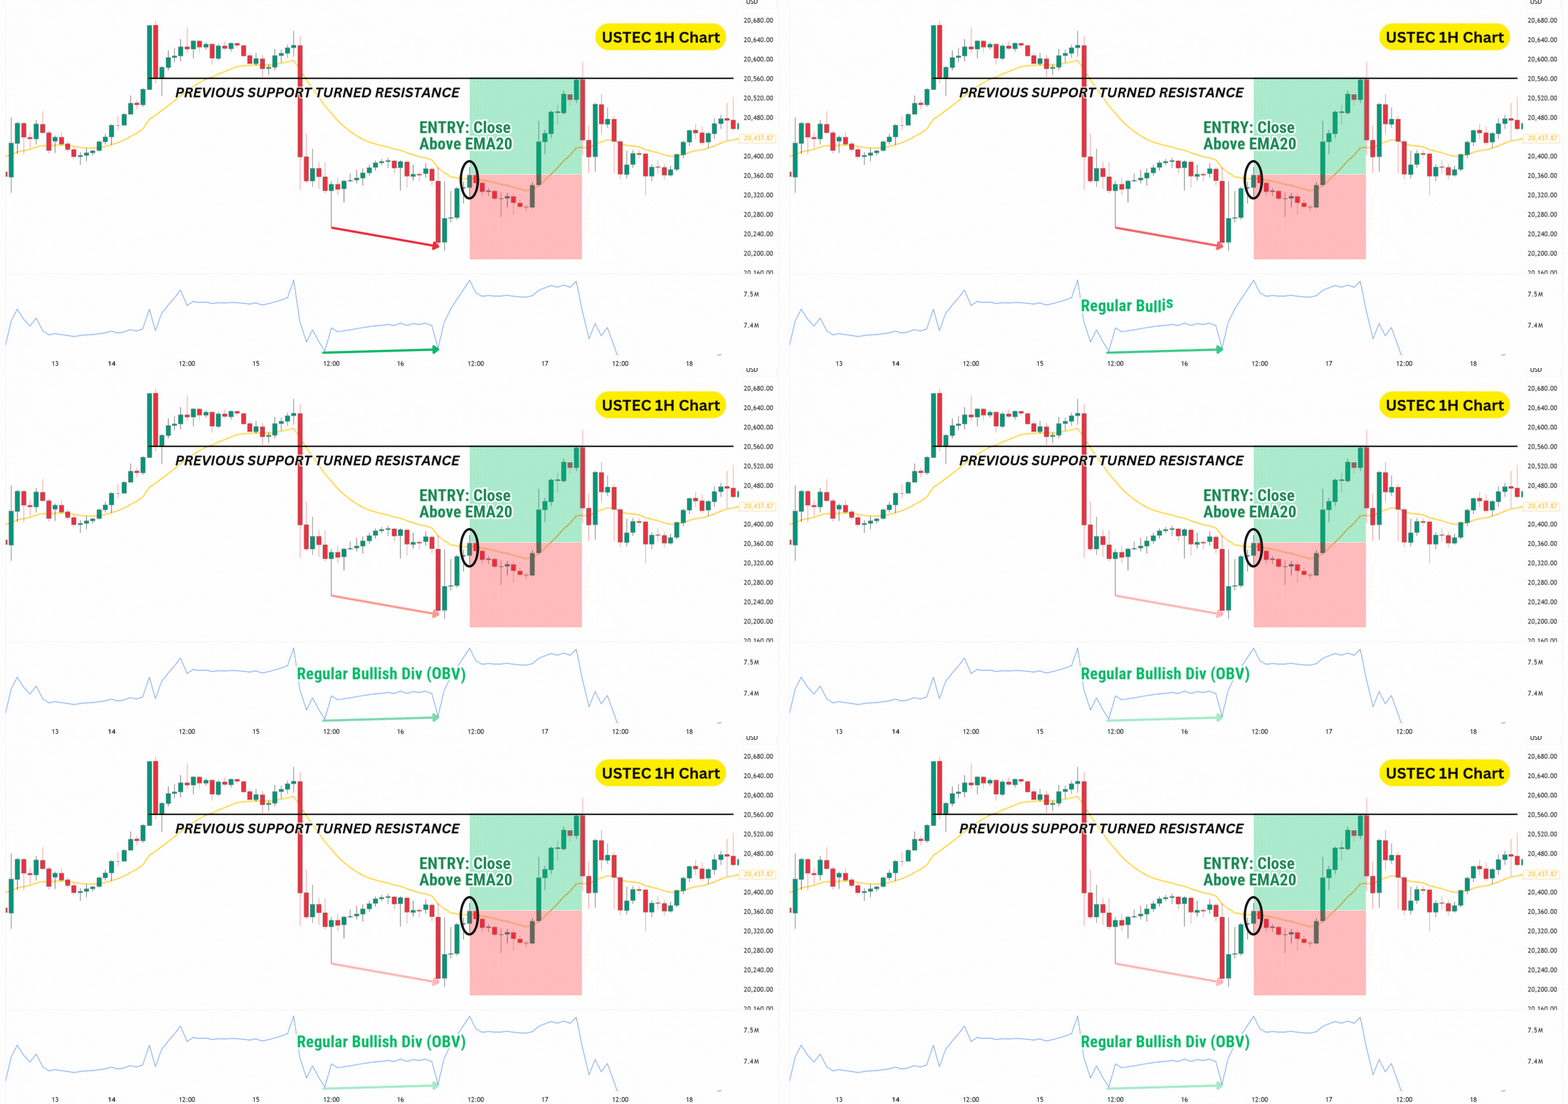
In this example of the USTEC (Nasdaq 100) 1H chart, the entry could be when the price closes above the EMA 20, after the regular bullish divergence. Then, we take profit at the previous support level, which has now turned into a resistance.
Spot Bullish Divergence using Chaikin Money Flow
The Chaikin Money Flow, or CMF for short, is an oscillator that measures buying/selling pressure, based on price direction and volume. By default the CMF calculates the momentum in the past 20 candlesticks, but it’s fully adjustable to your liking.
Although the Chaikin Money Flow sounds similar to the OBV indicator, it’s different in the sense it moves between two fixed values to indicate the momentum of an asset. For the CMF, these values are between -1 and +1.
- The closer the CMF is to +1, the higher the buying pressure.
- The closer it is to -1, the higher selling pressure.
- The closer it is to 0, the more neutral the momentum is.
Using the CMF, traders can spot a regular bullish divergence when the price forms a lower low, while the indicator forms a higher low. This implies that bearish momentum is slowing, despite the lower price.
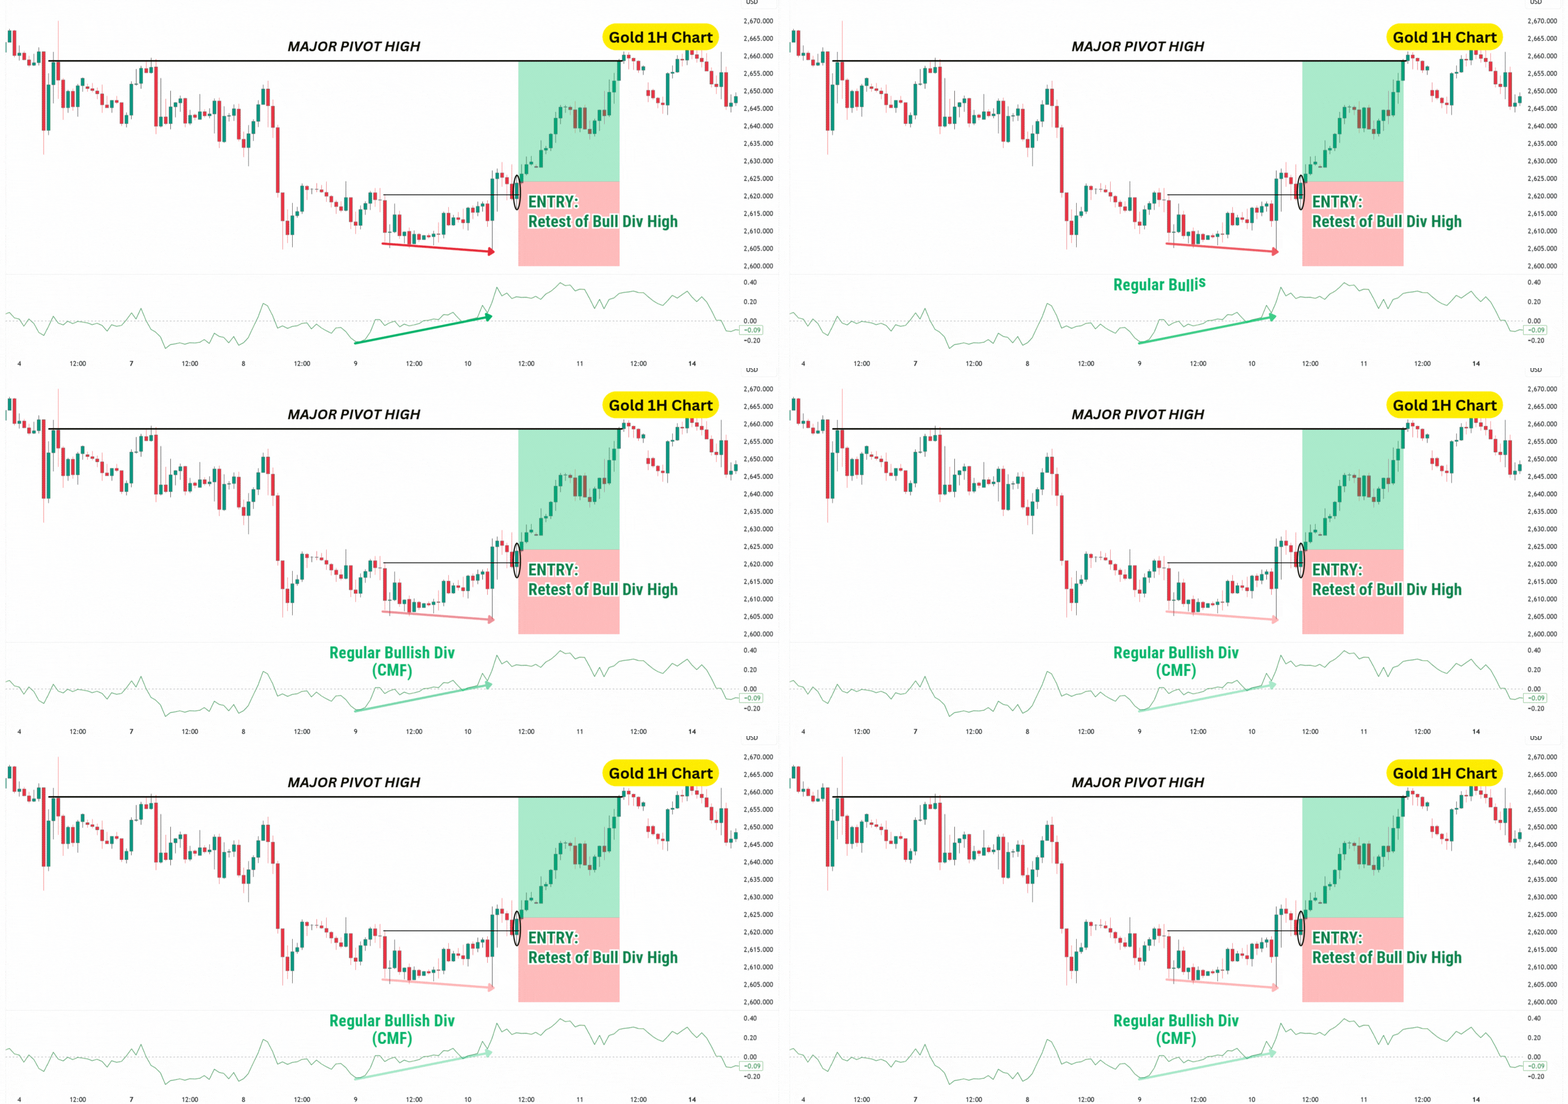
In this example, the breakout actually happened at the same time as the establishment of the regular bullish divergence. Fortunately, the price revisits the highest price point during the formation of the divergence, allowing us to enter a long trade when a successful retest – as indicated by a green candle close above the level, occurs.
Spot Bullish Divergence using Rate of Change
The Rate of Change (ROC) measures the speed of price changes over a set period, typically 9 candles, based on closing prices. Traders can also use “HLC3” (average of high, low, and close) to include price wicks to detect regular bullish divergence detection.
Key elements of the ROC you should know are:
- The ROC has a zero line which indicates no price changes.
- Above 0, it indicates positive price changes. Higher equals stronger bullish momentum.
- Below 0, it indicates negative price changes. Lower equals stronger bearish momentum.
- Unlike traditional oscillators, the ROC does not indicate oversold or overbought regions.
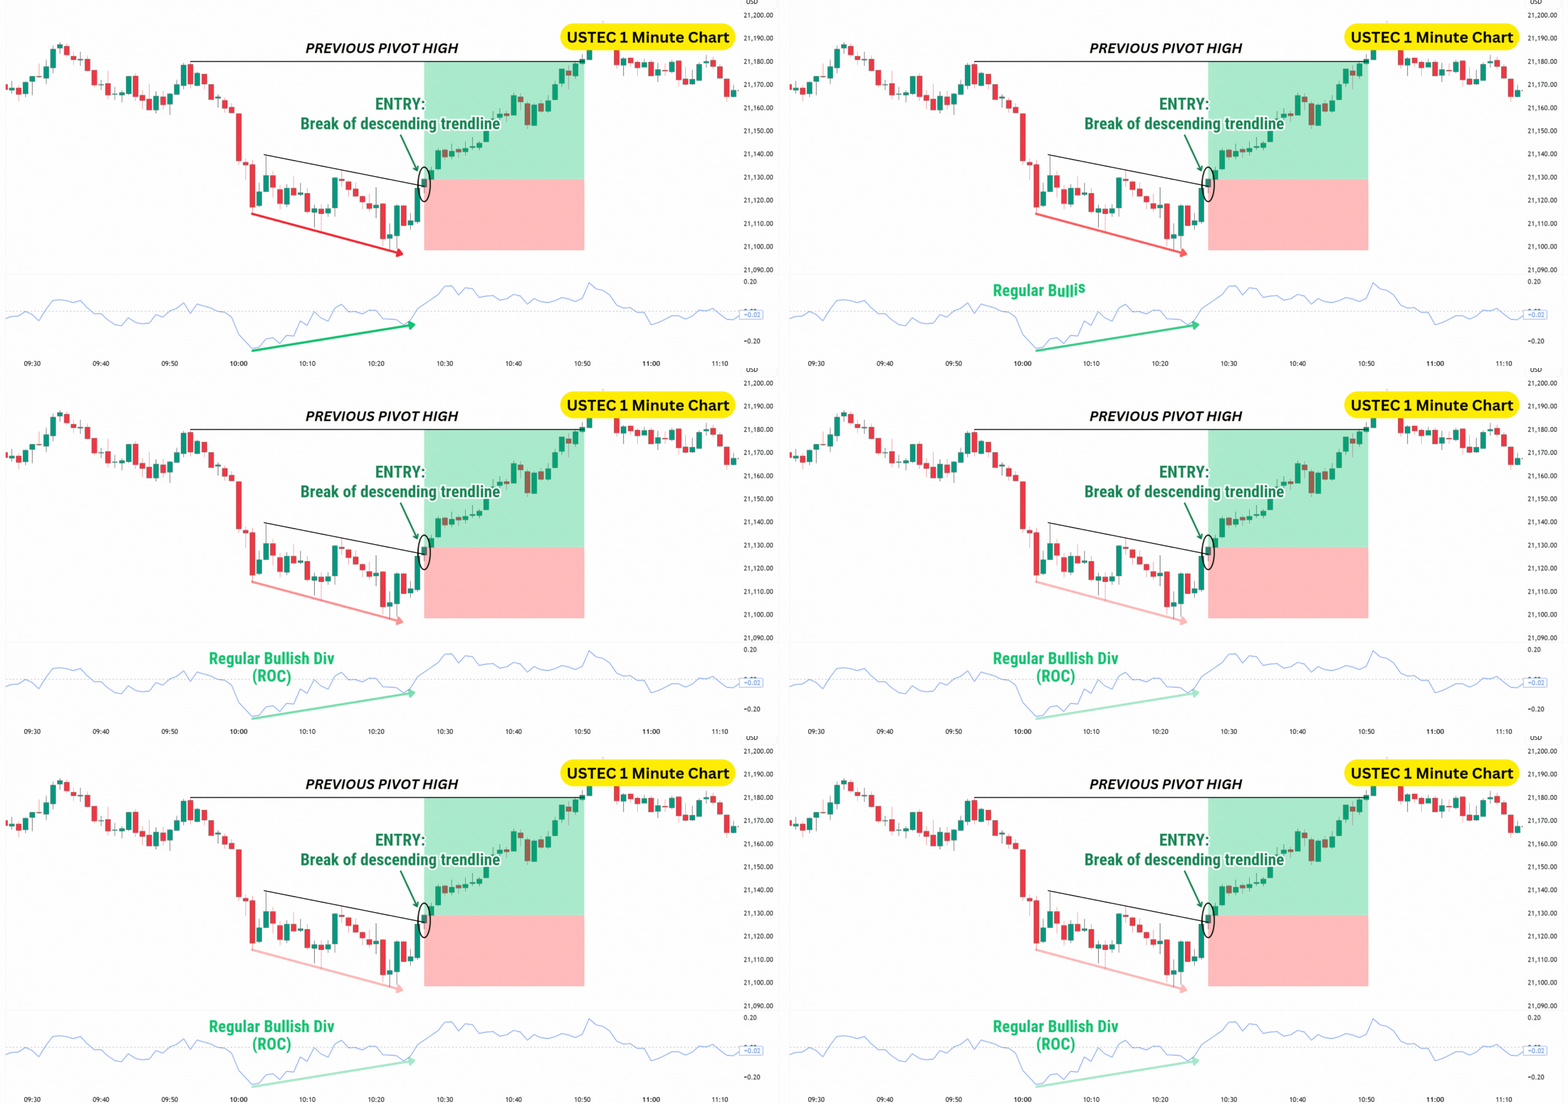
Again, it’s important to note that a divergence is not an entry signal by itself. You can use your own setups to search for a long trade around here, but two ways to do so on this chart are:
- Entering a long position when the descending trendline has been broken.
- Entering after the price closes above the highest point of the bullish divergence.
From there, target the previous pivot or resistance levels, or set your take profit to 1:2 risk-to-reward ratio.
Spot Bullish Divergence using Awesome Oscillator
The Awesome Oscillator (AO) is developed by Bill Williams, well-known trader and technical analyst, as part of his broader strategy to trading which he called: The Chaos Theory in Trading.
While we won’t be getting into his specific strategies for trading, we will be using his oscillator to find divergences in momentum and price.
The Awesome Oscillator works as such:
- Near the Zero Line: Indicates very low momentum.
- Above Zero Line: Indicates a positive price change.
- Below Zero Line: Indicates a negative price change.
- Green Bars: Price closed higher than its opening price.
- Red Bars: Price closed lower than its opening price.
To find a regular bullish divergence on EURUSD, we simply apply the same concept of a higher low on the indicator, and a lower low on the actual price of the asset. This signals weakening bearish momentum, providing us with better conditions for a reversal.
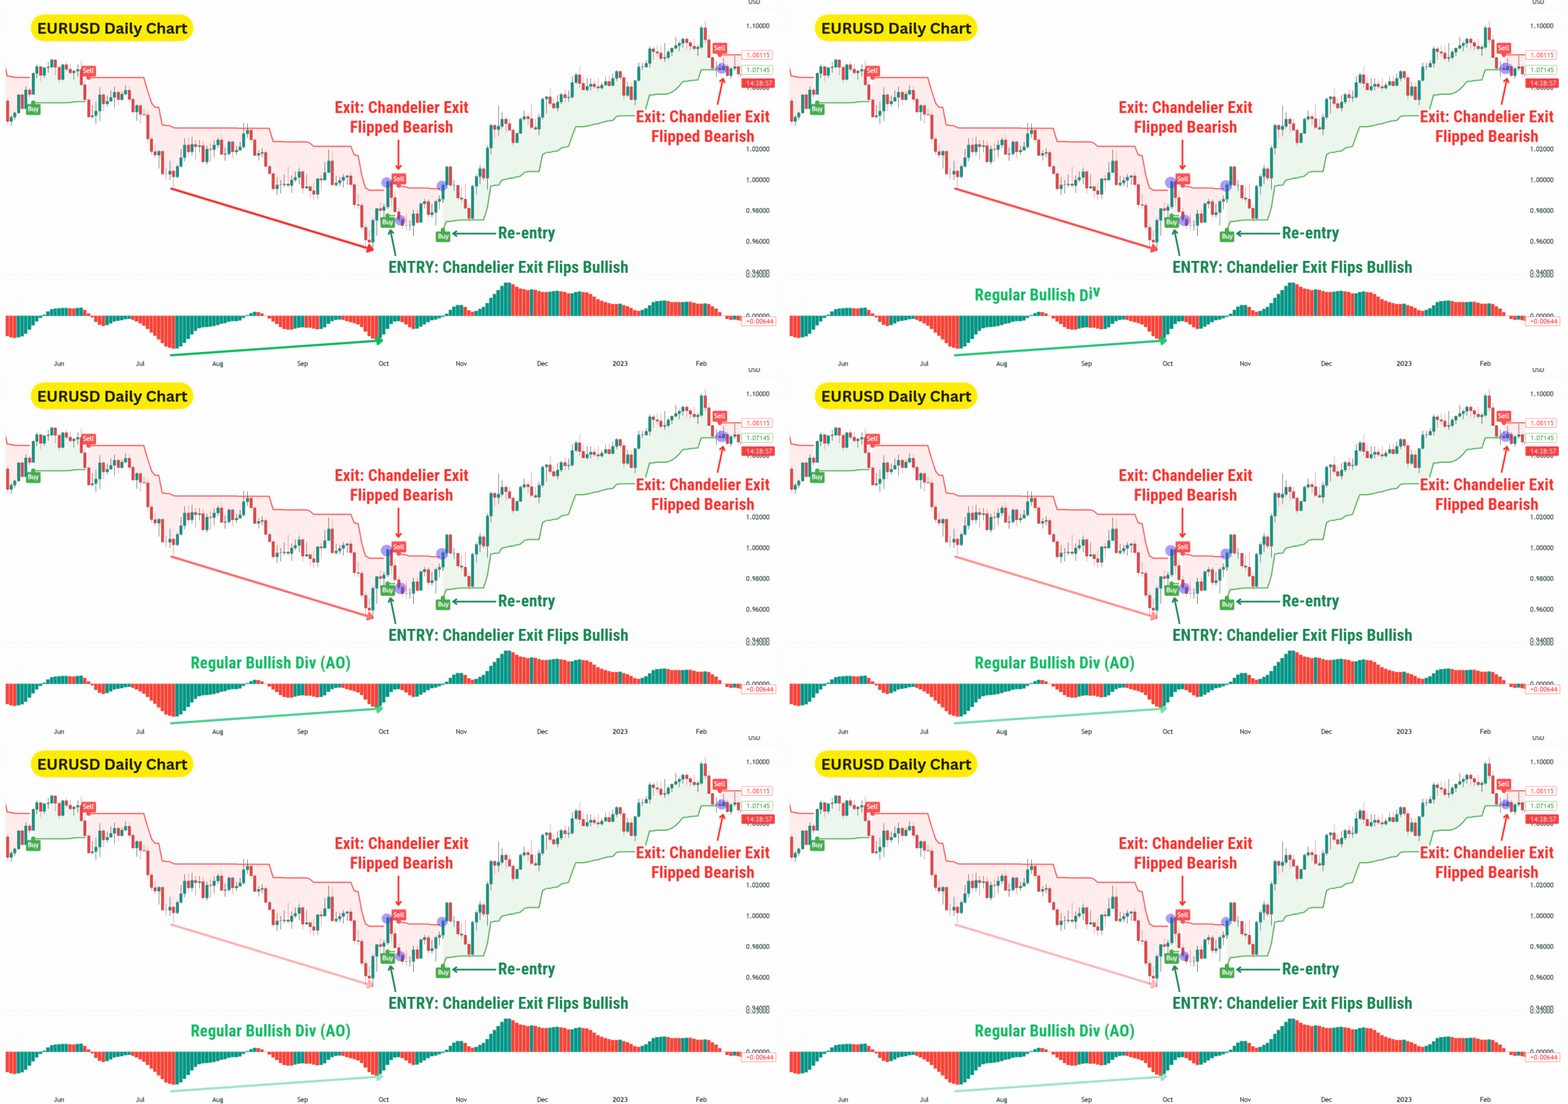
To have a little bit of fun with our final example here, we decided to also showcase the Chandelier Exit indicator. This is an indicator that specialises in showing you exit points for bullish or bearish trades.
By using the Chandelier Exit (CE), we can filter out when to avoid taking a long position, and time our entries better. When the CE flips green after our regular bullish divergence signal, we can enter a trend-following trade and exit when the CE flips red again.
Using this strategy, we were able to capture a smooth bullish reversal, albeit after getting stopped out – at a small loss – on our initial attempt.
Classes of Divergences
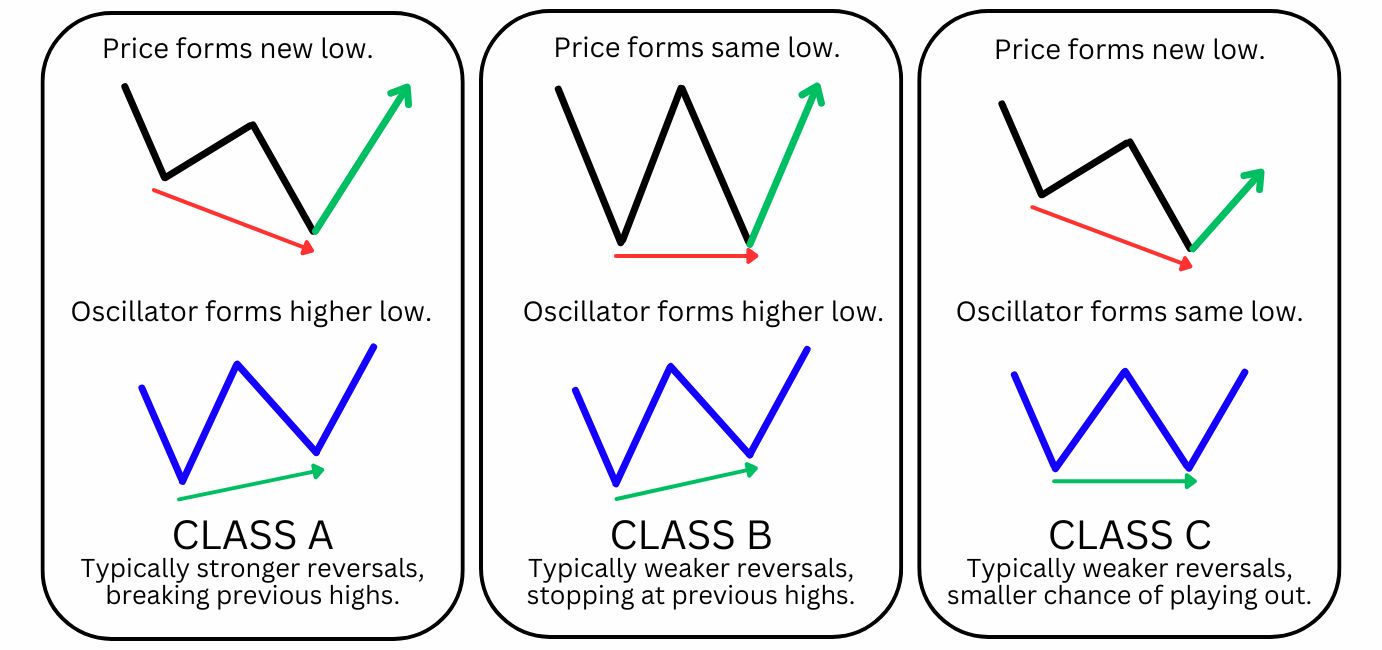
As you may have noticed by now, regular bullish divergences can result in varying degrees of a reversal. Some lead to weak reversals, stalling at previous highs or the highs formed during the formation of the divergence itself. Others manage to break through these highs and continue upward, potentially shifting the overarching market structure from a downtrend to an uptrend.
Traders can somewhat set outcome expectations by classifying divergences into three classes: Class A, Class B, and Class C, based on their visual identifiers and levels of strength.
- Class A: The strongest and often signals a sharp change in market direction. This occurs when price forms a new low, while the oscillator creates a clear higher low.
- Class B: Less strong and represent choppy market action. This occurs when price forms a double bottom, while the oscillator creates a clear higher low.
- Class C: The weakest class of divergences indicates a brief pause in the downtrend, and occurs when price forms a new low, while the oscillator creates a double bottom.
Advantages of Trading on the Bullish Divergences
The regular bullish divergence is a great tool in any traders’ toolbox, and should be considered a quintessential part of trading as it provides valuable insights into the market conditions.
Can provide a heads-up to look for a bullish reversal: The regular bullish divergence can provide early indications of a reversal, allowing traders to potentially get into a high probability trade.
Can provide exit signals for shorters: If you were in a short position, the bullish divergence would alert you to take profit at any indications of a reversal.
Easy to identify: The regular bullish divergence, unlike its hidden bullish divergence cousin, is actually relatively easy to find and compatible with many oscillators.
Disadvantages of Trading on the Bullish Divergence
Trading regular bullish divergences also comes with a set of disadvantages. However, it may be more appropriate to reframe these as considerations to take when trading the bullish divergence, as it is overall a great tool to include into your trading.
Should not be traded standalone: Many traders view bullish divergences as entry signals; they are not. Prices may continue to make lower lows, increasing the chance of hitting your stop loss.
Can result in weaker reversals that don’t change the trend: In a broader downtrend, a regular bullish divergence typically leads to a brief pullback or temporary reversal before the price resumes its broader downward movement.
Requires an understanding of the oscillator: The way each oscillator works will vary – some use “Closed” source, others use “HLC3”. Depending on the way the oscillators are calculated, the way you draw your divergence will either be from the wicks, or from the candle bodies.
Which indicator is best to trade with a Bullish Divergence?
The best indicators for spotting a regular bullish divergence are oscillators, as they show how fast the price is moving and hint at buying and selling pressure.
The most popular ones—RSI, MACD, and Stochastics—do the job well. Plus, RSI and Stochastics can give extra clues by showing when an asset might be overbought or oversold. Spotting a bullish divergence at these levels usually makes for a stronger setup than catching it at just any momentum level.
Ultimately, there is no best indicator among the oscillators for trading a regular bullish divergence. The accuracy of the divergence would depend on your trading strategy, timeframe, and chosen assets.
Bullish Divergence vs Bearish Divergence
There are two types of bullish and bearish divergences. The key difference is that bullish divergences suggest bearish momentum is fading, while bearish divergences point to weakening bullish momentum. Both signals hint that a reversal might be on the horizon, signalling it’s worth considering trades in the direction of the divergence’s bias.
Bullish Divergence vs Hidden Bullish Divergence
A regular bullish divergence is considered a bullish reversal signal, while a hidden bullish divergence is considered a continuation signal. This is because regular bullish divergences are commonly observed in local downtrends, while the hidden bullish divergence occurs when price is in a local uptrend.
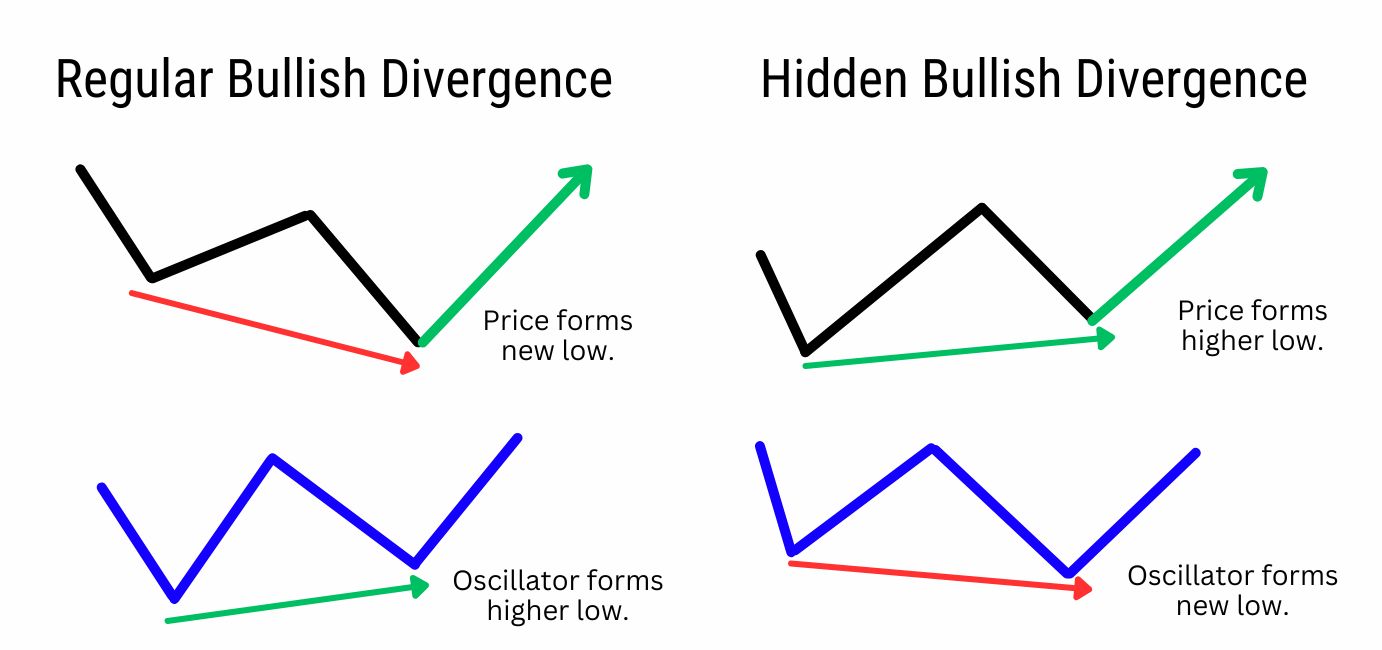
Regular bullish divergences have the price and oscillator moving into each other – with the price forming lower lows, while the oscillator forms higher lows.
Hidden bullish divergences on the other hand, have the price and oscillator moving apart from each other – with the price forming higher lows, while the oscillator forms lower lows.
Divergence Cheat Sheet
Use this divergence cheat sheet to identify the different divergences immediately.
FAQ
What timeframe is best for Bullish divergence?
The best timeframe for spotting bullish divergence depends on your trading goals. Shorter timeframes (e.g., 1-hour) can indicate quick reversals but are more prone to choppy price action – such as the price continuing to make lower lows while the indicator continues to form higher lows.
Longer timeframes (e.g., daily or weekly) provide stronger, more reliable divergence signals for larger trend changes. Generally, many traders find 4-hour and daily timeframes optimal for balancing signal strength and reliability. For scalp traders however, bullish divergences can be used to trade relatively small pip-movements and with higher frequency.
How does volume confirm divergence signals?
Volume can enhance the reliability of divergence signals by showing whether buying or selling interest supports the potential reversal. For instance, if a classic bullish divergence appears with increasing volume, it strengthens the case for a potential upward reversal, as it signals that more traders are stepping in to buy at the lows.
What are the common mistakes to avoid while trading divergence?
Common mistakes in divergence trading include using divergence as a standalone entry signal, ignoring other technical factors. Another pitfall is trading divergences on low timeframes, as they tend to be choppy and give false signals (or small reversals). Additionally, it’s risky to overlook the overall market trend and structure, as it’s more likely for the broader trend to continue in its direction until it’s broken. This added nuance will allow traders to set realistic take profits for the reversal, not giving away a winning trade.
What happens when there is divergence on the RSI?
When the RSI shows a divergence with price, it indicates a potential shift in momentum. For example, a classic/regular bullish divergence suggests selling pressure may be slowing down, creating favourable conditions for a bullish reversal. However, traders should still trade a long position using proper risk management, strategic setups, and also identify other technical indications to improve their odds.
How many types of divergence are there?
There are four main types of divergence: regular bullish, regular bearish, hidden bullish, and hidden bearish. Each type signals different potential outcomes, with regular divergences hinting at trend reversals and hidden divergences hinting at trend continuation.
What is Bullish Regular Divergence?
Bullish regular divergence occurs when the price forms lower lows, but the oscillator (like RSI) forms higher lows, indicating that bearish momentum is decreasing. This divergence suggests that seller funds are potentially exhausted, and a possible upward reversal becomes more likely.
How reliable is the Bullish Divergence?
The reliability of bullish divergence varies by asset, timeframe, and market conditions. While it can be a useful early indication of a reversal, we recommend using additional technical indications such as support levels, descending trendlines, or other trend indicators to confirm the reversal. Doing so can improve the reliability of the bullish regular divergence signal.
What is the success rate of divergence?
The success rate of divergence is not a straightforward question to answer. It all depends on factors like the chosen timeframe, market type, and how you are confirming your reversal trade. Additionally, the oscillator used will directly affect your success rate; as each indicator has their own calculation method. Ultimately, the success rate comes down to the strategic setups you use for trading, and whether or not it’s suitable for the asset you’re trading.
Can bullish divergence be used in all types of markets?
Yes, bullish divergence can be used in most types of markets, including stocks, forex, and commodities. However, its effectiveness varies, as divergence works best in liquid markets and can be less reliable during highly volatile periods or in thinly traded assets.
How can I combine bullish divergence with other trading strategies?
Bullish divergence pairs well with trendline breaks, moving averages, and support/resistance levels. For instance, after spotting divergence, some traders wait for a moving average crossover or a break above a trendline to confirm entry. Adding such strategies can increase the probability of a successful trade.
Can a bullish divergence occur in both uptrends and downtrends?
Yes, a bullish divergence can appear in both uptrends and downtrends. It depends on how you define an uptrend or downtrend as well, as downswings during a broader uptrend can be considered a local downtrend. Typically, a regular/classic bullish divergence is more relevant in a downtrend, while a hidden bullish divergence is more relevant in an uptrend.
Does MACD give false signals?
Yes, the MACD can occasionally produce false signals, especially during sideways markets or low volatility periods. Using MACD divergence with other indicators or waiting for price action confirmation can help filter out weaker signals.
Which is more accurate RSI or MACD?
Both RSI and MACD have strengths: RSI is excellent for overbought/oversold levels, while MACD is known for signalling momentum changes and trend shifts. The choice depends on trading style, as combining them can offer a fuller picture of market conditions.


