


Written by:

Reviewed by:

Bullish
- September 9, 2024
- 19 min read
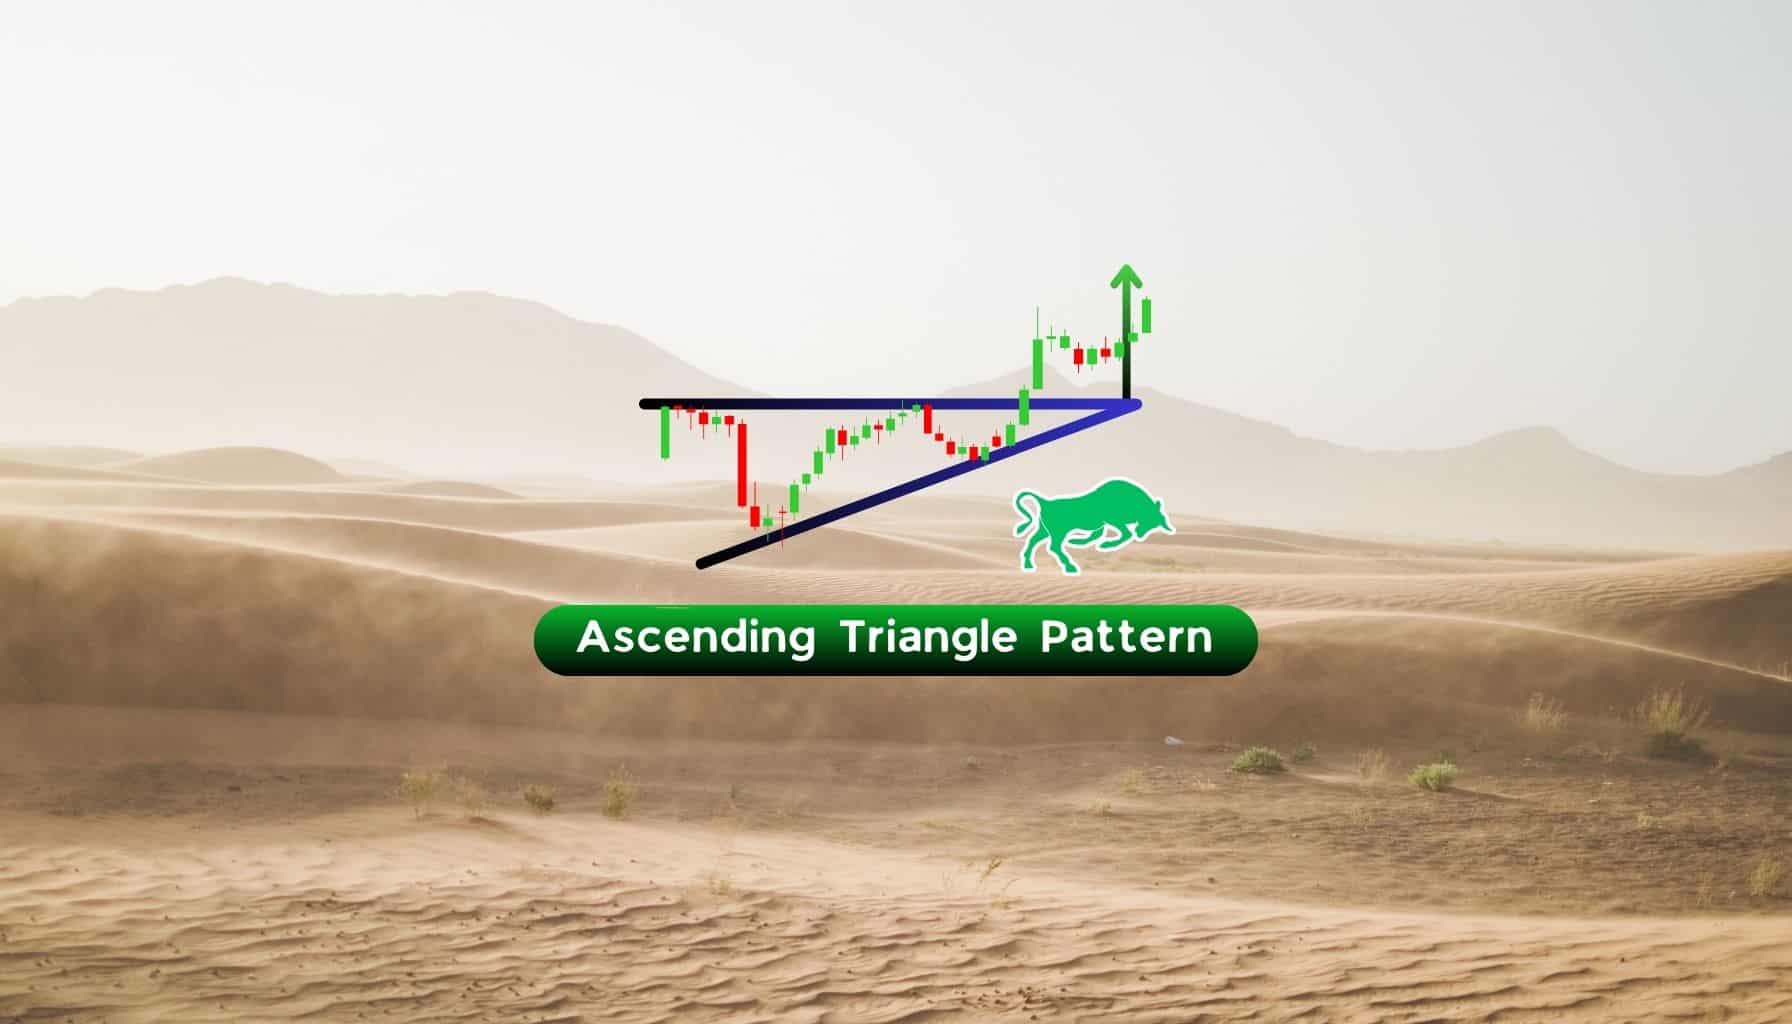
Ascending Triangle: How to Spot and Trade This Bullish Pattern
What is an Ascending Triangle Pattern?
An ascending triangle chart pattern is used in technical analysis which takes the shape of a triangle with a flat top and upward sloping bottom that signals a bullish continuation. The pattern is commonly spotted in stocks, cryptocurrencies, and other financial markets.
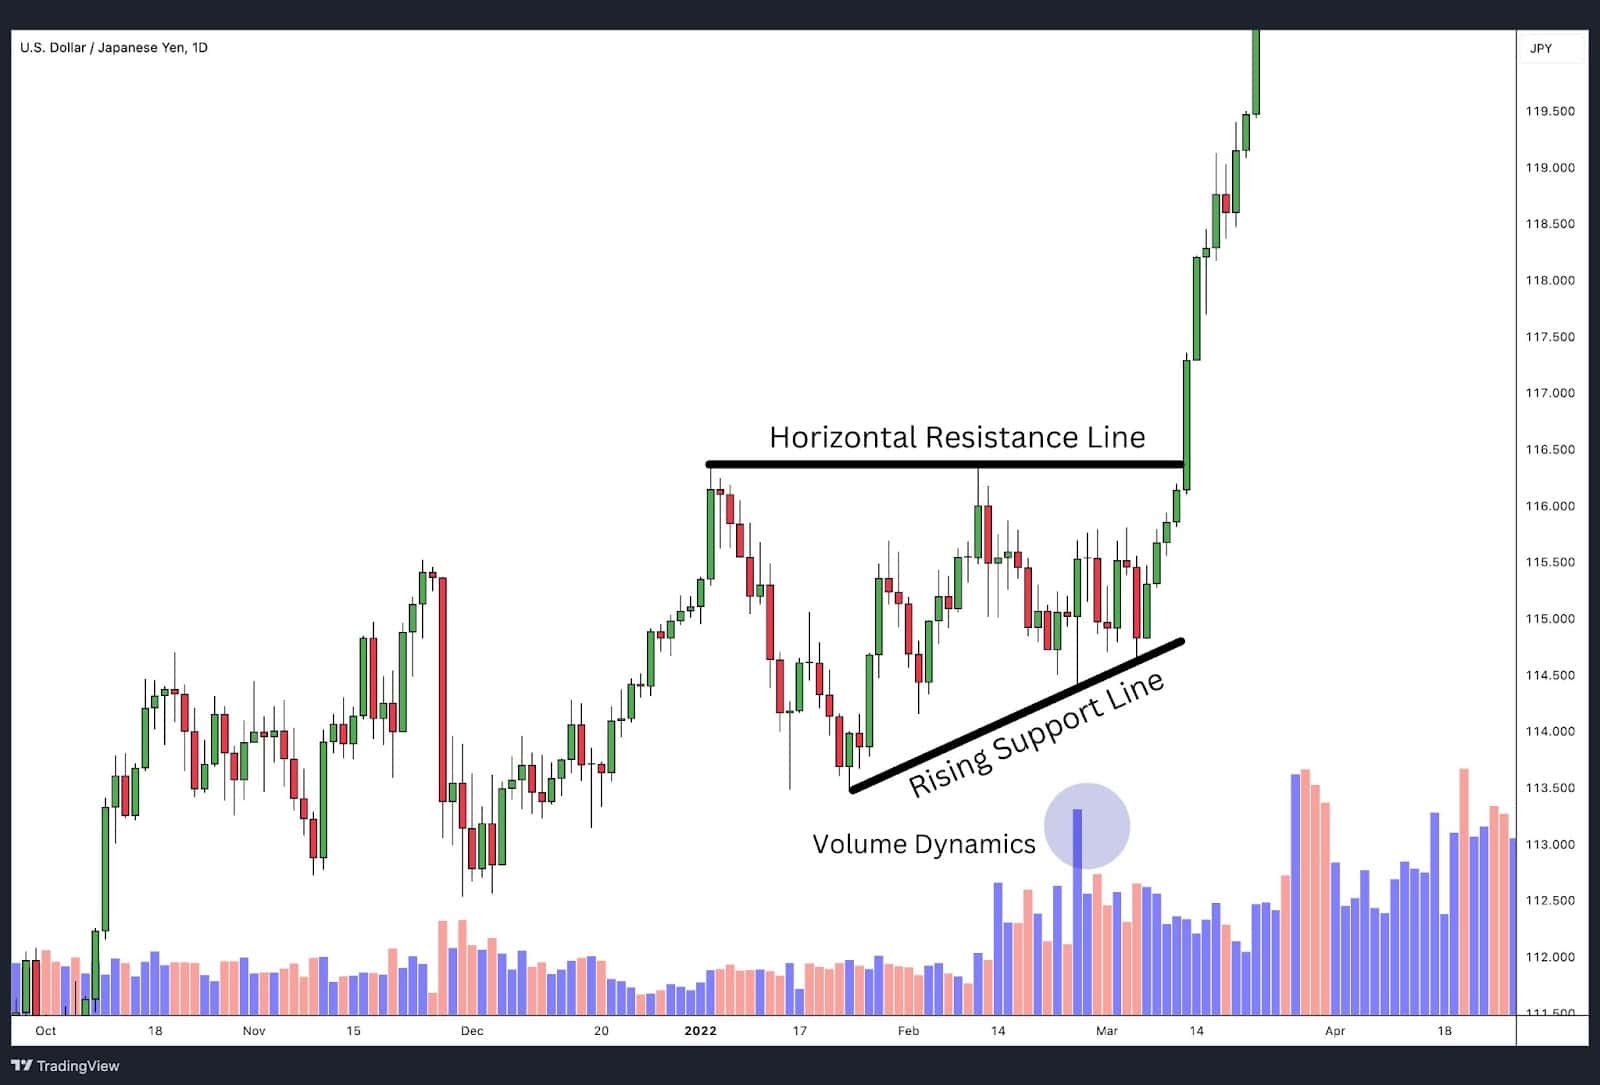
Ascending triangles form by drawing a horizontal line along the highs, which acts as a resistance level, and an ascending line along the lows that serves as a support level. The key characteristic of this pattern is that the lower trendline slopes upward, indicating increasing buying pressure over time.
Key Characteristic of Ascending Triangle Pattern
The ascending triangle pattern is a bullish technical analysis formation characterised by:
- Horizontal Resistance Line: This line is drawn on top of the highs, indicating a strong level of selling pressure that the price repeatedly fails to break.
- Rising Support Line: The lower trendline slopes upward, reflecting higher lows, waning sell interest, and growing buying interest.
- Consolidation: The price moves within a narrowing range, showing a balance between buyers and sellers before a potential breakout.
- Volume Pattern: Typically, volume decreases during the formation, with a surge upon breakout, confirming the move.
What Does the Ascending Triangle Indicate?
An ascending triangle pattern typically signals a bullish continuation in an uptrend. It indicates increasing buying pressure as the price makes higher lows, while the upper resistance line remains steady. This pattern suggests that the bulls are gaining strength, preparing for a potential breakout above the upper trendline. The breakout is often accompanied by increased volume, confirming the bullish sentiment. This pattern is widely used by traders to identify possible entry points for long positions.
How to Identify the Ascending Triangle Pattern?
An ascending triangle pattern is a bullish continuation chart pattern that traders can identify by:
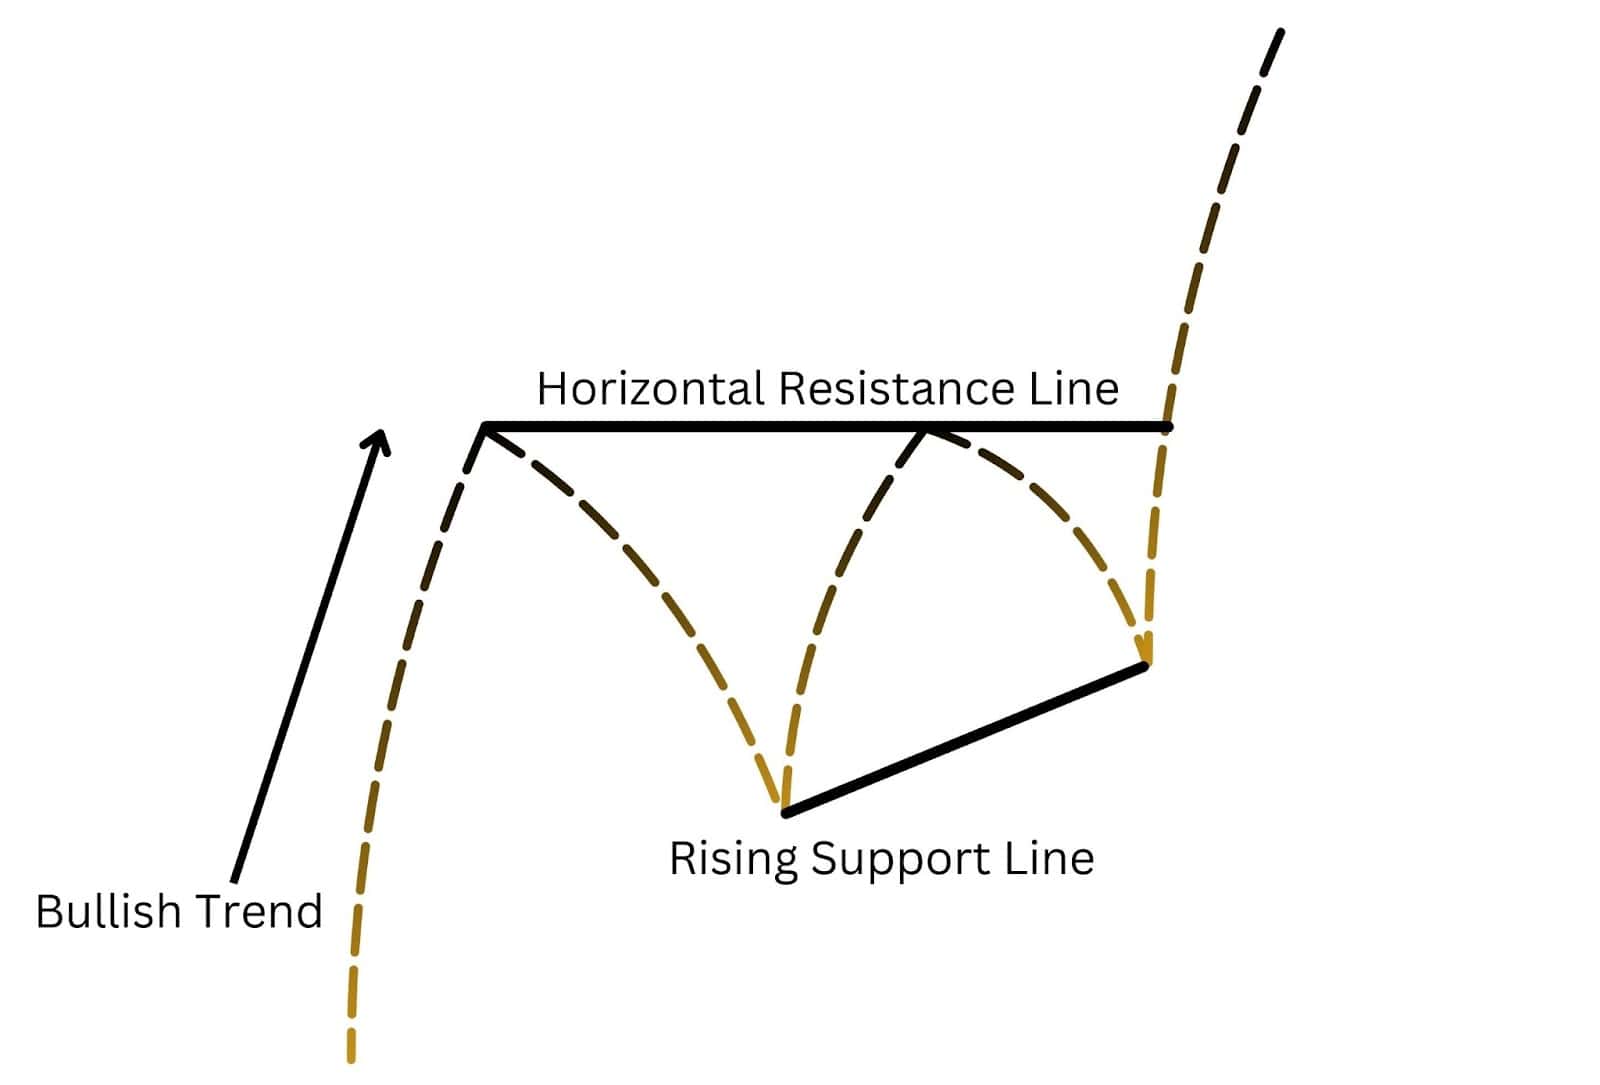
- Previous Bull Trend: This pattern typically forms during an ongoing uptrend, indicating a continuation of the bullish market sentiment. Ensuring there is a preceding uptrend is crucial for confirming the pattern’s bullish nature.
- Horizontal Resistance Line: This line connects a series of highs occurring at approximately the same price level, forming a flat upper boundary. It indicates a strong resistance area that the price has failed to surpass.
- Rising Lower Trendline: An upward-sloping support trendline drawn across a series of higher lows, demonstrating increasing buying pressure as buyers enter the market at progressively higher prices.
- Convergence Point: The two trendlines converge towards each other, creating the triangle shape. This convergence suggests a buildup of market tension, often leading to a significant breakout.
Note: Look for at least two to three common points to draw each of the resistance and support trendlines.
Importance of Ascending Triangle Pattern
The ascending triangle pattern is crucial for traders as it serves as an effective gatekeeping tool, allowing them to enter a bullish market trend at an appropriate time. This pattern indicates a period of consolidation, often preceding a breakout, which suggests that a significant price movement is likely.
When identifying this pattern, traders can anticipate market consolidation to be temporary and prepare to position themselves for an ensuing upward trend. The pattern’s structure of rising lows against a flat resistance line reflects increasing support of buyers, offering a clear signal for entry and exit points.
Ascending Triangle Examples
Example 1: Amazon (AMZN)
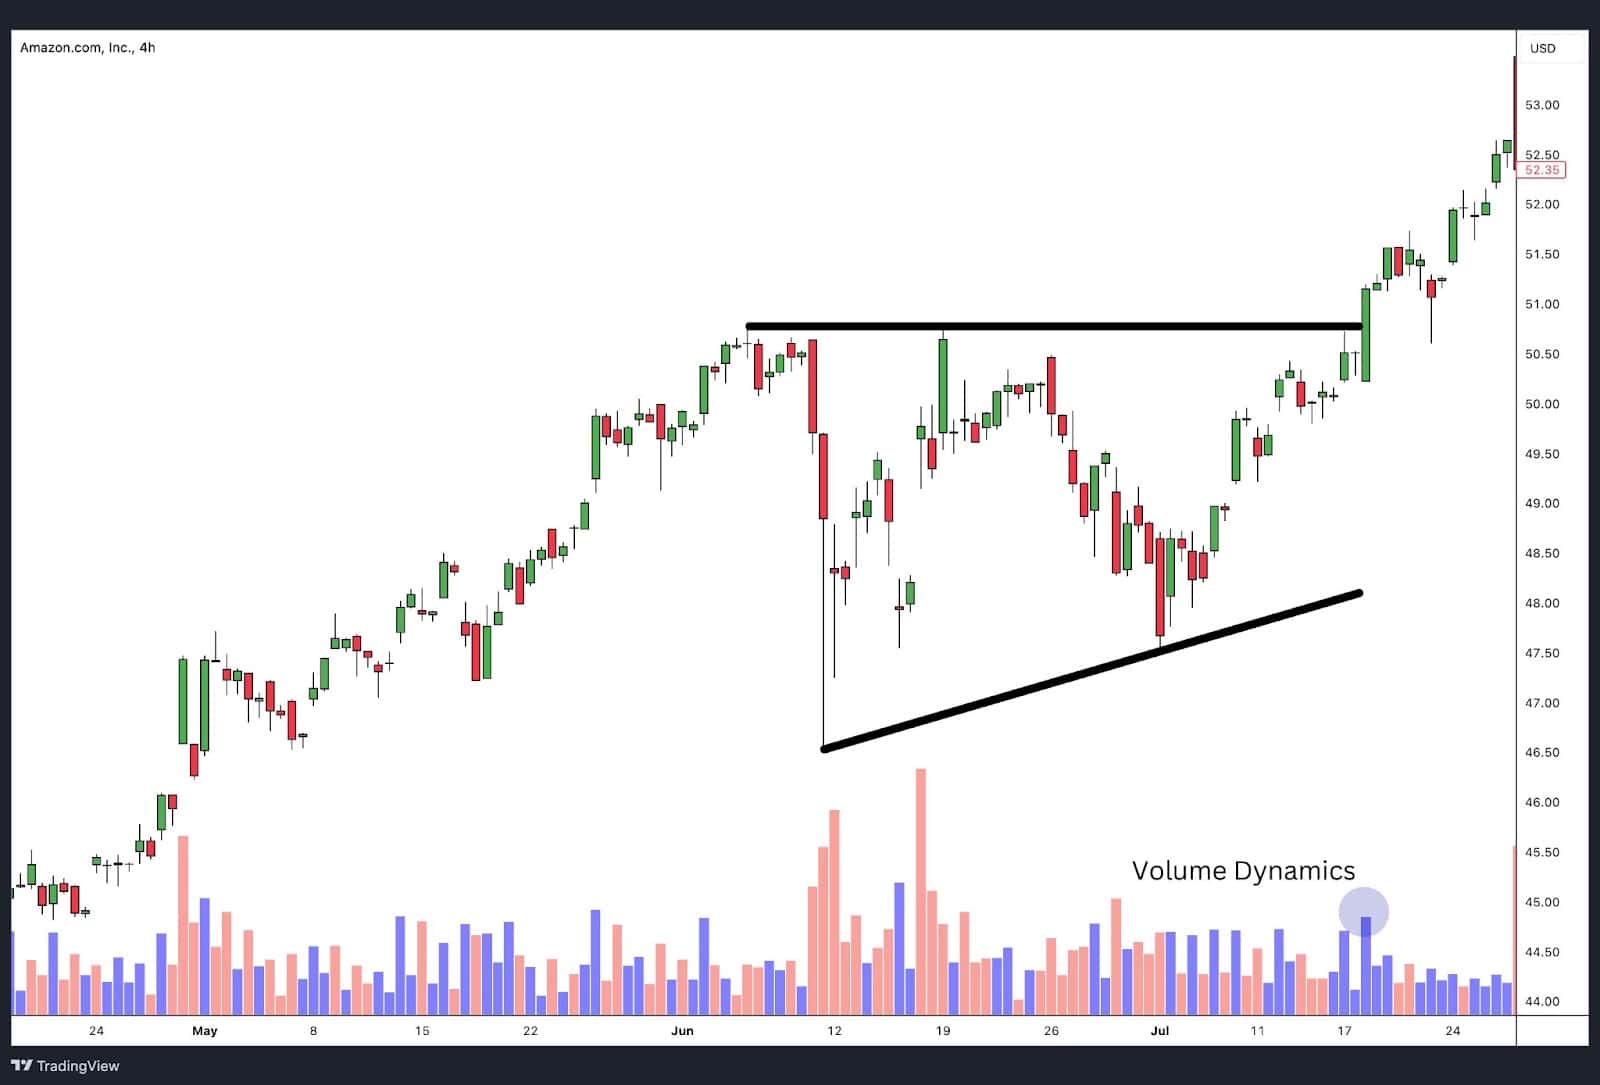
Chart Overview: The first image displays Amazon’s price movement forming an ascending triangle. The chart shows a horizontal resistance line at approximately $51 and a rising trendline around $48.50.
Key Features:
- Previous Bull Trend: The pattern forms during an ongoing uptrend, suggesting continuation.
- Horizontal Resistance: Multiple attempts to break above $51 were unsuccessful, indicating strong selling pressure.
- Rising Support: Higher lows show increasing buyer interest.
- Volume Dynamics: A decrease in volume during the pattern’s formation, followed by a surge, confirming the breakout above the resistance line.
Eventually, price breaks above resistance, in the same direction as the previous bullish trend.
Example 2: Apple (AAPL)
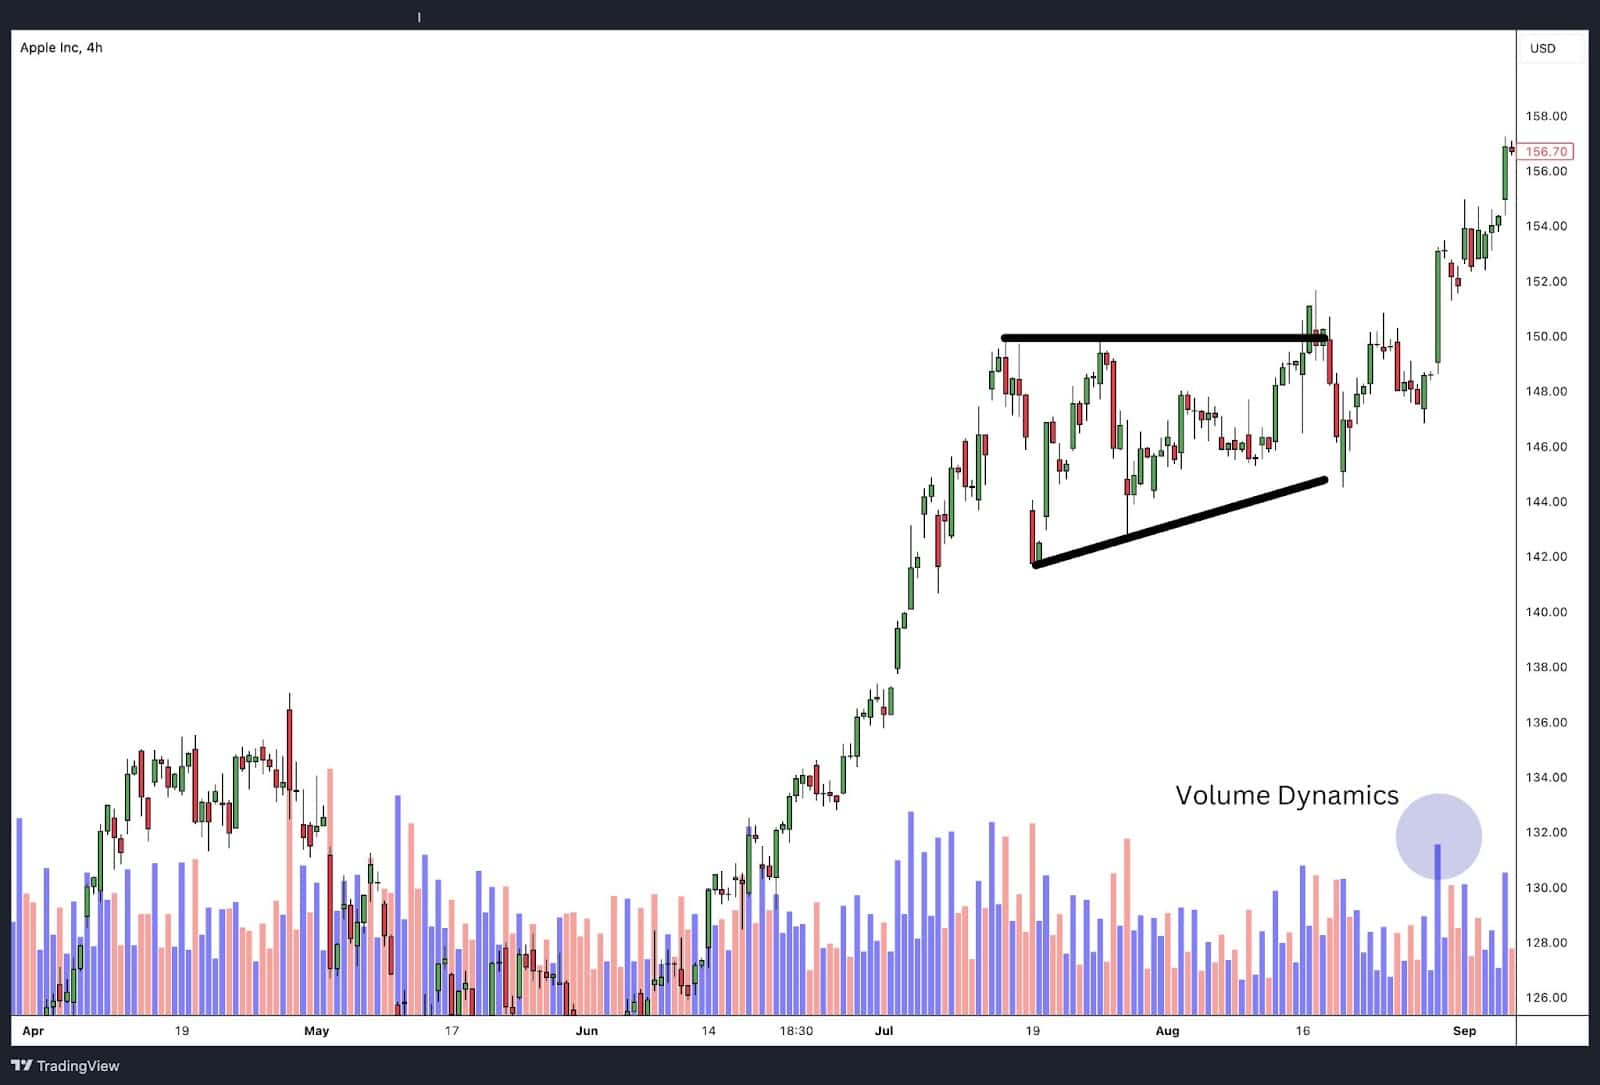
Chart Overview: The second image illustrates Apple’s price action forming another ascending triangle. The horizontal resistance line is drawn around $152, while the rising support line is near $144.
Key Features:
- Previous Bull Trend: The pattern forms during an ongoing uptrend, suggesting a continuation breakout.
- Horizontal Resistance: The price repeatedly hits the $152 mark, facing resistance.
- Rising Support: The series of higher lows indicates growing buying pressure.
- Volume Dynamics: Similar volume behaviour with decreased activity during the triangle formation, followed by a spike, which supports the breakout above the $152 resistance.
The pattern completes and an upside breakout appears, confirmed with increasing volume.
Ascending Triangle Pattern Trading Strategies
Trade the Ascending Triangle based on Support and Resistance Level
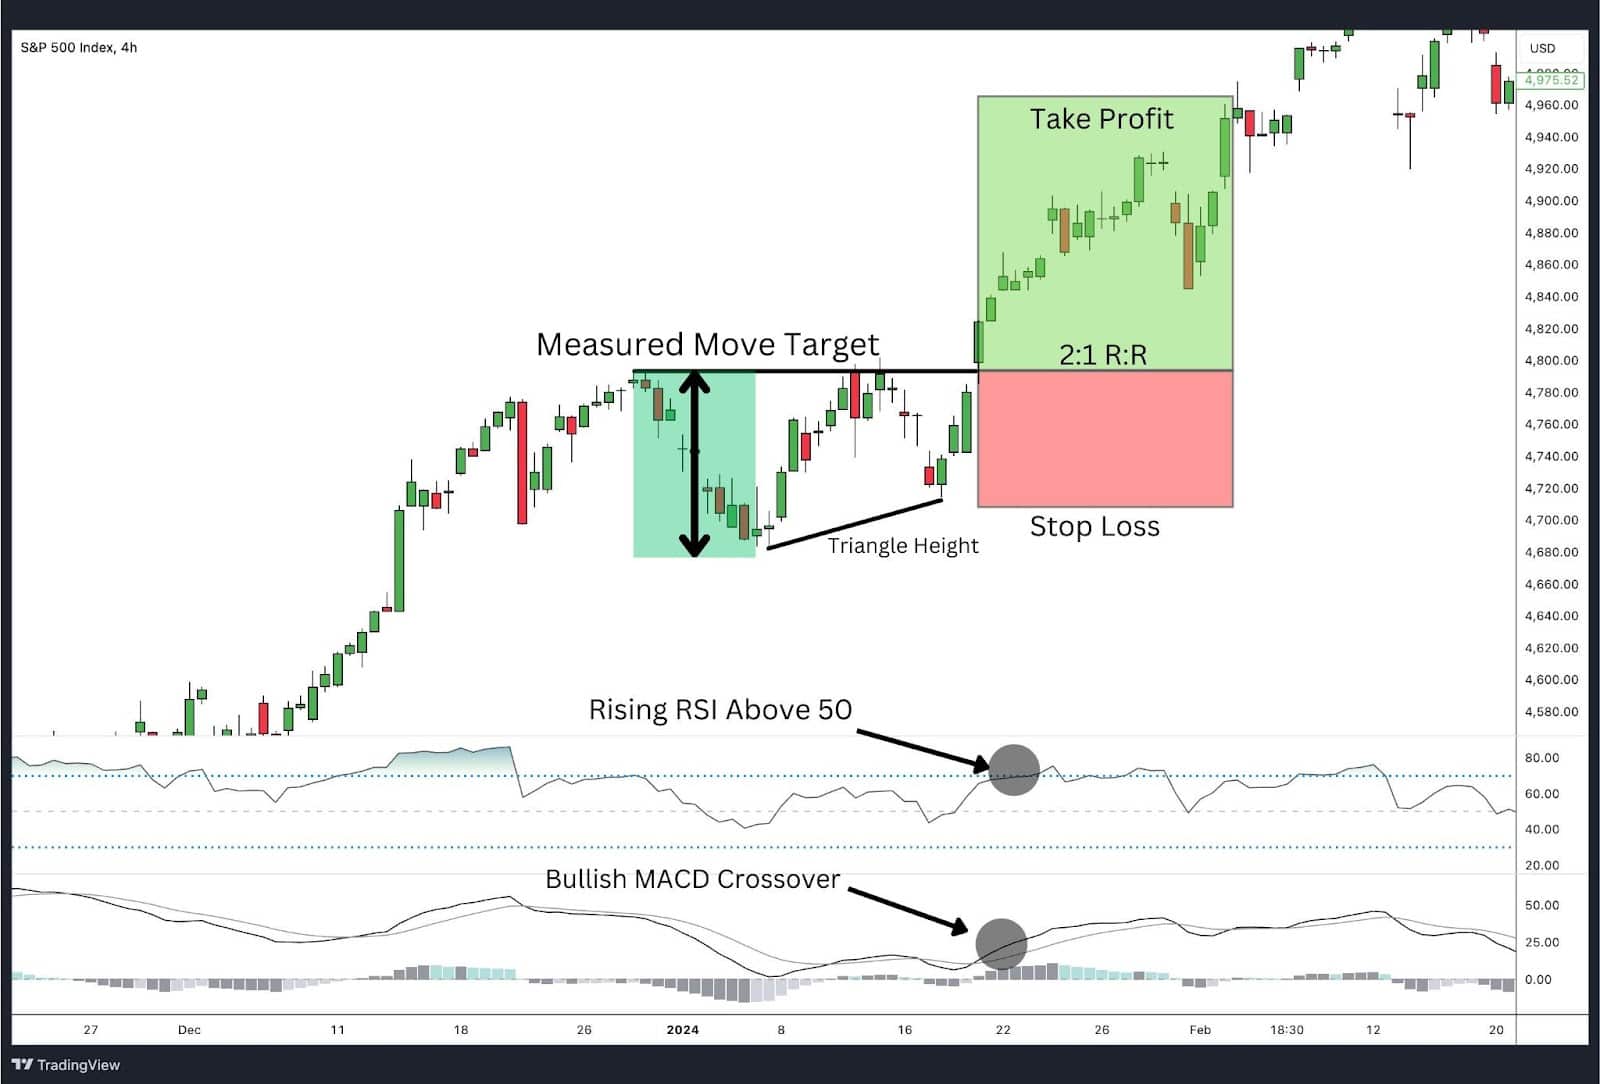
The ascending triangle pattern provides traders with a clear framework for making informed trading decisions. This strategy leverages the pattern’s support and resistance structure to provide a clear entry point, profit target, and stop loss level.
Entry Point: Enter the trade when the price breaks above the horizontal resistance line, confirmed by a significant increase in volume. This breakout indicates strong bullish momentum.
Take Profit: Measure the height of the triangle (the distance between the horizontal resistance and the ascending support line). Project this distance upwards from the breakout point to set a realistic take profit level. The projection helps in setting a target based on the pattern’s dimensions, ensuring a systematic approach to profit-taking.
Stop Loss: Place the stop loss just below the last swing low within the triangle. This minimises potential losses if the breakout turns out to be false.
Risk-Reward Ratio: Aim for a risk-reward ratio of at least 1:2. This means that for every dollar risked, the potential reward should be at least two dollars, ensuring that the trade is worth the risk.
Additional Indicators: Use indicators like the Relative Strength Index (RSI) to confirm bullish momentum. One of the uses of RSI is to determine trend direction as an RSI value above 50 indicates a bullish trend. Therefore, when RSI is above 50 on the breakout, it hints the breakout may continue higher.
Likewise, you can use the Moving Average Convergence Divergence (MACD) to verify the strength of the breakout. If the MACD line crosses above the signal line, it indicates underlying strength and that the breakout may follow through to the upside.
Trading the Ascending Triangle Conservative Approach
The conservative approach to trading the ascending triangle involves waiting for additional confirmation after the initial breakout. This method reduces the risk of entering on a false breakout and provides a higher probability of success.
Entry Point: Instead of entering immediately at the breakout, wait for a pullback to the previous resistance level, which now acts as support. Enter the trade if the price successfully retests this new support level.
Take Profit: Similar to the standard approach, use the height of the triangle to set the take profit level above the breakout point. This ensures that the target is realistic and based on the pattern’s structure.
Stop Loss: Place the stop loss below the new support level (previous resistance). This provides additional confirmation that the breakout is valid and minimises the risk of false breakouts.
Risk-Reward Ratio: Maintain a risk-reward ratio of at least 1:2, ensuring that the potential reward justifies the risk taken.
Potential Bullish Signals of an Ascending Triangle Pattern
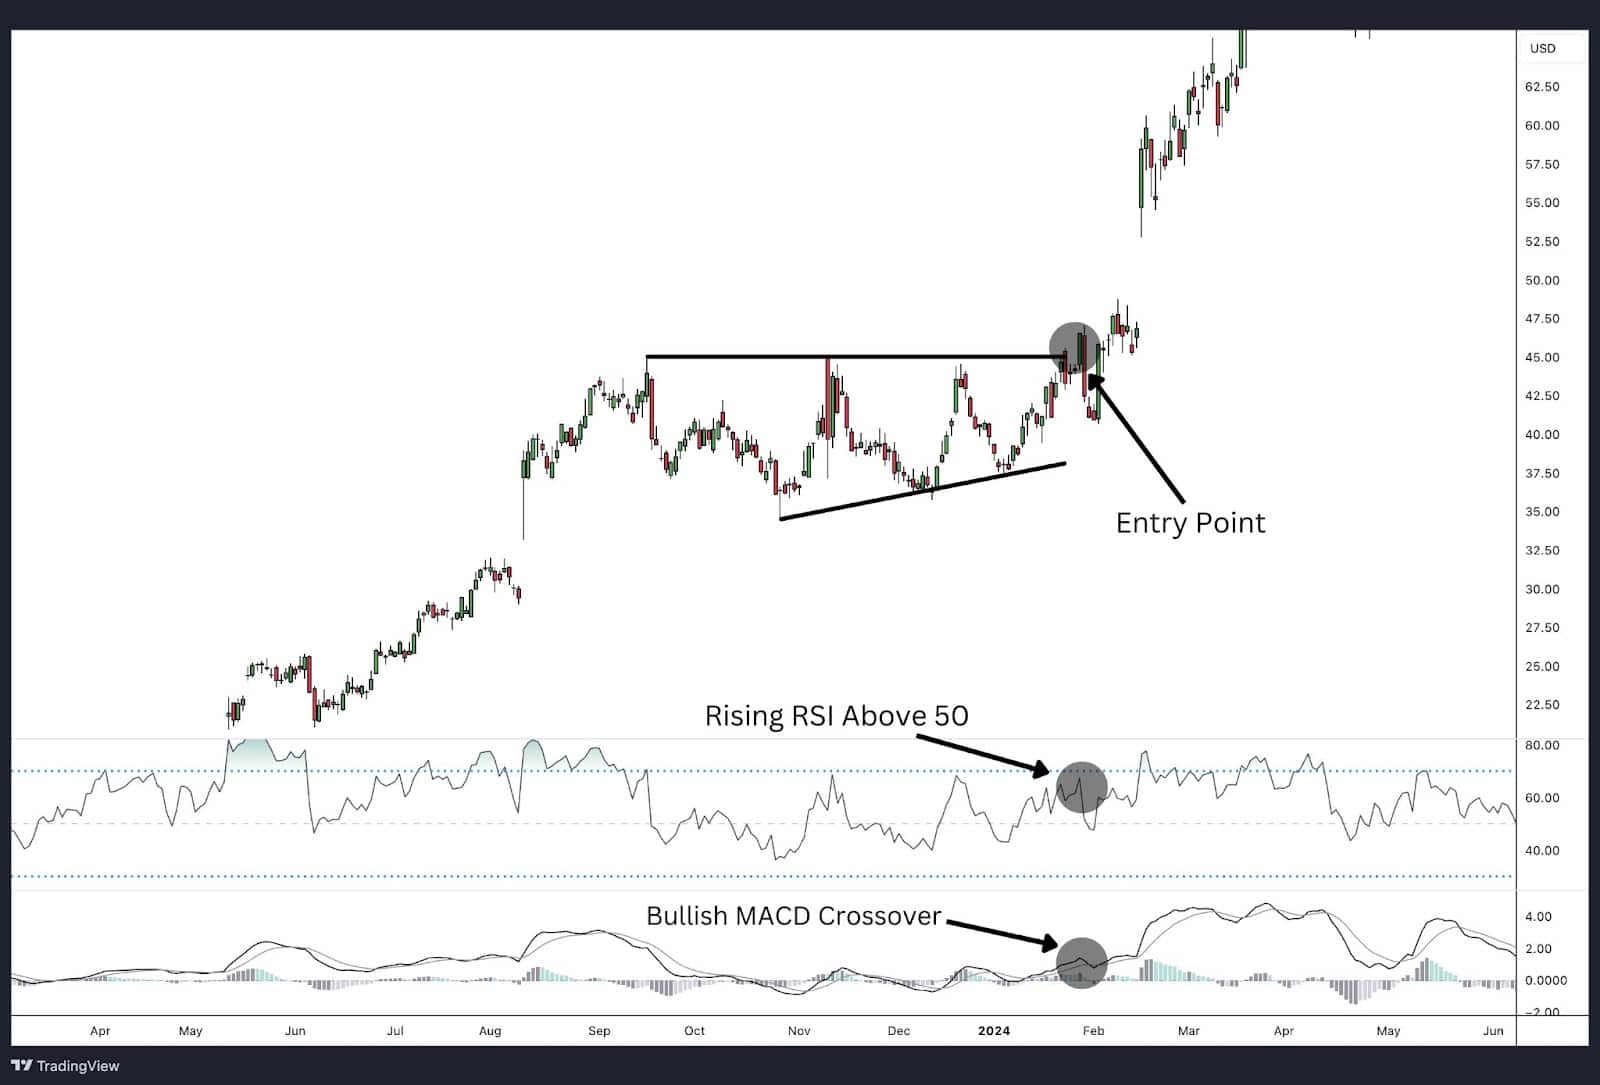
Identifying bullish signals within an ascending triangle pattern can help traders increase the likelihood of a successful breakout and continuation of the uptrend.
Technical Setup: Prior to the triangle consolidation, make sure the market is in an uptrend with a series of higher highs and higher lows. As the triangle pattern takes shape, look for a series of horizontal highs and higher lows leading up to the breakout. This technical pattern suggests increasing buying pressure and potential for sustained upward movement.
Bullish Confirmation: A clear breakout above the horizontal line, accompanied by increased volume, is a strong bullish signal. This indicates that buyers are gaining control and the price is likely to continue upward.
Additional Confirmation: Use momentum indicators like the Relative Strength Index (RSI) and MACD to confirm the strength of the bullish trend. A rising RSI above 50 and a bullish MACD crossover can reinforce the bullish outlook.
Potential Bearish Signals of an Ascending Triangle Pattern
While the ascending triangle is typically bullish, there are scenarios where it can signal bearish trends, especially if the breakout fails.
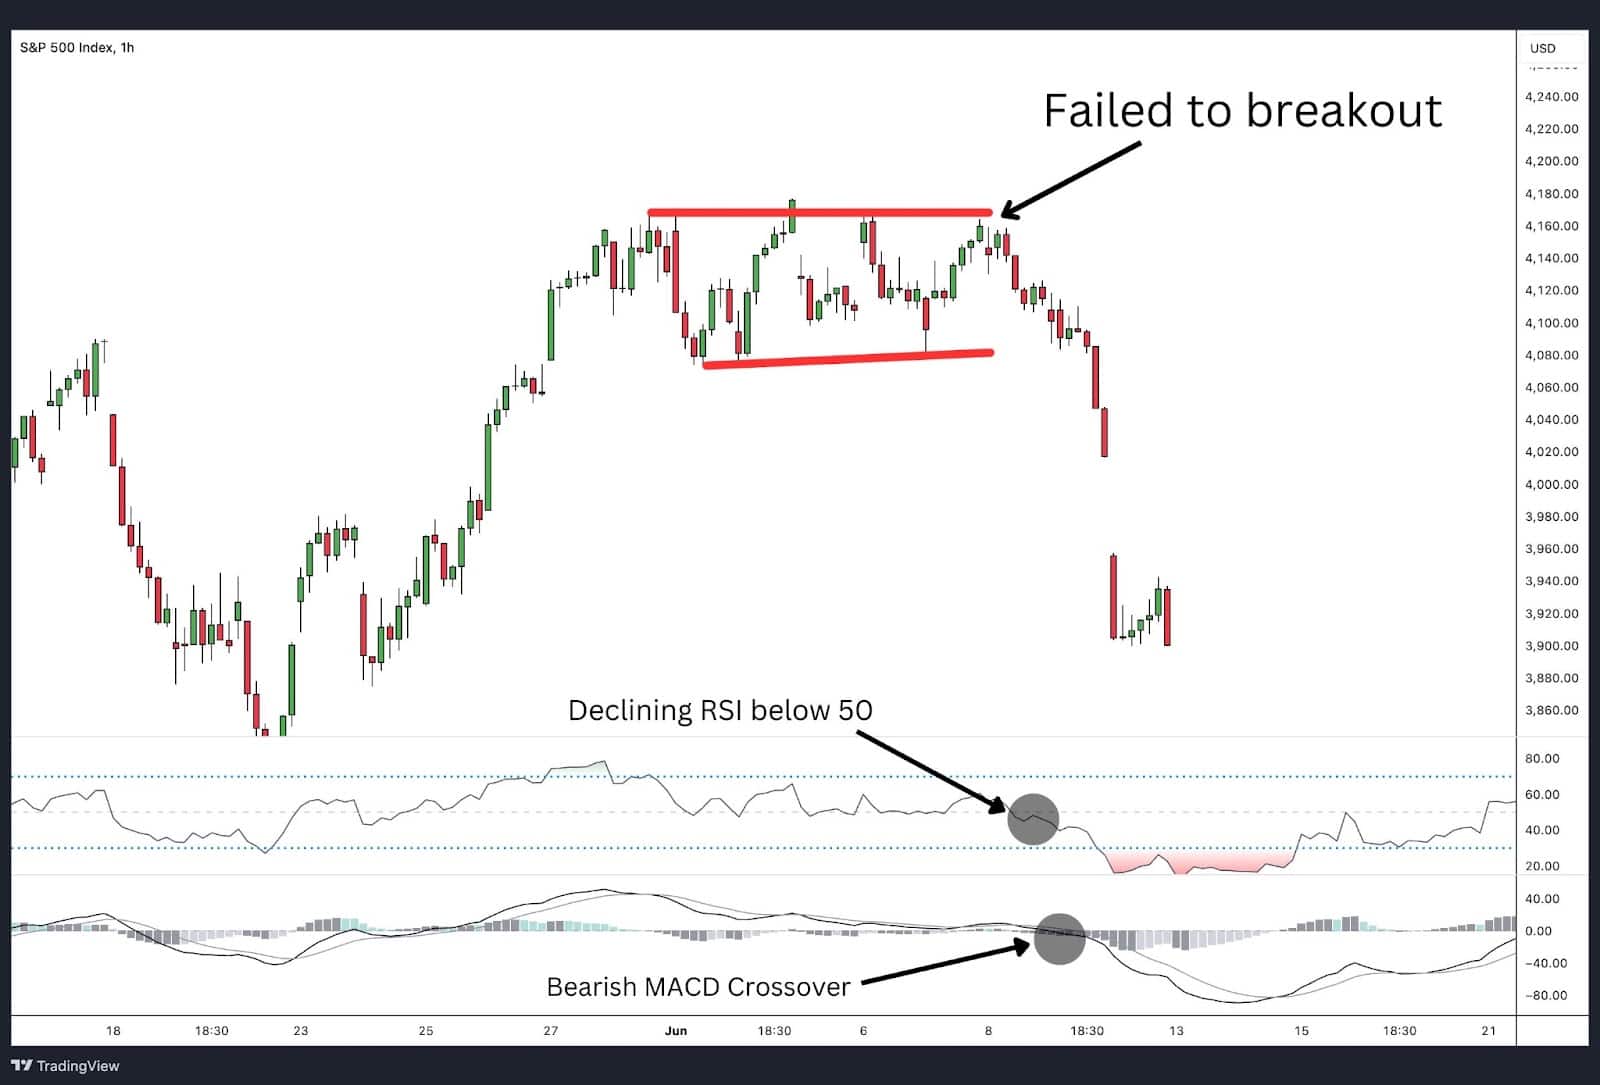
False Breakouts: Be cautious of false breakouts where the price briefly moves above the resistance but quickly falls back within the triangle. This can be confirmed by low volume during the breakout and subsequent bearish signals.
Swing Failure: If the price fails to break above the resistance and starts forming lower highs, it might indicate weakening bullish momentum and potential for a bearish reversal.
Indicators: Monitor the RSI for bearish trend when the value falls below 50 and when the MACD experiences a bearish crossover. This combination can signal weakening bullish momentum and increase the chances of a bearish trend reversal.
Risk Management: Always use stop losses to protect against unexpected market movements. Place the stop loss just above the false breakout point to minimise potential losses.
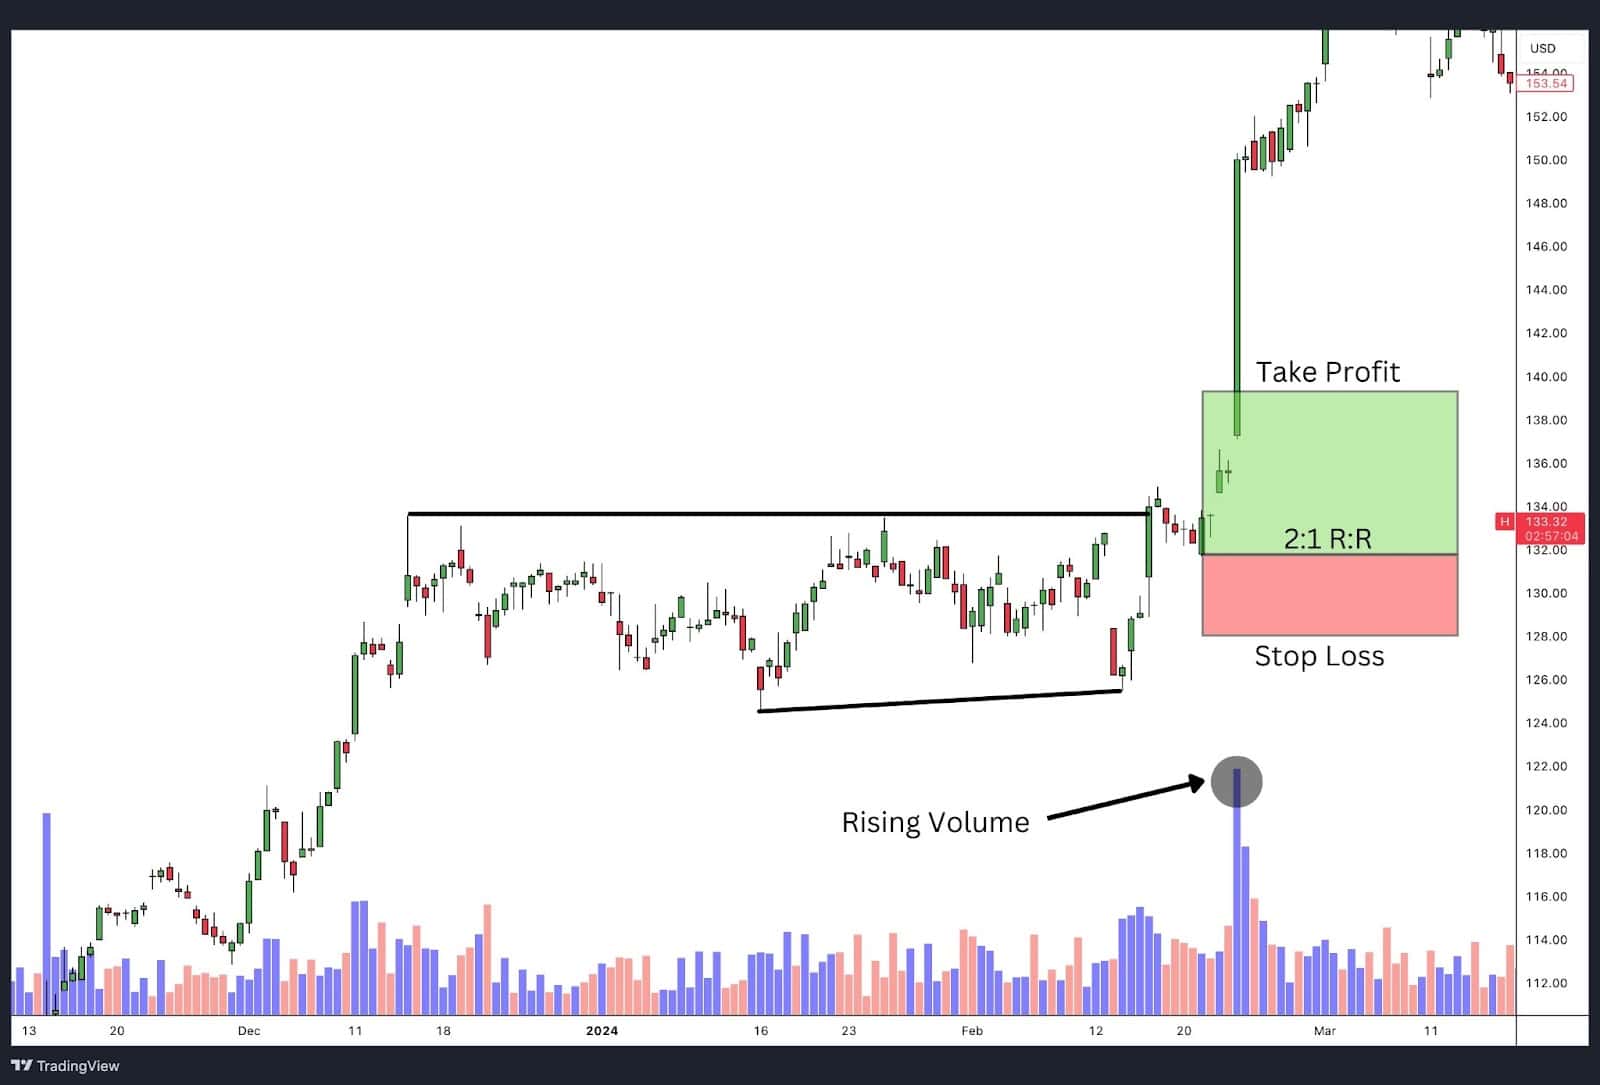
Trading Ascending Triangle Pattern with Volume as an Indicator

Trading the ascending triangle chart patterns with volume as an indicator can enhance the accuracy of identifying breakouts and potential reversals. Volume provides crucial insights into the strength of price movements and market sentiment.
Volume Analysis in Ascending Triangle Pattern
Confirmation of Breakout: Volume typically decreases during the formation of the triangle, reflecting consolidation. A significant increase in volume at the breakout point confirms that the breakout is genuine and supported by strong market participation.
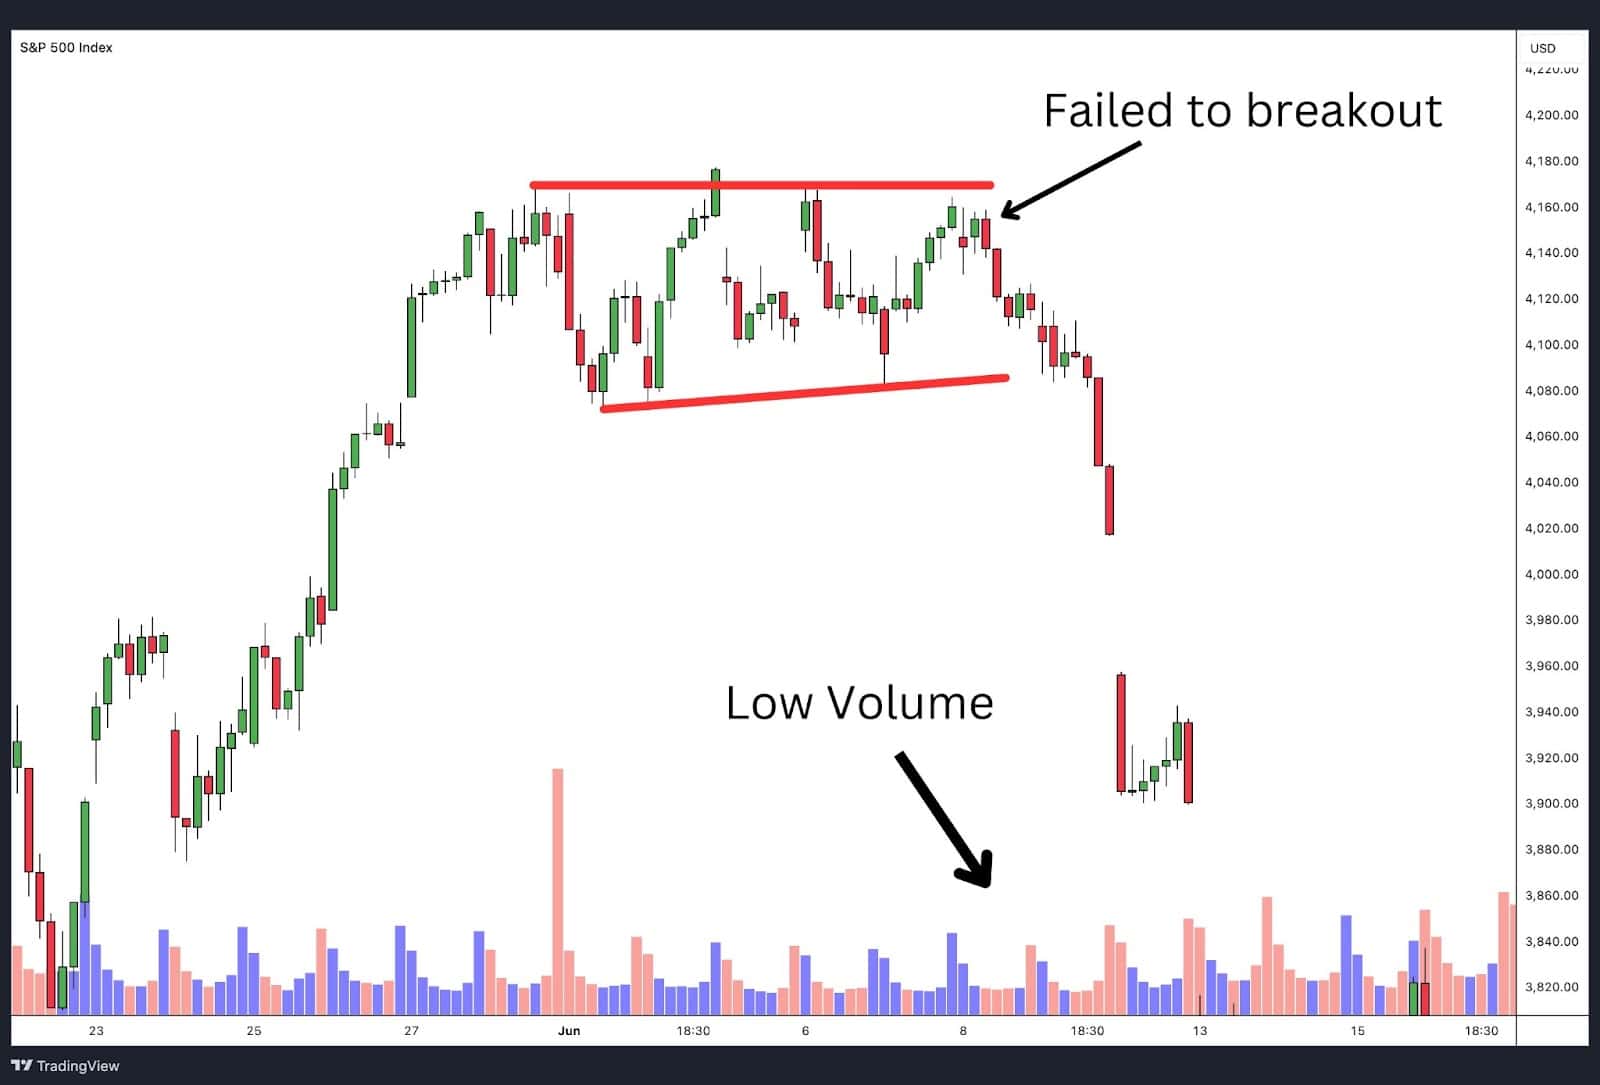
Identifying False Breakouts: A breakout accompanied by low volume may signal a false breakout. Traders should be cautious and wait for further confirmation before entering a trade.
Trend Strength: Sustained high volume following the breakout indicates strong buying interest and the likelihood of a continued uptrend. Conversely, if volume diminishes after the breakout, it may suggest a weakening trend.
Volume Patterns:
- Volume Decline: Observe the gradual decline in volume during the pattern’s development, indicating consolidation.
- Volume Surge: Look for a noticeable spike in volume as the price breaks above the resistance line.
Trading Strategies Using Volume
- Entry Point: Enter the trade when a breakout is confirmed by a surge in volume above the horizontal resistance line.
- Stop Loss: Place the stop loss below the last swing low within the triangle to manage risk.
- Take Profit: Use the height of the triangle to set the take profit level from the breakout point.
Additional Indicators: Combine volume analysis with RSI and MACD to further validate the breakout’s strength and potential trend continuation.
Advantages of Trading on the Ascending Triangle Pattern
The ascending triangle pattern offers several key advantages for traders, making it a popular choice in technical analysis:
Clear Entry and Exit Points
The pattern provides well-defined entry and exit points, making it easier for traders to plan their trades. The horizontal resistance line and ascending support line give clear levels for entering and exiting positions.
High Probability of Continuation
As a bullish continuation pattern, the ascending triangle often indicates that the existing uptrend is likely to continue. This helps traders align their trades with the prevailing market trend, increasing the likelihood of success.
Risk Management
The pattern allows for effective risk management. Traders can place stop losses just below the ascending support line or the last swing low, minimising potential losses if the trade does not go as planned.
Volume Confirmation
Volume dynamics in the ascending triangle provide additional confirmation for trades. An increase in volume during the breakout reinforces the validity of the pattern, giving traders more confidence in their positions.
Flexibility Across Markets
The ascending triangle pattern can be applied across different markets and timeframes, making it a versatile tool for traders. Whether trading stocks, forex, commodities, or cryptocurrencies, this pattern is relevant and useful.
Enhancing Strategy with Other Indicators
The pattern can be effectively combined with other technical indicators such as RSI, MACD, and moving averages to enhance trading strategies and confirm signals, providing a more comprehensive approach to trading.
Disadvantages of Trading on the Ascending Triangle Pattern
While the ascending triangle pattern offers several advantages, it also comes with notable disadvantages that traders should consider:
False Breakouts
One of the main drawbacks is the risk of false breakouts. The price may briefly break above the resistance line only to fall back within the triangle, leading to potential losses if the trader enters prematurely.
Limited Predictive Power
The pattern’s predictive power is not foolproof. External market factors, such as news events or economic data, can influence price movements, leading to unexpected reversals even when the pattern suggests a continuation.
Requires Confirmation
For reliable signals, the pattern often requires confirmation from other technical indicators, such as volume, RSI, or MACD. This added complexity can make trading decisions more challenging and time-consuming.
Timeframe Dependency
The effectiveness of the ascending triangle pattern can vary across different timeframes. While it may work well on a daily chart, it might be less reliable on shorter timeframes like intraday charts, requiring traders to adjust their strategies accordingly.
Market Context
The pattern is more effective in trending markets. In sideways or choppy markets, the ascending triangle may produce misleading signals, leading to suboptimal trading decisions.
What Indicator is Best to Trade with an Ascending Triangle Pattern?
When trading an ascending triangle pattern, three key indicators enhance the reliability of the signals:
- Volume: Monitoring volume is crucial. A significant increase in volume during the breakout confirms the strength of the move and the likelihood of a sustained trend. A lack of increased volume during a breakout price may indicate a false breakout.
- Relative Strength Index (RSI): A rising RSI above 50 during the pattern formation indicates increasing bullish momentum. A low or falling RSI below 50 suggests a weakening trend.
- Moving Average Convergence Divergence (MACD): A bullish crossover in the MACD line supports the breakout signal from the ascending triangle. On the other hand, if the MACD line is crossing below its signal line, then bearish momentum is building and a bullish breakout may fail.
Ascending Triangle Vs Descending Triangle
The ascending triangle and descending triangle appear similar to the untrained eye, yet they convey opposite market sentiments.
Ascending Triangle
- Bullish Pattern: Indicates continuation of an uptrend.
- Formation: Horizontal resistance line and rising support line.
- Breakout: Typically above the resistance line, confirmed by increased volume.
- Market Sentiment: Reflects increasing buying pressure.
Descending Triangle
- Bearish Pattern: Suggests continuation of a downtrend.
- Formation: Horizontal support line and descending resistance line.
- Breakout: Usually below the support line, confirmed by increased volume.
- Market Sentiment: Reflects increasing selling pressure.
Key Differences and Similarities
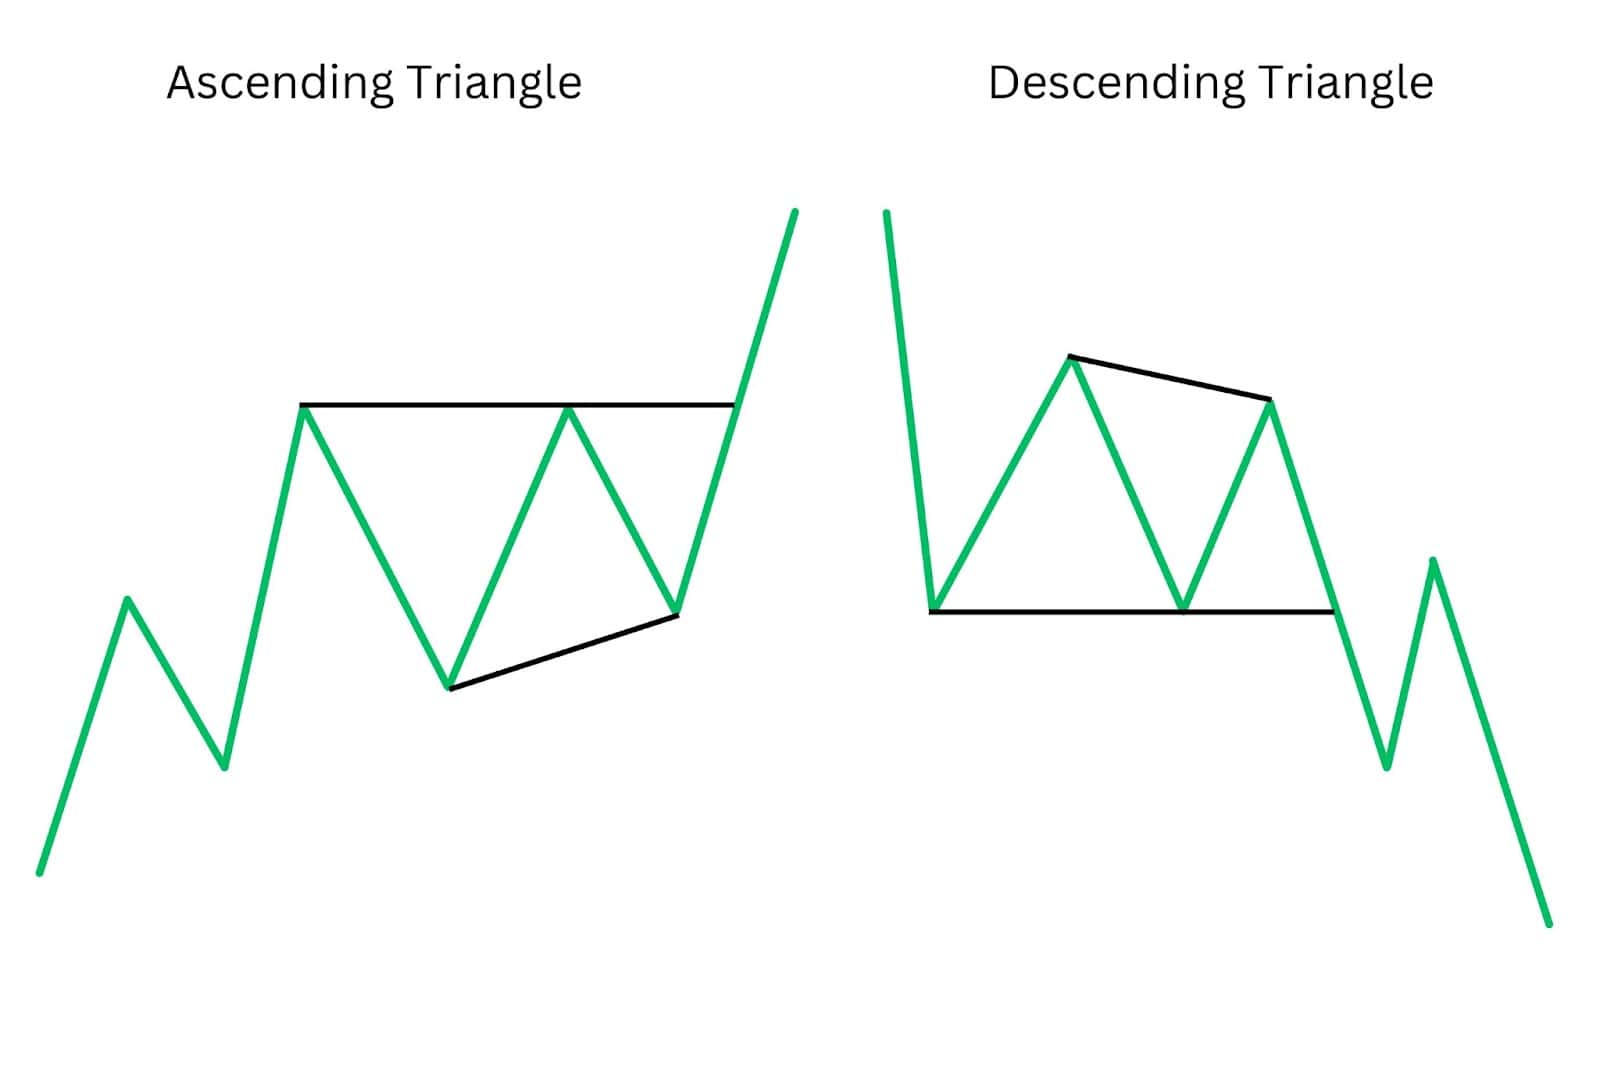
A key difference between an ascending and the descending triangle pattern is the location of the horizontal line. In the ascending triangle, the horizontal line is at the top, representing resistance, while in the descending triangle, it is at the bottom, representing support.
Additionally, an ascending triangle typically leads to a bullish breakout, indicating a continuation of an uptrend, whereas a descending triangle often leads to a bearish breakout, suggesting a continuation of a downtrend. Both patterns use volume to confirm breakouts, but they reflect opposing market sentiments.
Ascending Triangle Vs Symmetrical Triangle
Ascending Triangle
- Pattern Type: Bullish continuation pattern.
- Formation: Features a horizontal resistance level and a rising support line.
- Breakout: Typically occurs above the resistance line, confirmed by increased volume.
- Market Sentiment: Indicates increasing buying pressure and potential for an upward trend continuation.
Symmetrical Triangle
- Pattern Type: Neutral pattern that can indicate either a continuation or reversal.
- Formation: Formed by converging trendlines of higher lows and lower highs.
- Breakout: Can occur in either direction, upward or downward, requiring volume confirmation.
- Market Sentiment: Reflects a period of consolidation and indecision among traders, awaiting a breakout direction.
Key Differences and Similarities
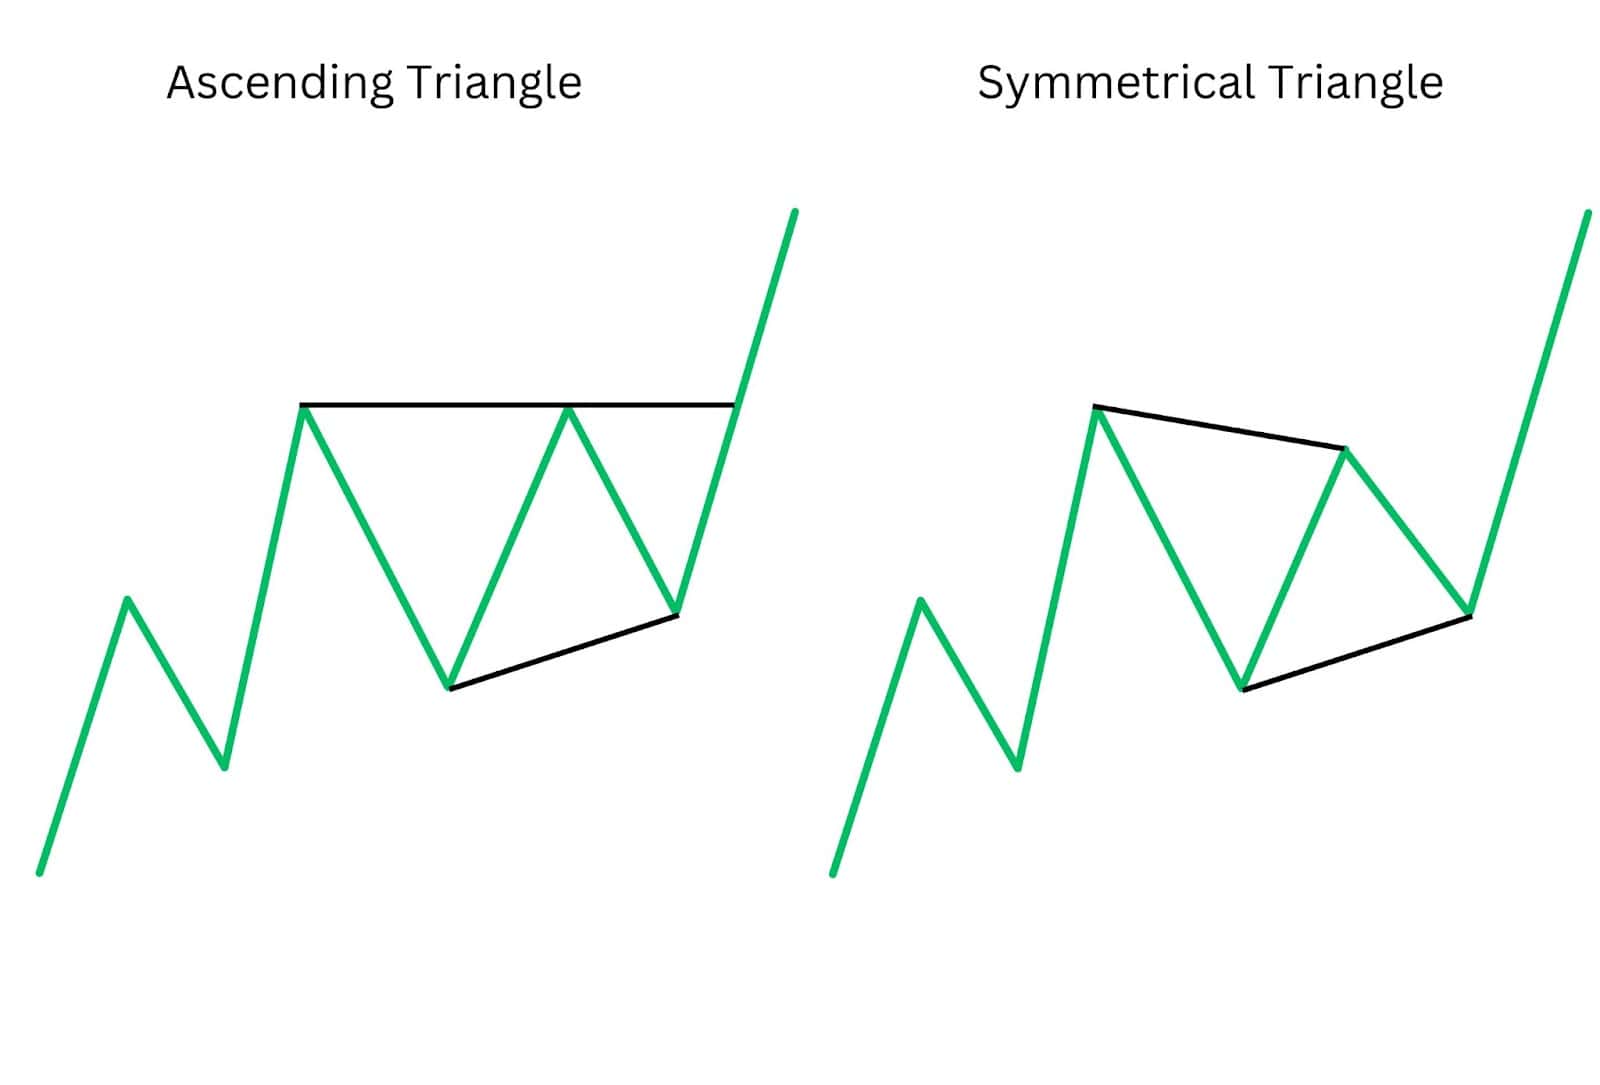
A key difference between the ascending triangle and the symmetrical triangle is the nature of the trendlines. The ascending triangle has a flat upper resistance line and a rising lower support line, suggesting increasing buying pressure and a bullish breakout.
In contrast, the symmetrical triangle has converging trendlines of higher lows and lower highs, indicating indecision and the potential for a breakout in either direction. Both patterns require volume confirmation for reliable breakouts, but they reflect different levels of market certainty and sentiment.
Ascending Triangle vs Rising Wedge
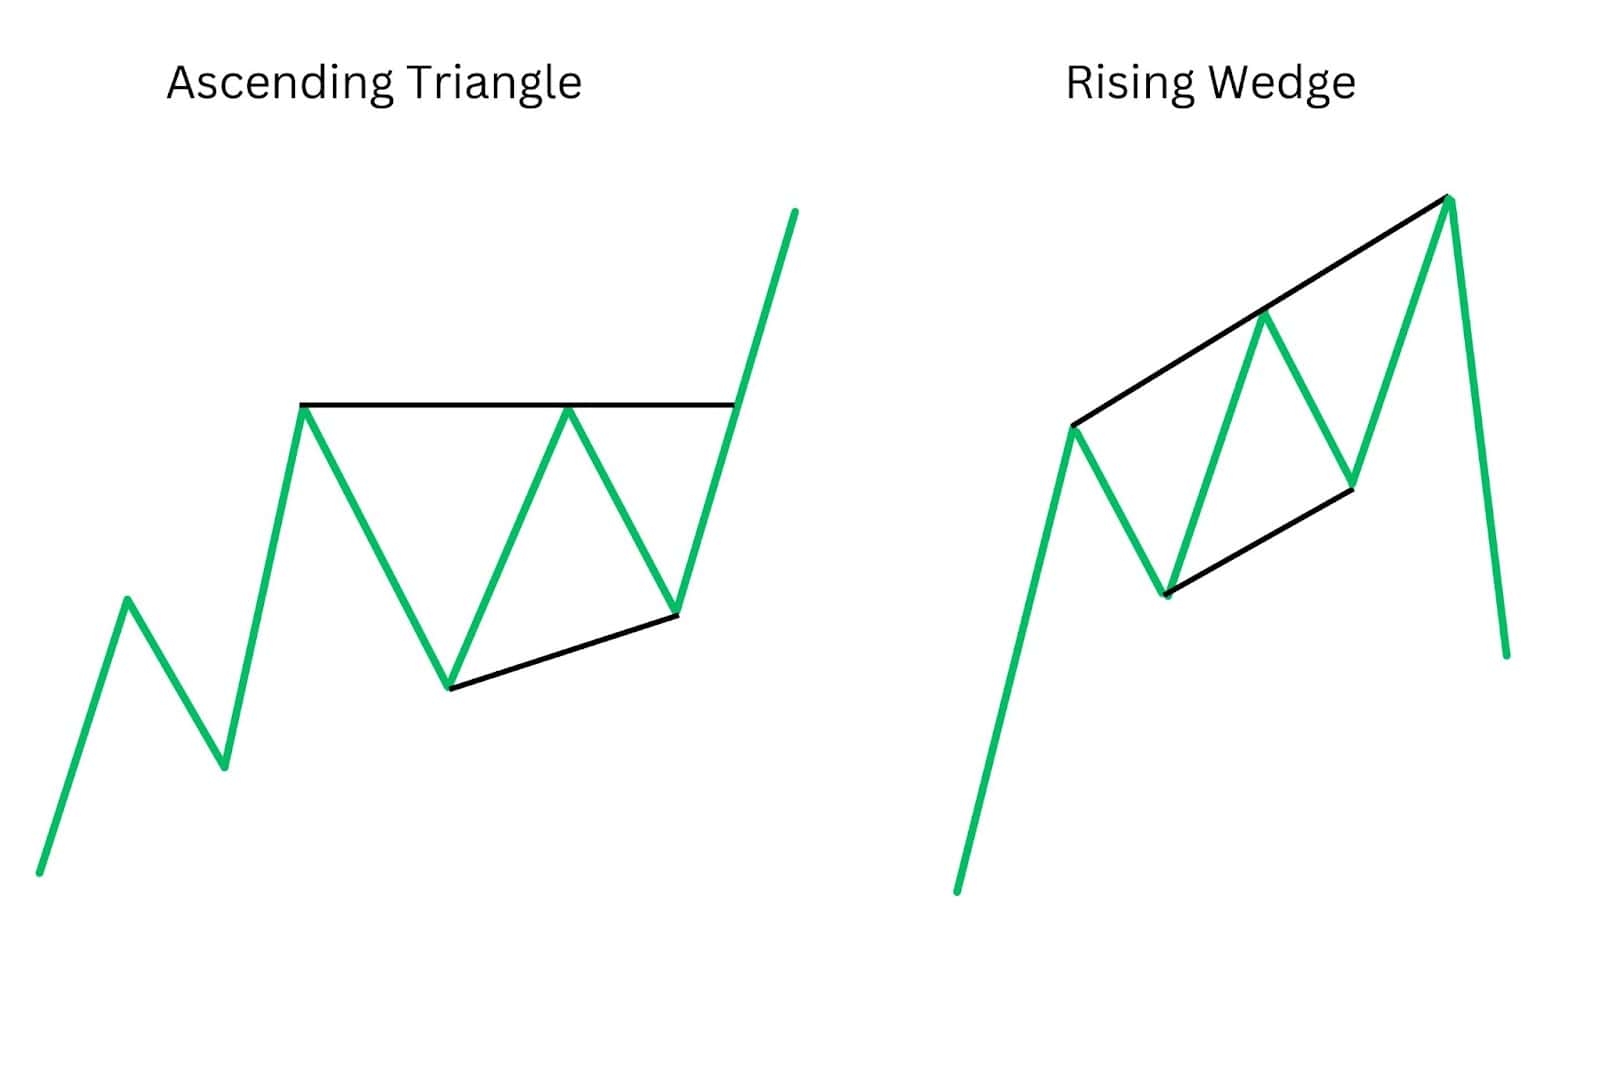
Ascending Triangle
- Pattern Type: Bullish continuation pattern.
- Formation: Features a horizontal resistance line and a rising support line.
- Breakout: Typically occurs above the resistance line with increased volume, indicating strong bullish sentiment.
Rising Wedge
- Pattern Type: A reversal pattern, often bearish when appearing in an uptrend.
- Formation: Both the resistance and support lines are ascending, but the support line rises more steeply, creating a narrowing pattern.
- Breakout: Usually occurs below the support line with a decrease in volume, suggesting weakening bullish momentum and potential reversal.
Key Differences and Similarities
A key difference between the ascending triangle and the rising wedge is the direction of their trendlines. The ascending triangle has a horizontal resistance line and an upward-sloping support line, suggesting a bullish breakout.
In contrast, the rising wedge pattern will sport two converging trendlines that are both ascending. The support line will rise more steeply often leading to a bearish breakout. Both patterns require volume analysis for confirmation, but they signal opposing market sentiments and potential movements.
Ascending Triangle vs Triple Top
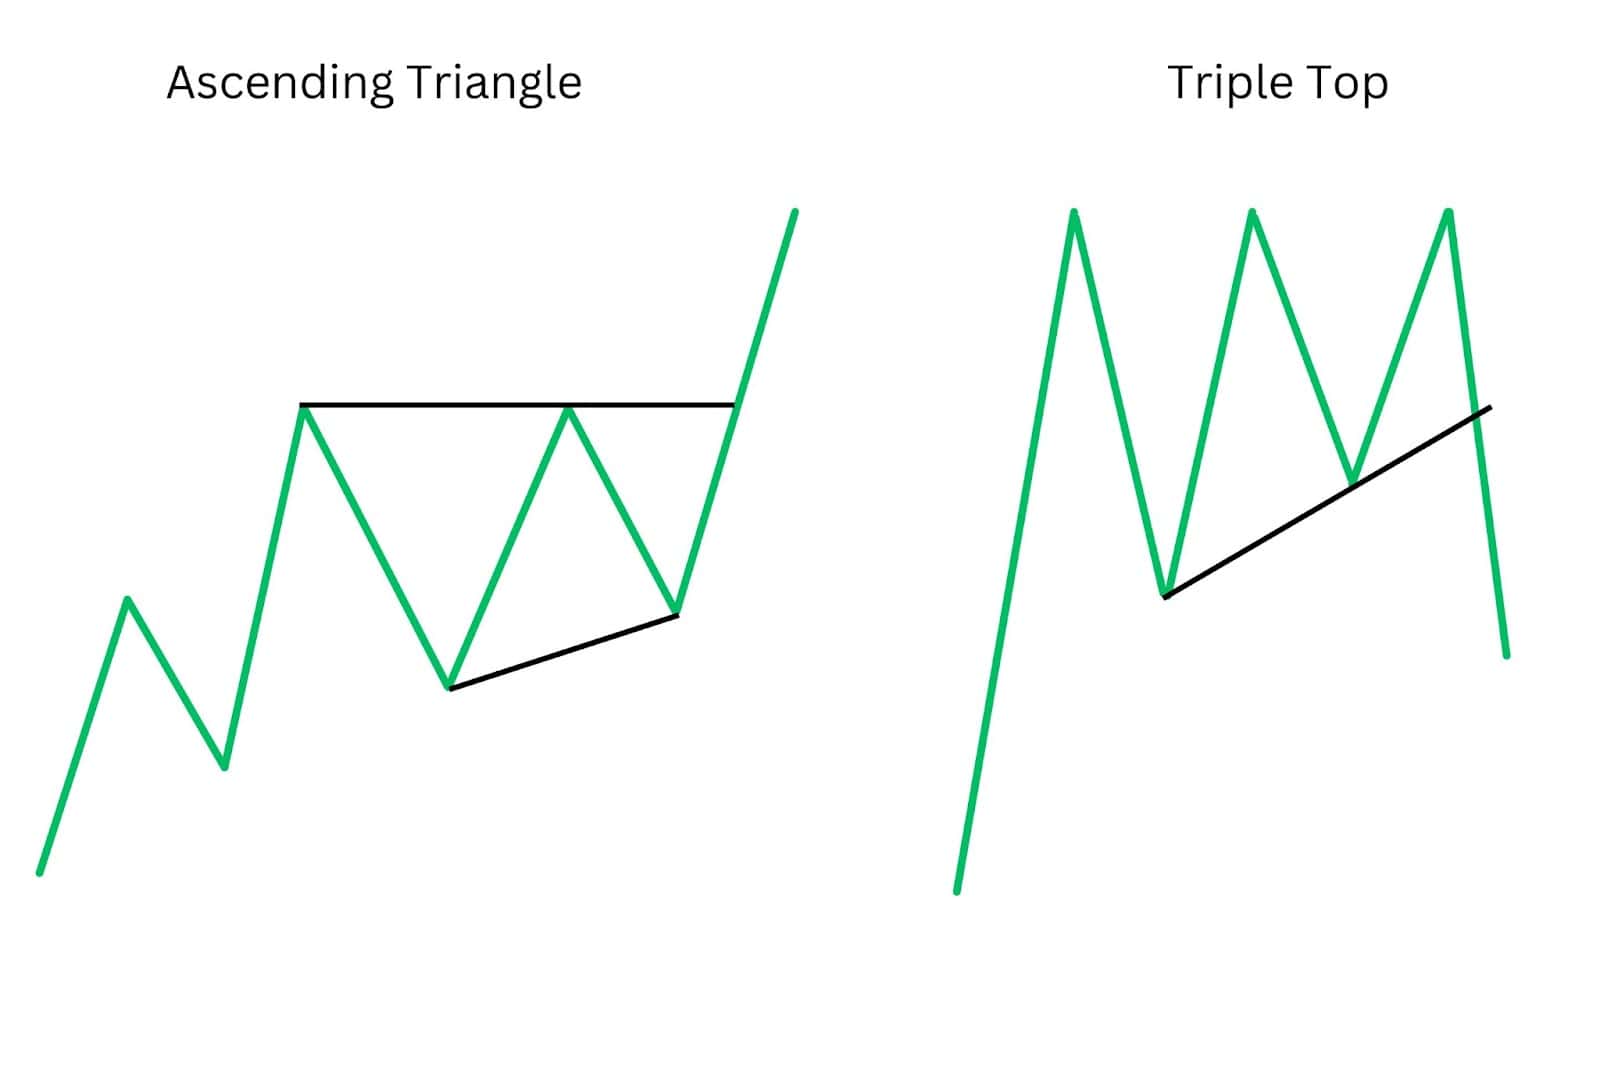
Ascending Triangle
- Pattern Type: Bullish continuation pattern.
- Formation: Horizontal resistance line and rising support line.
- Breakout: Above the resistance line, confirmed by increased volume, signalling strong upward momentum.
Triple Top
- Pattern Type: Bearish reversal pattern.
- Formation: Three peaks at roughly the same level, with the price failing to break above this resistance each time.
- Breakout: Below the support line formed by the lows between the peaks, indicating a potential trend reversal to the downside.
Key Differences and Similarities
The ascending triangle will typically have two to three reversal points near the same price creating a horizontal resistance line. The triple top pattern will have three similarly priced resistance levels too creating a flat top. The key difference between the ascending triangle and triple top lies in their breakout direction and implications.
The ascending triangle will buyers emerge and volume grow as the price breaks above the horizontal line. In contrast, the triple top is a bearish reversal pattern where the price fails to surpass resistance three times, which leads to a breakout below support and signalling a downward trend.
Ascending Triangle vs Head And Shoulders
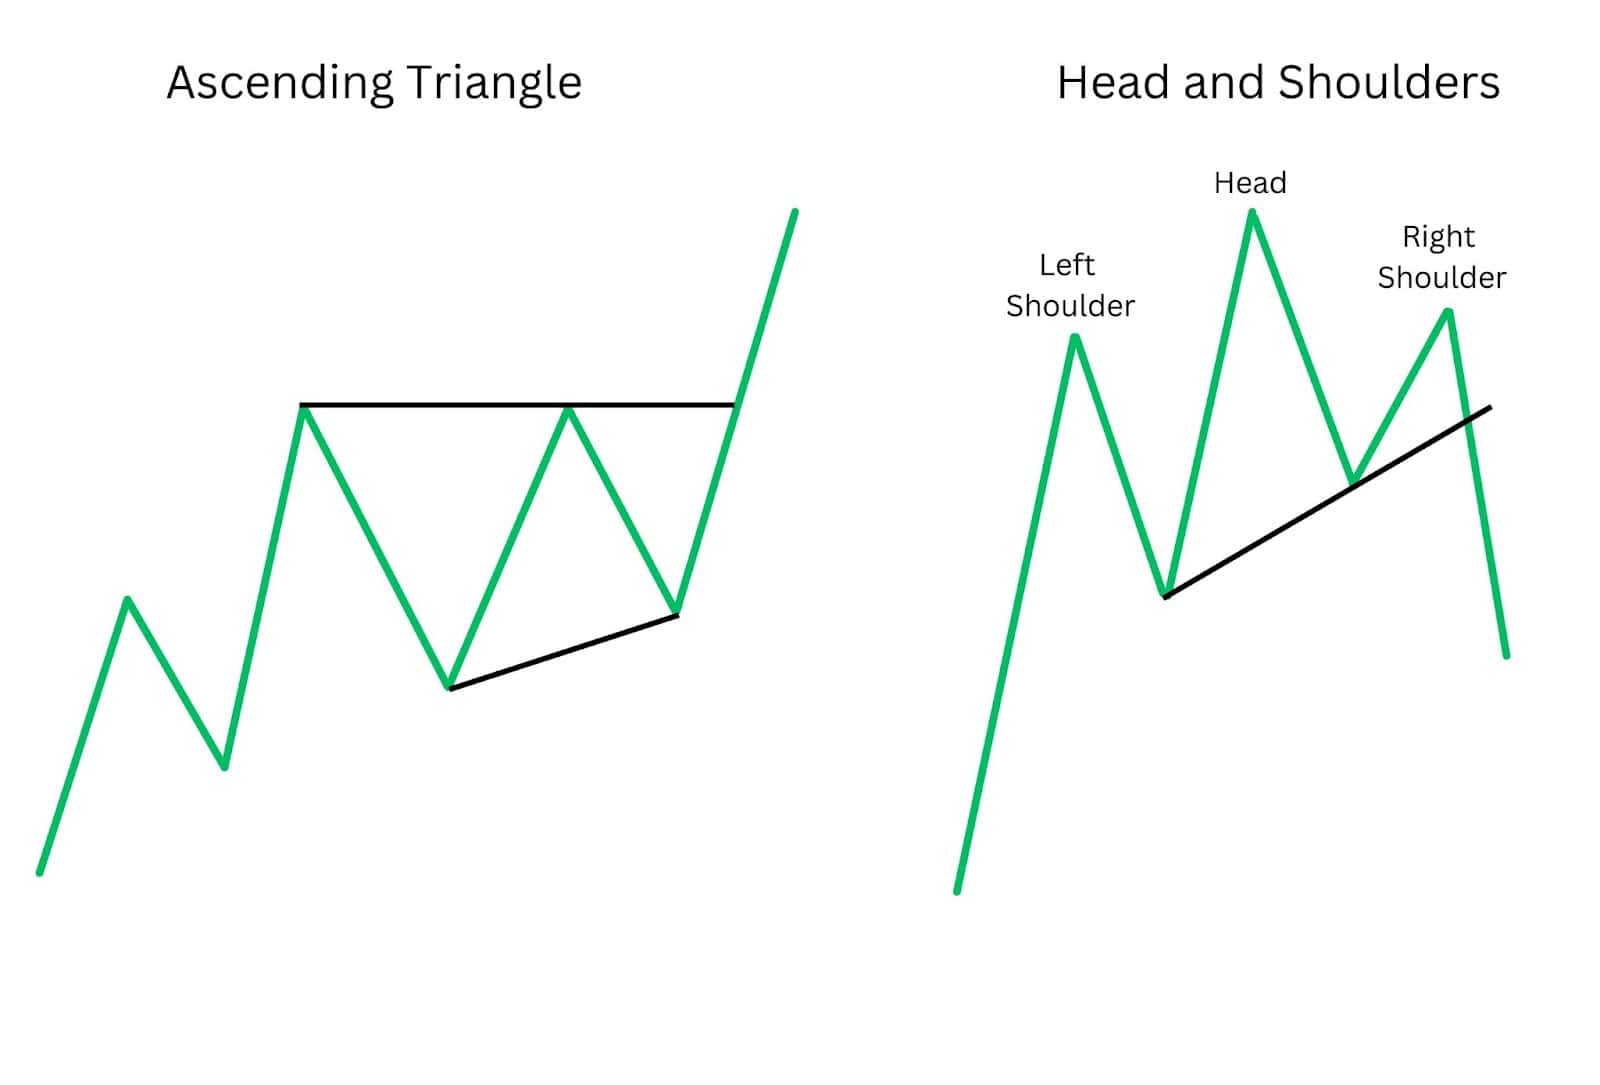
Ascending Triangle
- Pattern Type: Bullish continuation pattern.
- Formation: Horizontal resistance line and rising support line.
- Breakout: Above the resistance line with strong volume, indicating continuation of the uptrend.
Head and Shoulders
- Pattern Type: Bearish reversal pattern.
- Formation: Consists of three peaks – a higher middle peak (head) between two lower peaks (shoulders).
- Breakout: Below the neckline (support line) formed by the lows between the peaks, indicating a reversal from an uptrend to a downtrend.
Key Differences and Similarities
The ascending triangle and head and shoulders pattern might look similar with a couple of price rejections near their highs. However, there are two key differences.
First, the head and shoulders won’t create a flat horizontal top like the ascending triangle. The head and shoulders pattern will have one swing top, higher than the rest in essence acting like a false breakout.
A second key difference is their implications for market trends. The ascending triangle is a bullish continuation pattern, indicating a likely upward breakout and continuation of the current uptrend. In contrast, the Head and Shoulders pattern is a bearish reversal pattern, signaling a potential downward breakout and reversal from an uptrend to a downtrend.
FAQ
How long does the ascending triangle pattern last?
The duration of an ascending triangle pattern can vary depending on the chart time frame used. There needs to be enough time elapsed for the triangle to form at least two points of resistance and two points of support.
What are common ascending triangle pattern mistakes to watch out for?
Common mistakes include not spotting a previous uptrend, entering before confirmation of a bullish break, and ignoring volume signals.
What is the best time frame to use for the ascending triangle pattern?
Higher chart time frames like hourly and above include more data in their formation and tend to be more reliable. However, the ascending triangle pattern is effective across various timeframes between minute to monthly charts.
How do you calculate the target price following a breakout from an ascending triangle pattern?
Measure the height of the triangle and add it to the breakout point to calculate the target price.
Who first identified the ascending triangle pattern?
The ascending triangle pattern was popularised by technical analyst Richard Schabacker in the early 20th century.
What is the psychology behind the ascending triangle pattern?
The pattern indicates a shake out of weak sellers and increasing buying pressure as buyers consistently push the price to higher lows, challenging a resistance level.
How reliable is the ascending triangle pattern?
The ascending triangle pattern is generally reliable, especially when confirmed by volume and other indicators, though no pattern is foolproof.
Are ascending triangle patterns bullish or bearish?
Ascending triangle patterns are typically bullish, indicating a potential upward breakout.
Does the ascending triangle work?
Yes, it is a widely used and effective pattern in technical analysis, but it should be used in conjunction with other indicators like volume for best results.
Is an ascending triangle bullish in a downtrend?
Typically, an ascending triangle pattern is bullish even when it appears in a downtrend, suggesting a potential reversal.
Is an ascending triangle a reversal pattern?
While it is primarily a continuation pattern, it can sometimes signal a reversal when it appears at the end of a downtrend.


