


Written by:


- Weekly Outlook
- July 3, 2026
- 5 min read
Gold Finds Its Floor as a Quiet Calendar Hands the Charts the Microphone
Gold spent the first half of 2026 doing something it rarely does: falling, and falling hard. From a February peak above 5,600, the metal shed more than 1,500 dollars in five months, a slow bleed that turned every “safe haven” pitch on its head. The catalyst was never really about gold. It was about the dollar getting its confidence back under a hawkish Warsh Fed, a Middle East ceasefire draining the fear premium, and oil sliding back to pre-conflict levels. When the world stops panicking, the panic trade gets sold.
But look at where price has come to rest. Gold has slid all the way back to 4,000, the exact shelf that stopped every dip from October through December last year. That old accumulation zone is now being retested from above, and for the first time since the sell-off began, buyers are showing up. This week price pushed back through its 20-day moving average, the first time it has managed that since the trend rolled over in the spring. It is a small technical event with an outsized message: the one-way selling has paused, and the market is asking whether 4,000 is a floor or a trapdoor.
Which makes the timing almost too neat. Next week’s economic calendar is thin, arguably the quietest of the summer. There is no Fed meeting, no CPI, no payrolls to hijack the tape. When the macro goes quiet, price action stops taking orders from the headlines and starts trading its own structure. That is exactly the kind of week where a level like 4,000 gets tested properly, on its own merits, without a data print to blame. So this week we let the chart do the talking.
What’s on the calendar
The week is light on tier-one risk, but three releases are worth having on your radar. The standout for us is Monday’s ISM Services print, where our in-house read sits meaningfully below consensus.
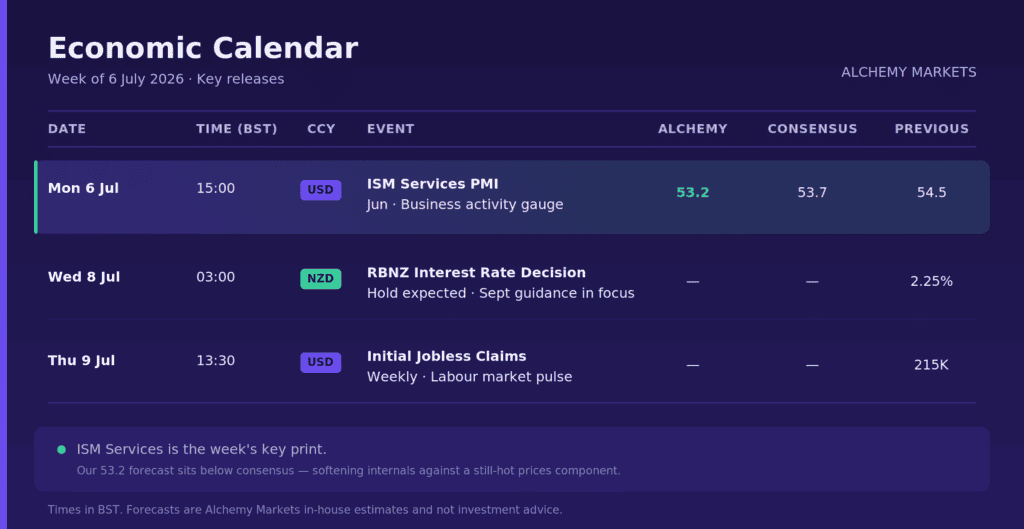
ISM Services (Monday) is the one to watch. May’s 54.5 was the strongest reading in three months, and we think it overstated the underlying momentum. Our forecast of 53.2 sits below the 53.7 consensus because the internals are turning: manufacturing already cooled in June, new orders look stretched after May’s jump, and the employment component has been contracting for three straight months. The catch is prices, which have been running at their hottest since 2022. A softer-activity, sticky-prices print is the combination that keeps the Warsh Fed exactly where it is, patient, data-dependent, and in no hurry to signal anything. Watch the dollar for the immediate reaction, and gold by extension.
RBNZ (Wednesday) is widely expected to leave rates unchanged, so the decision itself is unlikely to be the story. What matters is the tone. A US-Iran de-escalation has pulled oil sharply lower and cooled the case for an early move, but the market is listening closely for what the central bank signals about the months ahead. This is a statement-driven event for the Kiwi rather than a decision-driven one, and how hawkish or cautious that signal reads will do more to move NZD than the rate line itself.
Initial Jobless Claims (Thursday) is normally background noise, but in a quiet week with a cooling labour market fresh in mind after June’s soft payrolls, any upside surprise gets more attention than usual. It is a low-ceiling release that can still nudge a directionless tape.
Gold (XAU/USD), Daily
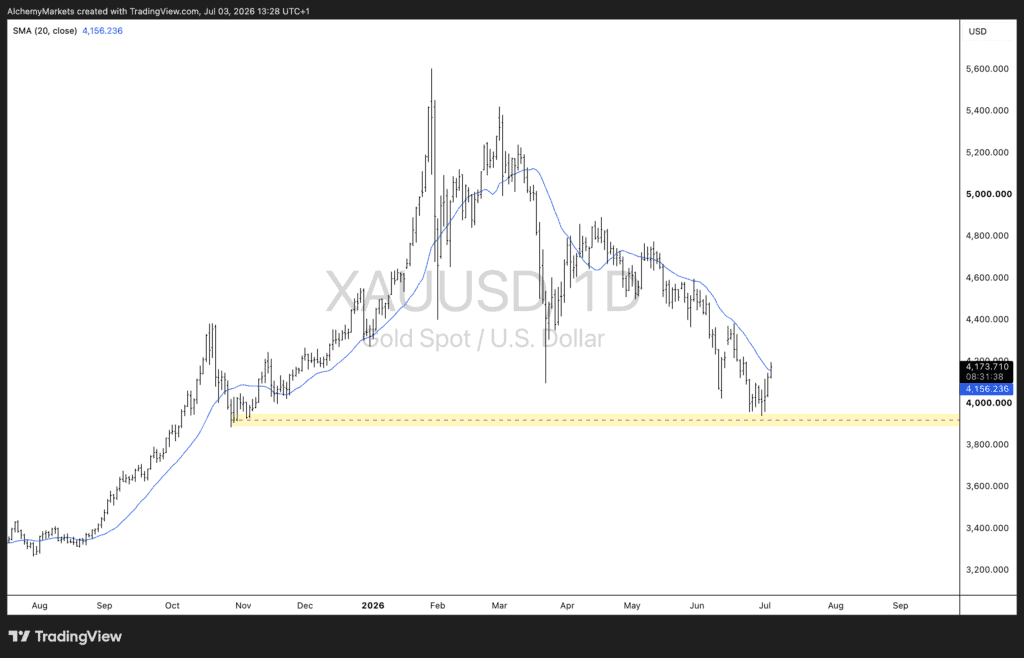
This is the setup the quiet week is built around.
Gold has retraced the entire post-February decline back into the 4,000 zone, and this is not a random number. That shelf acted as a launchpad from October through December 2025, the base the metal spent three months building before its explosive run to 5,600. Price has now returned to that exact level from above, turning old support into a live test. The yellow band on the chart marks the zone that matters.
Two technical signals are worth flagging. First, the reaction off 4,000 has been immediate. Rather than slicing through, price has stalled and started to curl back up, the early signature of buyers defending a level they remember. Second, and more telling, gold has reclaimed its 20-day moving average for the first time since May. Through the entire second-quarter decline, that average capped every bounce. Trading back above it does not confirm a trend change on its own, but it is the first crack in the bearish structure that has governed price for two months.
The picture is a market that has fallen a long way, arrived at a level with genuine history, and started to show its first signs of life. What we are watching for is whether this becomes a base or a pause. A daily close that holds above the 20-day average and defends the 4,000 shelf would suggest the sellers are finally losing their grip. A decisive break back below the yellow zone would say the retest failed, and the path of least resistance is lower toward the next area of interest. In a week without a major catalyst to force the issue, the level itself becomes the story, and how price behaves around 4,000 will tell us more than any single data point could.


