Written by:


- Opening Bell
- September 14, 2026
- 2 min read
WTI Crude Oil: Breakout or Reversal?
Oil prices have rallied sharply over recent weeks as geopolitical and physical supply risks have increased across the Middle East. The latest leg higher followed attacks on Saudi energy infrastructure, including the shutdown of the kingdom’s East–West pipeline, an important alternative export route if flows through the Strait of Hormuz are disrupted. At the same time, diplomatic efforts between Gulf states have stalled, global oil inventories have continued to decline, and disruptions to Russian refinery output have pushed diesel and middle-distillate markets into extreme tightness.
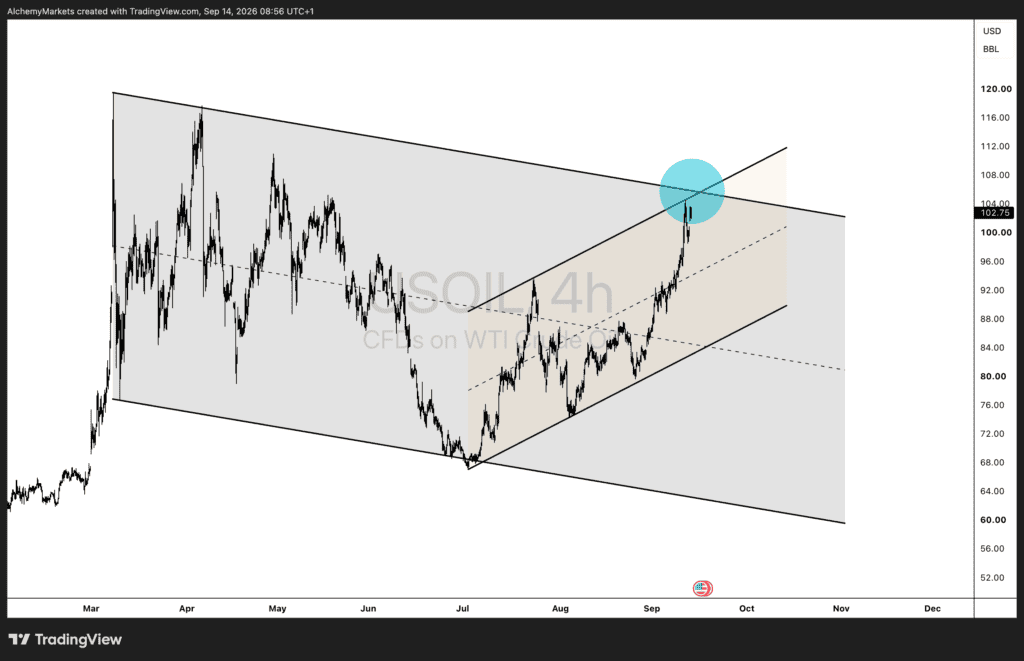
This combination has helped push WTI from around the low-$80s in August towards $103/bbl, but price has now reached an important technical decision area. WTI is testing both the upper boundary of its broader declining channel and the upper region of the shorter-term rising trend.
Bullish scenario
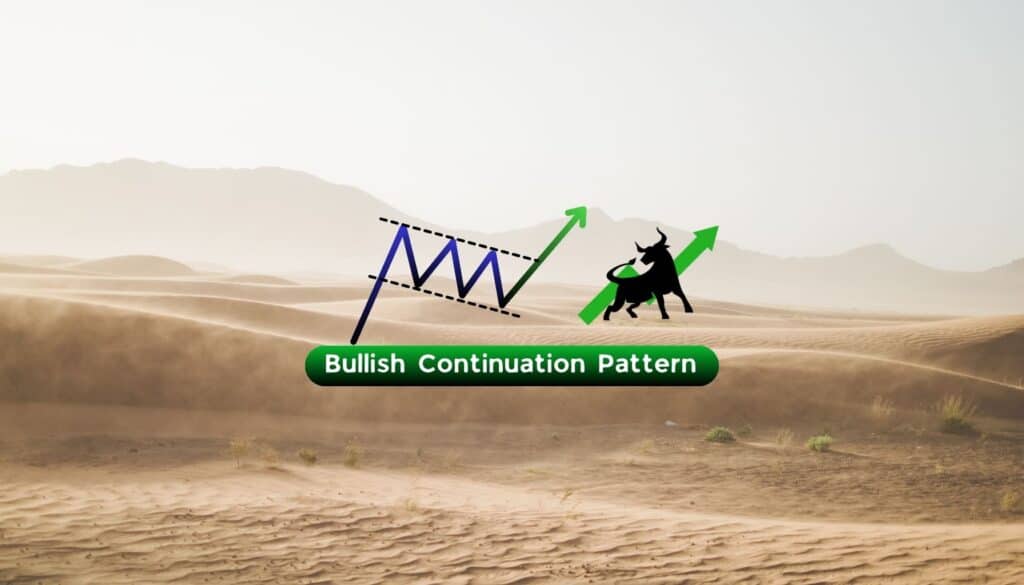
A sustained break above roughly $103–105 would suggest that the market is beginning to price something more serious than just a geopolitical risk premium.
The bullish case would become stronger if the Saudi pipeline remains offline, flows through Hormuz deteriorate, inventories continue falling or tensions escalate further. In that environment, a confirmed breakout could open the door towards approximately $108–112, with the previous highs around $116–120 becoming relevant if physical supply disruptions materially worsen.
In simple terms:
Supply disruption persists → physical tightness increases → resistance breaks → bullish continuation.
Bearish scenario
The alternative is that much of the current geopolitical risk has already been priced into oil.
WTI has risen roughly 25% from its August lows and is now meeting significant resistance. If Saudi infrastructure is repaired relatively quickly, Hormuz exports continue flowing normally or diplomatic progress reduces the perceived supply threat, the risk premium could unwind.
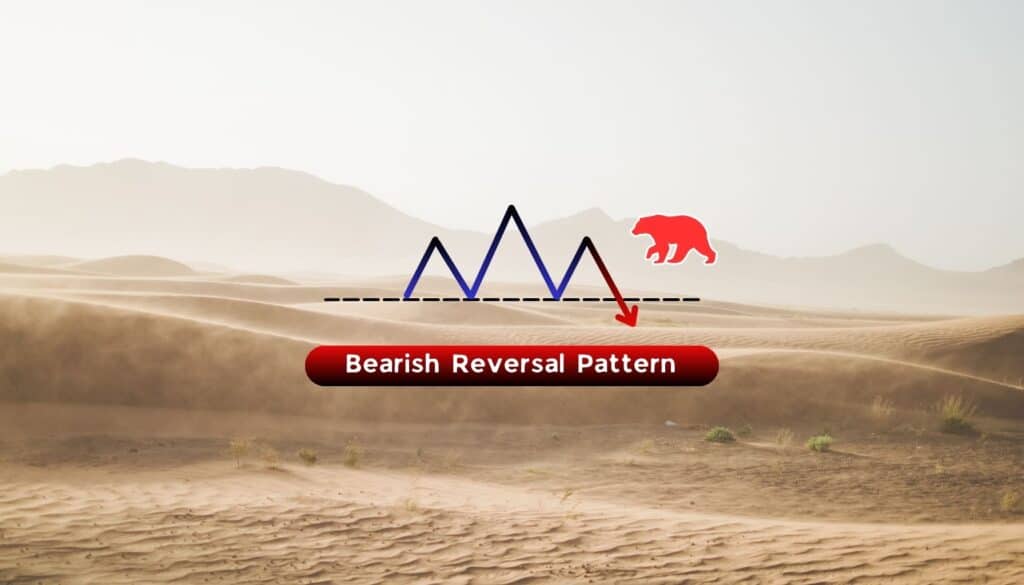
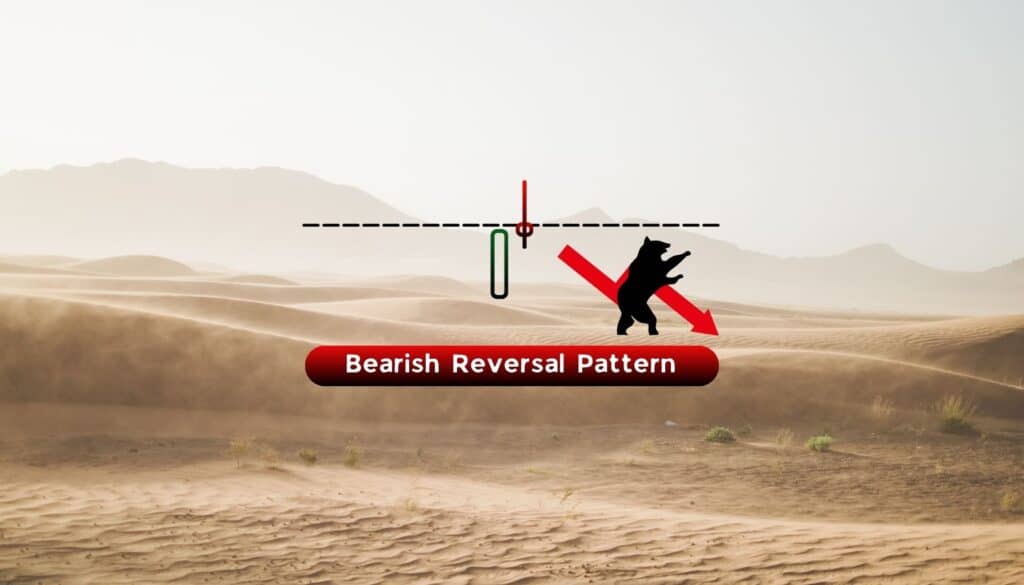
A rejection around $103–105 followed by a move back below approximately $100 would therefore raise the probability of a deeper correction towards the mid-to-high $90s.
The bearish chain would be:
Supply fears ease → geopolitical premium unwinds → resistance holds → bearish reversal/correction.
What matters now
The chart is effectively testing the fundamental narrative.
The oil market already knows that geopolitical risk is elevated. For prices to break materially higher from here, the market probably needs fresh evidence of actual lost supply, rather than simply further headlines around existing tensions.
So the key area to watch is $103–105.
Break and hold above it = bullish continuation increasingly likely.
Failure and rejection = risk of a meaningful pullback rises.