- Elliott Wave
- July 31, 2025
- 2 min read
USD/JPY Elliott Wave: Rally May Flatten Out
Executive Summary
- Trend Bias: Bullish flat pattern nearing end leading to bearish reversal.
- Key Levels: 150.75 – 152.40 is the potential bearish reversal zone.
- Indicators: Break below blue support trend line will trigger the bearish signal.
Earlier today, the Bank of Japan held its overnight interest rate steady at 0.50%. It appears the BoJ is committed to keeping the rates low for the foreseeable future. Additionally, yesterday, the FOMC held US interest rates steady with forward guidance suggesting no rush to cut rates down the road.
As a result, USDJPY rallied on the news as the interest rate differential between these two economies remains large. However, one price pattern we are following is that USDJPY may find a top between 150.75 – 152.40.
Current Elliott Wave Analysis
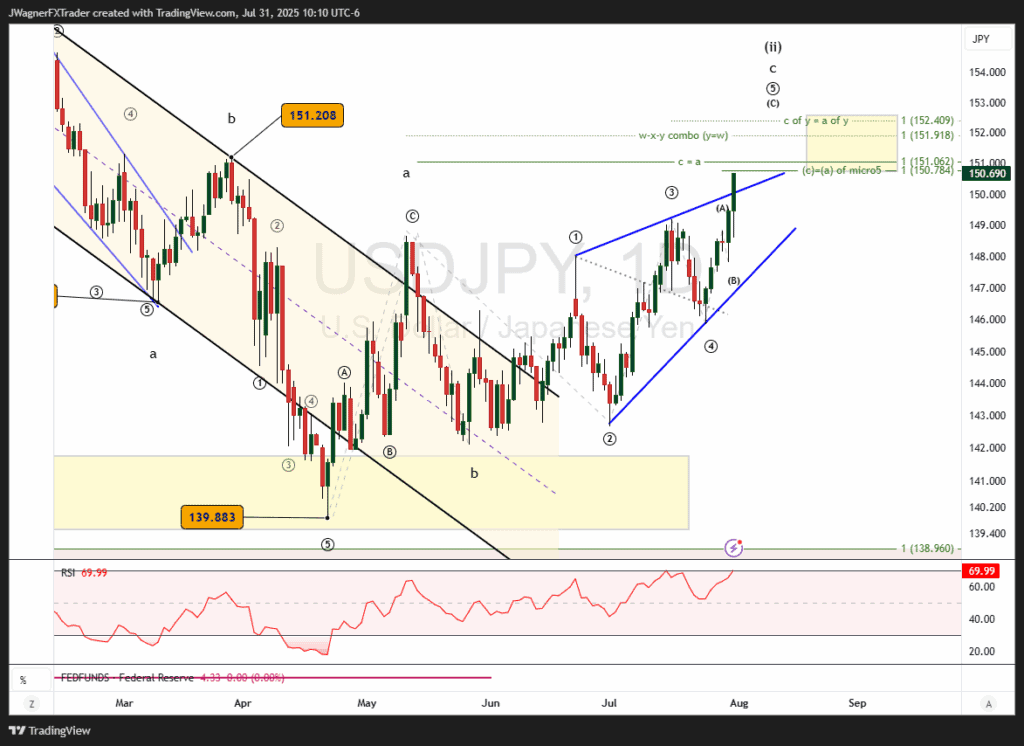
The daily USDJPY chart has yielded a series of sloppy, choppy, and overlapping waves. Patterns like these typically suggest a corrective pattern. This implies the rally is a corrective rally and may cleanse itself with a renewed downtrend.
The main pattern we are following is that an Elliott wave upward flat pattern is nearing completion.
There are multiple wave relationships pointing to a bearish reversal zone between 150.75 – 152.40.
The flat pattern we are following began April 22 and is labeled a-b-c. Waves ‘a’ and ‘b’ are completed and wave ‘c’ is working higher as an ending diagonal pattern. The diagonal has the appearance of a rising wedge and likely resolves to the downside.
Within the diagonal we are looking for 5-waves to develop. It appears wave 1-4 are complete and USDJPY is nearing the end of wave 5.
We know from our Elliott wave studies that the subwaves of an ending diagonal are zigzags or multiple zigzag structures.
Within micro wave 5, wave (c=(a) at 150.78.
Additionally wave c of the flat is a 100% Fibonacci extension of wave a of the flat at 151.06. This provides a tight potential reversal zone near 151.
There are some additional wave relationships a little higher near 152 based on a different pattern than the flat.
Bottom Line
USD/JPY is approaching a bearish reversal zone near 151-152. Once this bearish reversal takes hold, then prices are likely to retest 139 and could possibly break the support shelf causing a strong decline to 128.