


- Elliott Wave
- June 9, 2025
- 2 min read
EURUSD Elliott Wave: Diagonal Rally
Executive Summary
- EURUSD finalized a diagonal pattern last Thursday at 1.14948
- The near-term trend has shifted lower.
- Wait for key levels to break to determine if ending diagonal or leading diagonal.
Last Thursday, June 5, the ECB rate announcement caused a bit of volatility within the EURUSD pricing. It appears a diagonal pattern ended on Thursday and prices may be correcting lower.
Current Elliott Wave Analysis
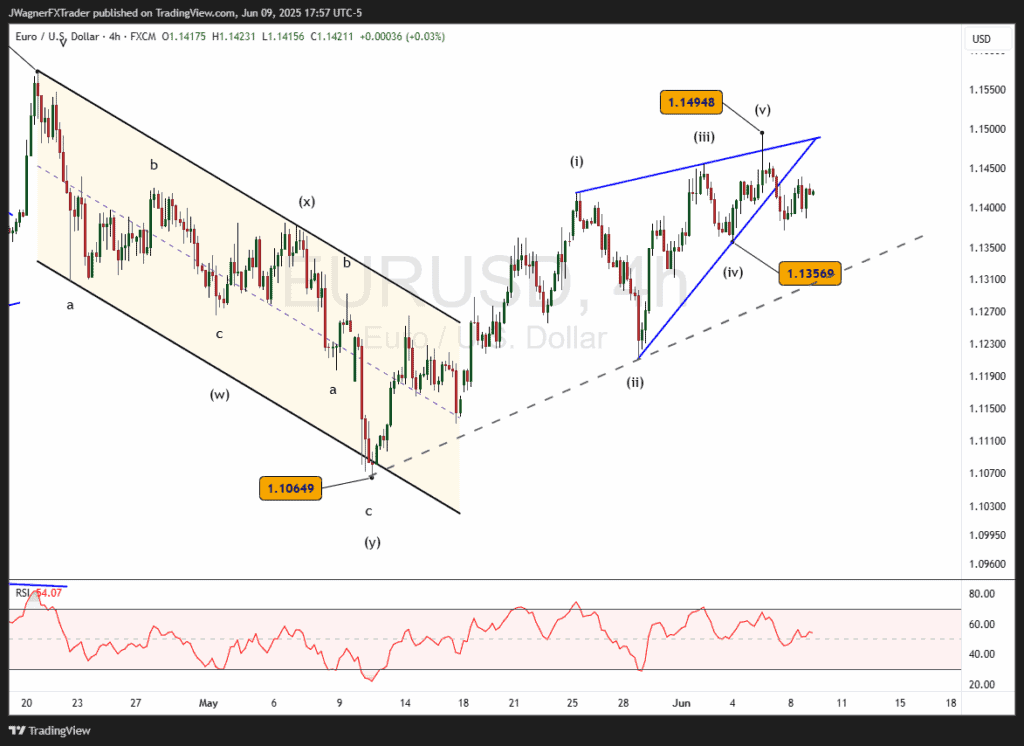
From the May 12 low of 1.10649, EURUSD appears to have carved an Elliott wave diagonal pattern, shaped like a rising wedge. It is difficult to identify if this is an ending diagonal pattern terminating the entire wave sequence since January 13. Or, it is possible this is a leading diagonal wave 1 of a larger 5-wave advance.
The rally from January 13 has been one of the most explosive rallies to start a new year. It is long in price and needs a consolidation to catch its breath.
I suspect this may be an ending diagonal that is a truncated 5th wave from the April high. We won’t know for sure if this is the case until after the decline has reached 1.10649.
If this is a leading diagonal, then it is possible EURUSD declines to 1.1200, rallies to a new high.
Bottom Line
A rally above 1.14948 suggests the diagonal was a leading diagonal wave one of a five wave sequence.
If price declines swiftly below 1.12, then it may be an early warning dashboard signal of a continued decline to below 1.10649.
You Might Be Interested In:


