Written by:


- Chart of the Day
- September 4, 2025
- 2 min read
U.S. Dollar Index: Choppy Data, Sideways Trading, and What’s Next
The U.S. Dollar Index (DXY) is back in the spotlight after yesterday’s JOLTS report confirmed further loosening in the labor market. Job openings fell more than expected to 7.2 million, but it’s the rise in layoffs to 1.8 million that raised eyebrows. Combined with a persistently low quit rate, the data suggests softer wage pressures—a factor the Fed is closely monitoring.
Today, traders are eyeing the ADP payroll figures, which carry extra weight for two reasons:
- Better predictive power – After recent employment revisions, ADP has shown it can be a decent lead indicator for payrolls.
- Fed focus – Christopher Waller, one of the Fed’s most hawkish voices and a potential Chair frontrunner, noted that ADP’s weekly updates point to continued weakness.
Consensus calls for a slowdown from 104k to 68k in today’s ADP report. If ADP comes in soft but Friday’s payrolls surprise on the upside, we could see some short-term confusion in markets. The bigger question, however, is whether investors are ready to take Fed rate expectations meaningfully lower before the CPI release on September 11th.
For now, the dollar still looks overvalued relative to short-term rates, leaving room for further downside—especially if labor data continues to weaken.
Technical View: DXY Range-Bound Since Mid-August
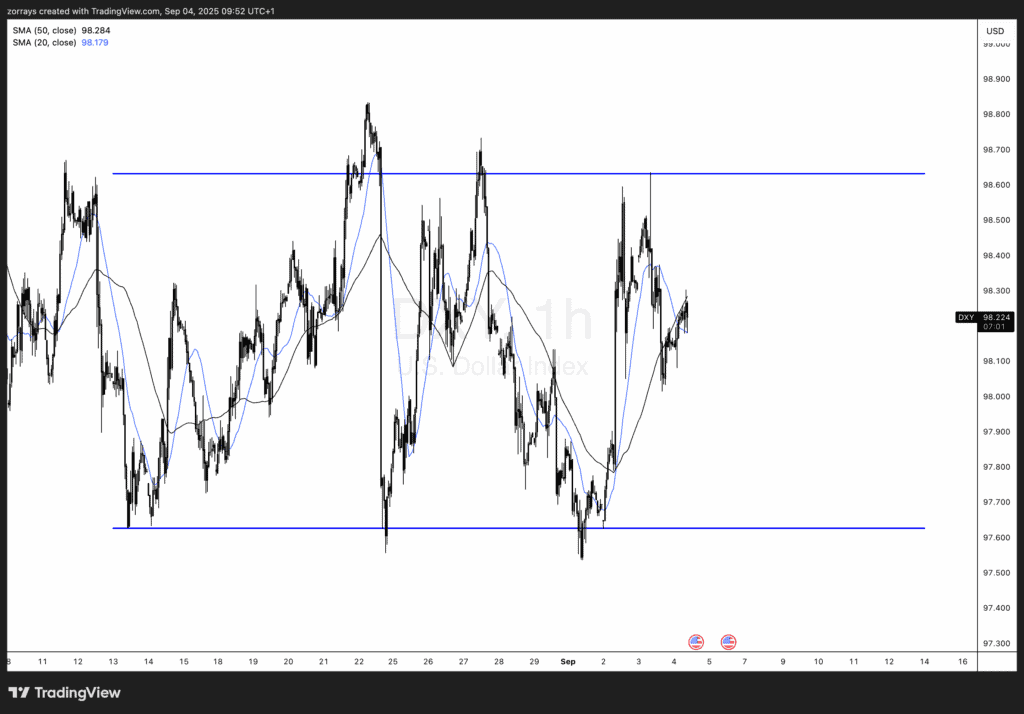
From a chart perspective, the dollar has been trading in a sideways channel since August 13th, 2025, with clear boundaries around 98.65 on the upside and 97.62 on the downside. Despite multiple swings within the range, momentum now seems to be tilting lower again.
With price failing to sustain gains above 98.60 and sellers stepping in, the next logical move could be a retest of the lower bound at 97.62. A clean break below would open the door to deeper weakness, while another bounce could keep this sideways consolidation alive.