


Written by:


- Chart of the Day
- September 3, 2025
- 2 min read
Gold Breaks Triangle and Hits All-Time High: Watch $3,470 Next
Last week, Gold broke out of a symmetrical triangle that’s been consolidating for ~87 days (nearly 3 months), and has formed a new all-time high at $3,546.92.
This new ATH is special; because we could potentially see a retracement from here. Not only is the RSI (relative strength index) overheated to the buy-side, we have a 1.618 Fib Extension level at $3,542.71.
Immediate support would be the market gap formed at the weekly open, between $3,454 to $3,470.
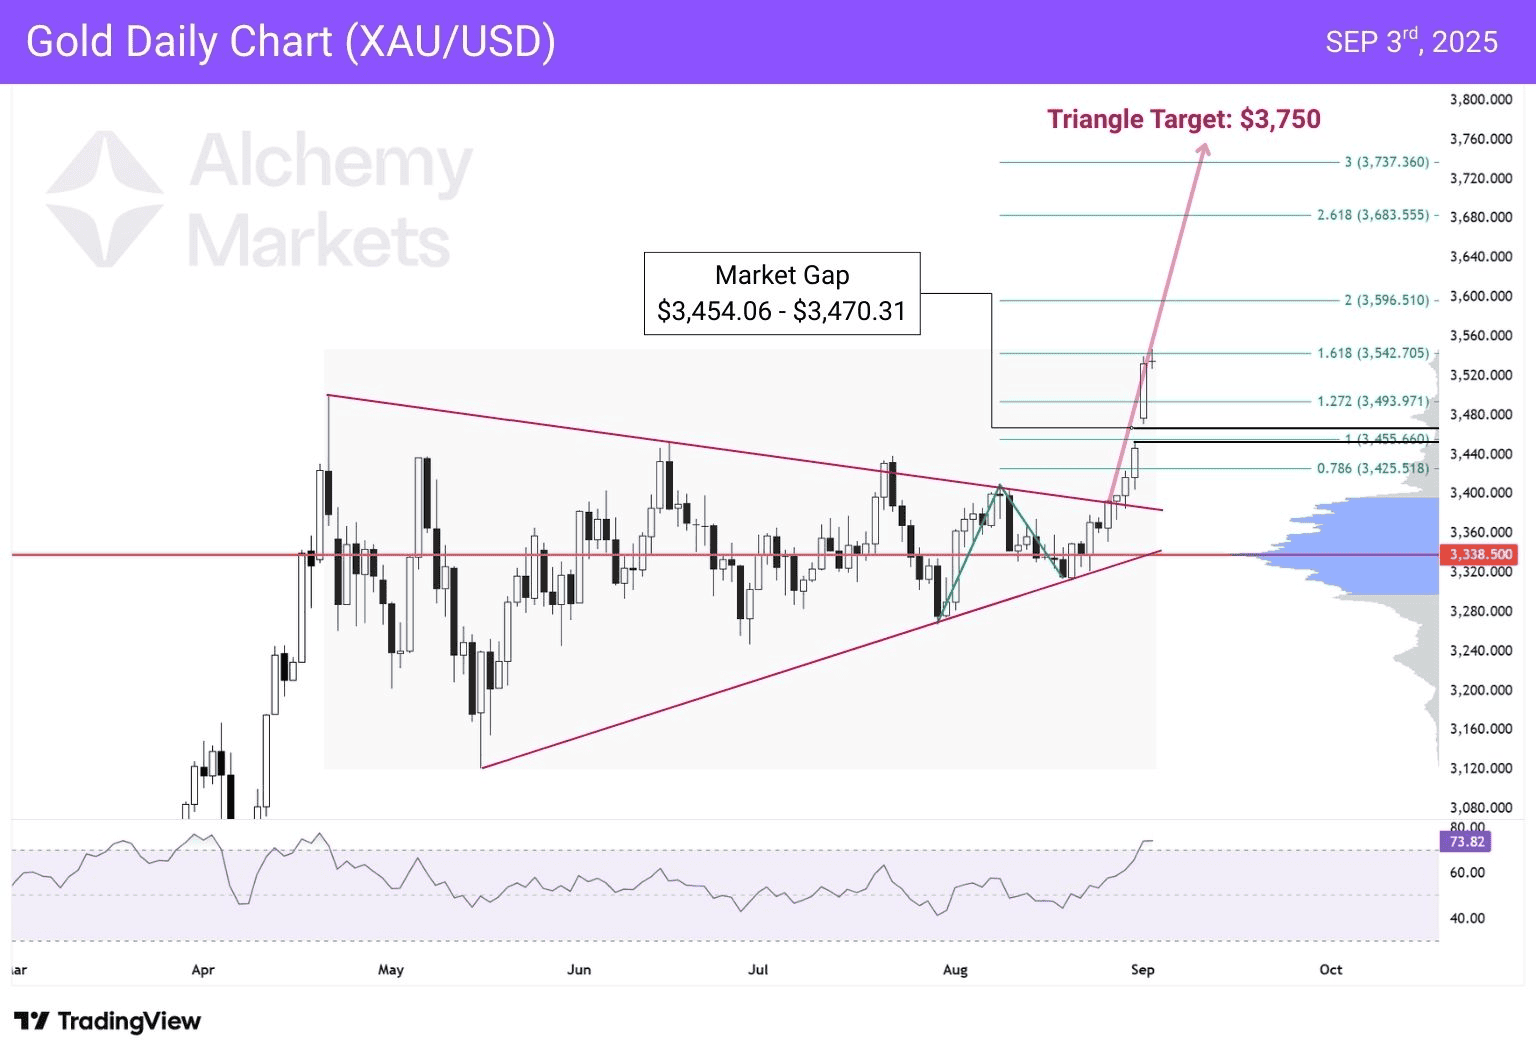
Of course, Gold can continue its run higher, with the triangle’s breakout target at $3,750; so this is by no means a call for traders to run shorts. With tariffs being ruled illegal by the federal courts, and UK yields surging, we’re in somewhat of a peculiar state in the markets — which drives more demand into safe havens like Gold.
Tariff Being Ruled Illegal by Federal Courts Effect:
- Creates legal uncertainty, leaving tariffs technically in force until higher courts decide.
- Adds confusion for corporations on planning imports and supply chains.
- Inflationary pressures may linger, weighing on Fed rate-cut expectations.
- Could boost safe-haven demand for Gold as traders hedge policy risk.
UK Yields Surging News Effect:
- 30-year gilt yields at multi-decade highs tighten financial conditions.
- Higher borrowing costs pressure equity valuations, especially in Europe.
- Pushes capital rotation into commodities and safe havens like Gold.
- Reinforces the global “higher for longer” narrative, keeping bullion attractive.


