- October 31, 2024
- 21 min read
Fibonacci Extensions Trading Guide
What Are Fibonacci Extensions?

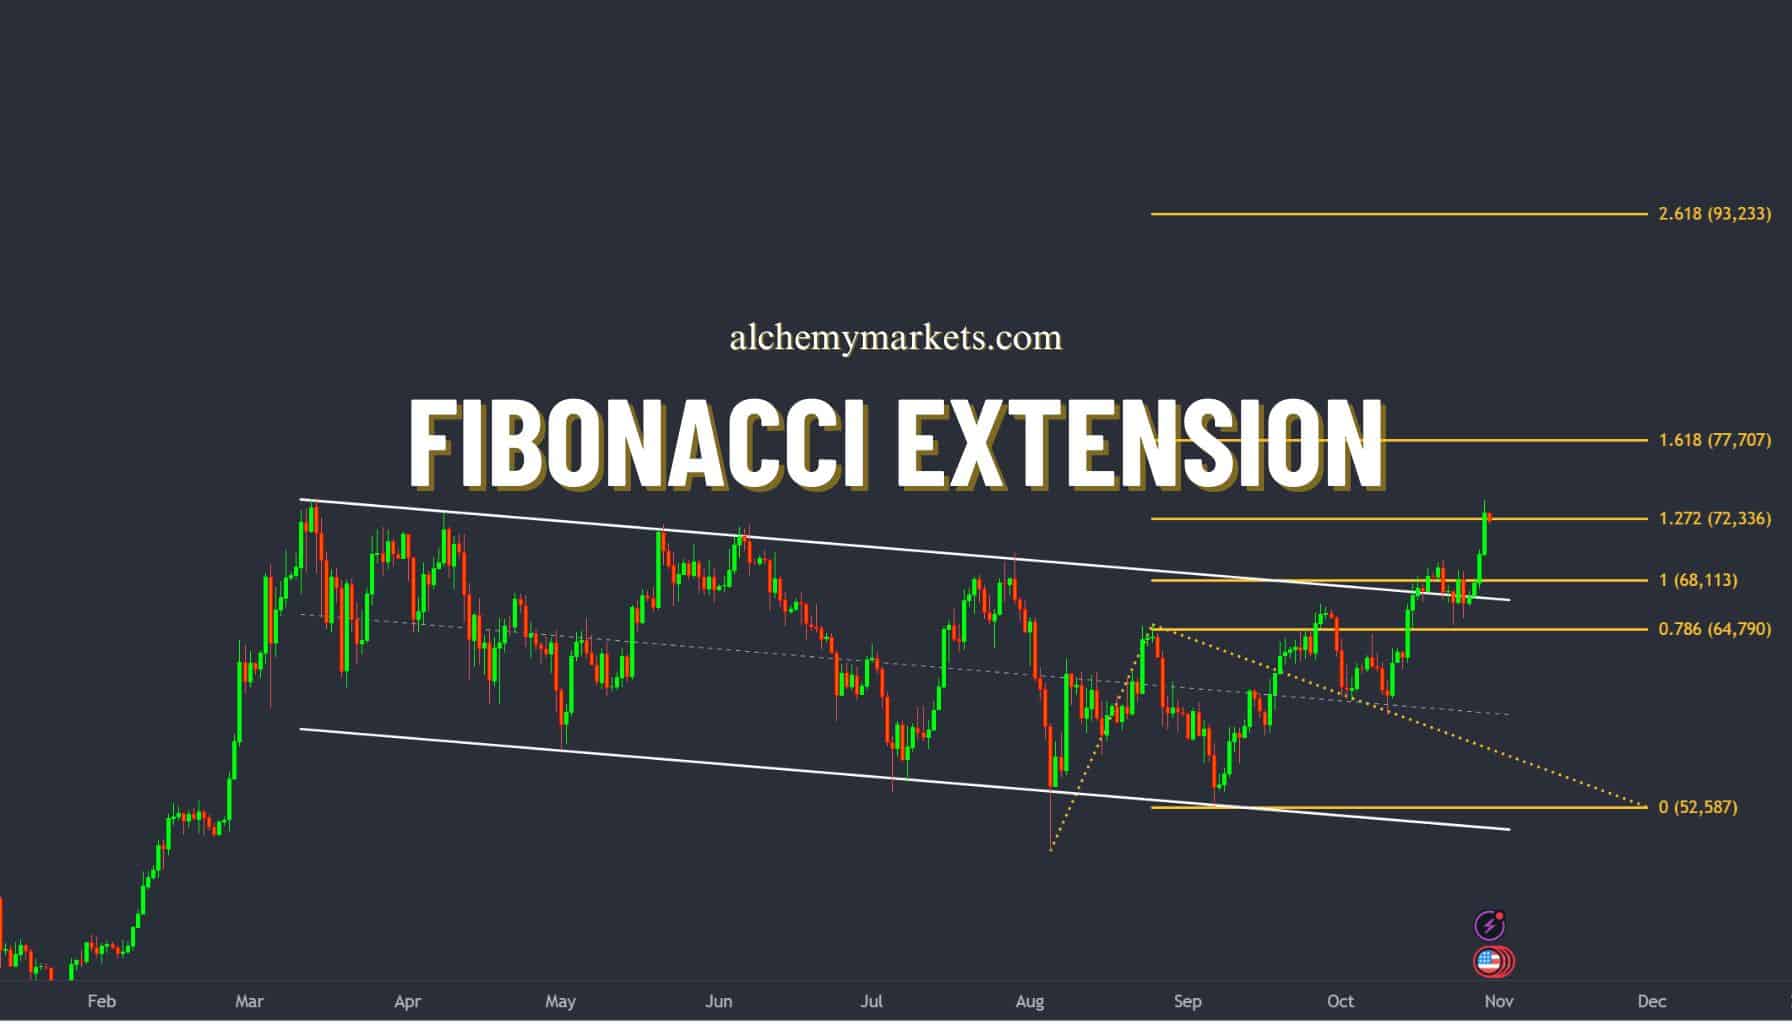
Fibonacci extension is a technical analysis tool used in financial markets to draw forward-looking horizontal lines on a price chart to project potential future price targets. Unlike Fibonacci retracements, which help identify support and resistance during pullbacks, Fibonacci extensions go further by estimating how far the price may extend in the direction of the current trend after the retracement is complete. This tool provides traders with clear levels to target for profit-taking or assessing where the price might encounter resistance or support in an extended market trend.
What Are The Key Fibonacci Extension Levels?
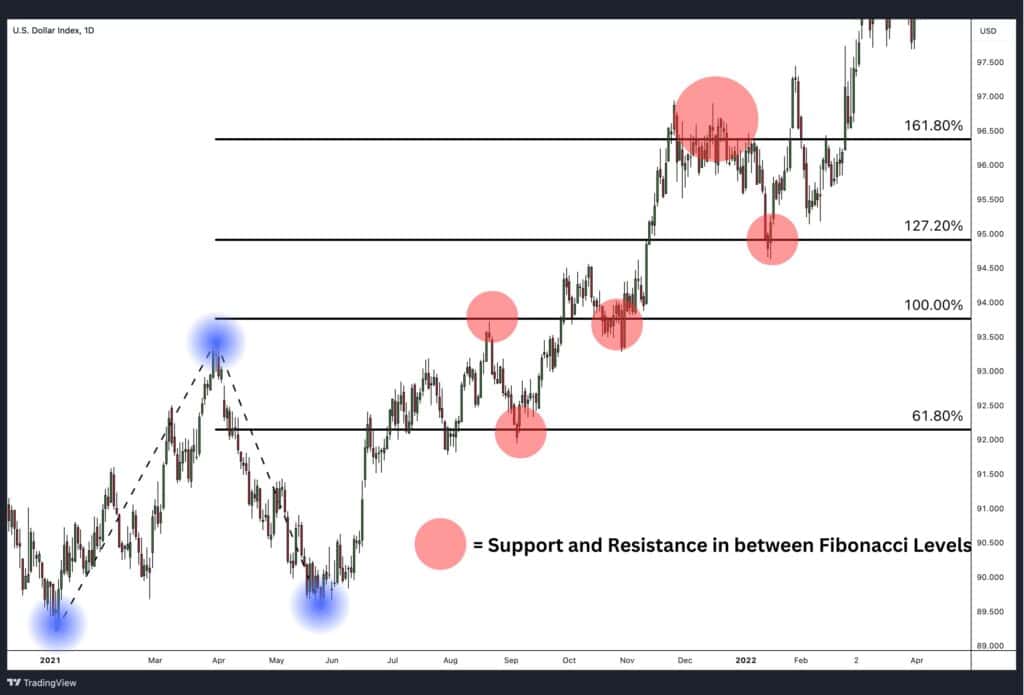
Fibonacci extension levels are specific price levels calculated beyond the initial price movement, helping traders project how far a trend may continue after a retracement. These levels are derived from the Fibonacci sequence and are expressed as percentage distances of the original price movement.
The most commonly used Fibonacci extension levels are:
- 61.8%: Known as the golden ratio, this level is often viewed as a key target where the price may initially slow down or pause.
- 100%: This level represents an equal move to the original price swing
- 127.2%: A moderate extension level where traders often anticipate a price reaction.
- 161.8%: Another key level, often indicating a significant extension and a major price target.
There are a few other levels that traders incorporate, but we feel the ratios above are the best Fibonacci extension levels to follow.
Traders use these Fibonacci extension levels to set target prices and manage risk by identifying where the price might encounter significant resistance or stall, making them a crucial component of trading strategies in trending markets.
What Does the Fibonacci Extensions Indicate?
In terms of the price progression into the extension zone, each of the best Fibonacci extension levels (61.8%, 100%, 127.2%, and 161.8%) represent a key point where the price could potentially react, either by slowing down, stalling, or even reversing. These levels are projected beyond the retracement, and here’s what they generally indicate in the context of a trend’s progression:
- 61.8% Extension: Initial Resistance or Support Zone
- Meaning: The 61.8% extension is often viewed as a modest continuation of the initial trend. It’s the first significant extension level after a retracement and frequently acts as a mild resistance or support level.
- In the Trend: As the price progresses towards this level, it may start to slow down or consolidate before attempting to push further. Traders might take partial profits here because it’s seen as a natural pause point.
- 100% Extension: Equal Move
- Meaning: The 100% extension suggests that the second leg of the price move is equal in size to the initial trend. This level often marks a psychologically significant point, as it represents a full replication of the original move.
- In the Trend: As the price reaches the 100% extension, traders expect it to encounter stronger resistance or support. It often becomes a decision point for whether the trend will continue or reverse. A strong breakthrough here can signal a continued trend with momentum.
- 127.2% Extension: Stronger Continuation
- Meaning: The 127.2% extension indicates that the price is extending beyond the length of the initial trend. This suggests that the market still has strength in the direction of the trend, but traders might start to anticipate some resistance.
- In the Trend: When the price reaches this level, it suggests a strong continuation. The 127.2% level often serves as an area where more aggressive traders will start looking to exit or tighten stops, expecting potential resistance or reversal.
- 161.8% Extension: Golden Ratio, Major Turning Point
- Meaning: The 161.8% extension is often referred to as the “golden extension” and is considered a major price target. This level typically marks a point where the trend is overextended.
- In the Trend: As the price pushes towards the 161.8% extension, traders expect a much higher chance of reversal or at least significant resistance. It’s often a key profit-taking zone because, by this point, the trend has likely matured, and market participants expect it to encounter serious resistance or a pullback.
Fibonacci Extensions Formula

To effectively calculate Fibonacci extensions by hand, follow this simple process with a three-point chart, as shown in the diagram. Let’s break this down step by step:
Step 1: Identifying the Key Points
On your price chart, identify three significant points that will serve as the foundation for your calculation:
- Point 1: The starting point of the initial price move (swing low or swing high).
- Point 2: The end of the initial price move, which marks the swing high (in an uptrend) or swing low (in a downtrend).
- Point 3: The retracement point where the price pulls back after the initial move.
These three points form the basis for calculating how far the price may extend once the retracement is complete.
Step 2: Calculating the Initial Trend
To calculate the initial price movement:
Initial Trend = Price at Point 2 − Price at Point 1
McDonald’s Example: Initial Trend = 262.33 – 243.55 = 18.78
This difference gives you the magnitude of the initial price move. It’s essential because the Fibonacci extension levels will be based on this movement. In essence, the initial price trend in McDonalds was $18.78.
Step 3: Applying the Fibonacci Extension Ratios
Once you’ve calculated the initial trend, you’ll multiply it by your chosen Fibonacci extension ratio:
Multiple = Initial Trend × Fibonacci Extension Ratio
McDonald’s Example: Multiple = 18.78 × 1.618 = 30.38
For example, if you’re targeting a 100% extension, you would multiply the initial trend by 1.00.
What this means in the McDonald’s example is that the 161.8% extension would travel $30.38.
Step 4: Calculating the Projected Price Extension
To find the projected price at the extension level, add the multiple to the price at Point 3 (the retracement level):
Price Extension = Price at Point 3 + Multiple
Price Extension = 246.12 + 30.38 = 276.50
This will give you the projected price level where the market might reach after completing the retracement. For McDonalds stock, this provides a price target of $276.50 where prices may pause and possibly reverse.
How to Calculate Fibonacci Extensions Levels
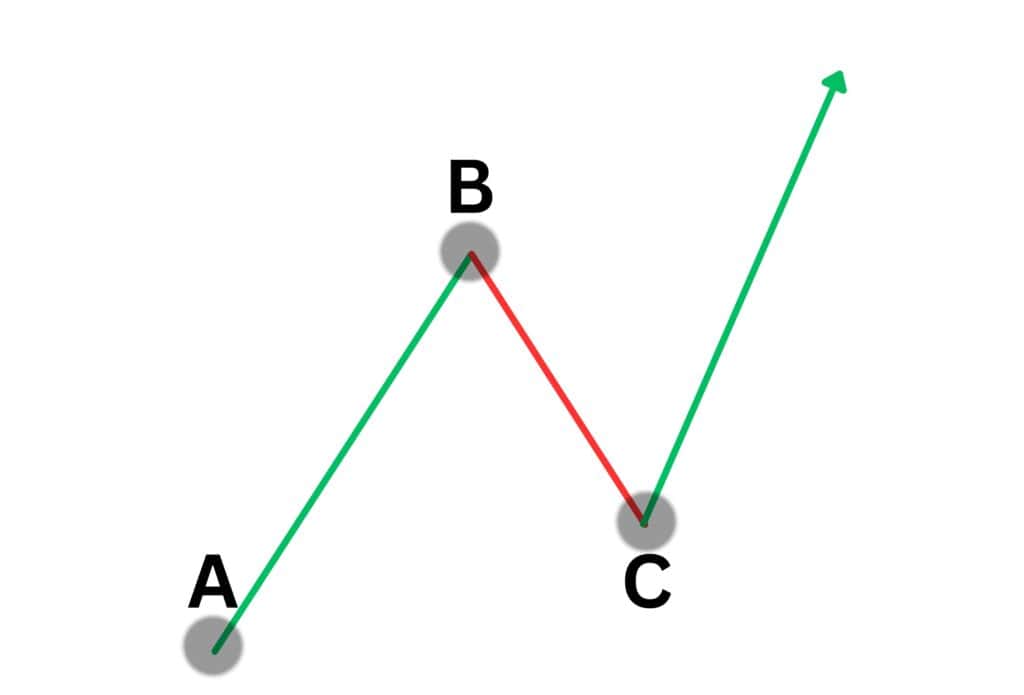
Fibonacci extension levels are determined by measuring price movements during trend extensions after a retracement. This calculation relies on an impulse move to the upside (in a bullish scenario) or downside (in a bearish scenario), followed by a correction that does not break the previous low (in an uptrend) or high (in a downtrend). The Fibonacci extension tool is then used to project how far the price might move in the direction of the trend.
The Process:
- Identify the Impulse Move:
- In an uptrend, this is the initial price move from the swing low (Point A) to the swing high (Point B).
- In a downtrend, it’s the opposite—starting from a swing high to a swing low.
- Wait for the Retracement:
- Once the impulse move is complete, the price will typically retrace. The retracement should not break the original starting point (Point A). For an uptrend, this retracement forms Point C (a higher low), and for a downtrend, it forms a lower high.
- Measure the Retracement:
- The Fibonacci extension tool measures the distance between Point A (the starting point of the impulse move) and Point B (the extreme point of the price move).
- This distance is then multiplied by a Fibonacci ratio (such as 127.2% or 161.8%) and added to Point C (the retracement level). This calculation projects the potential target areas where the price might extend in the direction of the trend.
How to Draw Fibonacci Extensions Levels
The Fibonacci extension levels are drawn using the Fibonacci tool. Once the tool is activated on your charting platform, it will take three-clicks to draw it on your charts.
The first click would correspond at the beginning of the initial trend, this would be Point A. The second click would drop on top of Point B, representing the end of the first price trend.
The tool is then calculating the distance from point A and B and that distance will get multiplied by the Fibonacci extension level, which as we established earlier, is based on key fibonacci ratios.
The third click of drawing with the tool will be at point C. This is where the partial retracement has ended the pullback from the original trend.
Once these points are identified, horizontal lines representing the Fibonacci extension levels are drawn beyond Point B, projecting potential price levels for the trend continuation. These extension levels serve as target prices where traders may expect the price to slow down or reverse, offering an opportunity for profit-taking or trade adjustments.
Fibonacci Extensions Example
Let’s explore how Fibonacci extensions work with the following real-market examples. Each chart represents a significant trend followed by a retracement, and then Fibonacci extension levels project future price targets based on the movement beyond the retracement.
Example 1: Bitcoin (BTC/USD)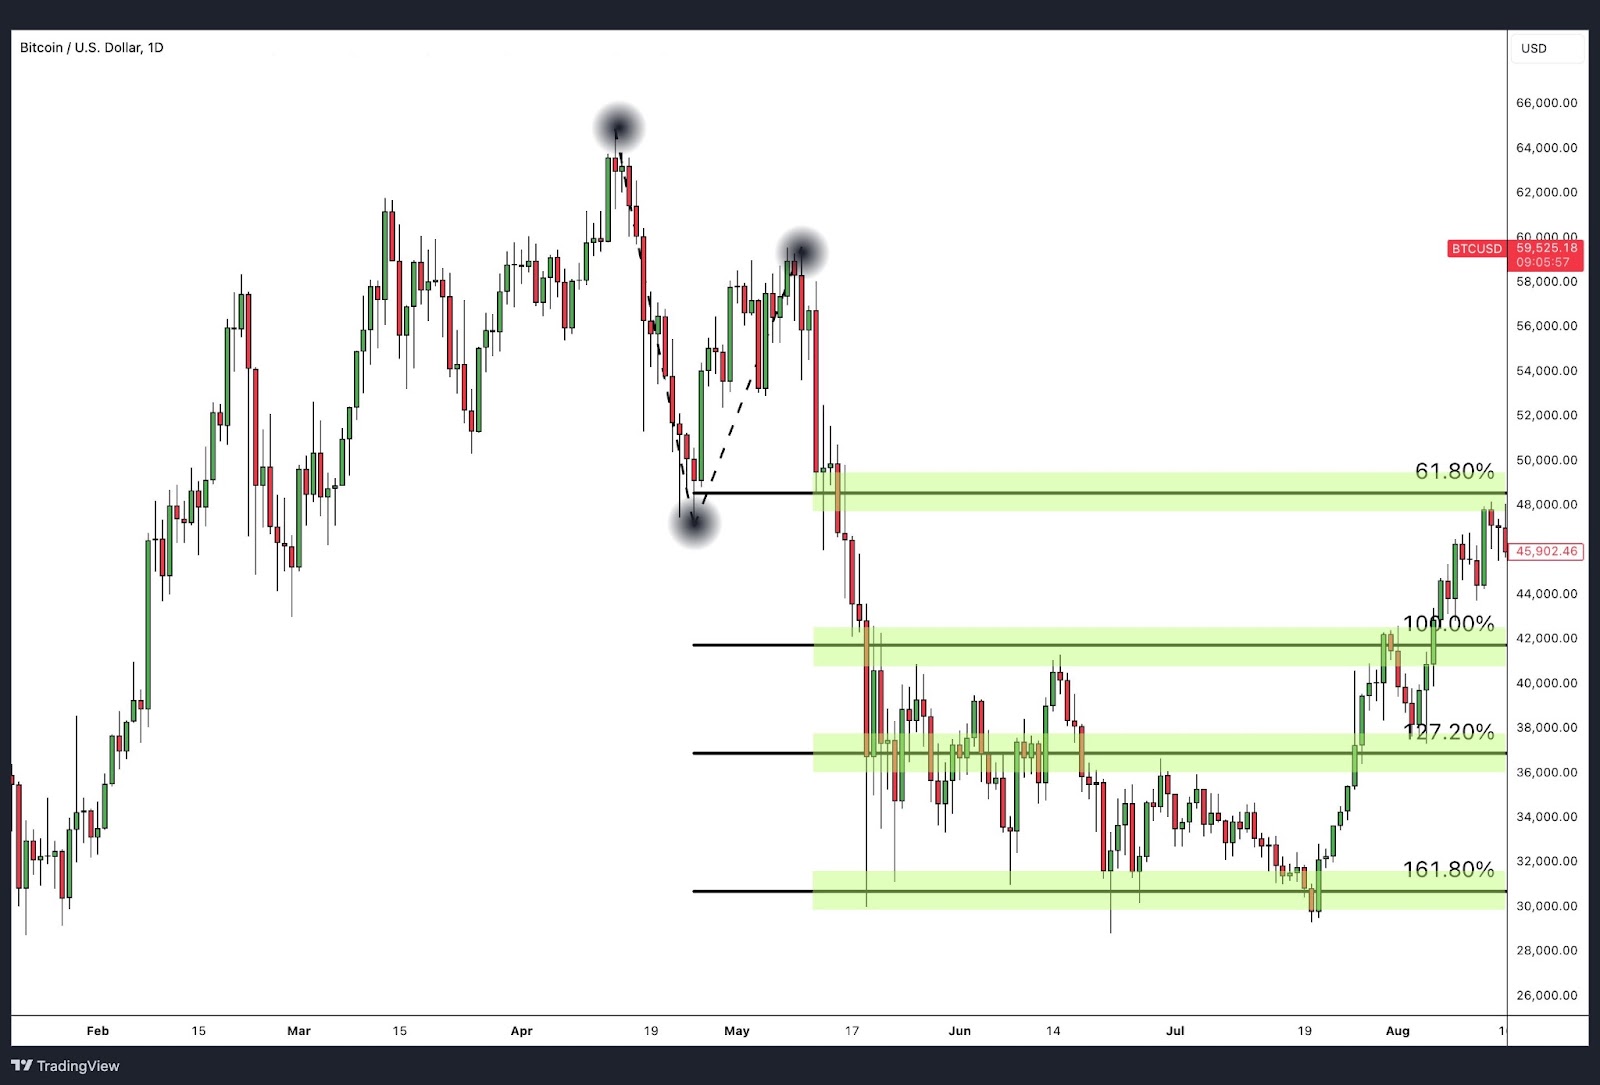
- Chart Analysis: In this example, Bitcoin had a significant price swing creating an initial bearish move from the highs near $64,000 down to $48,000. After this move, the price retraced back to just below $60,000. Following this retracement, the trend resumed to the downside.
- Key Levels:
- The price continued its decline and reached the 1.618% Fibonacci extension target price around $31,000, a common extension target in strong trends.
This example demonstrates how Fibonacci extensions measure potential downside targets after a retracement, with the 1.618% extension acting as a key support level where the price found some stability.
Example 2: British Pound (GBP/USD)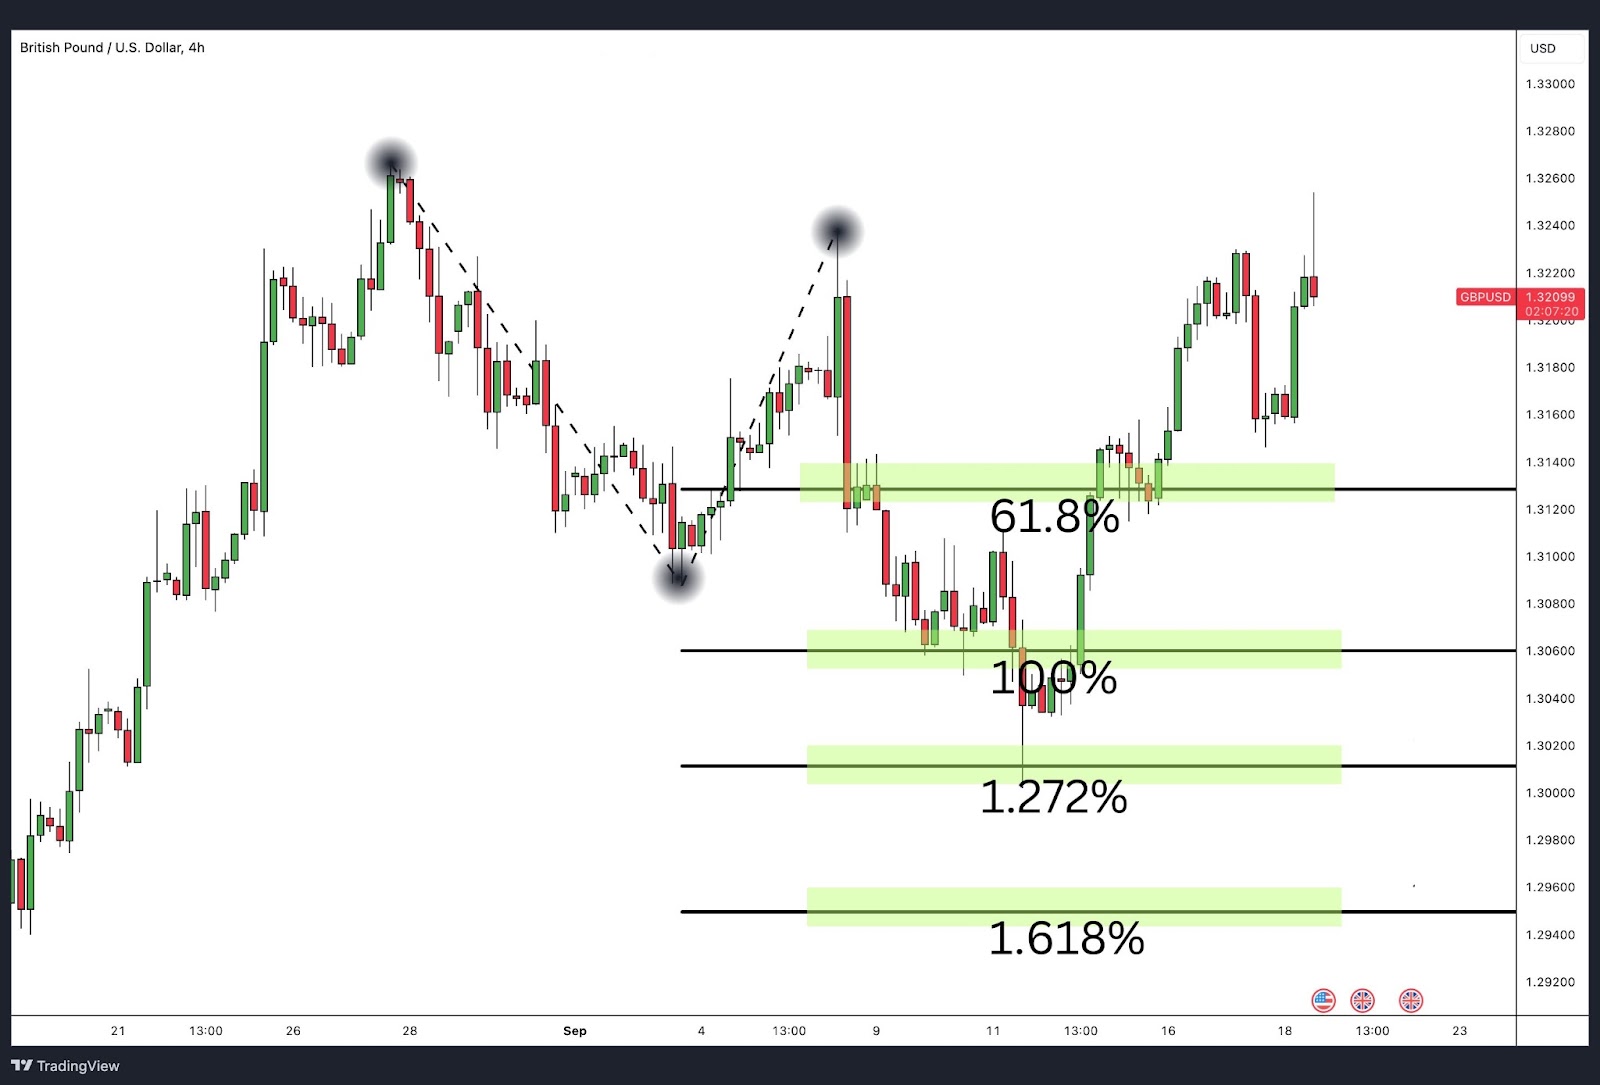
- Chart Analysis: In the GBP/USD pair, we first observed a bearish impulse, followed by a retracement. After the retracement, the price resumed its downward movement.
- Key Levels:
- The continuation of the downtrend stalled at the 1.272% Fibonacci extension, which was around the 1.301 price level. This level provided temporary support before the market consolidated.
Here, Fib extensions helped forecast where the price might encounter support, with the 1.272% extension acting as an intermediate level before further movement.
Example 3: USD/JPY
- Chart Analysis: In the USD/JPY chart, a strong uptrend is followed by a minor retracement. Fib extensions were used to estimate future price movements based on the initial price swing.
- Key Levels:
- The 61.8% extension provided an initial target, with price reacting around that area.
- 100% and 127.2% levels projected further targets beyond the original high.
- 161.8% extension at around 147.00, indicating a possible area for the price to encounter stronger resistance.
These extension levels helped define possible price targets for profit-taking in a strong uptrend.
Example 4: S&P 500 (SPX)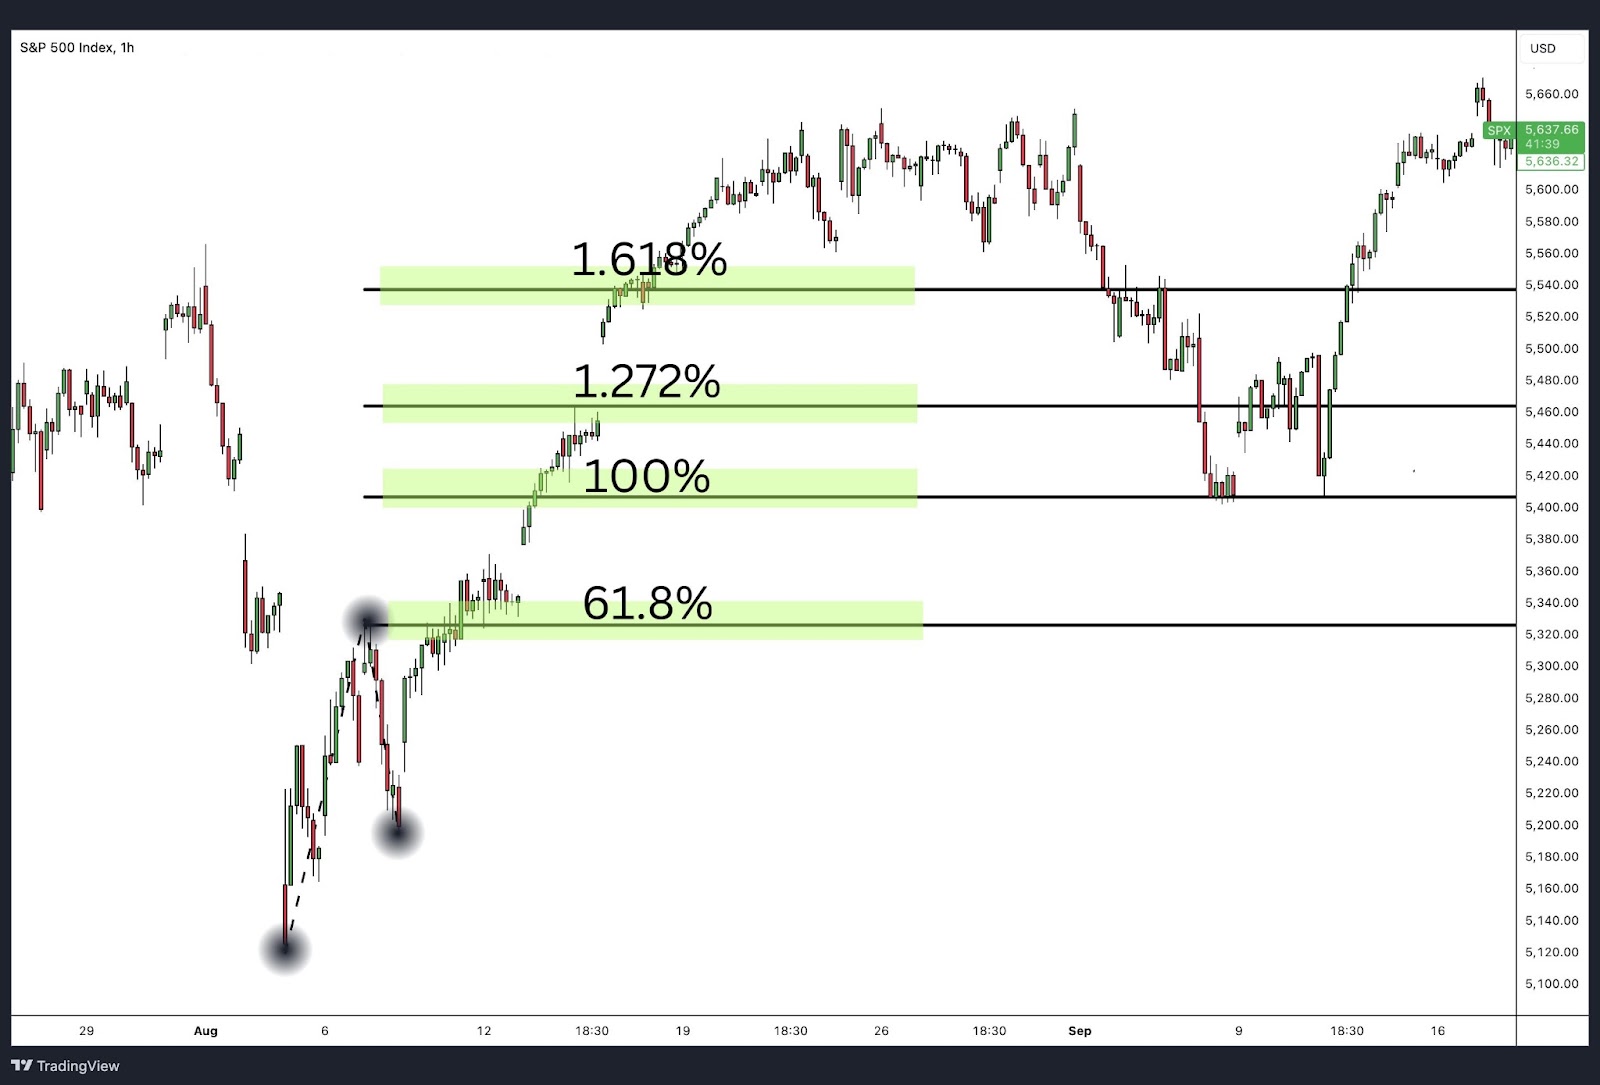
Chart Analysis: The S&P 500 showed a strong price swing to the upside, followed by a retracement. Fibonacci extensions were used to project potential price targets in the event of continued bullish momentum.
Key Levels:
- The 100% extension represented an equal move to the initial price swing.
- The 127.2% and 161.8% levels provided additional targets for traders aiming to capture further momentum.
However, in this case, the price surged through the Fibonacci extension levels, even surpassing the extreme 1.618% level. This shows that while Fibonacci extensions offer useful price targets, they are not always guaranteed to be respected by the market.
Lesson: Even though the price continued beyond the 1.618% extension, it’s crucial for traders to stick to their trading plan. If your target was the 1.618% level, it’s better for the price to overshoot that level than to reverse before reaching it. This emphasises the importance of discipline in trading—sometimes the price can sprint through key levels, but sticking to the plan helps manage risk effectively.
Fibonacci Extensions Trading Strategies
Fibonacci extensions are a valuable tool for traders looking to capitalise on trend continuations and breakout strategies. These levels help project future price targets and provide potential zones where traders can set profit targets. Let’s dig into several different strategies you can use with the Fib extension tool to make informed trading decisions.
Trend Continuation Strategy
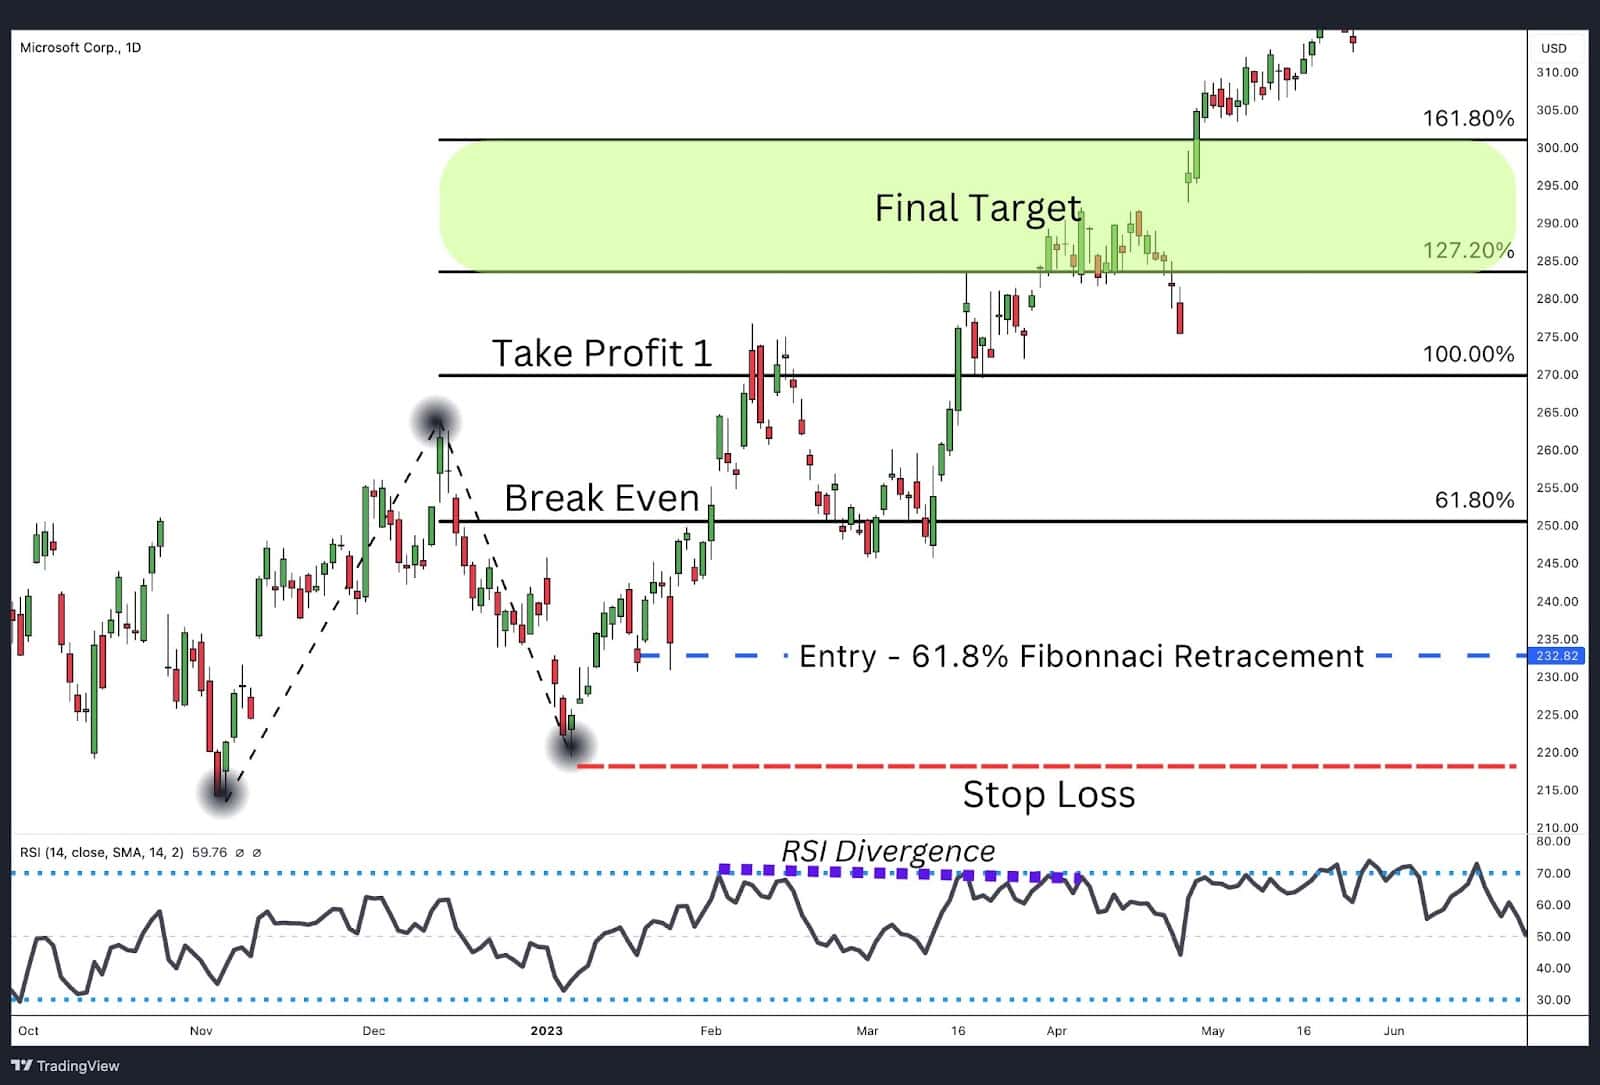
This strategy focuses on entering trades during a trend retracement and aiming for profit as the trend resumes. Here’s a common setup using Fibonacci retracements and extension levels.
How It Works:
- Entry: Buy when the price retraces to the 61.8% Fibonacci retracement level. This level is often a strong support area in an uptrend.
- Stop Loss: The stop loss is placed just below the lowest point of the retracement move to protect against further downside risk.
- First Target: Set the first profit target at the 61.8% extension of the Fibonacci move, take partial profits, and then move the stop loss to the break-even point to secure your position.
- Second Target: Once the price reaches the 100% extension, take partial profits off the table to lock in gains.
- Final Target: The 1.272% to 1.618% Fibonacci extensions should be your final target, where the price is likely to experience significant resistance or a slowdown.
RSI Divergence (Optional):
You can use the Relative Strength Index (RSI) to confirm that the trend is losing momentum. Look for a bearish RSI divergence (where the price is making new highs, but the RSI is not) as a signal that the impulsive move might be running out of steam.
Example:
- The price retraces to the 61.8% Fibonacci retracement level in an uptrend.
- The trader buys at this level and sets the first profit target at 61.8% extension.
- The second target is set at 100%, and the final profit target between 1.272% and 1.618%, using RSI as a divergence indicator to confirm when the move is weakening.
Fibonacci Extensions Trend Reversal
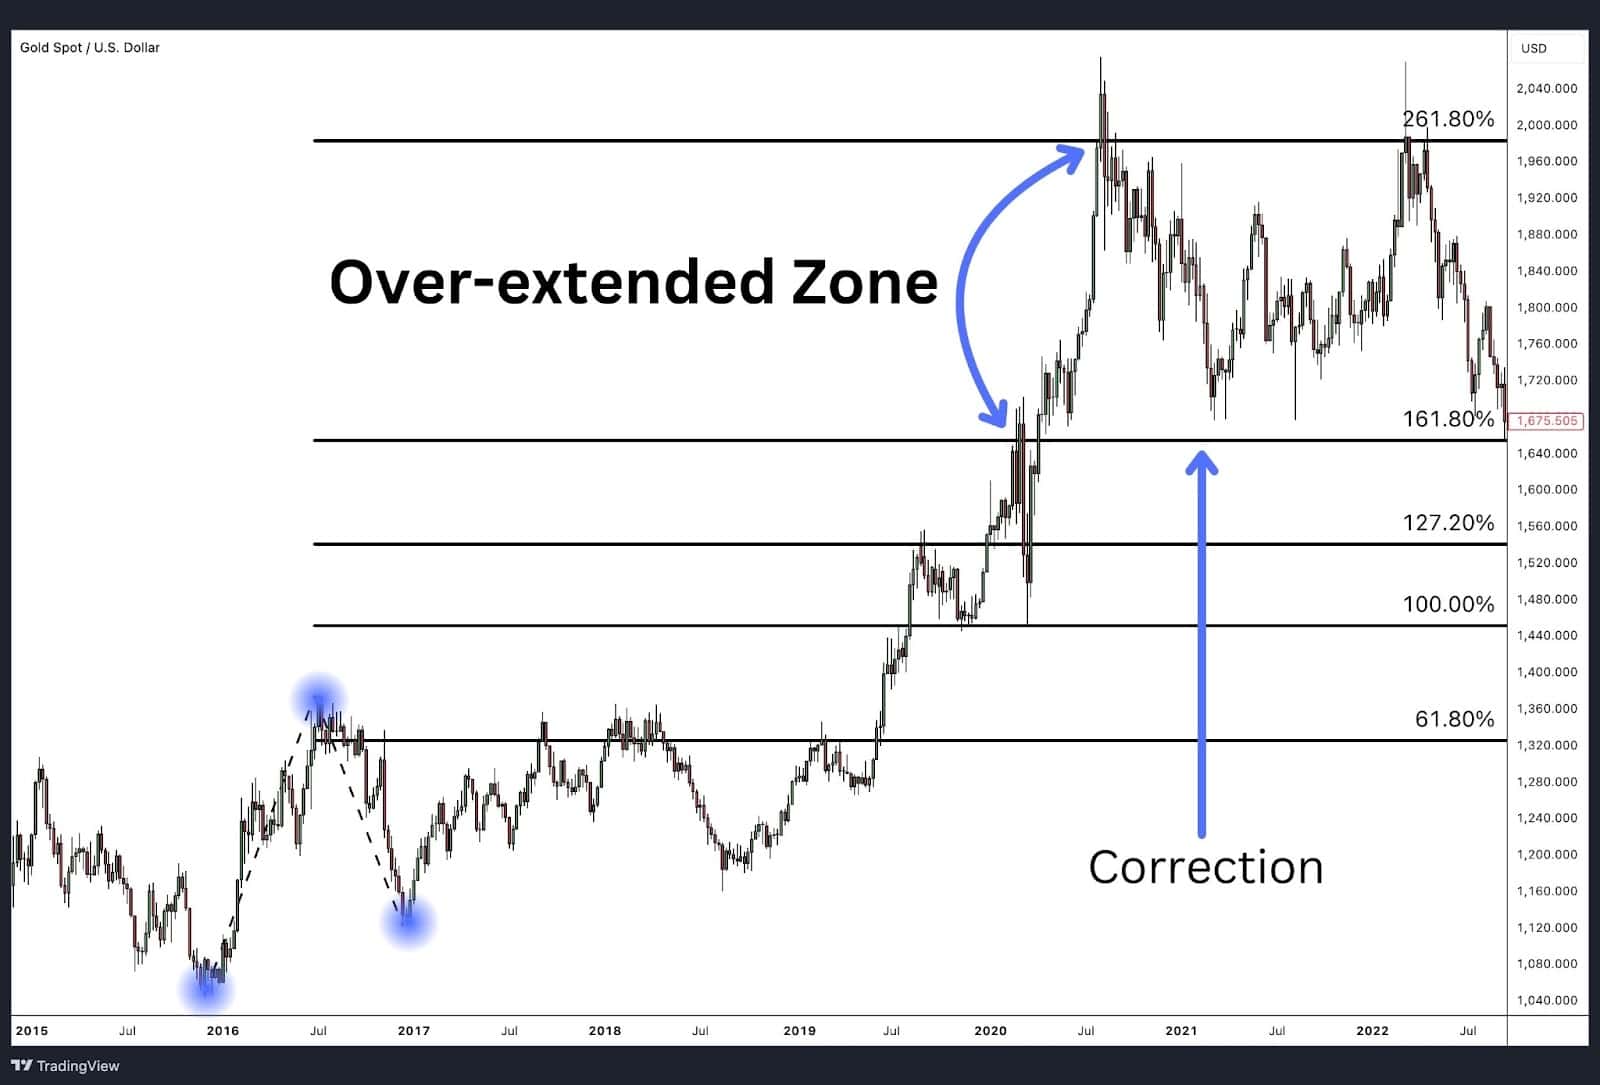
Fibonacci extensions can help identify potential reversal points when the price reaches an extended Fibonacci level, like 100%, 1.272 or 1.618%, signalling a market that may be overbought or oversold. This method becomes especially effective when combined with other technical analysis tools, such as support and resistance levels, candlestick patterns, or momentum indicators. In these cases, the reversal from an extension level in a counter-trend move can set up a trade in the direction of the larger trend.
How It Works:
- Spot Over-extended Moves: When the price hits an extreme extension level, such as 1.618% or the rare 2.618%, it often signals that the market is overextended. The likelihood of a reversal increases, especially if confirmed by support/resistance levels or momentum divergence.
- Set Reversal Targets: Instead of simply trying to pick tops or bottoms, use the Fibonacci extension in combination with other indicators to anticipate where the counter-trend move may terminate. For example, in Elliott Wave Theory, a zigzag corrective pattern often ends when wave C extends to 100% of wave A, using Fibonacci extension to pinpoint the completion of the correction and the resumption of the larger trend.
By aligning these extension levels with other tools, traders can more accurately pinpoint reversal zones and avoid falling into the trap of trying to call tops or bottoms prematurely.
Fibonacci Extensions Confluence
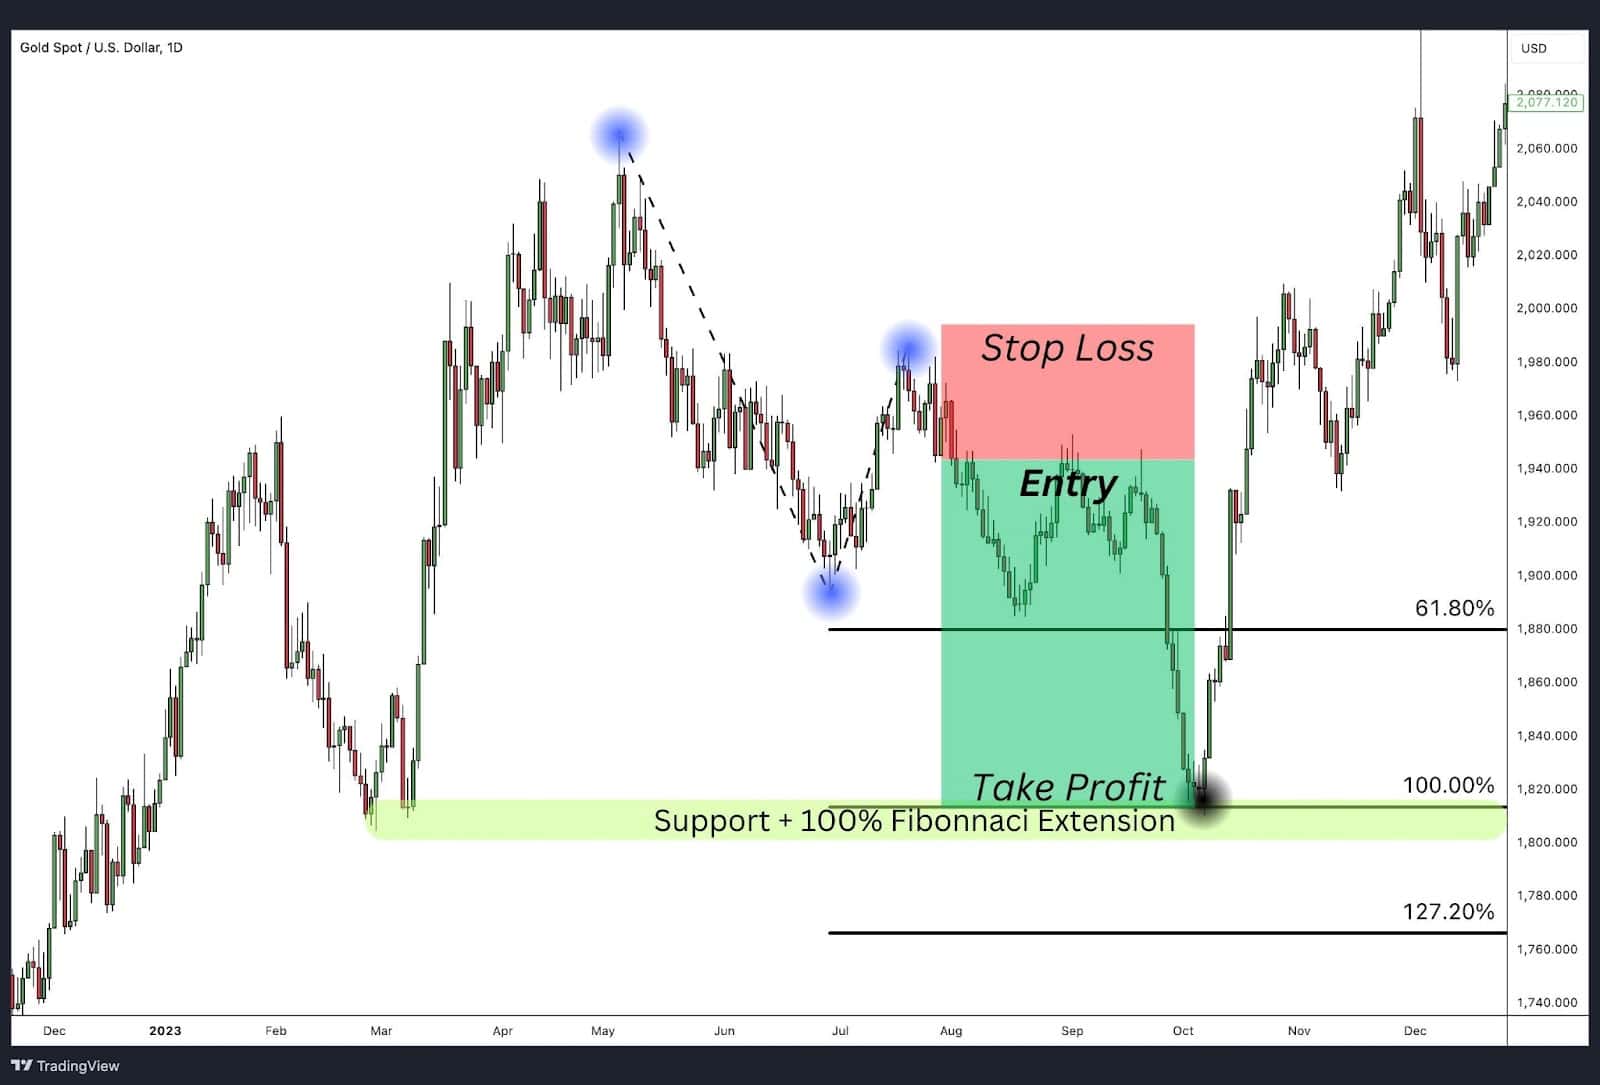
Confluence occurs when multiple technical indicators align at the same level, increasing the likelihood that the level will act as a significant support or resistance zone. In the case of Fibonacci extensions, confluence happens when Fibonacci retracement levels, extension levels, and other indicators like moving averages or trendlines meet at the same price point.
How It Works:
- Apply Tools to Chart: Apply the Fibonacci retracement tool and extension tool to the charts
- Look for Overlapping Levels: If Fibonacci extension levels align with Fibonacci retracement levels, with a previous swing high or low, then the area becomes a potential reversal zone.
This confluence of indicators can give traders more confidence in their trades by highlighting high-probability areas where the price is likely to react.
Fibonacci Extensions Divergence
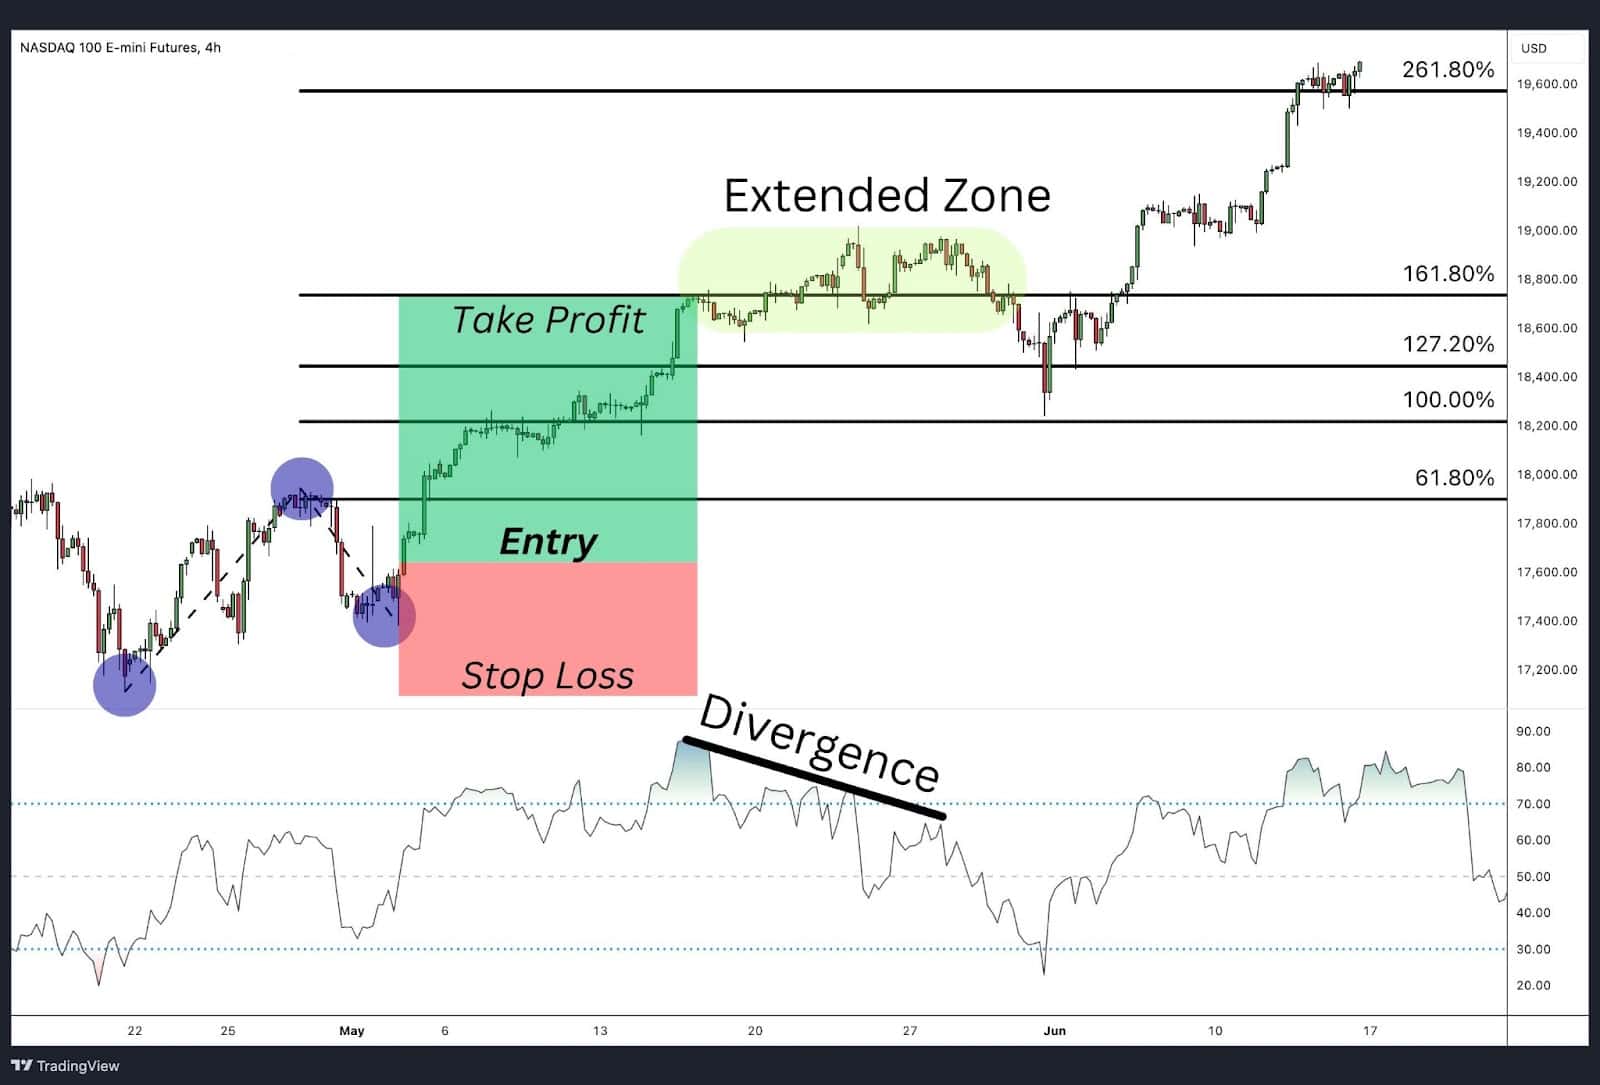
Divergence refers to the situation when the price is moving in one direction, but a technical indicator, such as the RSI or MACD, is moving in the opposite direction. When using Fibonacci extensions, divergence can indicate that the impulsive move is losing momentum, signalling a potential trend reversal or slowdown.
How It Works:
- Identify the Extension Level: Use Fibonacci extensions to project the next resistance level in an uptrend or support level in a downtrend.
- Check for Divergence: If the price continues upward but the RSI shows a bearish divergence (lower highs), it could signal the price is nearing exhaustion.
- Reversal Signal: This combination of Fibonacci extensions and divergence provides a powerful signal that the trend may reverse or correct after reaching an extension level, especially at the 1.618% or 2.618% levels.
Divergences are an early signal that the market is about to change direction, especially after reaching critical Fibonacci extension levels.
Fibonacci Extensions Retracement Confirmation
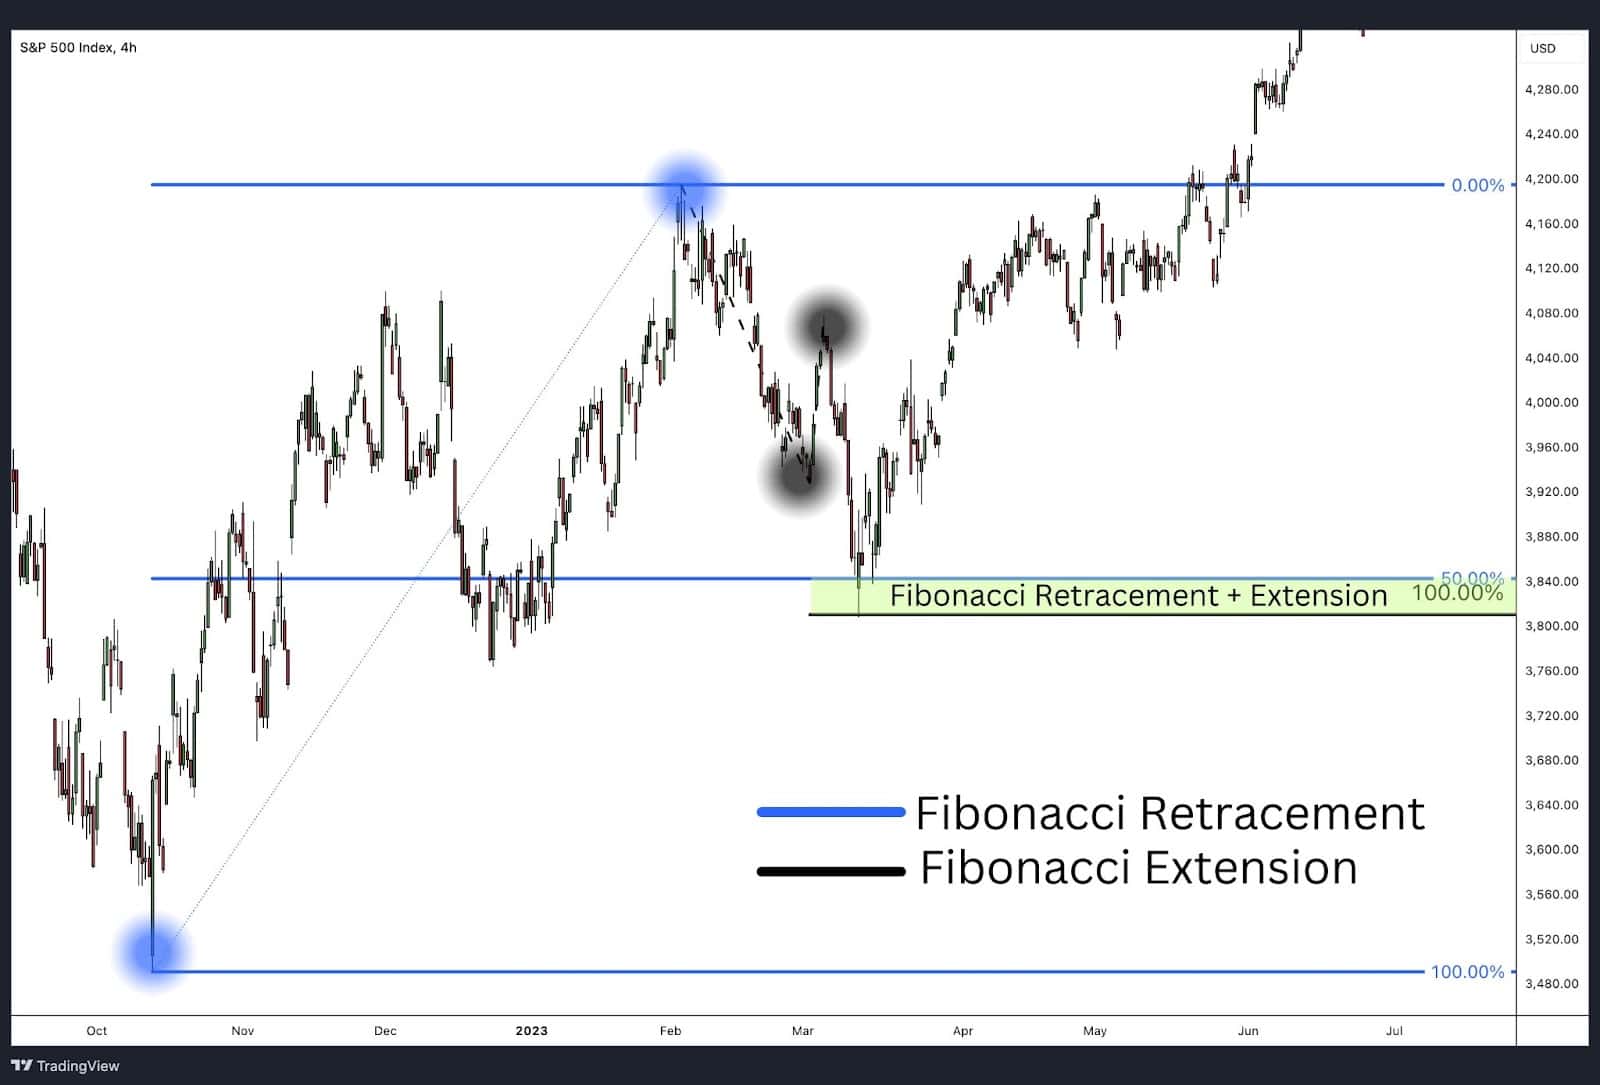
In retracement confirmation strategies, Fibonacci extensions are used alongside retracement levels to predict where a trend is likely to resume and how far it might extend after the retracement completes. The retracement levels act as areas to enter the trade, while the extensions project profit targets.
How It Works:
- Identify the Retracement: After the price moves in a strong trend, wait for a retracement to one of the Fibonacci retracement levels (e.g., 38.2% 50% or 61.8%).
- Use Extensions for Targets: Once price completes retracing, in this case 50% Fibonacci Retracement, Fibonacci extensions help project where the price might move next. Set the first target at 100%, and additional targets at 1.272% or 1.618%.
This is known as Fibonacci clusters — where multiple Fibonacci levels from different swings or price moves align—are particularly important. These clusters indicate price areas that are likely to be significant for traders. A cluster of Fibonacci levels creates a stronger area of potential support or resistance, increasing its relevance in a trader’s decision-making process.

For example, if several Fibonacci extension levels align in a particular price range, traders may view this as a key area where the price might encounter strong resistance or support, leading to profit-taking or further analysis before entering or exiting a trade. These clusters often become pivotal points on the chart, enhancing the reliability of Fibonacci extensions when combined with other chart patterns or significant price swings.
In the chart example provided above, the target zone was determined by using both Fibonacci retracement and Fibonacci extension levels:
- The blue Fibonacci retracement levels on the left were drawn from the bearish move. This retracement identified potential levels of resistance based on that downtrend.
- The black Fibonacci extension levels were applied to the most recent upward trend. The 1.618% Fibonacci extension level from this new trend aligned closely with the 61.8% Fibonacci retracement level from the previous bearish move.
This alignment, or cluster, of Fibonacci levels created a strong target zone, where the price is more likely to face significant resistance and potentially reverse. This combination of retracement and extension levels offers traders a reliable method to pinpoint potential price zones to initiate new trades.
Fibonacci Extensions Levels at Support and Resistance Levels
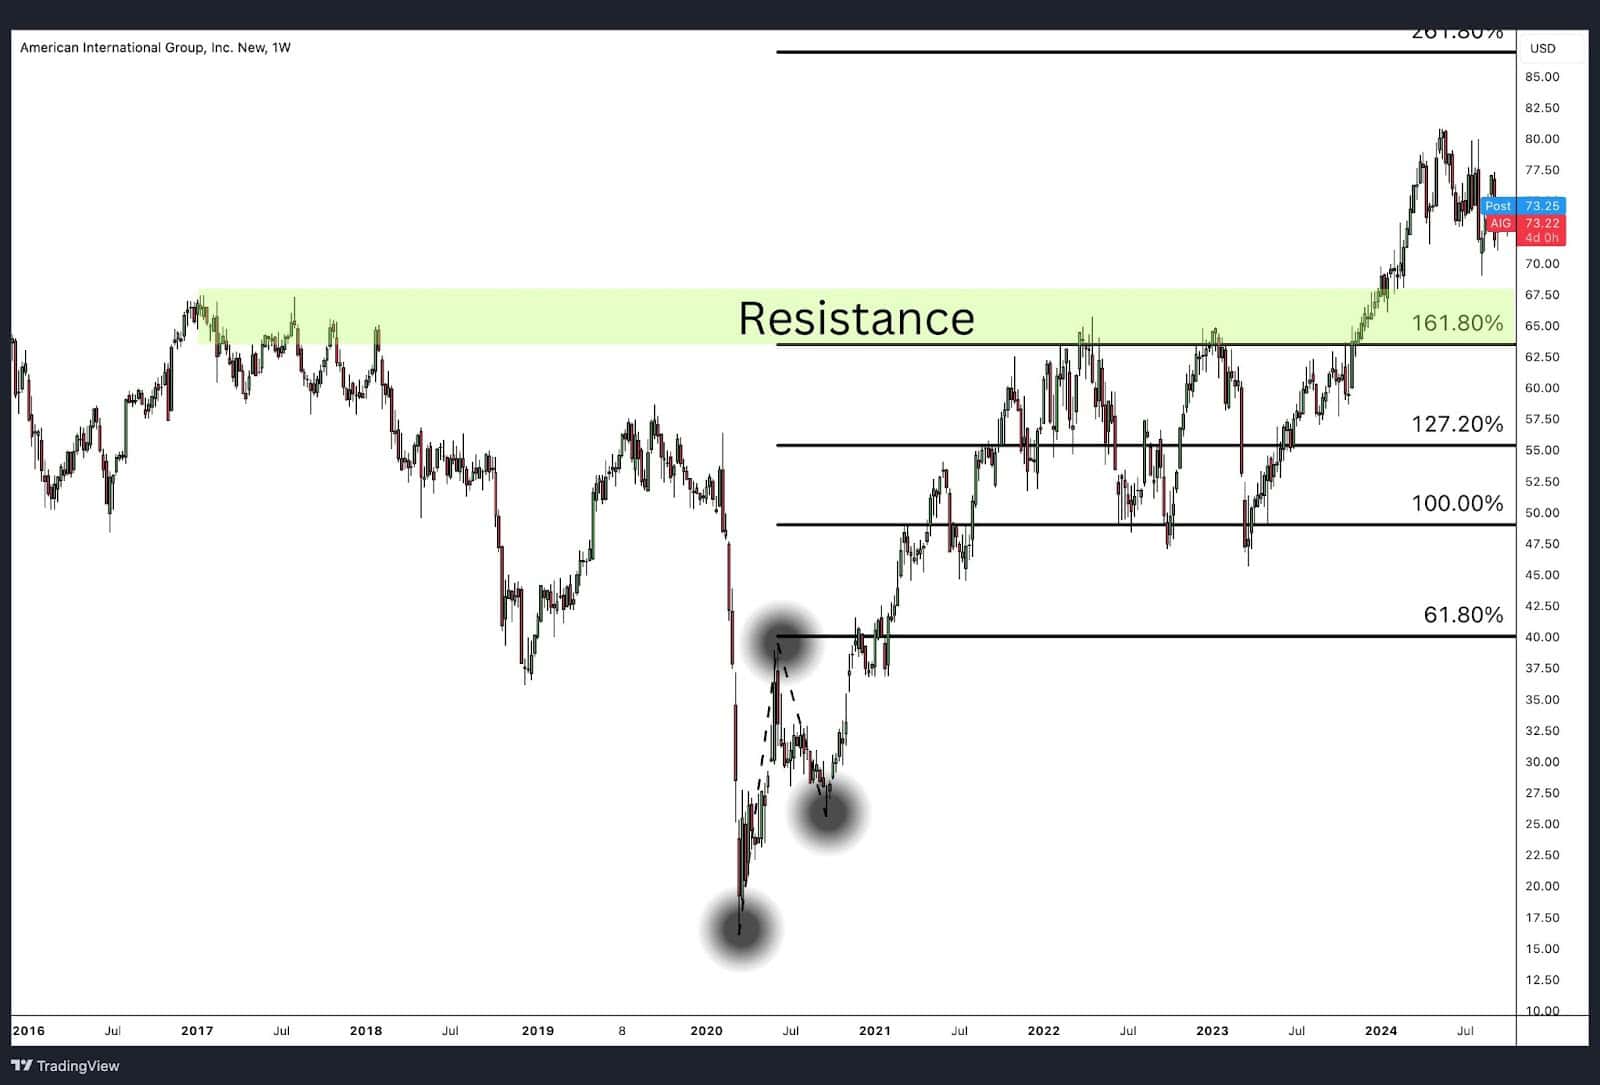
Fibonacci extensions often align with existing support and resistance levels on the chart, making them powerful tools for predicting where the price might react. When Fibonacci extension levels coincide with established support or resistance zones, these levels become stronger predictors of price action.
How It Works:
- Align Extensions with Historical Levels: Draw Fibonacci extensions and compare them to previous support and resistance levels.
- Set Profit Targets: If the 1.618% extension level aligns with a known resistance level, use that as your profit target in an uptrend. In a downtrend, look for confluence with support levels.
The combination of Fibonacci extensions with historical support and resistance levels helps traders set more accurate price targets and manage their trades effectively.
Advantages of The Fibonacci Extensions
Fibonacci extensions are a valuable tool in technical analysis, offering several key benefits to traders seeking to predict future price targets and manage trades effectively.
1. Predict Future Price Movements:
Fibonacci extensions allow traders to project price targets beyond the retracement, providing potential levels where the price might extend in the direction of the trend. This is particularly useful for identifying profit-taking zones in trending markets.
2. Works Across Markets and Timeframes:
Fibonacci extensions can be applied to stocks, forex, commodities, and other assets, and are effective across different timeframes—whether you are a day trader or a swing trader. This versatility makes them suitable for a wide range of trading strategies.
3. Combines Well with Other Tools:
Fibonacci extensions are highly effective when combined with support and resistance levels, candlestick patterns, or trendlines. This confluence enhances their accuracy, providing high-probability setups for traders.
4. Clear Profit Targets:
They provide clear profit-taking levels at 100%, 127.2%, 161.8%, and beyond. These extension levels offer traders predefined exit points, helping them manage risk and maximise gains.
Disadvantages of The Fibonacci Extensions
Despite their utility, Fibonacci extensions have some limitations that traders should be aware of.
1. Not Always Reliable:
The main criticism of Fibonacci extensions is that they do not guarantee that the price will react at the projected levels. Markets can be unpredictable, and price may ignore Fibonacci extension levels entirely, especially during volatile periods.
2. Subjectivity in Anchor Points:
Selecting the correct swing high and low to draw the Fibonacci extensions can be subjective. Different traders might choose different anchor points, leading to different extension levels on the same chart.
3. Overuse of Levels:
With so many extension levels (e.g., 61.8%, 100%, 127.2%, 161.8%, etc.), traders can experience information overload. This can make it difficult to identify which level will actually hold as support or resistance.
4. Requires Confirmation:
Fibonacci extensions should not be used in isolation. They need confirmation from other technical indicators or chart patterns to improve their effectiveness, which may complicate decision-making.
Fibonacci Extension vs Fibonacci Expansion
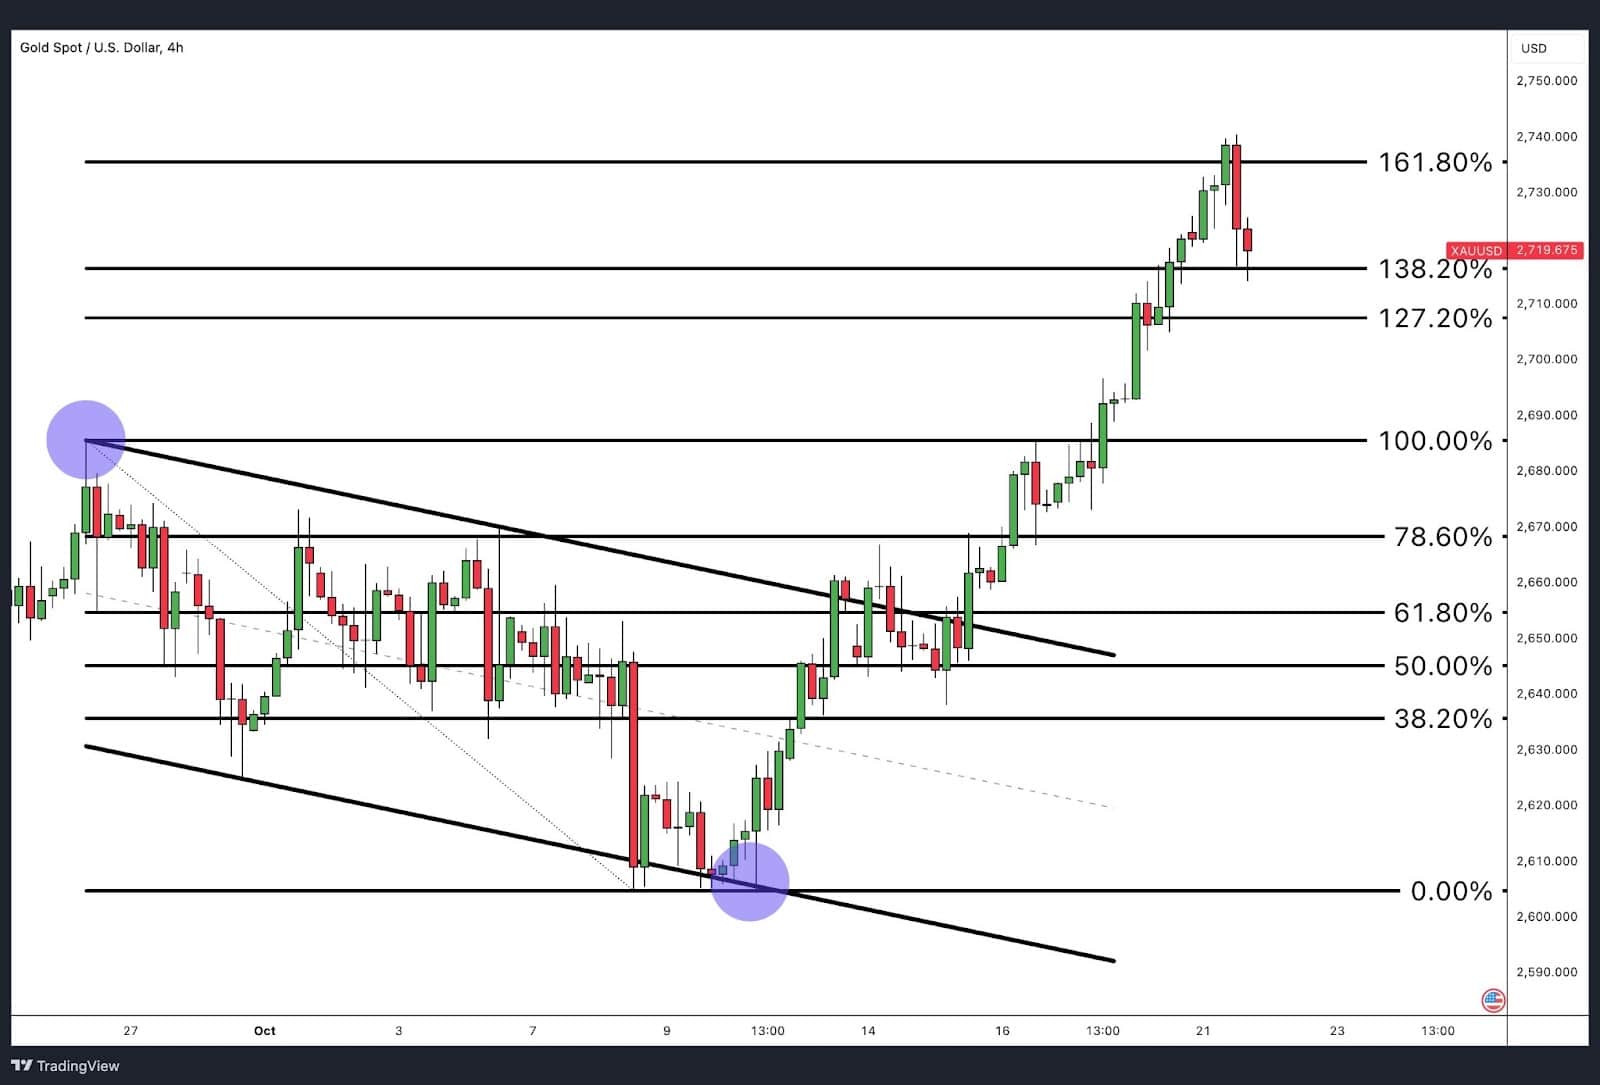
Both Fibonacci extension and Fibonacci expansion are tools derived from the Fibonacci series, but they serve slightly different purposes in trading. Fibonacci extension projects the distance of a parallel wave to the mother trend while Fibonacci expansions project the distance from an adjacent mother trend.
Fibonacci Expansion:
- Purpose: Fibonacci expansion is used to project price targets based on the adjacent wave, showing potential levels where the price might move next.
- Common Levels: 1.272%, 1.318%, and 1.618%.
- Use Case: Expansions use a 2-point Fibonacci retracement tool for measuring the start and finish of the first wave. The ratios mentioned above are then used to project where the next trend may travel to. In the image above the tool measures the distance between the purple circles in the downtrend and projects that higher for the alternating uptrend.
Unlike extensions, expansions project the next wave based on the previous adjacent wave making them simpler to apply. Extensions, on the other hand, require a mother trend to measure and the applicable ratios are then applied to estimate the next trend length after a retracement.
Traders often adjust positions as the price reaches expansion levels by taking partial profits or moving stop-losses. Although expansion levels offer more conservative targets, they are ideal for managing risk and protecting gains.
Summary: While Fibonacci extensions are a 3-point tool that projects future price targets by factoring in both the impulsive move and the retracement, Fibonacci expansions are a 2-point tool that projects price targets based solely on the adjacent trend. Extensions are useful for identifying further price targets, while expansions are better for conservative trade management, helping traders manage risk and adjust their positions as the trend continues.
It is worth noting that many people will use the terms extension, expansion, and projection interchangeably. Though they have some similarities and overlap, we use the term expansion to relate to adjacent waves and extension to relate to parallel waves.
Fibonacci Extensions vs Fibonacci Retracements
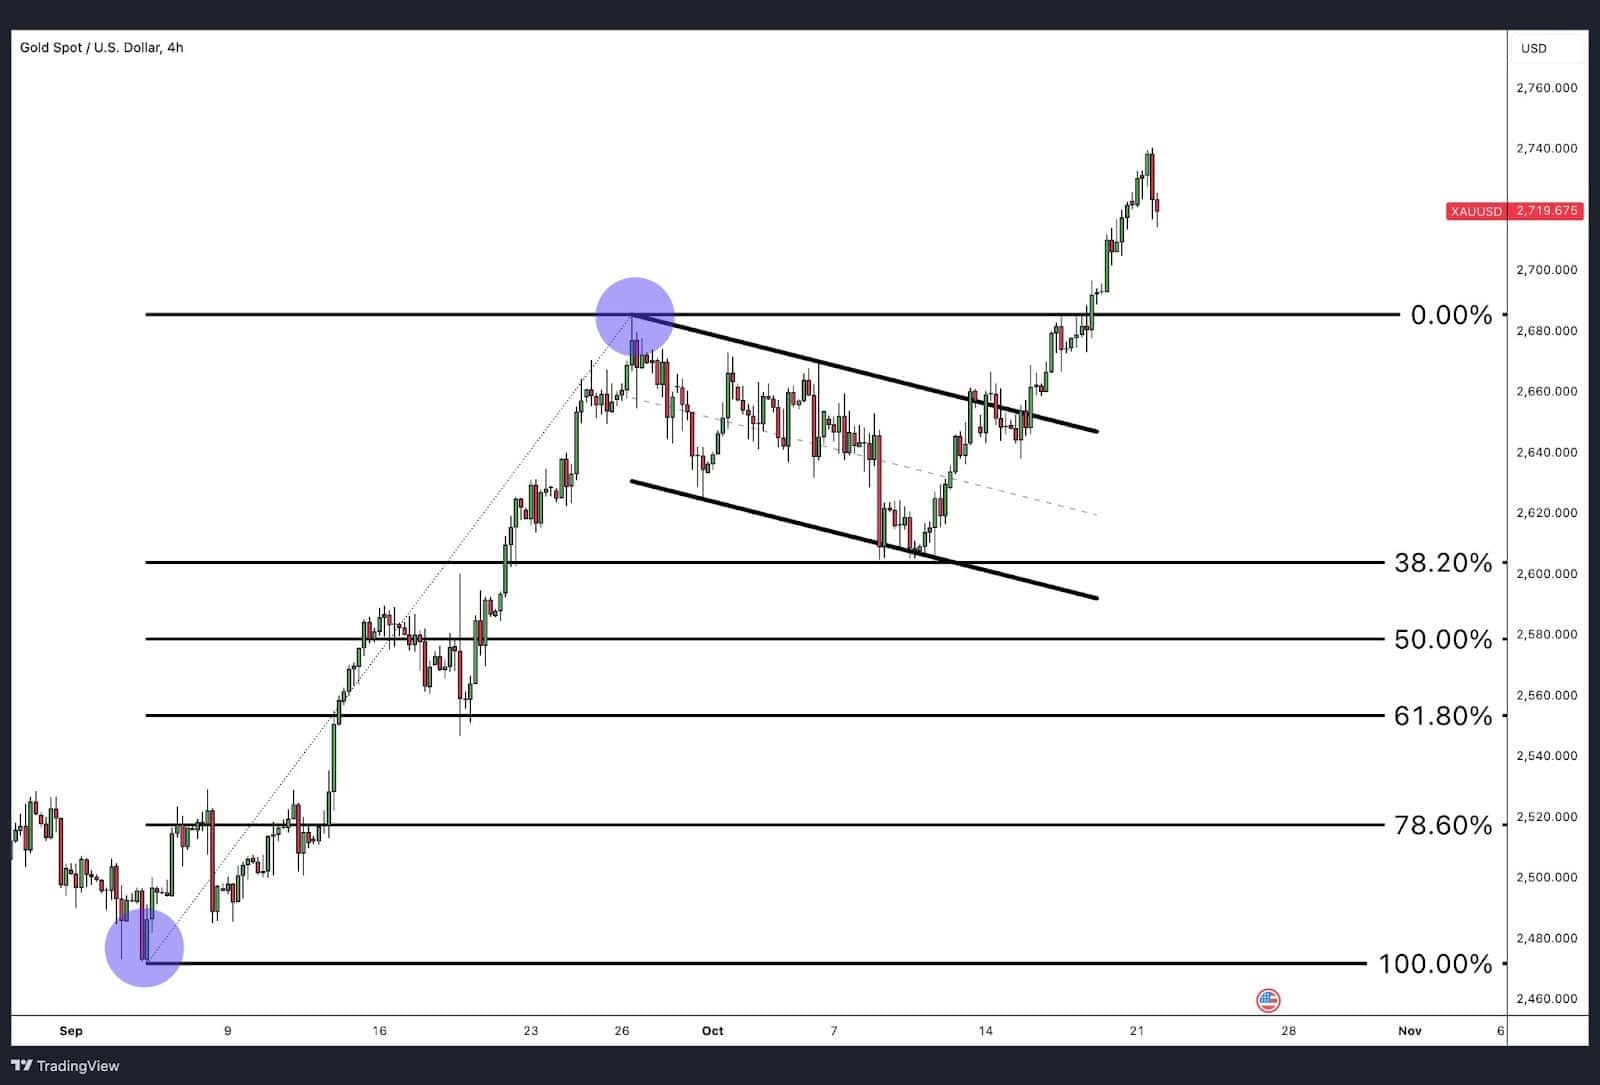
Both Fibonacci extensions and Fibonacci retracements are tools derived from the Fibonacci series, but they serve different purposes in trading.
Fibonacci Retracements:
- Purpose: Identify support or resistance during a price pullback in a trend.
- Common Levels: 38.2%, 50%, and 61.8%.
- Use Case: Traders use retracements to determine where a trend might pause or reverse before continuing in the original direction.
Summary: While retracements are used during a pullback to find potential entry points, extensions are used after the pullback to identify exit points or further targets in the near-term trend continuation.
Problems with Fibonacci Extensions
While Fibonacci extensions are a popular tool, there are some common pitfalls traders should avoid:
1. Incorrect Anchor Points:
Many traders misplace anchor points (swing highs and lows), which leads to inaccurate projections. If you start from the wrong levels, your Fibonacci extensions will not align with the actual price movement.
2. Challenges in Choosing the Right Extension Level:
Having multiple extension levels like 61.8%, 100%, 127.2%, and 161.8% can clutter your chart and make it difficult to identify which levels are significant. This overload of information can lead to analysis paralysis, where traders struggle to make decisions.
3. Extensions Can Be Ignored by the Market:
Price action does not always respect Fibonacci extensions. Particularly in volatile markets, the price may completely bypass these levels, making them less reliable during periods of high volatility.
FAQ
Is Fibonacci Extensions a Leading or Lagging Indicator?
Fibonacci extensions are considered a leading indicator. They project future price targets based on past price movements, helping traders anticipate where the market may encounter resistance or support after a trend continues.
What is the origin of Fibonacci Extension?
Fibonacci extensions are derived from the Fibonacci number sequence, which was popularised by the Italian mathematician Leonardo Fibonacci in the 13th century. The Fibonacci numbers and its ratios, such as 61.8% (the golden ratio), are applied to market movements to predict potential price targets beyond retracement levels.


