Written by:

- Chart of the Day
- October 14, 2026
- 3 min read
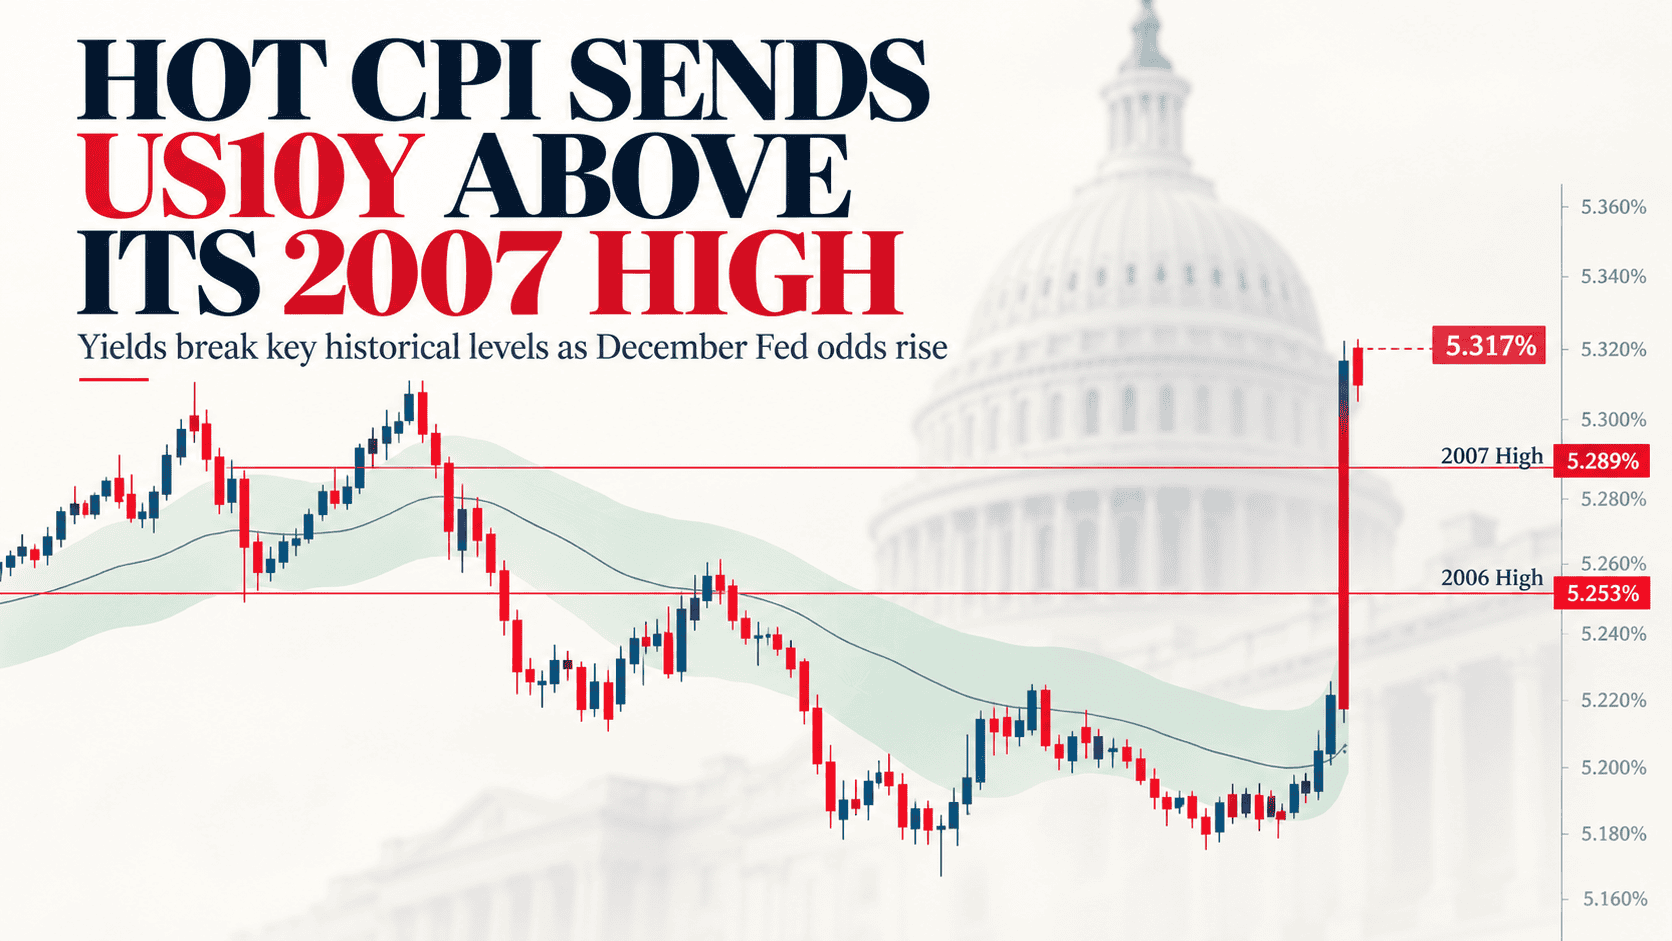
Hot CPI Sends US10Y Above Its 2007 High
The US 10-year yield has jumped to around 5.317%, clearing the old 2006 high at 5.253% and the 2007 high at 5.289%.
For me, 5.289% is the level to watch. Holding above it keeps the pressure on borrowing costs and growth stocks. Falling back below would raise questions about the breakout.
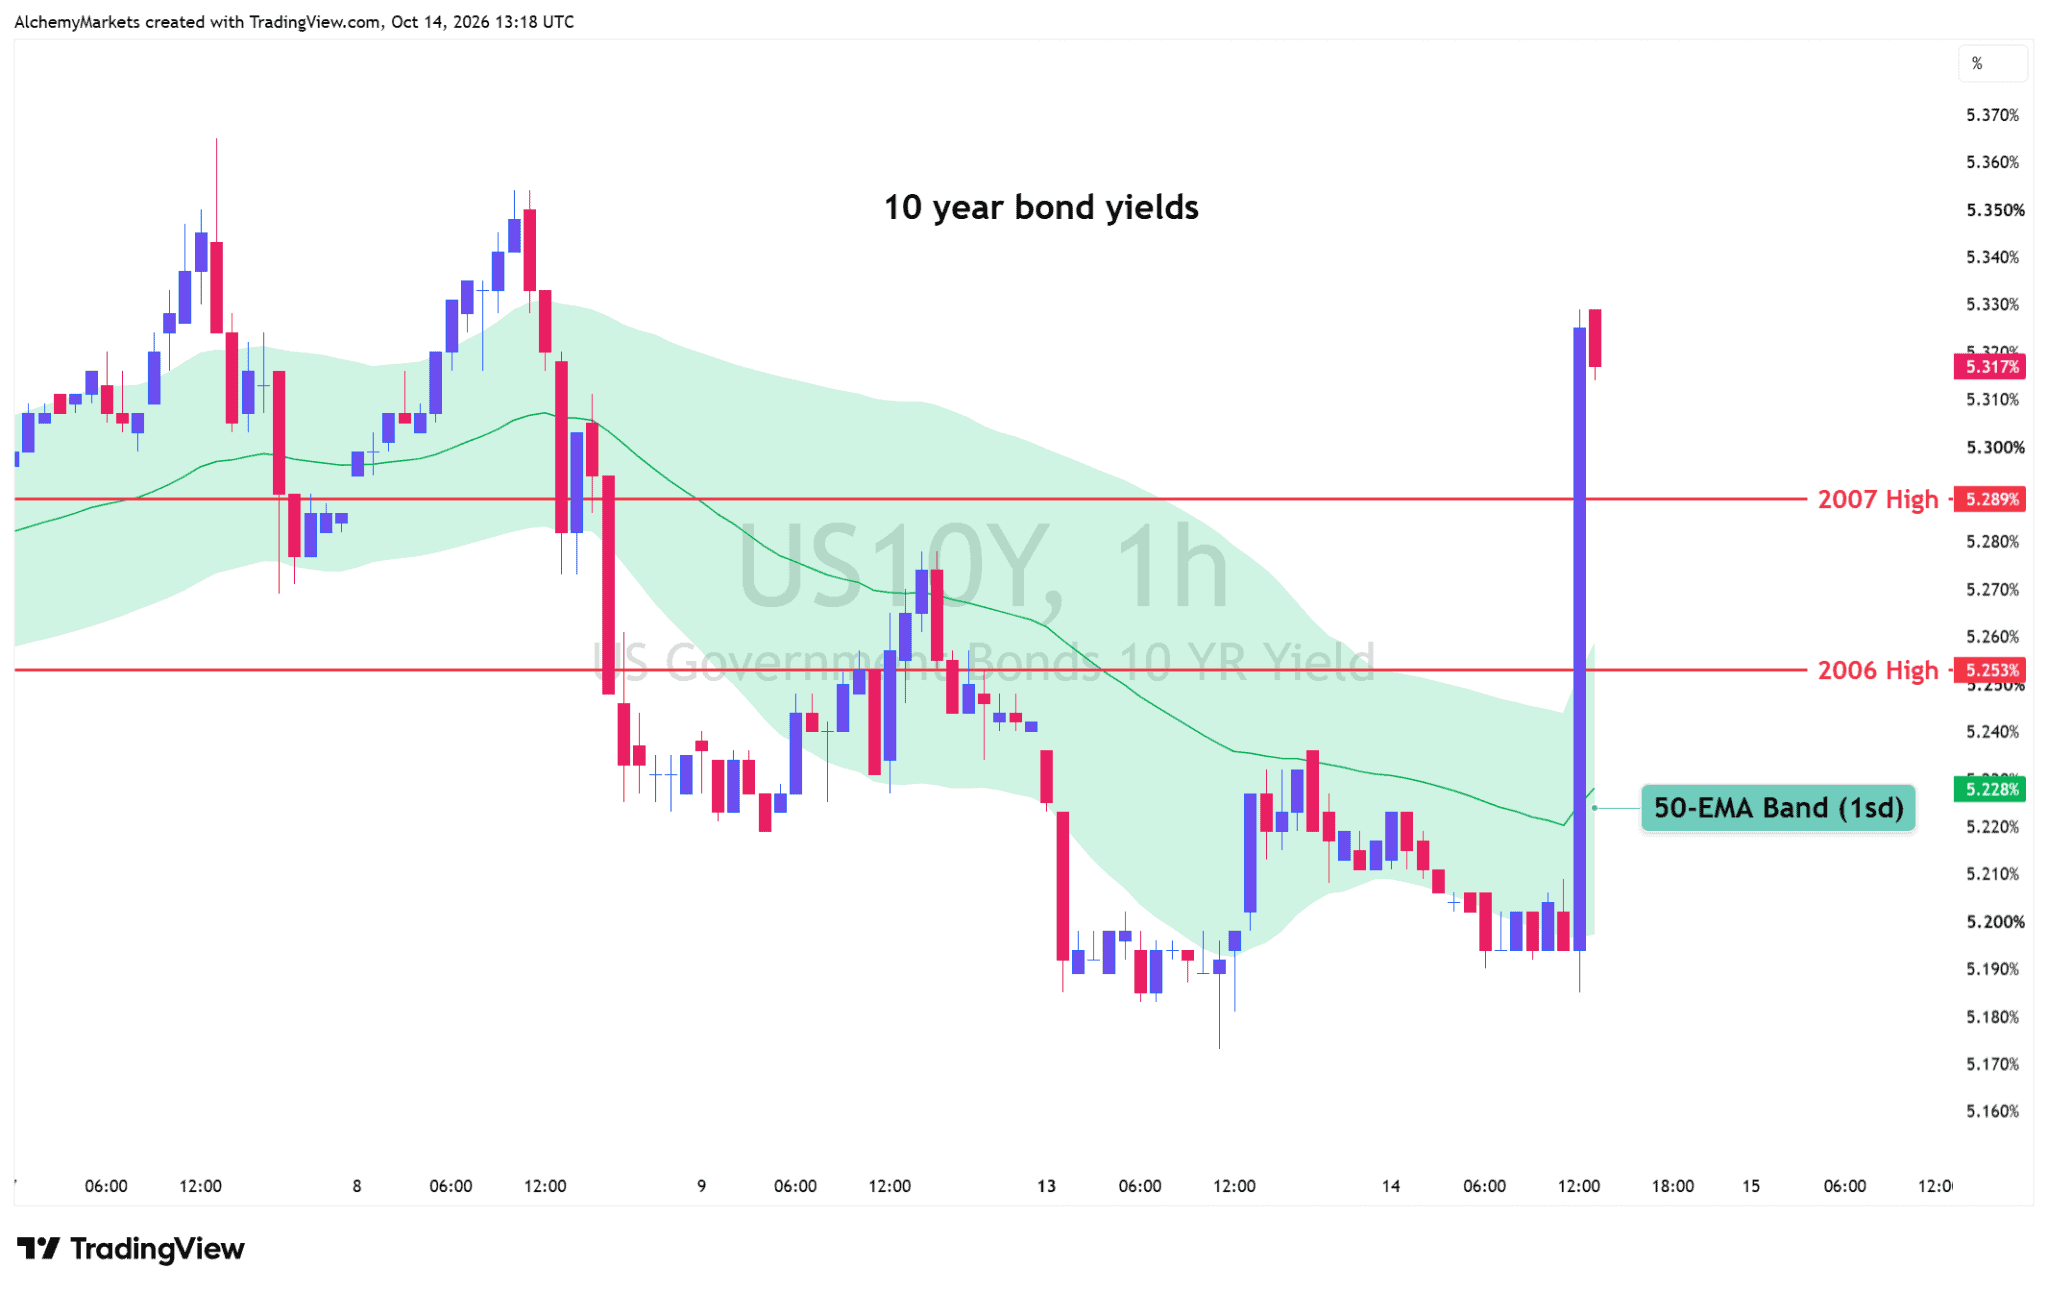
| Chart 1. US 10-year yield, 1H. The CPI spike has cleared both historical reference lines; the short-term 50 EMA band sits well below price. |
Core inflation is still too firm
September CPI rose 3.7% year-on-year, above the 3.6% forecast. Gasoline jumped 9.1%, accounting for more than half the monthly headline increase, while energy rose 5.2%.
But it wasn’t just oil. Core CPI rose 0.3% monthly, above the expected 0.2%, with shelter and services prices remaining firm. The three-month annualised core rate is now around 3.25%, suggesting underlying inflation is not cooling as quickly as markets had hoped.

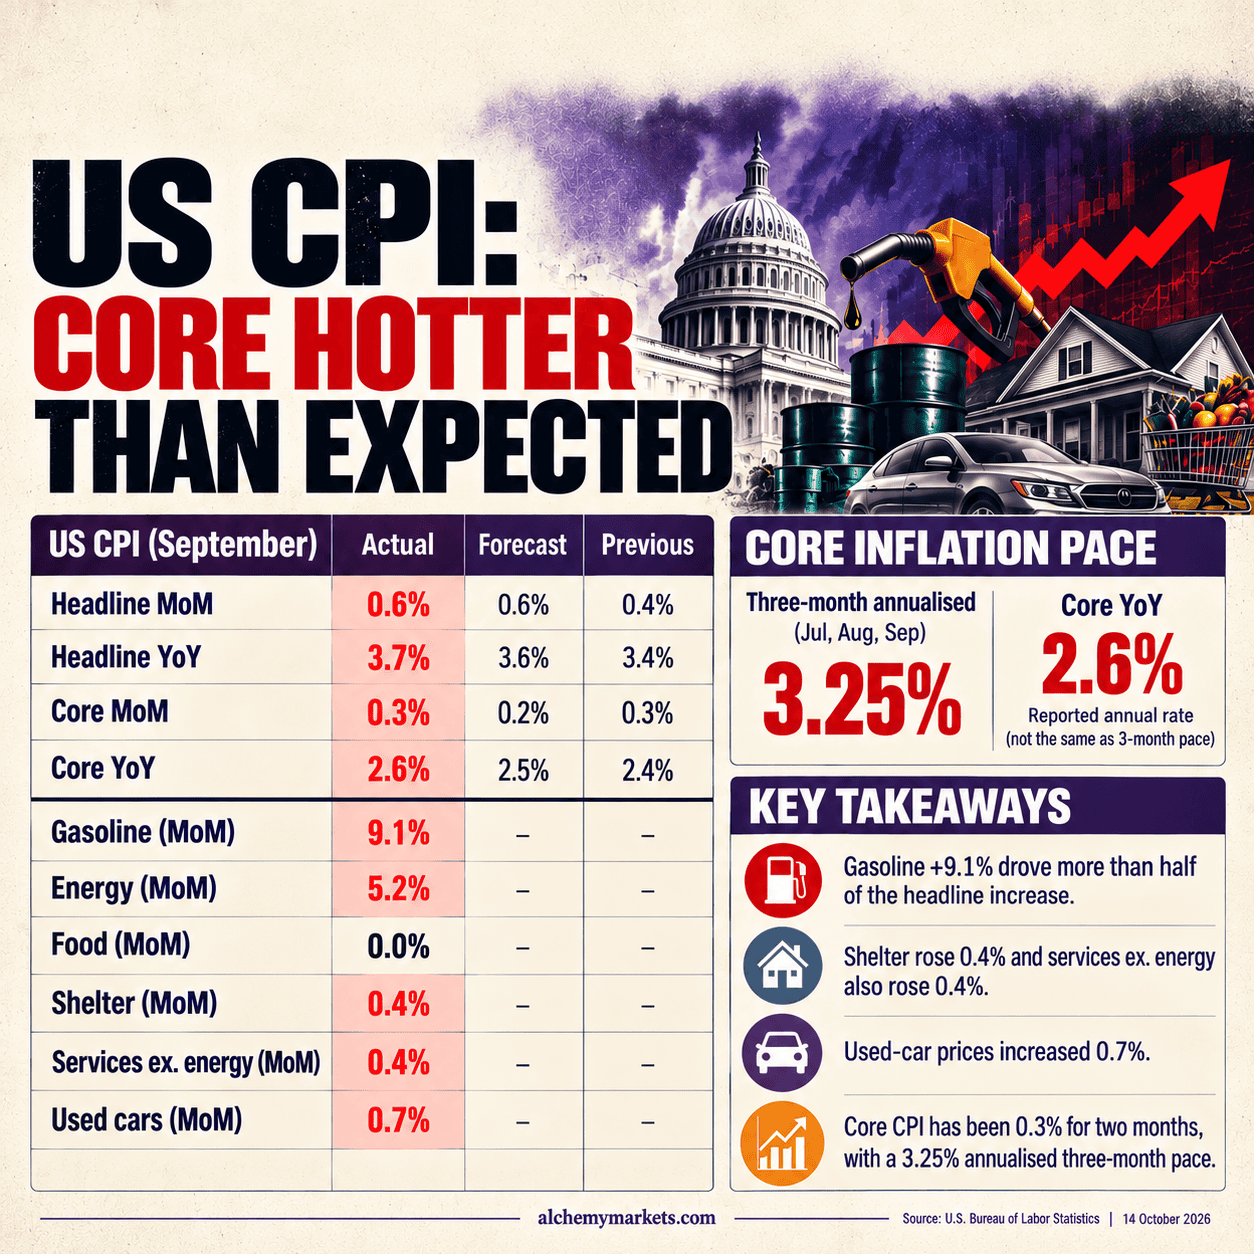
October is still more likely to be a hold, at 56.3%. December is heavily priced at 95% for a hike.
The immediate effect is that higher Treasury yields are already making financing more expensive, a headwind for Gold & equities.
Dollar uptrend meets resistance
DXY is approaching 102–103 while its 4H 20 EMA band remains intact. A break and hold above 103 would bring 105–106 into view. If price is rejected, I would watch the 4H band first, then 100.82–101.92 support.
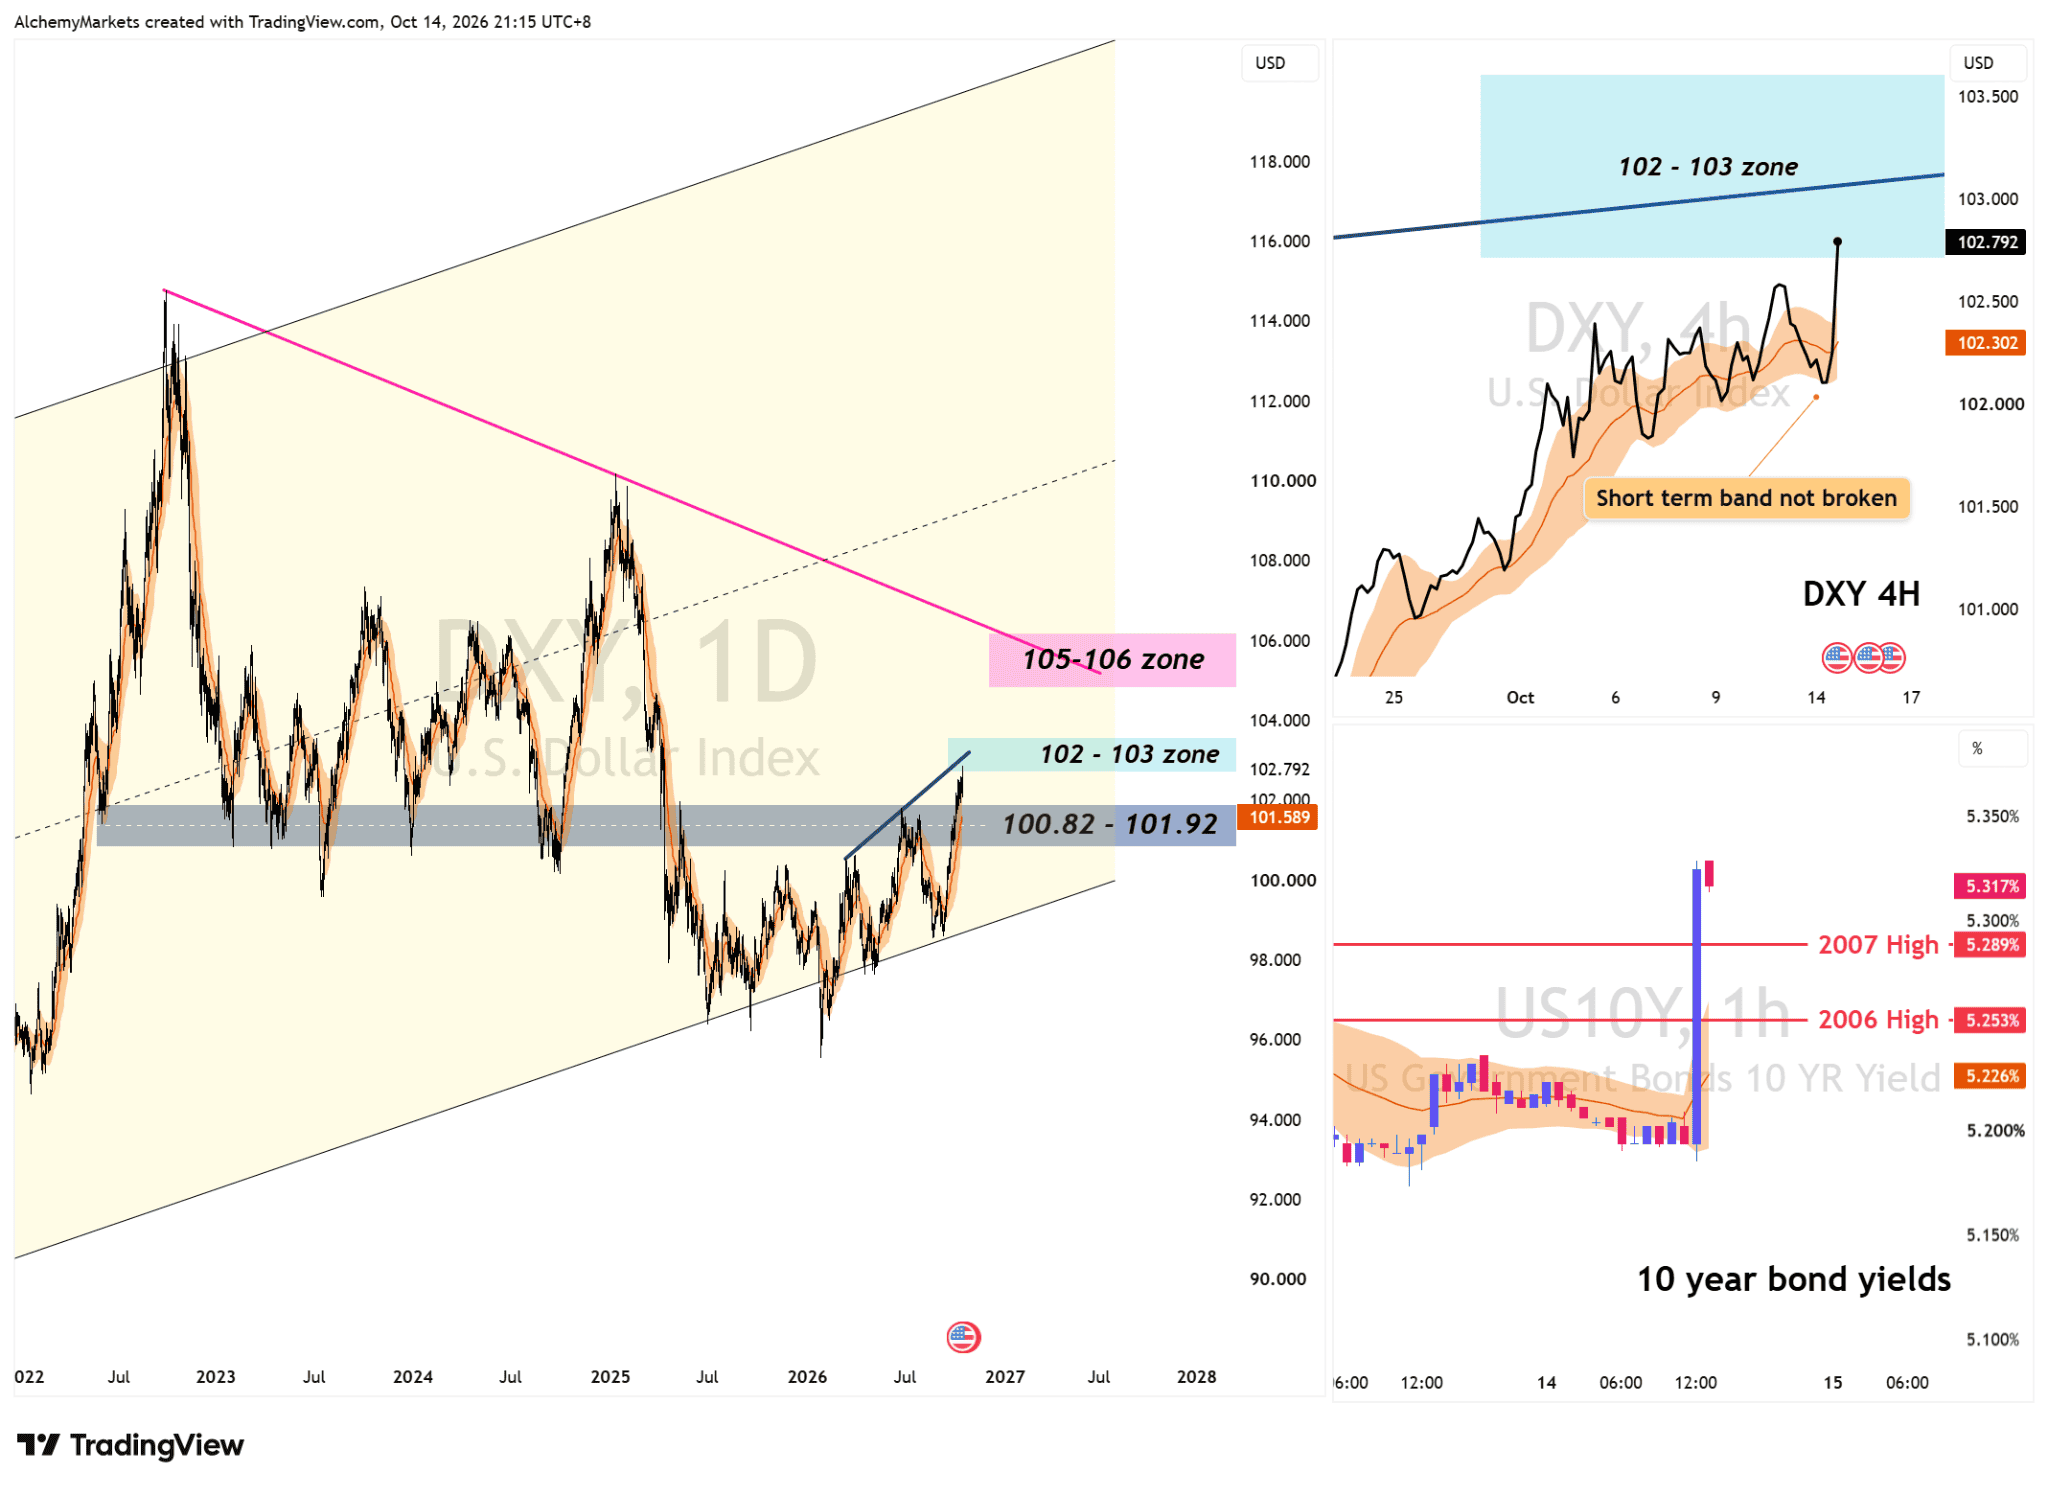
| Chart 2. DXY daily and 4H alongside the US 10-year yield. The short-term DXY EMA band remains intact, but 102–103 is resistance, not yet a confirmed break. |
AI stocks have another test tomorrow
The S&P 500 is holding near the top of a rising-wedge structure, and the rollover is not confirmed.
First support is 7,698–7,742; losing that zone and the rising wedge would strengthen the bearish case. The daily EMA rollover conditions also remain unmet.
TSMC reports tomorrow after quarterly revenue of about NT$1.49 trillion, roughly 51% higher year-on-year. Strong margins and guidance could help technology shares absorb higher yields. Disappointing guidance would make that harder.
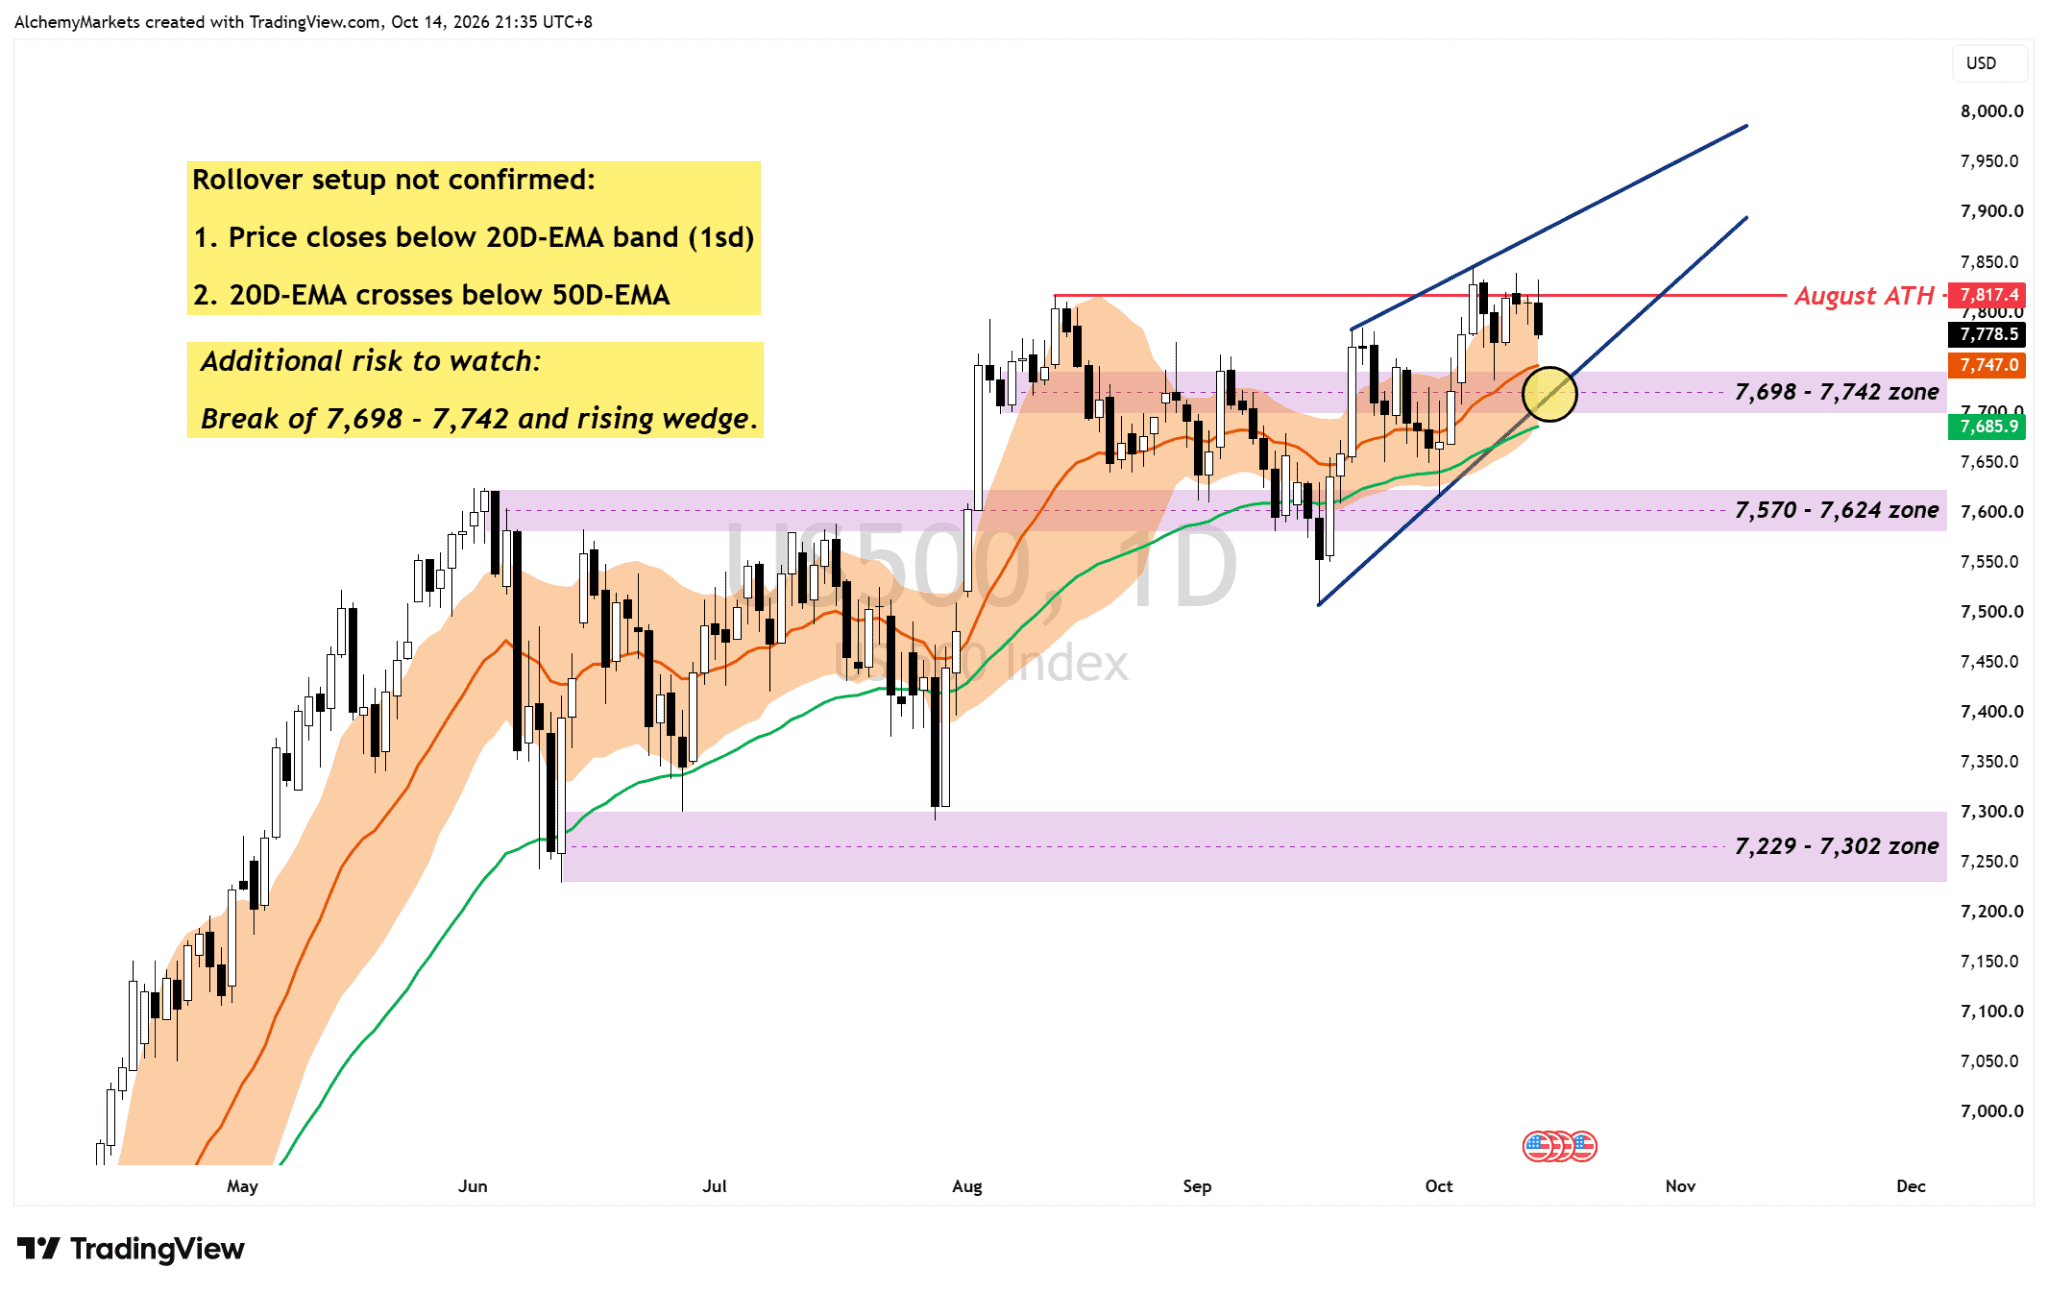
| Chart 3. S&P 500 daily. The 7,698–7,742 support area and rising wedge are key; the specified EMA rollover conditions have not been met. |
Bottom line
For now, the US10Y breakout above 5.289% is the clearest signal. I would not assume DXY has broken resistance or the S&P 500 has rolled over until price confirms it. TSMC is the next test.
I would respect DXY’s uptrend while its 4H band holds, but wait for 102–103 to break before looking towards 105–106. For equities, 7,698–7,742 is the first real test.
TSMC tomorrow will tell us whether earnings strength can offset the pressure from bonds.