Written by:


- Chart of the Day
- August 25, 2026
- 4 min read
Bitcoin Just Rallied 26% in a Week. Is the Bottom In?
BTC just moved 26% in under a week, reminding us why so many people and their nans were crazy about crypto just 2-4 years ago.
The digital currency spent most of June, July, and August looking half-dead, then in a Team Rocket-esque fashion, decided to blast off into outer space.
But has this move been too fast?
Much like most of you, I’ve been staring at the screen wondering if I missed the boat.
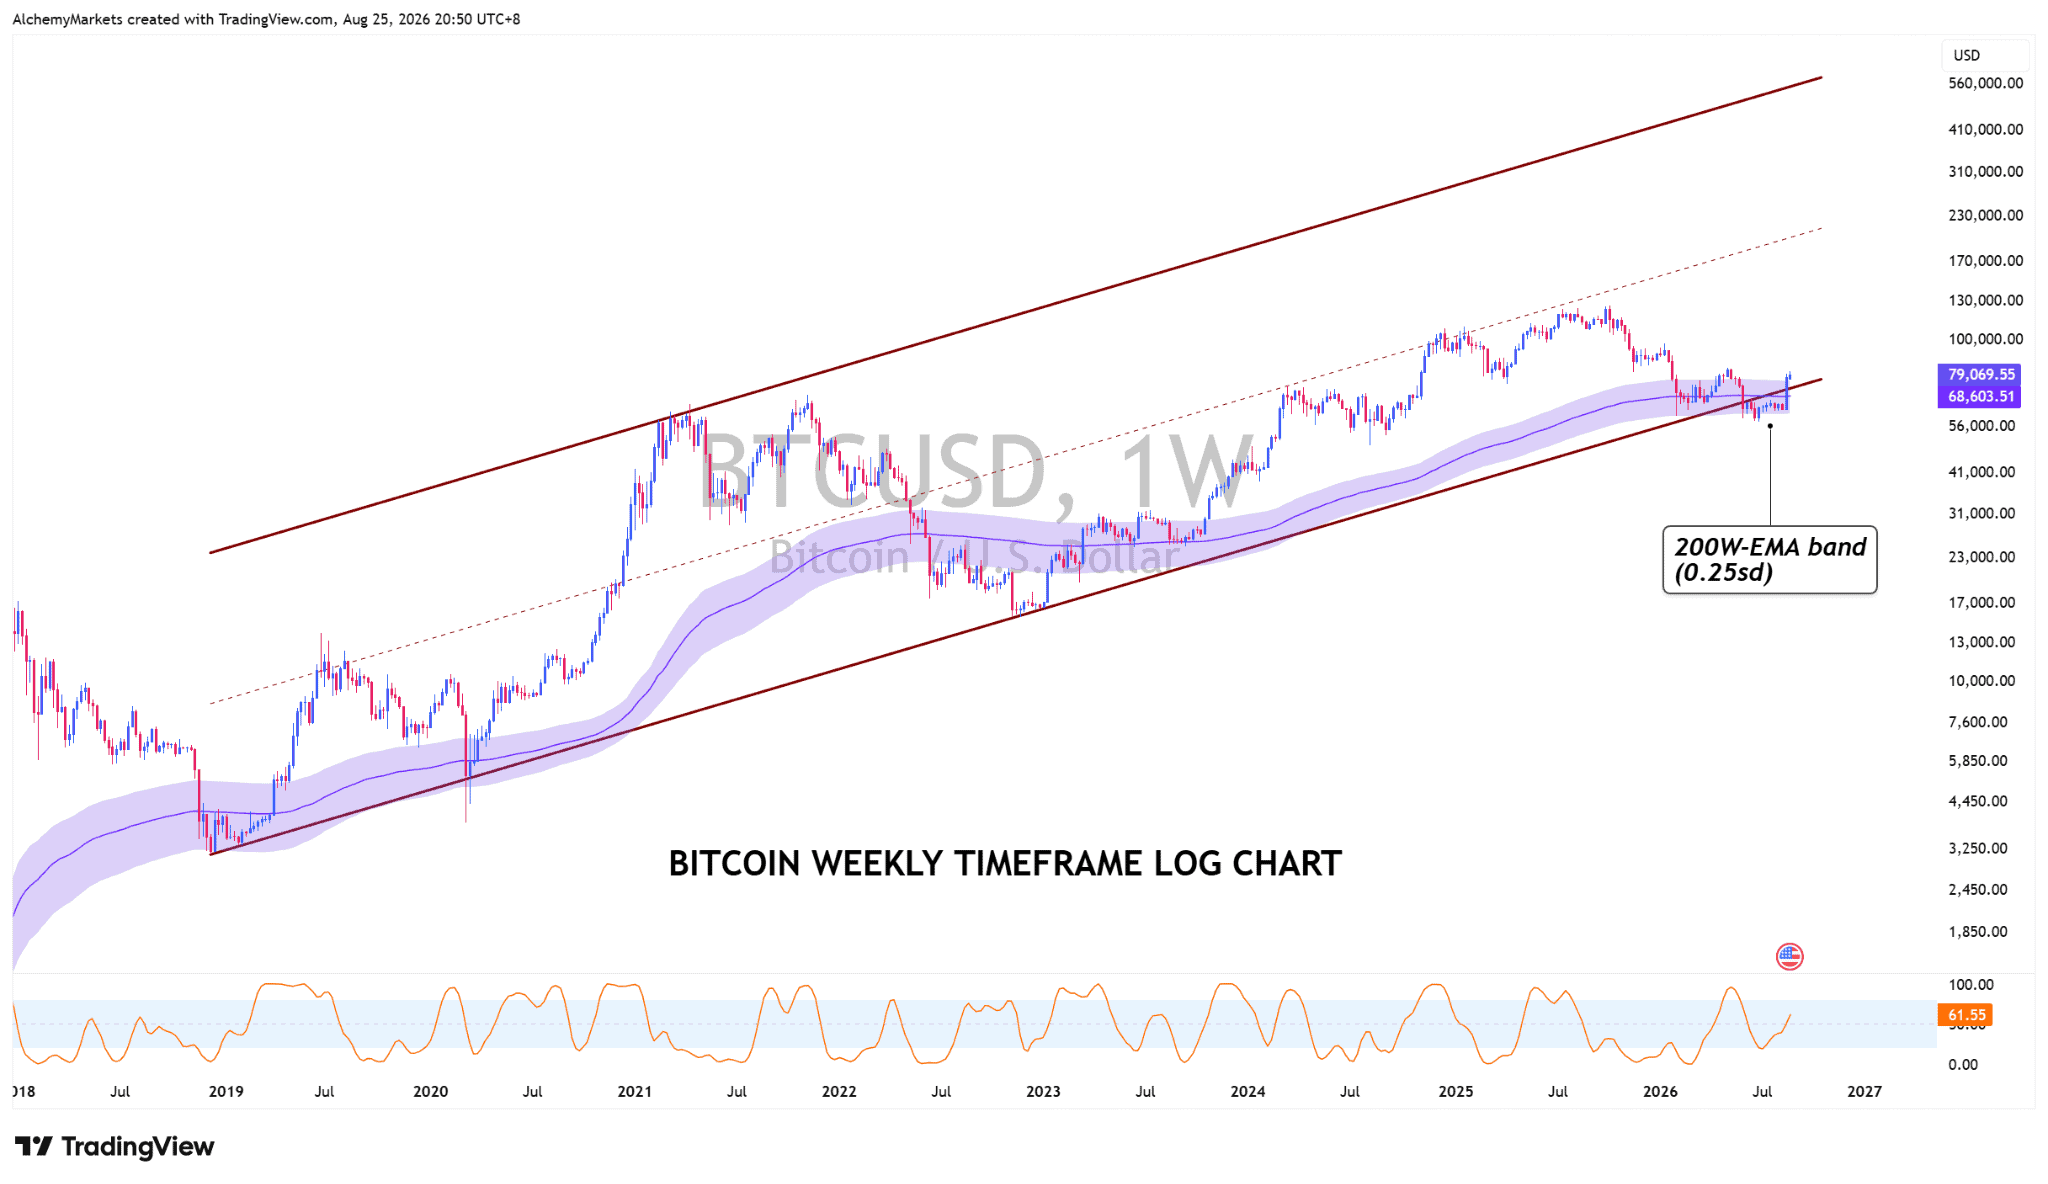
But take a look at this chart above – the Bitcoin weekly timeframe log chart. Notice how we did fall beyond a rising channel, but now, the asset has pushed back into the channel.
So hey, maybe not. Another supportive factor is the 200 EMA bollingers band (set to 0.25 standard deviation) capturing the lows of Bitcoin in 2019, 2020, and currently in 2026. So perhaps, the low is in.
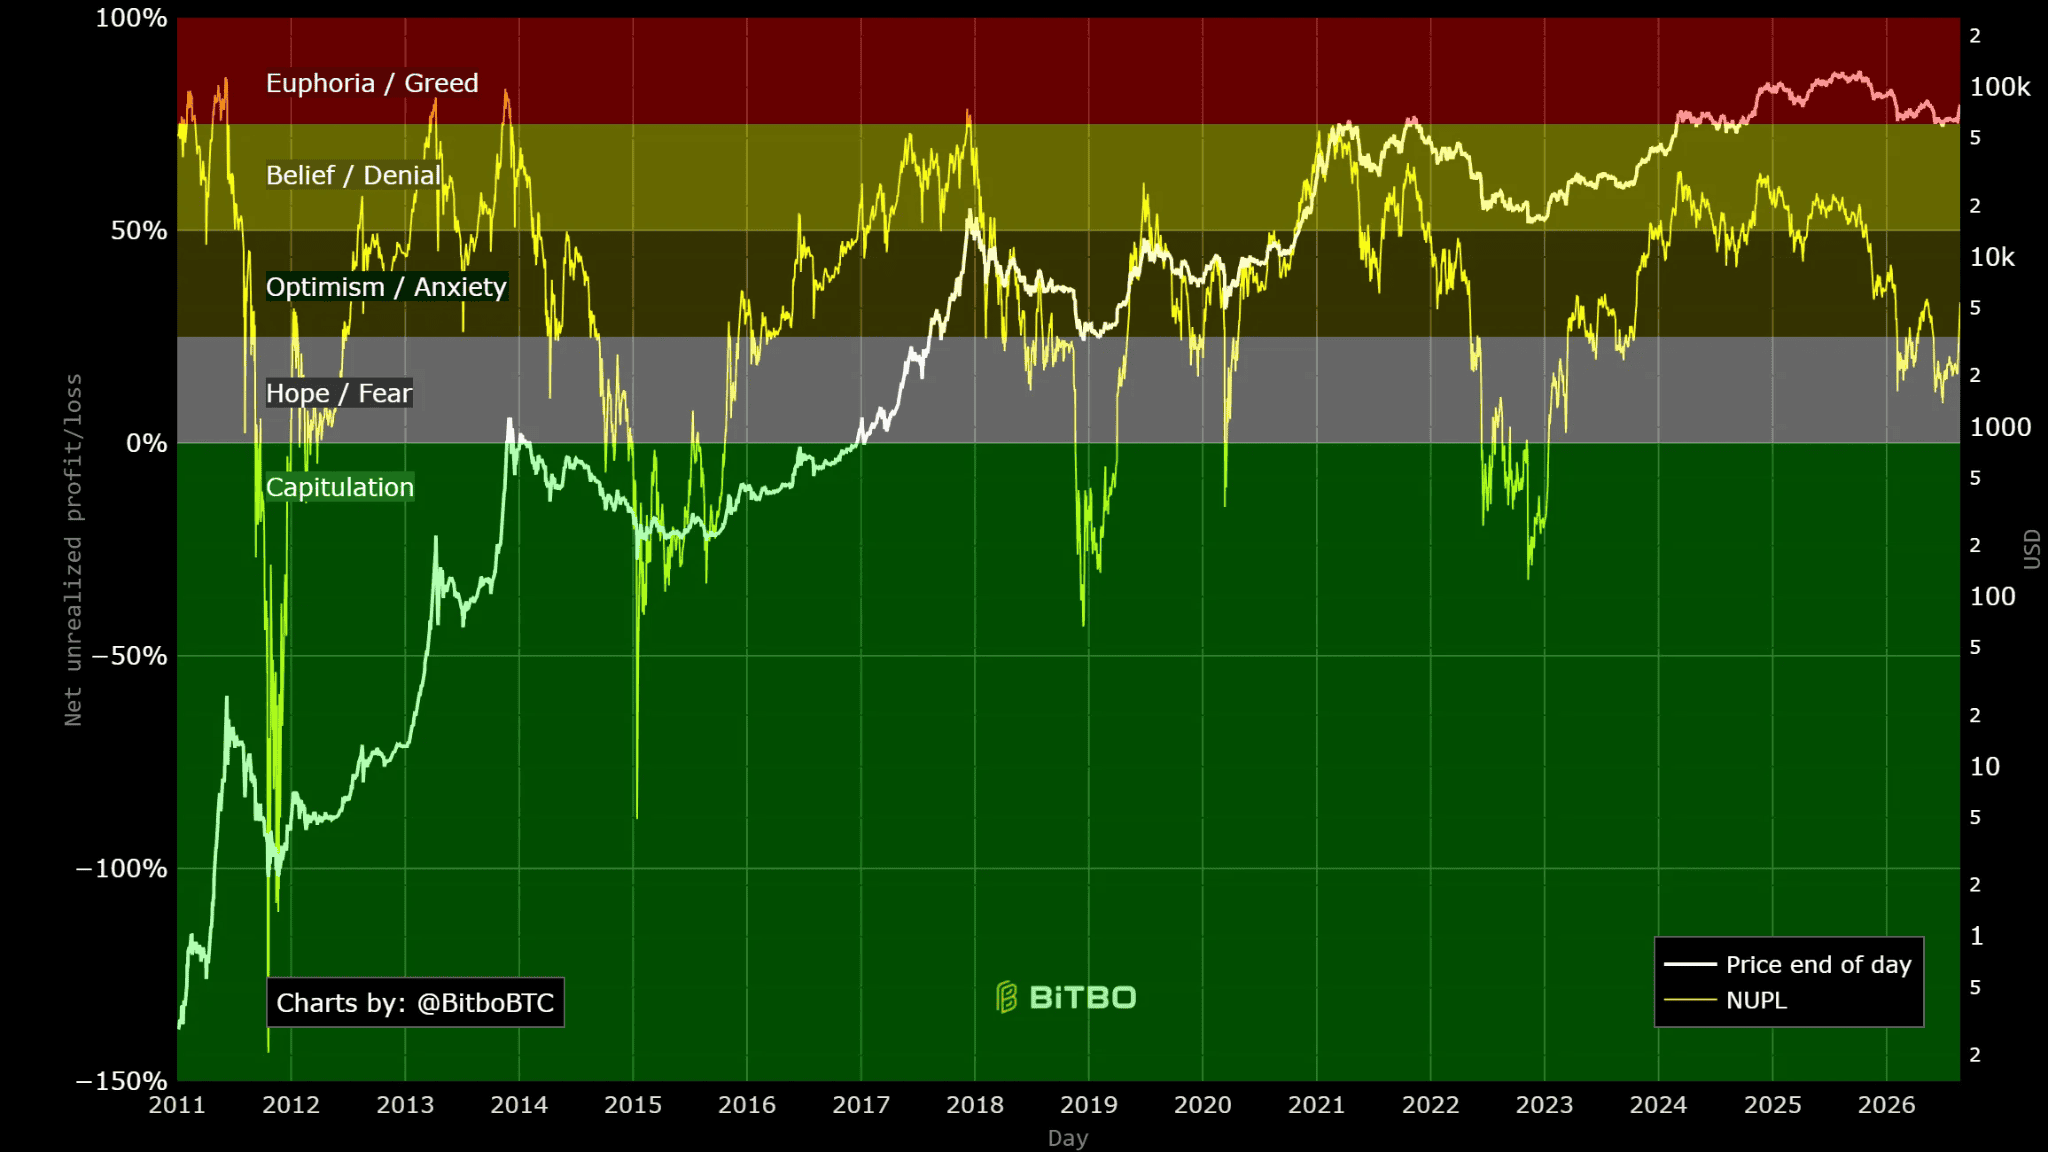
I just previously failed to see it as I was focused on the NUPL Chart, which dictates that Bitcoin lows are only in when the green zone has been tapped into – meaning that Net unrealised profit/loss has turned negative.
Oh well, better late than never I guess.
Let’s explore the scenario here in which the temporary low is in (but not the major low that leads to another All-Time-High).
Bitcoin: What’s Next for the King of Cryptocurrency?
Bitcoin is back above $80,000 for the first time since May, and there are actually some decent fundamental reasons behind the move. Trump has been pushing Congress for clearer crypto regulation, the SEC is moving towards a more defined framework, and US spot Bitcoin ETF flows have finally turned positive again after months of weak demand.
But I think the bigger story is what happened in the bond market.
US long-term yields had been pushing towards multi-decade highs before Treasury Secretary Scott Bessent announced larger buybacks of longer-dated Treasurys. The dollar weakened, gold rallied, and Bitcoin effectively became the higher-beta version of the same “debasement trade”.
Markets read the move as a sign that policymakers may have a lower tolerance for disorderly long-end yields, and that was enough to put pressure on the dollar and revive demand for scarce assets.
The rally also started from a market that had become pretty boring.
Volatility was low, Bitcoin had been stuck in a range, and positioning was leaning the wrong way when the breakout happened. That helped trigger a short squeeze, but importantly, the move did not stop there.
QCP reported roughly $1.92 billion of net inflows into US spot Bitcoin ETFs over the week, which tells us that real spot demand started following the initial squeeze.
So fundamentally, I do think something has changed.
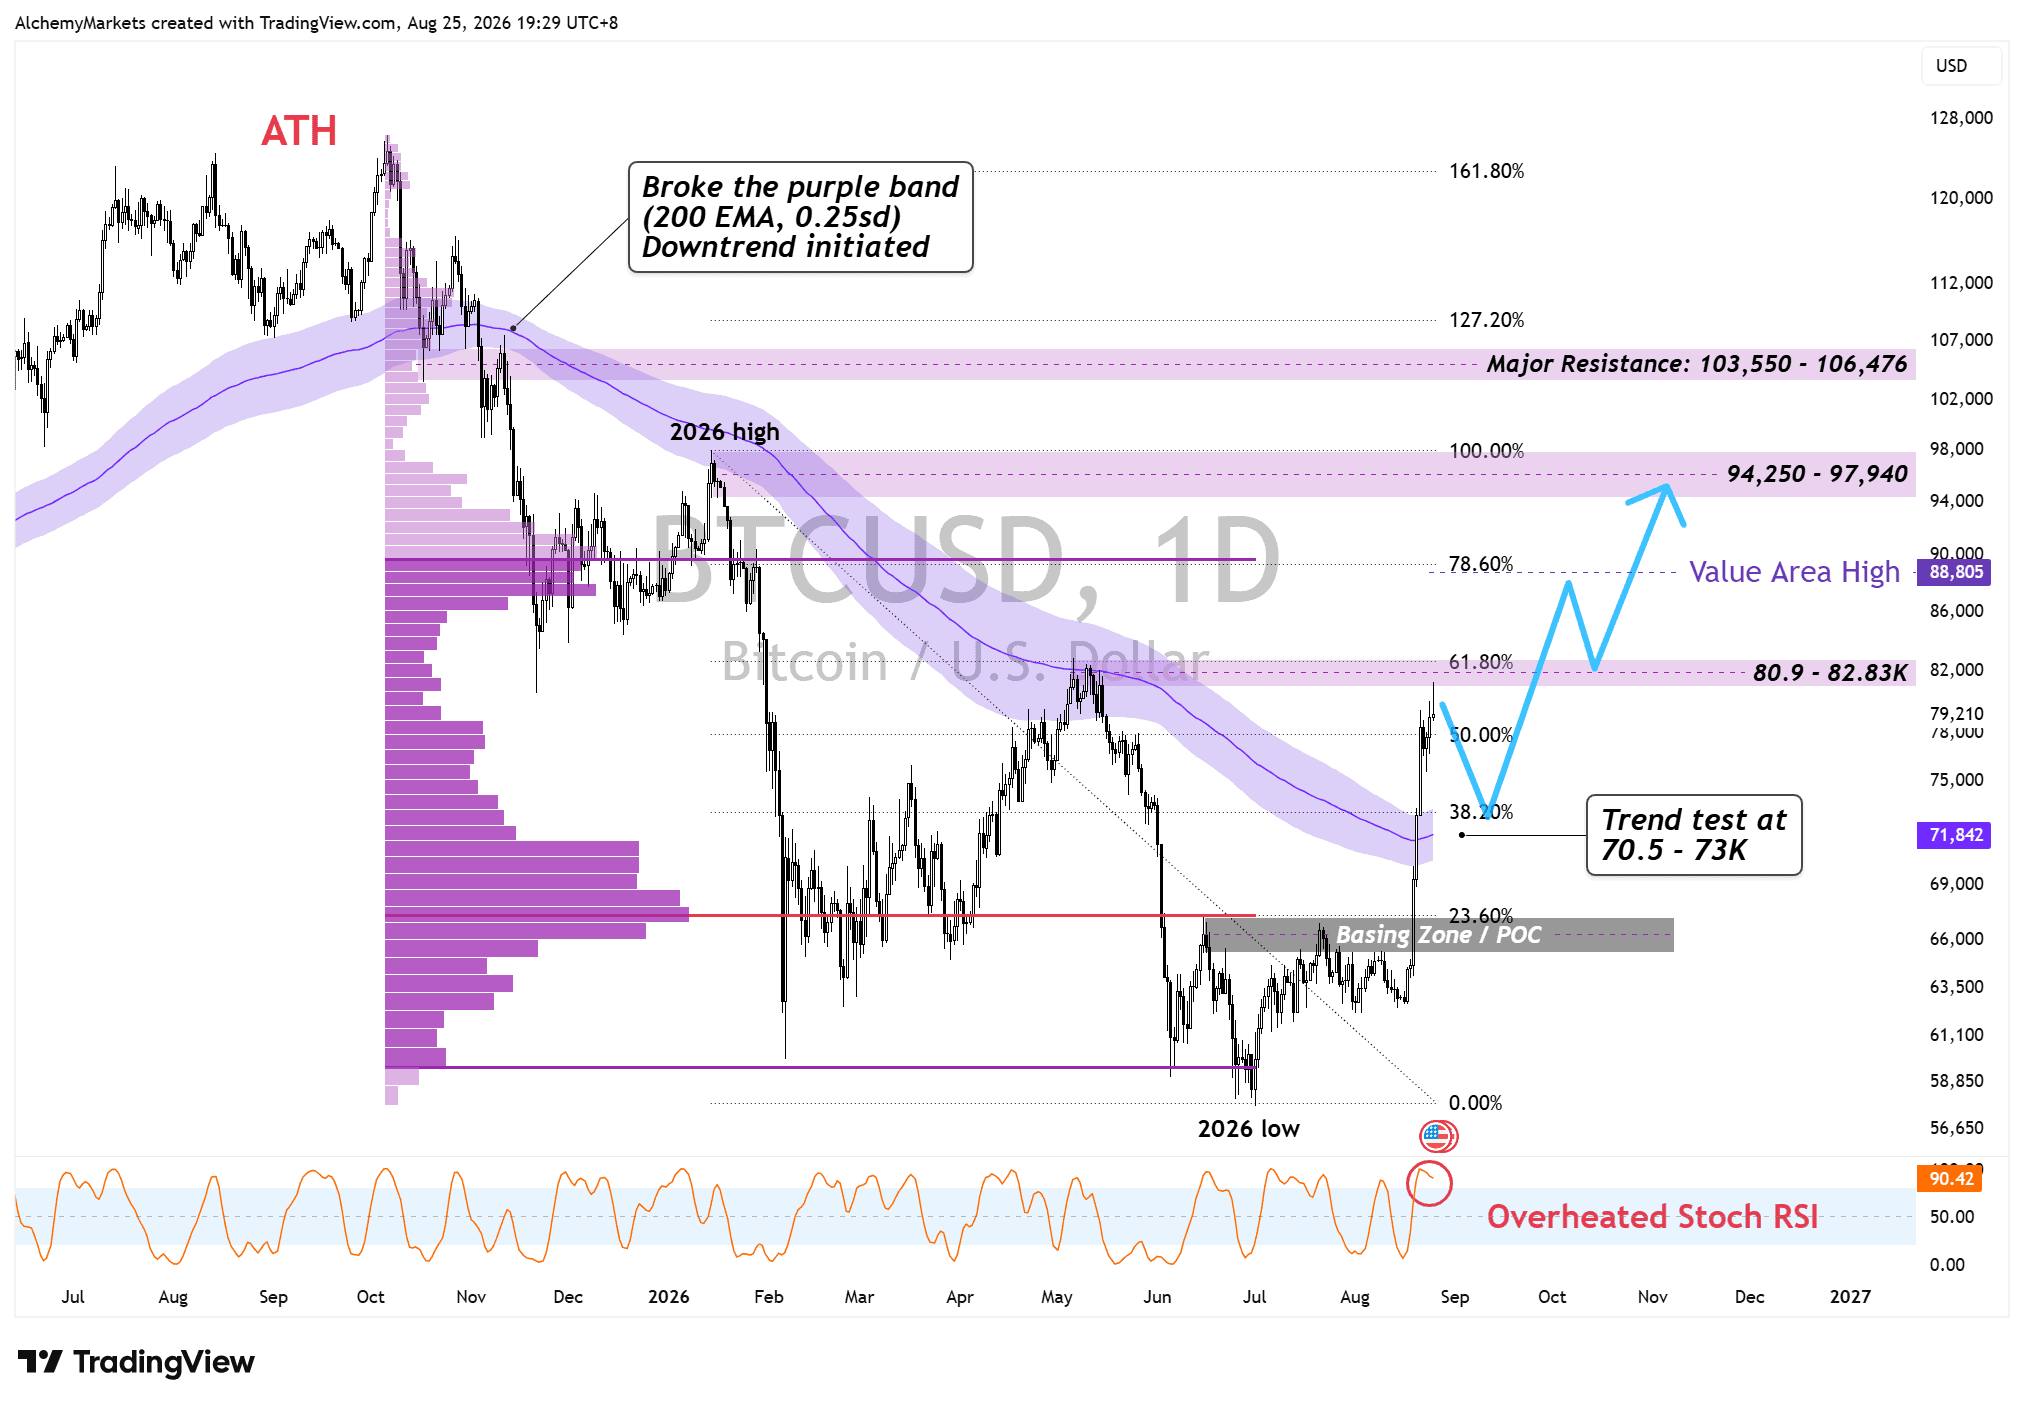
Technically though, Bitcoin has moved very, very quickly.
BTCUSD has now pushed into the $80.9K-$82.83K area, which is the previous high’s order block and also lines up with the 61.8% retracement of the 2026 high-to-low decline.
After a 26% move in seven days, I would not be surprised at all if Bitcoin gets rejected somewhere inside this zone.
The next major volume-based resistance on my Fixed Range Volume Profile sits around $88.8K, so if Bitcoin can actually find acceptance above $82.83K, that is the next area I would be watching.
What I find more interesting is the daily 200-EMA band.
That band had acted as a suppressant on Bitcoin for months, and price has now finally broken through it.
That is an observable change in behaviour.
If this breakout is genuine, I would actually prefer to see Bitcoin cool off and retest roughly $70.5K-$73K as support rather than continue going vertical from here.
A deeper pullback towards $66K is also possible because that area lines up with the top of the previous base and the Point of Control of the decline.
But if Bitcoin falls that far and starts accepting below the 200-EMA band again, I would become much more cautious on the longer-term bullish setup because we would be looking at a potential failed breakout and lower high at the same time.
Verdict: What’s Next?
My view here is pretty simple.
The fundamentals are finally giving Bitcoin a reason to rally, ETF flows are improving and the chart has changed character. I just do not love chasing an asset after it has already moved 26% in a week directly into resistance.
A controlled retracement into the broken trend band would make the bullish case more interesting, not less.
The real question now is whether buyers show up on the retest.