


Written by:

Reviewed by:

- October 27, 2025
- 21 min read
20 Support and Resistance Indicators in Trading
What Are Support and Resistance Indicators?
Support and resistance indicators are essential tools in technical analysis that help traders identify critical price levels on a chart. These indicators highlight zones where an asset’s price is likely to experience a pause, reversal, or a breakout. By understanding and using these indicators, traders can make more informed decisions, enhancing their ability to time entries and exits in the market effectively.
Support and resistance indicators are particularly valuable because they reveal market sentiment and the balance between buyers and sellers. When prices approach these key levels, they often act as psychological barriers. Traders watch these zones closely, expecting potential price reactions, which can lead to increased market volatility and trading opportunities.
Common support and resistance indicators include moving averages, Fibonacci retracements, pivot points, and trendlines. These tools are versatile and can be adapted to different trading styles, including day trading, swing trading, and long-term investing. Ultimately, mastering support and resistance indicators can provide traders with a strategic edge, allowing them to navigate the markets with confidence.
What Are Support and Resistance?
Support and resistance are fundamental concepts in trading that represent specific price levels where market forces tend to change direction.
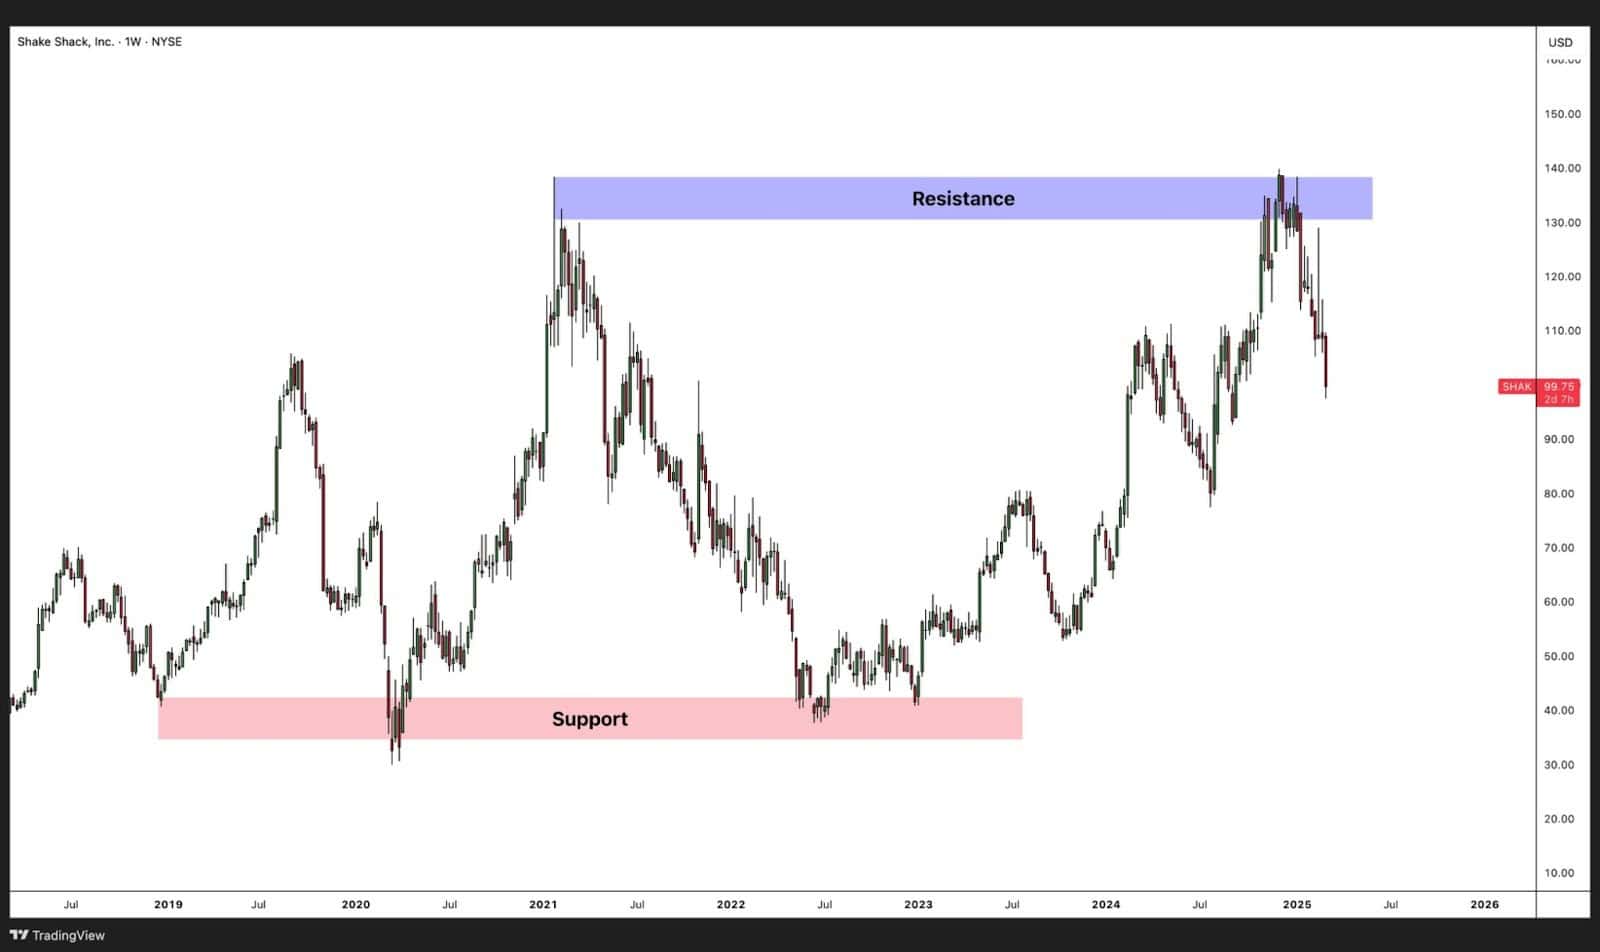
- Support is a price level where a falling asset tends to find buying interest, preventing the price from dropping further. It acts like a floor that supports the price, often because traders view the asset as undervalued at that level, leading to increased buying activity.
- Resistance is the opposite; it is a price level where an asset facing upward momentum starts to encounter selling pressure. This level acts like a ceiling, capping the price as traders begin to sell off their positions, either to lock in profits or because they believe the asset is overvalued.
These levels are not always exact prices but are often represented as zones or ranges. The interaction between support and resistance is dynamic: when a support level is broken, it can become a new resistance level and vice versa. Understanding how these levels work helps traders anticipate potential market moves, set stop-losses, and determine strategic entry and exit points.
Strength of Support and Resistance
The strength of support and resistance levels is a crucial aspect of technical analysis, as it determines how likely these levels are to hold against price movements. Strong support and resistance zones can significantly impact a trader’s decision-making, influencing entry and exit points. Several factors contribute to the strength of these levels:
- Historical Significance – The longer a support or resistance level has been in play and the more times the price has reacted to it, the stronger it becomes. Traders tend to trust these levels, making them self-reinforcing.
- Volume at Key Levels – High trading volume around a support or resistance level suggests stronger interest from traders. If a large number of market participants place orders at a certain price, that level is more likely to hold.
- Timeframe Considerations – Support and resistance levels identified on higher timeframes, such as daily or weekly charts, tend to be stronger and more reliable than those on lower timeframes like 5-minute or 15-minute charts.
- Market Psychology – Traders’ collective behaviour around certain price levels can also reinforce them. If traders repeatedly buy at support or sell at resistance, those levels gain credibility.
Number of Touches in Support and Resistance
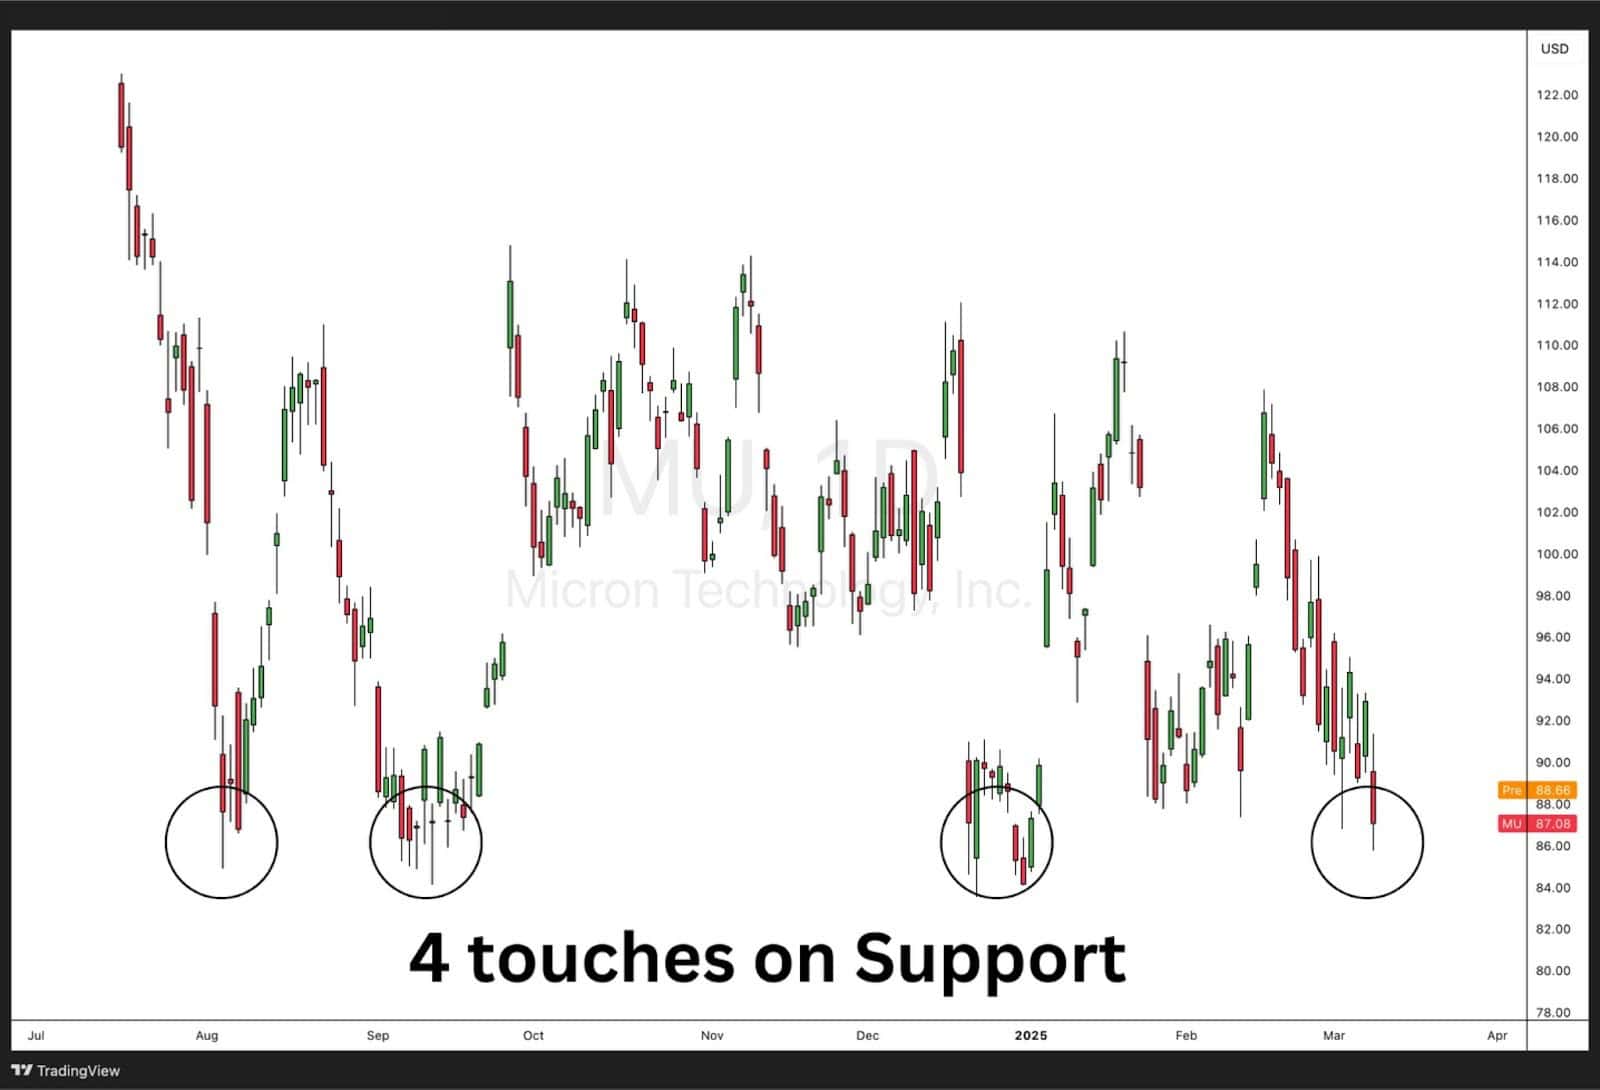
One of the simplest yet most effective ways to gauge the strength of a support or resistance level is by observing how many times the price has tested it.
- The More Touches, The Stronger the Level – If a price level has been tested multiple times without being broken, it suggests that traders consistently respect it. This increases the likelihood of a price reaction the next time it is reached.
- The Rule of Three – Many traders believe that a support or resistance level becomes especially strong after being tested three times. By the third test, if the level holds, it is considered a confirmed zone of interest.
- Breakouts and Retests – If a level is tested too frequently within a short period, it may weaken, as each test absorbs more buy or sell orders. Eventually, a breakout becomes more likely.
Volume at Certain Price Levels in Support and Resistance
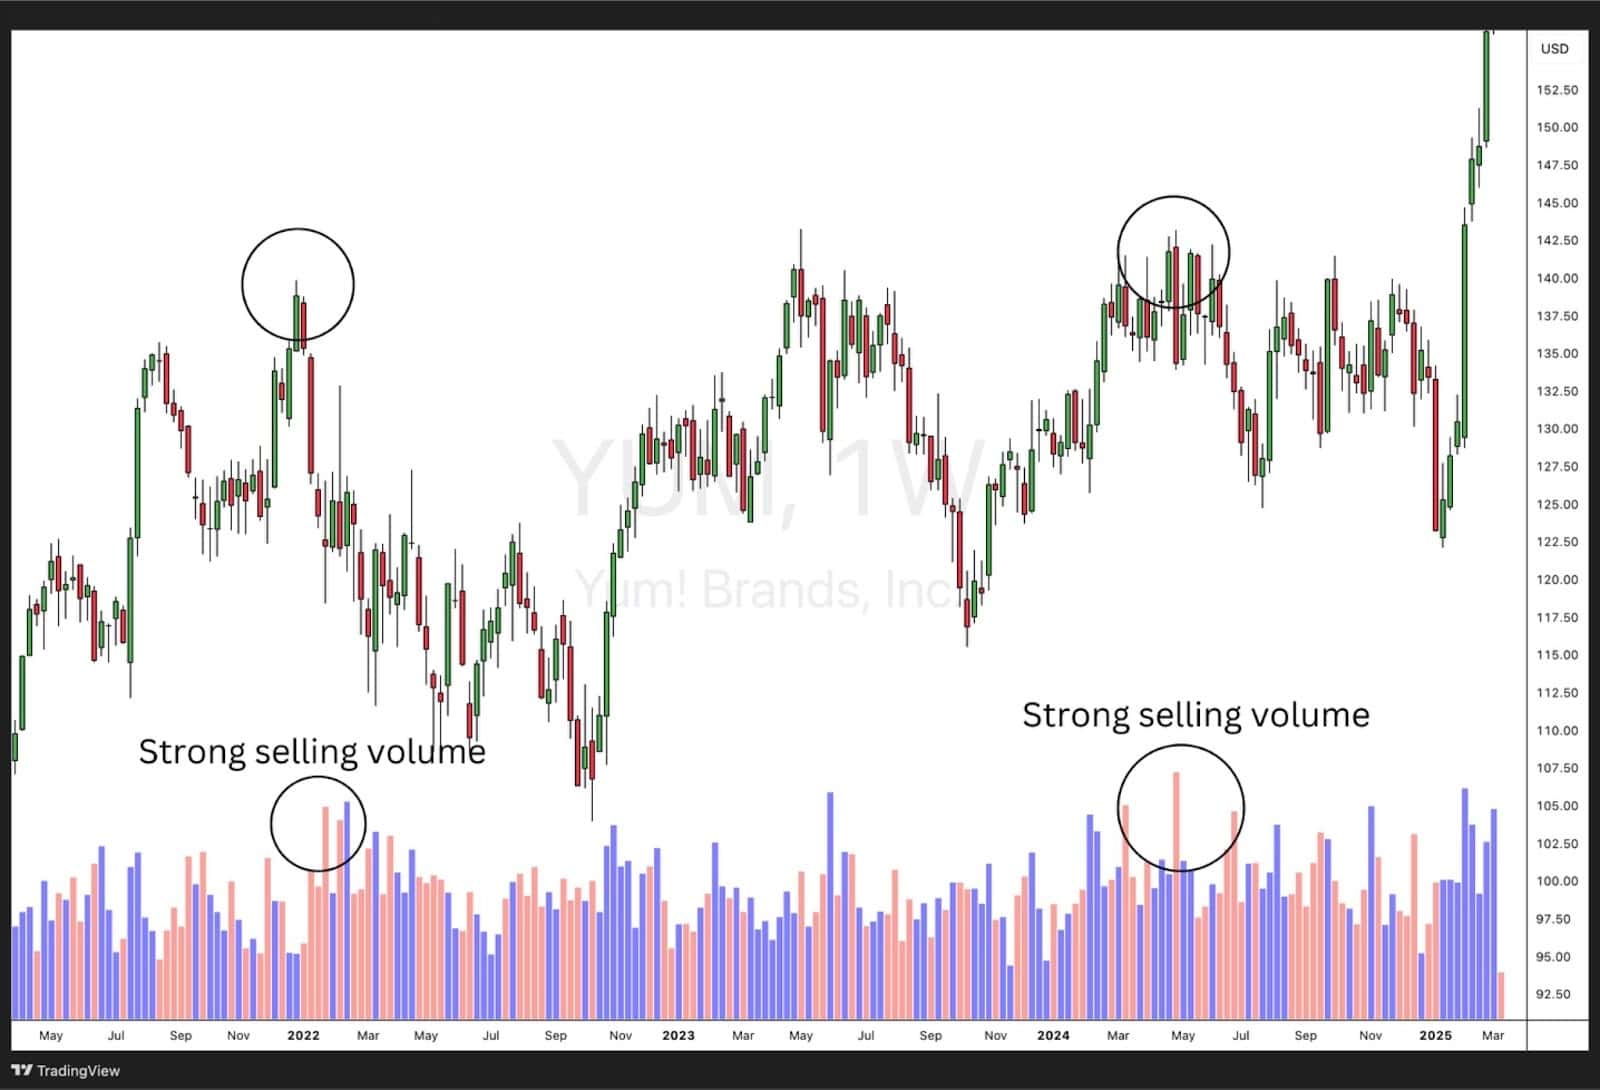
Volume is a key component in evaluating the strength of support and resistance. High volume at a certain price level indicates strong market interest, making that level more significant.
- High Volume at Support – If a stock reaches a support level and sees a spike in buying volume, it suggests strong buying interest, increasing the likelihood that the level will hold.
- High Volume at Resistance – Conversely, if a stock reaches resistance and selling volume increases, it indicates that many traders see that price as overvalued, making a reversal more likely.
- Volume Profile Indicator – Some traders use tools like the Volume Profile, which shows how much volume has been traded at specific price levels, helping to identify key support and resistance zones.
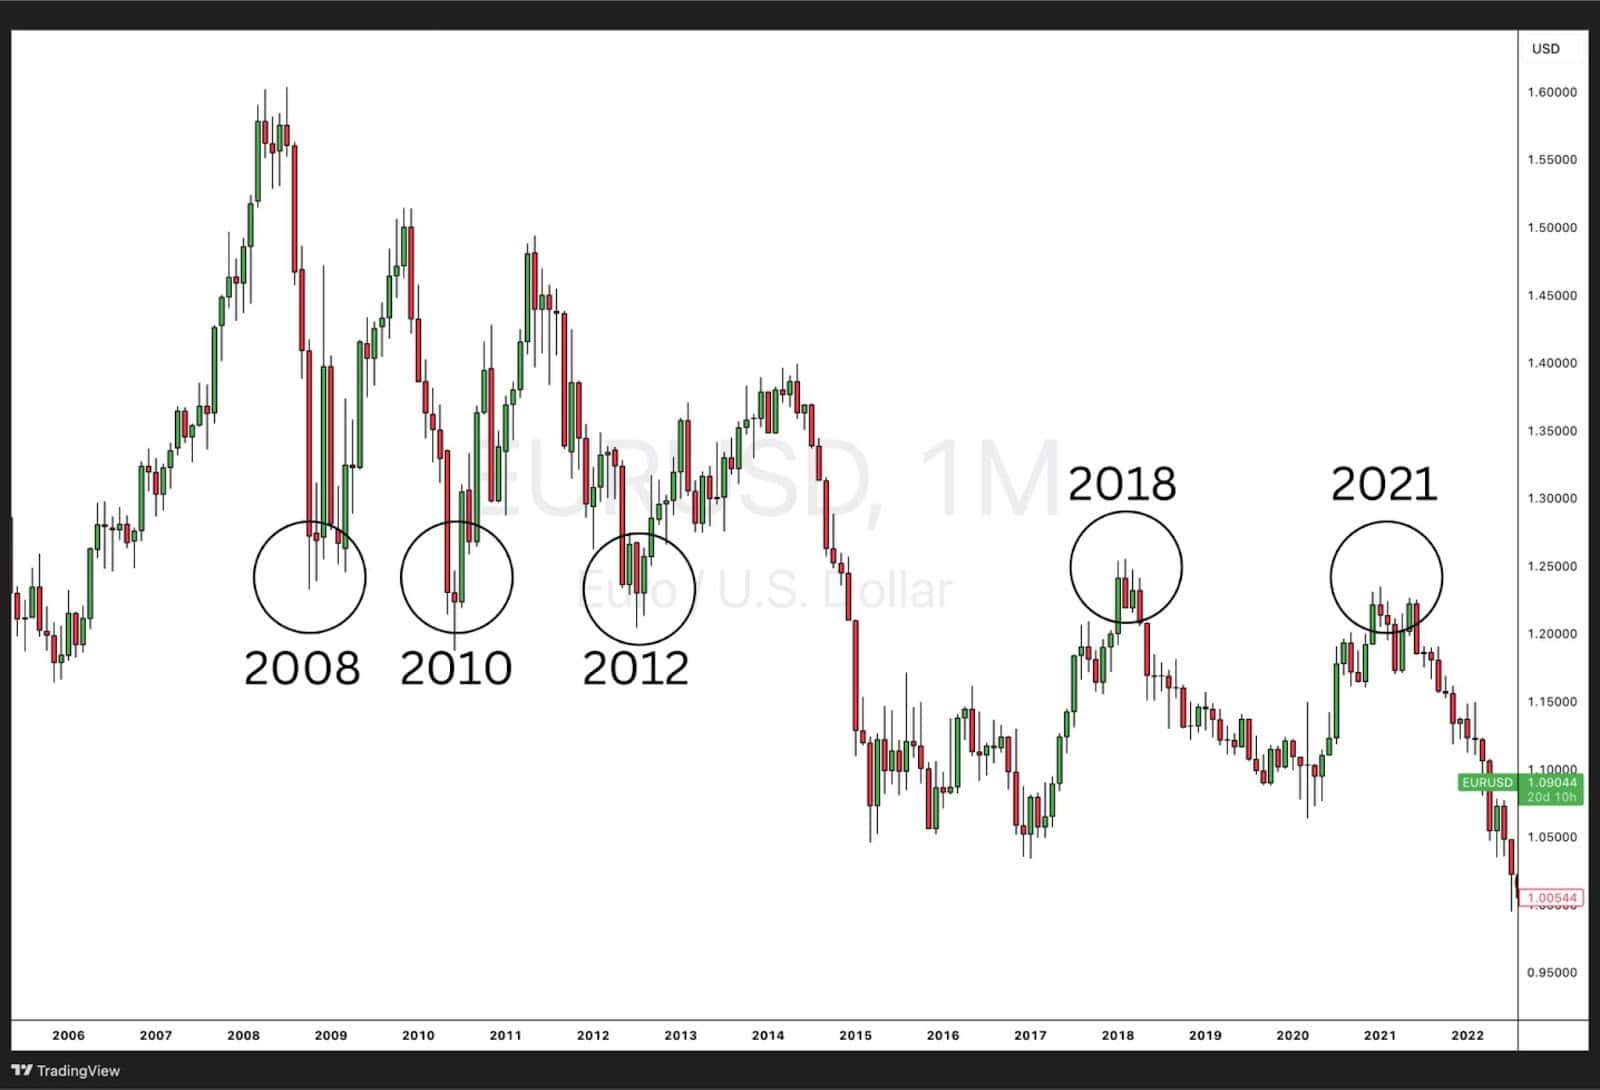
Round Numbers in Support and Resistance
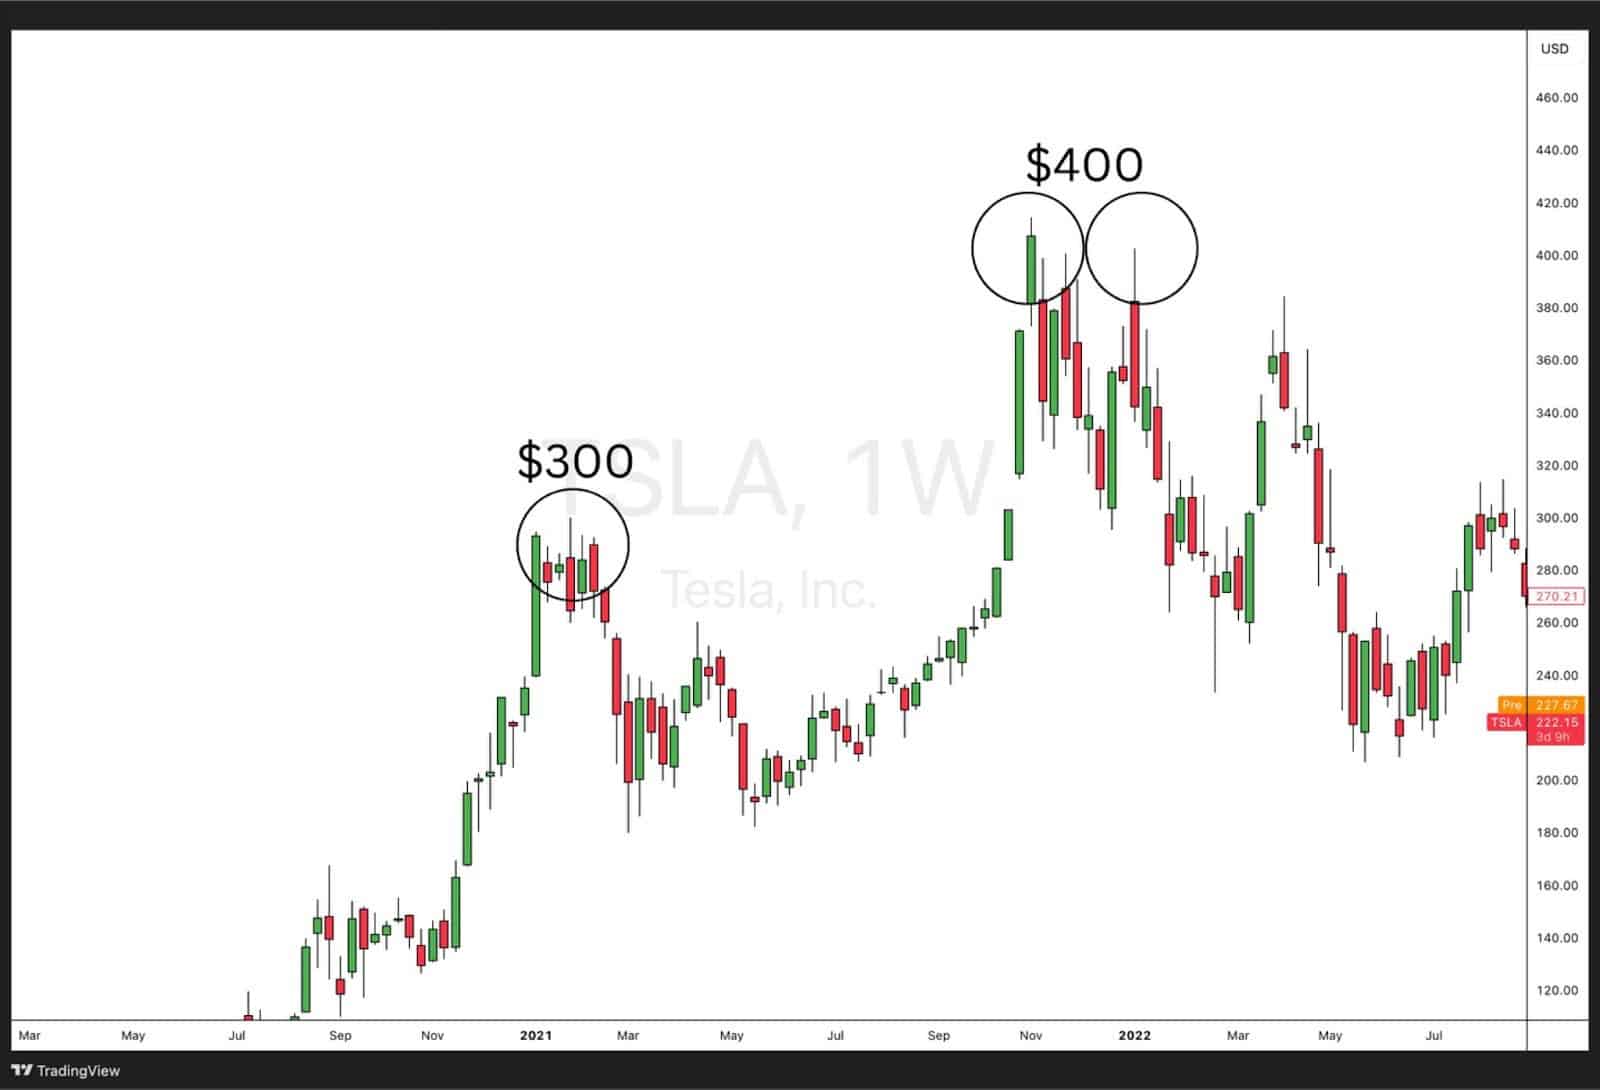
Round numbers often act as psychological support and resistance levels, as traders naturally gravitate towards them when placing orders.
- Psychological Bias – Traders tend to place stop losses, limit orders, and take-profit targets at round numbers like $100, $500, or $1,000 in stocks, or 1.1000, 1.2000 in Forex pairs.
- Institutional Trading – Large institutions often structure trades around round numbers, leading to higher liquidity and price reactions at these levels.
- Self-Fulfilling Prophecy – Because so many traders expect price reactions at round numbers, these levels often hold, making them reliable for short-term trades.
Traders often use round numbers in conjunction with other indicators to confirm their trade setups.
Timeframes of Support and Resistance
The significance of support and resistance levels can vary depending on the timeframe a trader is using:
- Higher Timeframes (Daily, Weekly, Monthly) – Support and resistance levels on higher timeframes are more reliable, as they reflect long-term market sentiment. These levels are often used by institutional investors and long-term traders.
- Lower Timeframes (5-Minute, 15-Minute, Hourly) – Levels identified on shorter timeframes can still be useful but are more susceptible to market noise and false breakouts.
- Multi-Timeframe Analysis – Many traders use multiple timeframes to get a more comprehensive view. For example, a trader might use a daily chart to find major support and resistance levels and a 1-hour chart to time their entries.
Understanding how support and resistance levels interact across different timeframes can help traders develop more precise and effective strategies.
How Can Using Support and Resistance Indicators Help Traders?
Support and resistance indicators are essential tools in a trader’s arsenal, helping to identify key price levels where the market is likely to react. These indicators provide a structured way to spot potential reversals, breakouts, and trend continuations, making them invaluable for technical traders.
By using these indicators, traders can:
- Improve Entry and Exit Timing – Identifying strong support and resistance levels helps traders enter trades at optimal points and set precise stop-loss and take-profit levels.
- Reduce Market Noise – Indicators filter out random price movements, allowing traders to focus on significant levels that matter.
- Confirm Market Trends – Certain indicators help confirm whether a trend is strong or weakening by analysing price reactions at support and resistance.
- Avoid False Breakouts – Many traders fall into the trap of reacting to fake breakouts; indicators can help distinguish between real breakouts and temporary price movements.
In the next sections, we’ll go through the most useful support and resistance indicators one by one, explaining how they work and how traders can apply them effectively.
1. Moving Averages Indicators
Simple Moving Average (SMA) Indicator
What’s it about?
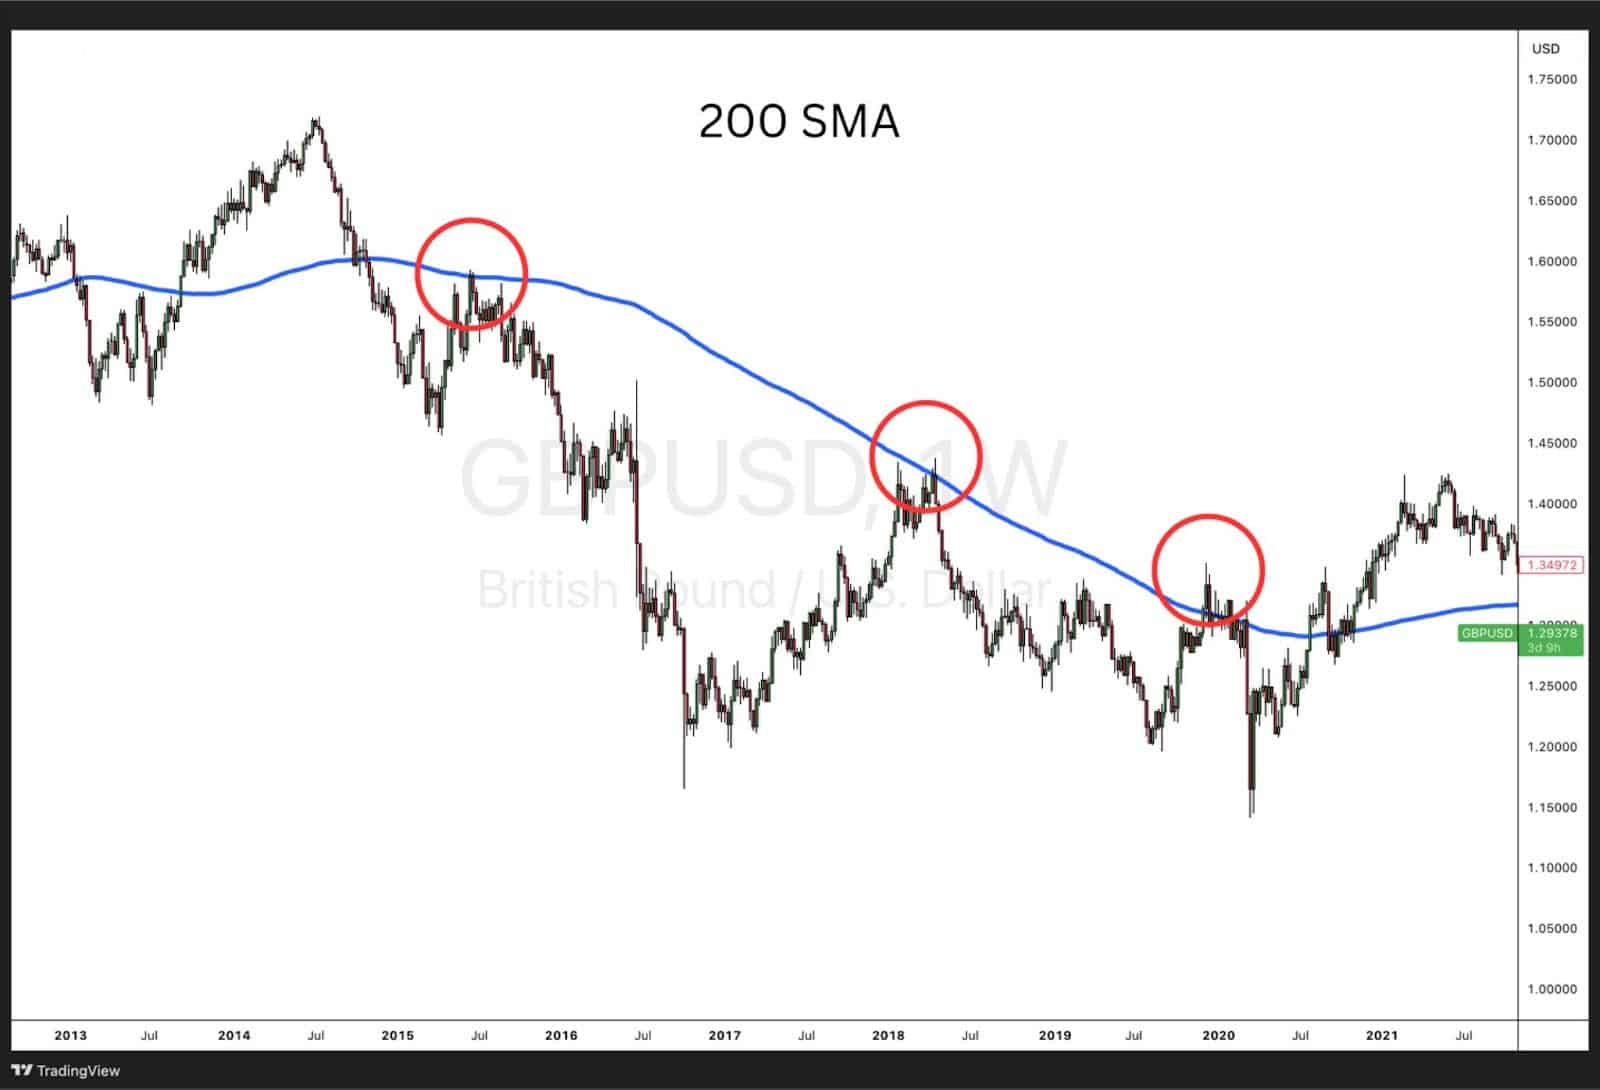
The Simple Moving Average (SMA) calculates the average price of an asset over a specific period, smoothing out price fluctuations to reveal overall trends. It is widely used to identify dynamic support and resistance levels.
How to use SMA as a Support and Resistance Indicator
- Uptrend: The price tends to bounce off the SMA as support.
- Downtrend: The SMA acts as resistance, preventing the price from rising.
- Crossovers: A shorter-term SMA crossing above a longer-term SMA can indicate a potential breakout above resistance (bullish signal), while the opposite signals a breakdown below support.
Exponential Moving Average (EMA) Indicator
What’s it about?
The Exponential Moving Average (EMA) gives more weight to recent prices, making it more responsive to price changes than the SMA. It is useful for traders who need quicker signals for identifying support and resistance.
How to use EMA as a Support and Resistance Indicator
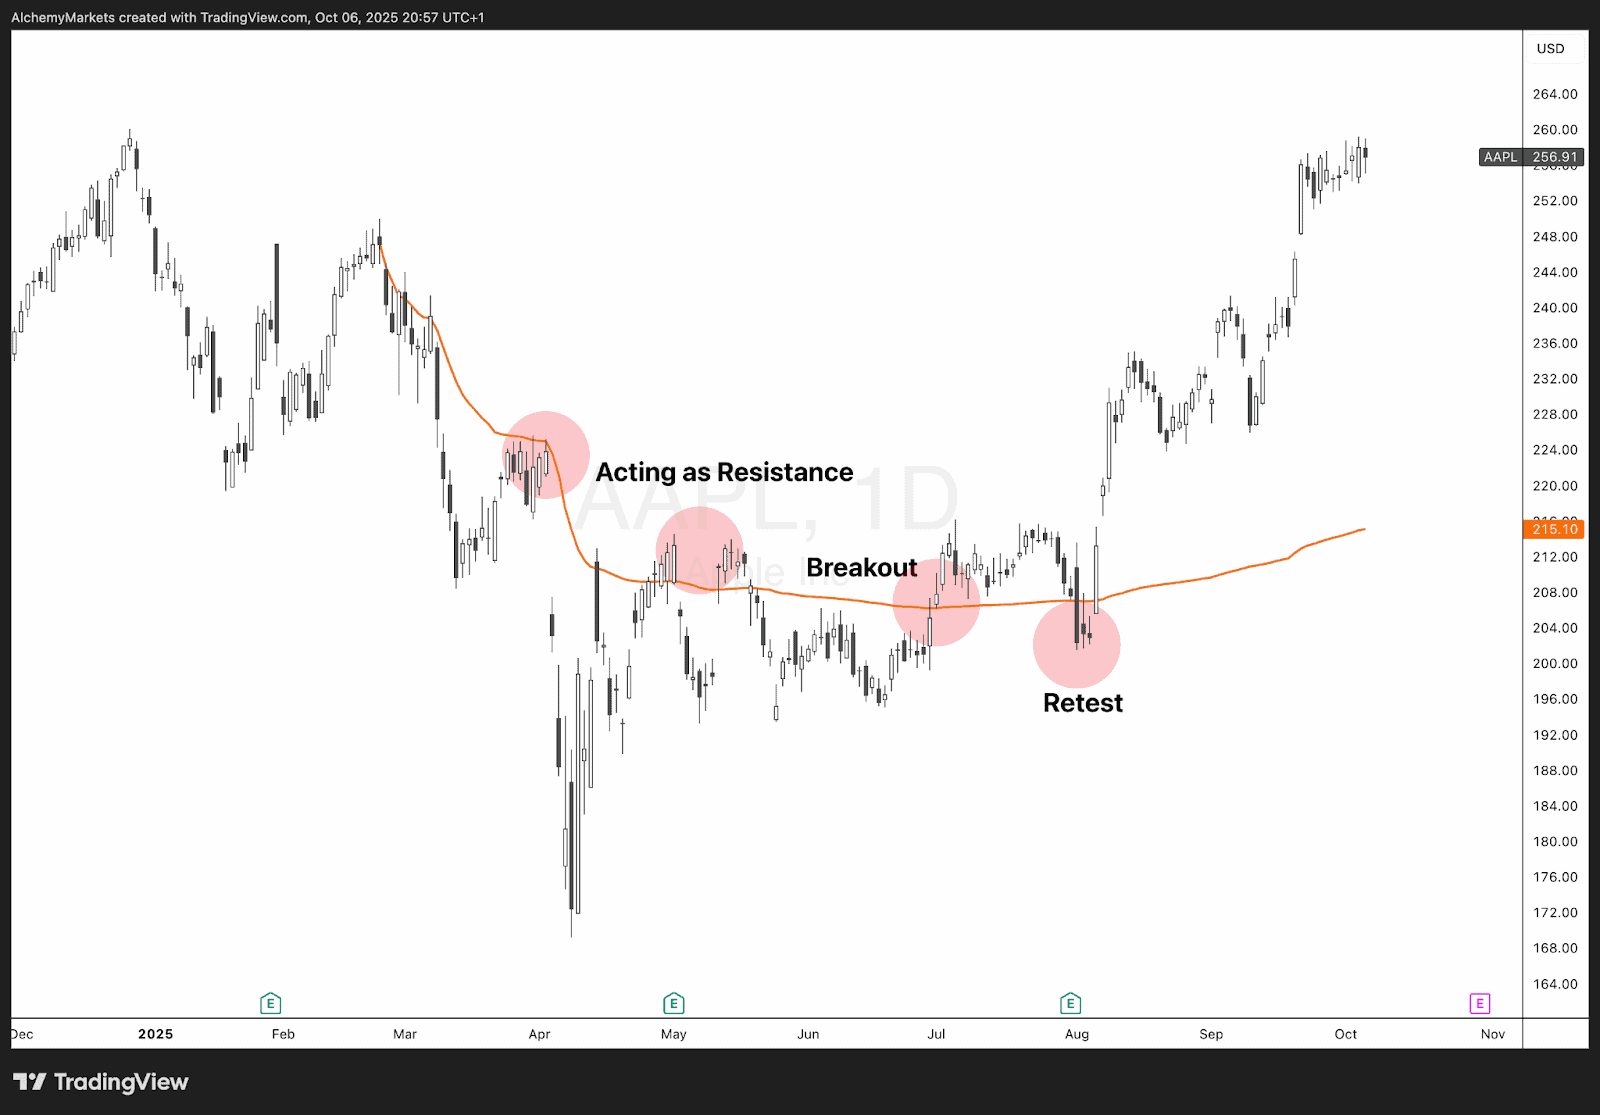
- Trending Markets: The 50 EMA or 200 EMA often acts as strong dynamic support in uptrends and resistance in downtrends.
- Breakout Confirmation: If the price retests an EMA after a breakout and holds, it confirms the level as new support or resistance.
- Multiple EMAs: Using two EMAs (e.g., 20 EMA and 50 EMA) can help traders gauge trend strength and potential reversals.
Weighted Moving Average (WMA) Indicator
What’s it about?
The Weighted Moving Average (WMA) places more emphasis on recent price data, making it even more sensitive to price movements than the EMA. It helps traders identify short-term support and resistance levels in volatile markets.
How to use WMA as a Support and Resistance Indicator
- Short-Term Trading: WMAs with smaller periods (e.g., 10 or 20) act as support or resistance for quick trades.
- Confluence with Other Indicators: When price aligns with a major WMA and another indicator (such as Fibonacci retracements), the level becomes stronger.
- Volatility Adjustment: Because WMA reacts quickly, it works best for active traders managing short-term price swings.
Moving averages are dynamic indicators that adapt to price movements, making them reliable tools for identifying support and resistance in trending markets.
2. Bollinger Bands Indicator®
What’s it about?
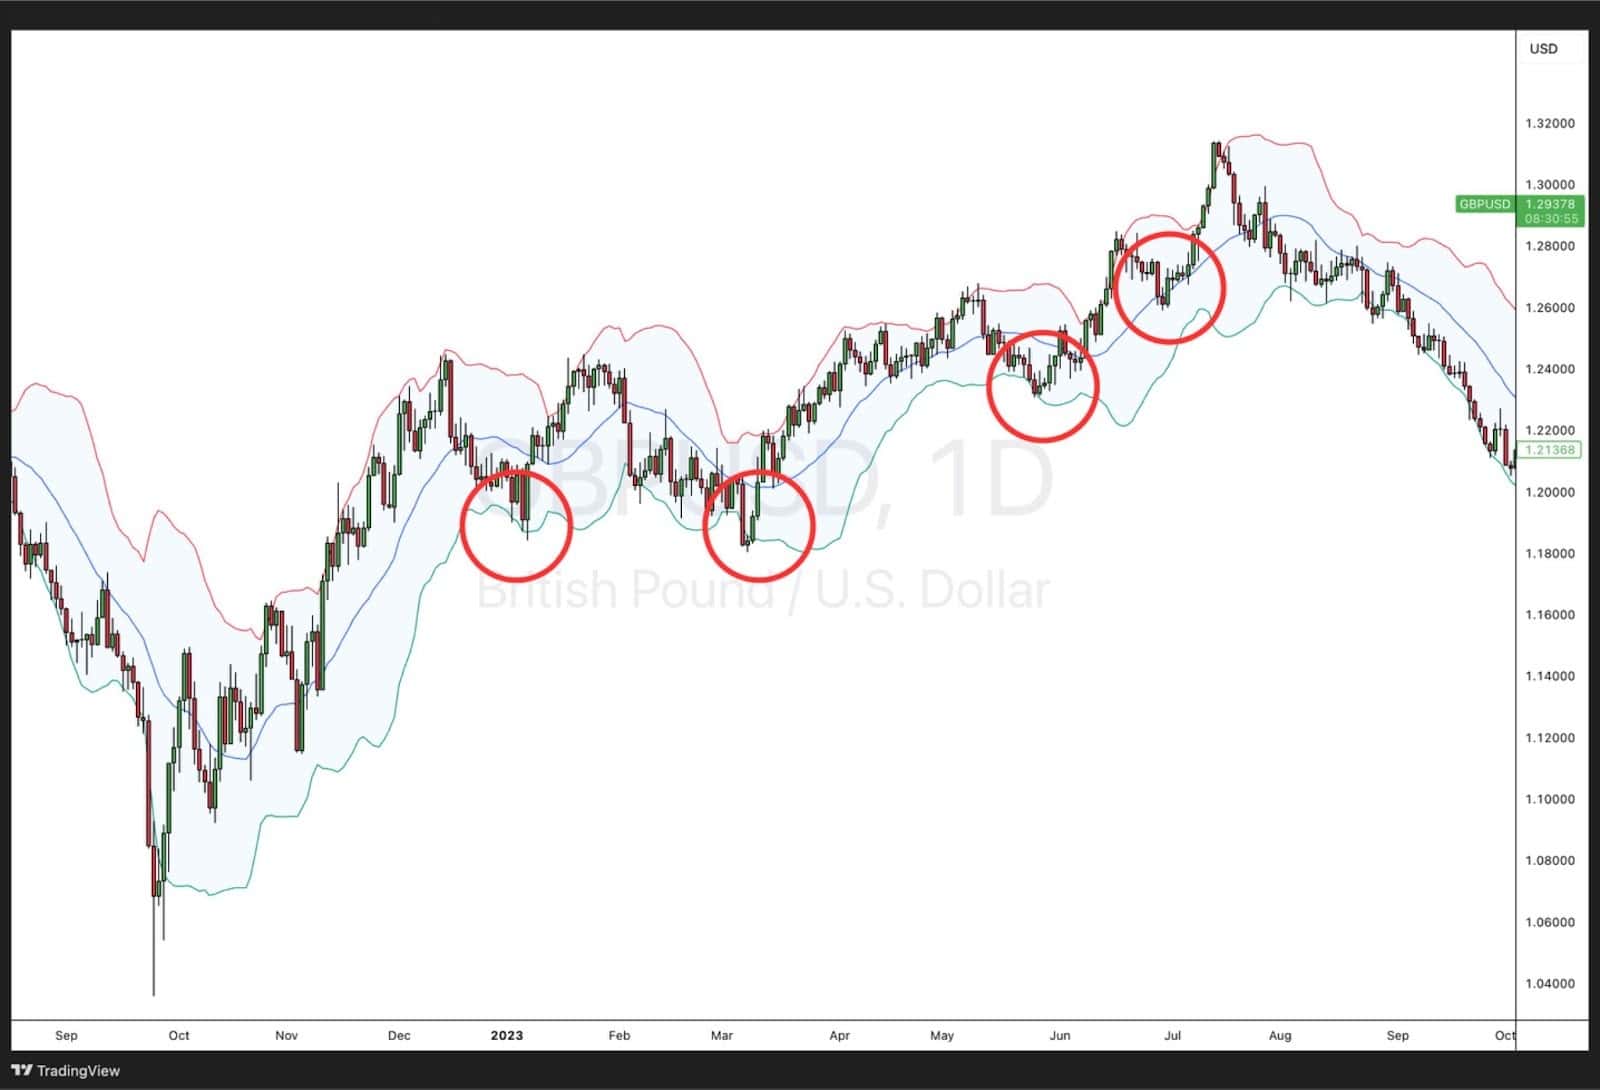
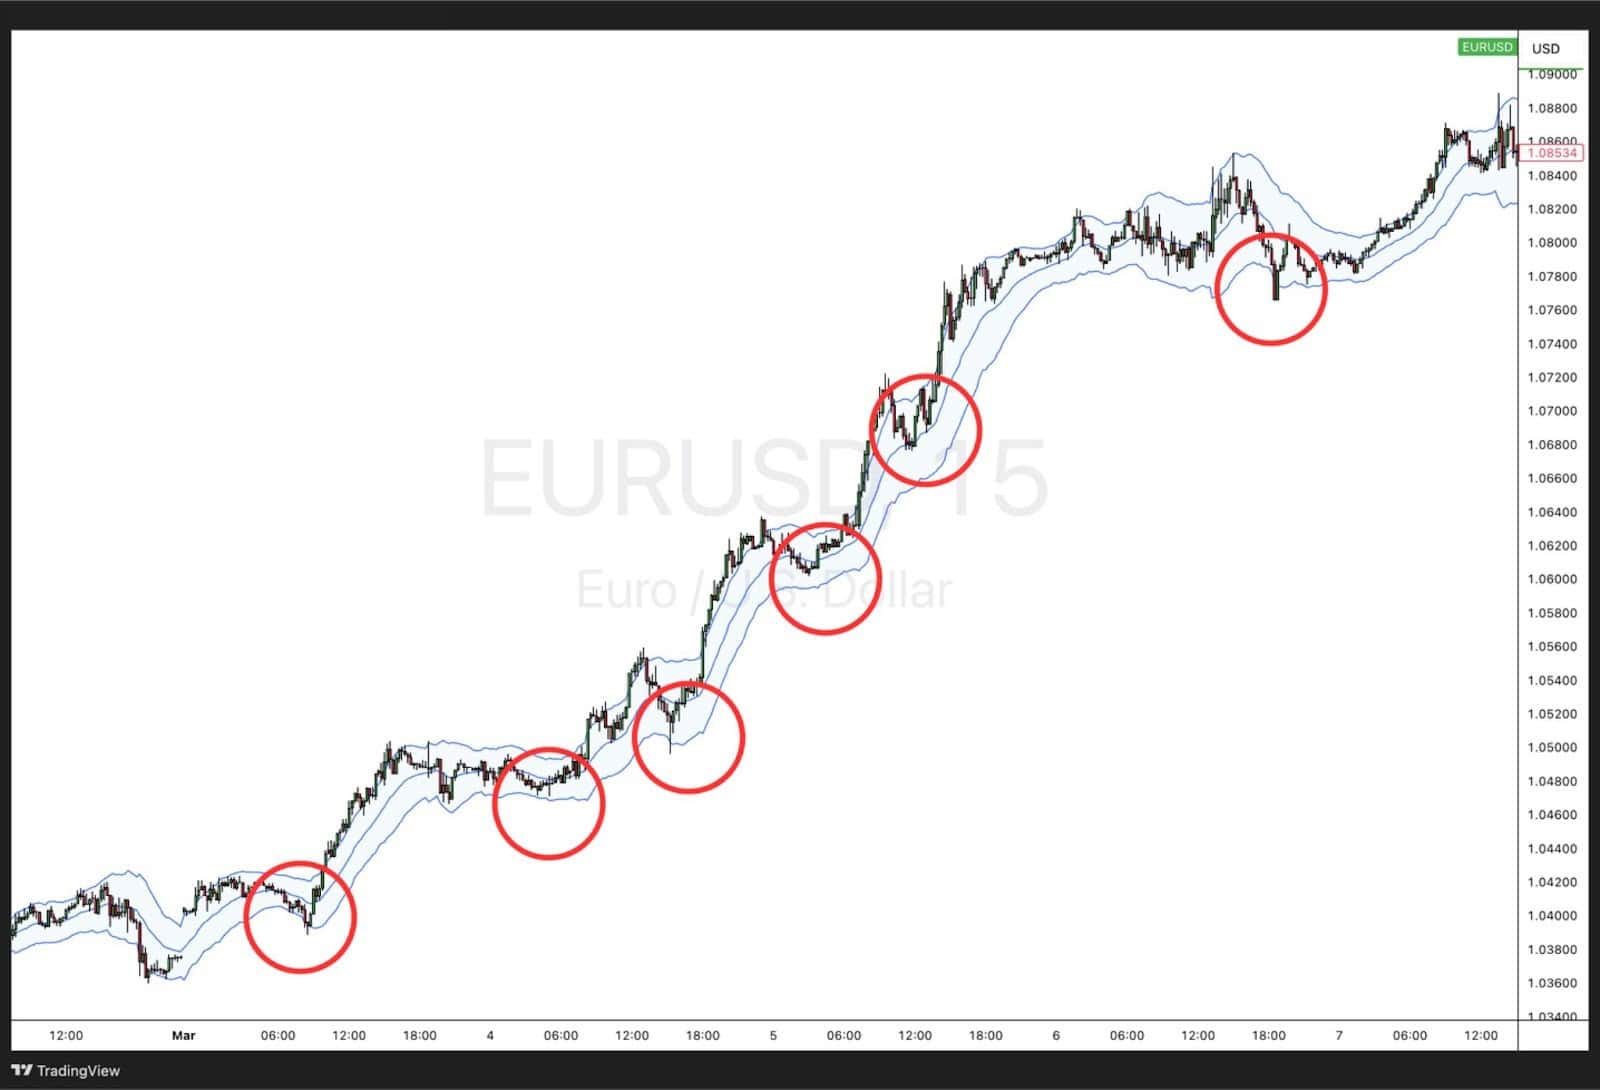
Bollinger Bands® consist of three lines: a middle band (usually a 20-period SMA) and two outer bands that expand and contract based on market volatility. These bands act as dynamic support and resistance levels, helping traders identify price extremes and potential reversals.
How to use Bollinger Bands as a Support and Resistance Indicator
- Upper Band as Resistance: When the price reaches the upper band, it often signals overbought conditions, acting as resistance and leading to potential pullbacks.
- Lower Band as Support: The lower band acts as support, as price tends to bounce when it touches this level, indicating oversold conditions.
- Mean Reversion Trading: Prices often revert to the middle band (SMA), making it a dynamic support or resistance level.
- Breakouts & Trend Confirmation: A strong breakout above or below the bands can indicate a trend continuation, with the bands widening as volatility increases.
Bollinger Bands help traders gauge price volatility while providing flexible support and resistance levels in different market conditions.
3. Fibonacci Retracements Indicator
What’s it about?
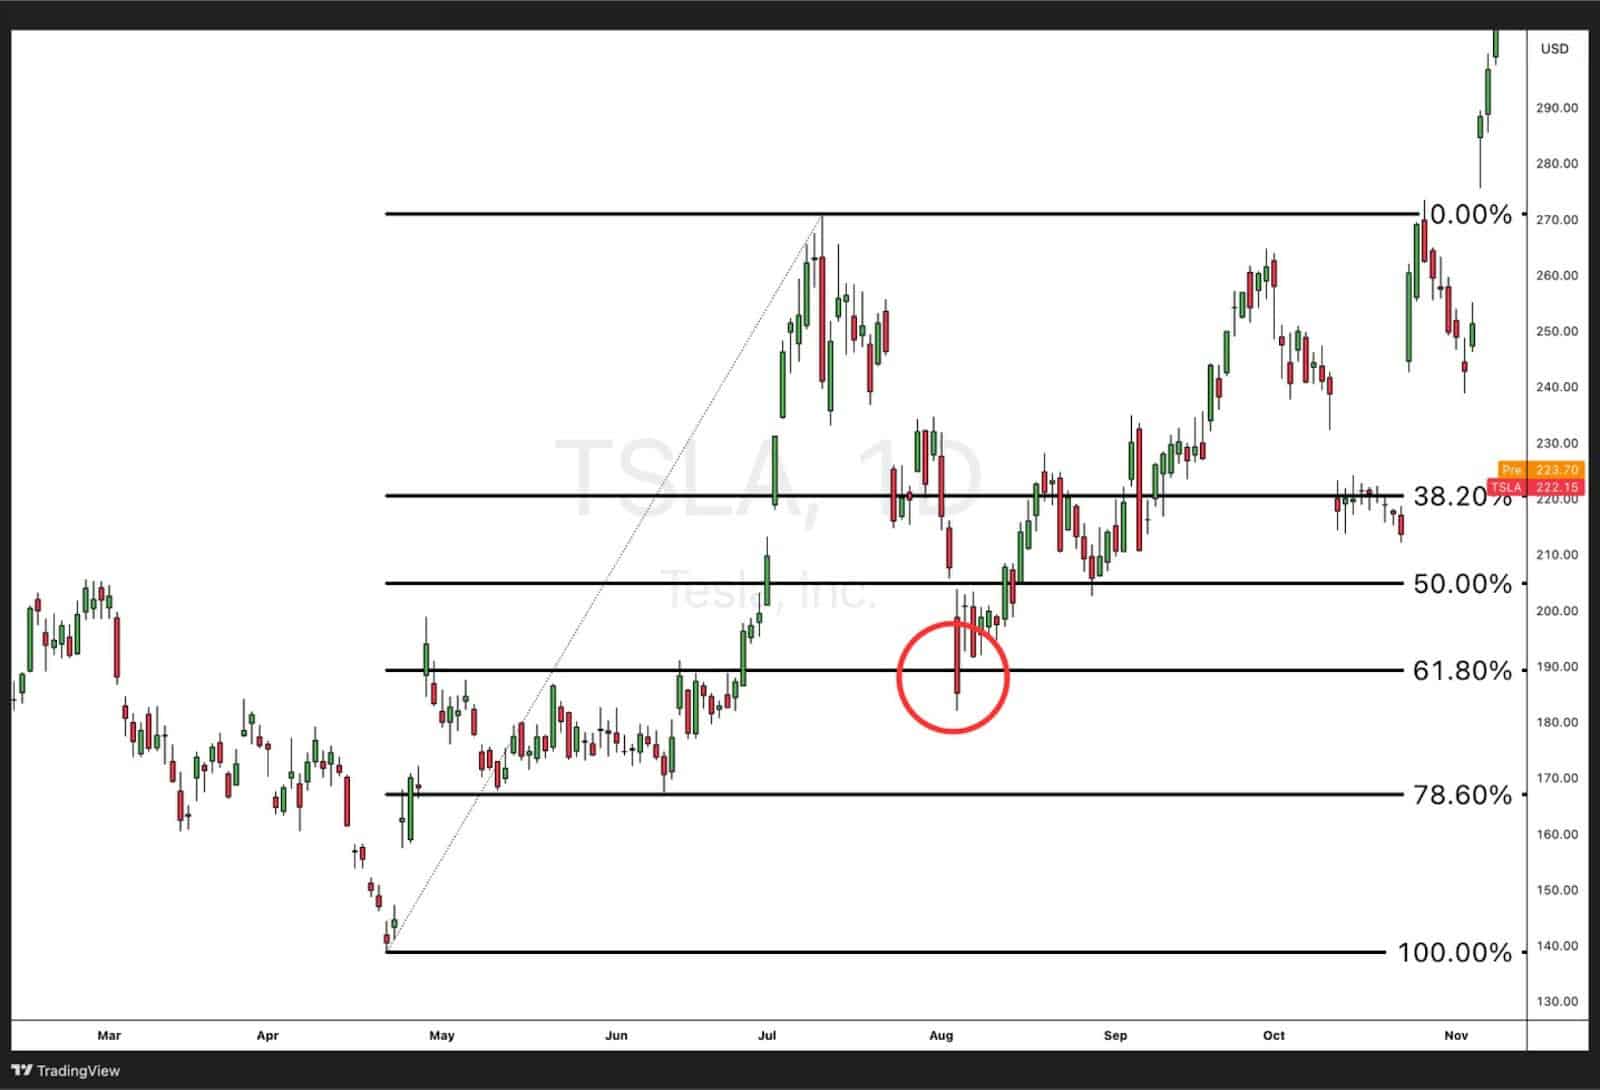
The Fibonacci Retracement indicator identifies key support and resistance levels based on the Fibonacci sequence. It plots percentage retracement levels (23.6%, 38.2%, 50%, 61.8%, and 78.6%) between a major high and low, helping traders predict potential price reversals.
How to use Fibonacci as a Support and Resistance Indicator
- Key Levels as Support & Resistance: Price often reacts at Fibonacci levels, with 38.2% and 61.8% acting as strong support in uptrends and resistance in downtrends.
- Pullback Trading: In an uptrend, traders look for a retracement to key Fibonacci levels before entering long positions. The opposite applies in downtrends.
- Confluence with Other Indicators: When a Fibonacci level aligns with a moving average or previous price structure, it strengthens that level’s reliability.
- Breakout Confirmation: If price breaks through a Fibonacci level decisively, it often moves toward the next level, helping traders set targets.
Fibonacci retracements provide traders with a structured way to identify high-probability support and resistance zones within trending markets.
4. Fibonacci Extension Indicator
What’s it about?
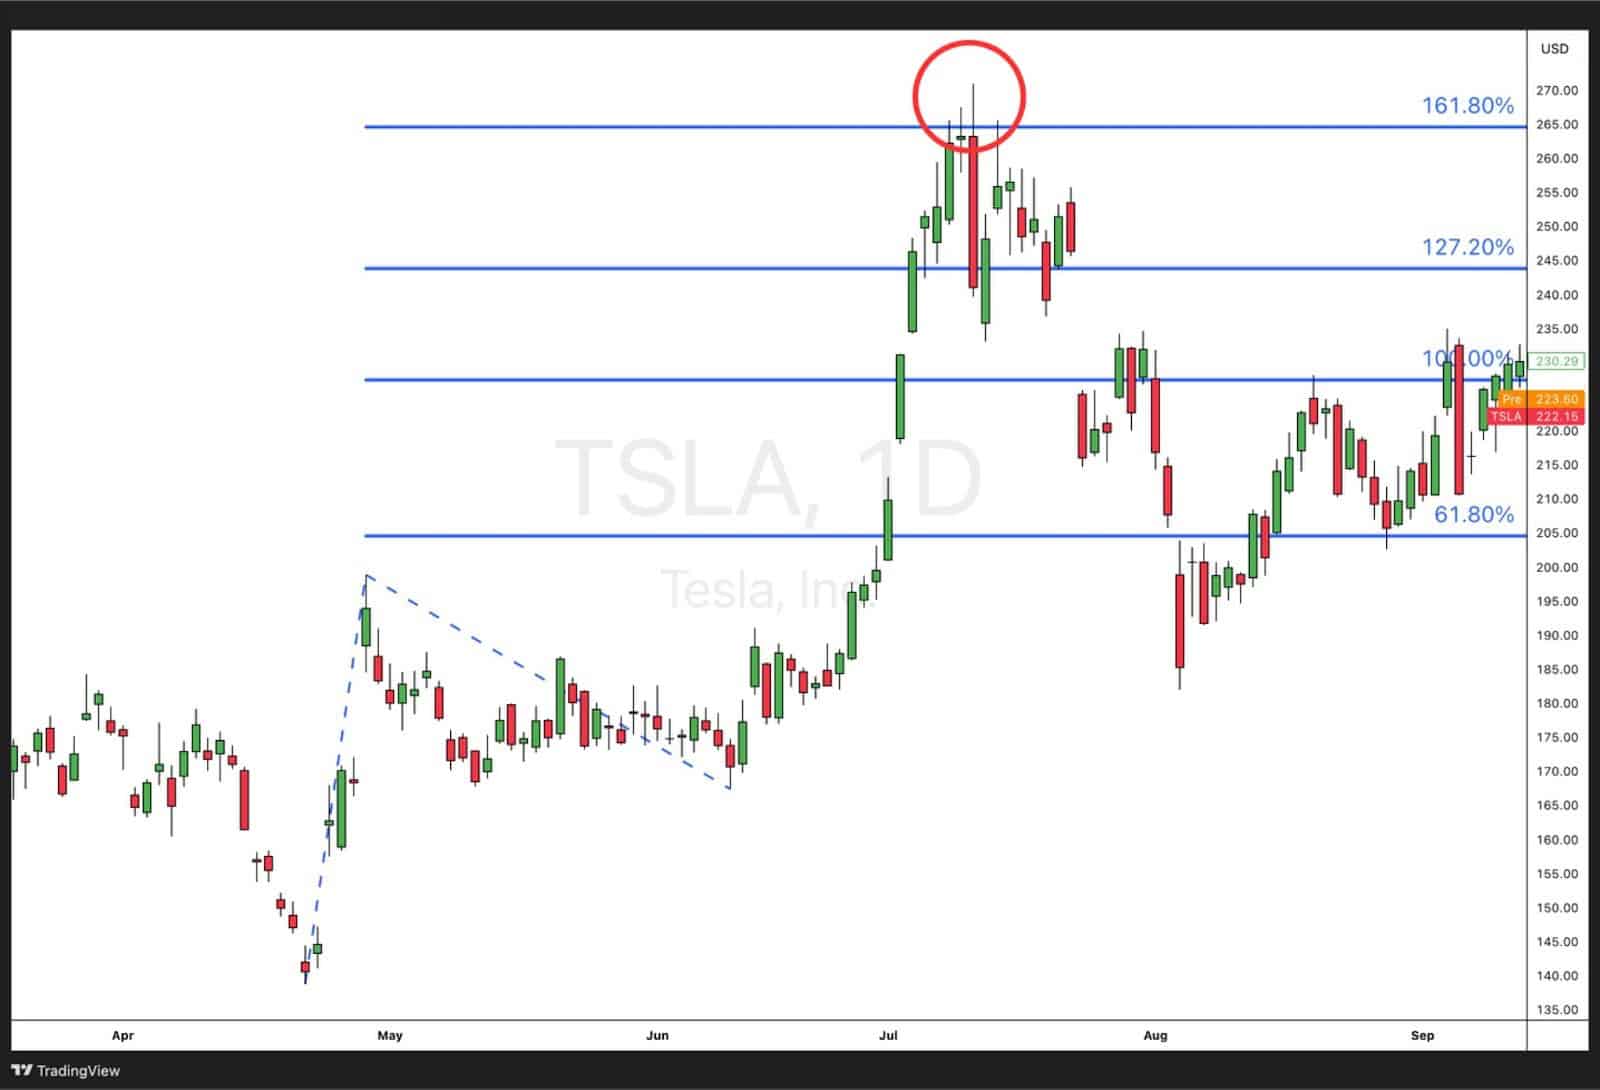
The Fibonacci Extension indicator helps traders identify potential profit-taking levels by projecting price movements beyond the original trend. It uses key Fibonacci ratios (127.2%, 161.8%, 200%, 261.8%) to predict where price may face resistance in an uptrend or support in a downtrend.
How to use Fibonacci Extension as a Support and Resistance Indicator
- Targeting Profit Levels: Traders use Fibonacci extensions to set potential price targets after a breakout or trend continuation. The 161.8% level is commonly used for setting profit targets.
- Resistance in Uptrends: If price is moving higher, Fibonacci extension levels can act as future resistance zones where the trend may slow down or reverse.
- Support in Downtrends: In a falling market, extension levels help identify where price may find support before bouncing back.
- Combining with Retracements: When a Fibonacci extension level aligns with a previous support or resistance zone, it strengthens the probability of a price reaction.
Fibonacci extensions are useful for predicting where price might move next, making them ideal for setting profit targets and identifying long-term support and resistance levels.
5. Pivot Points Indicator
What’s it about?
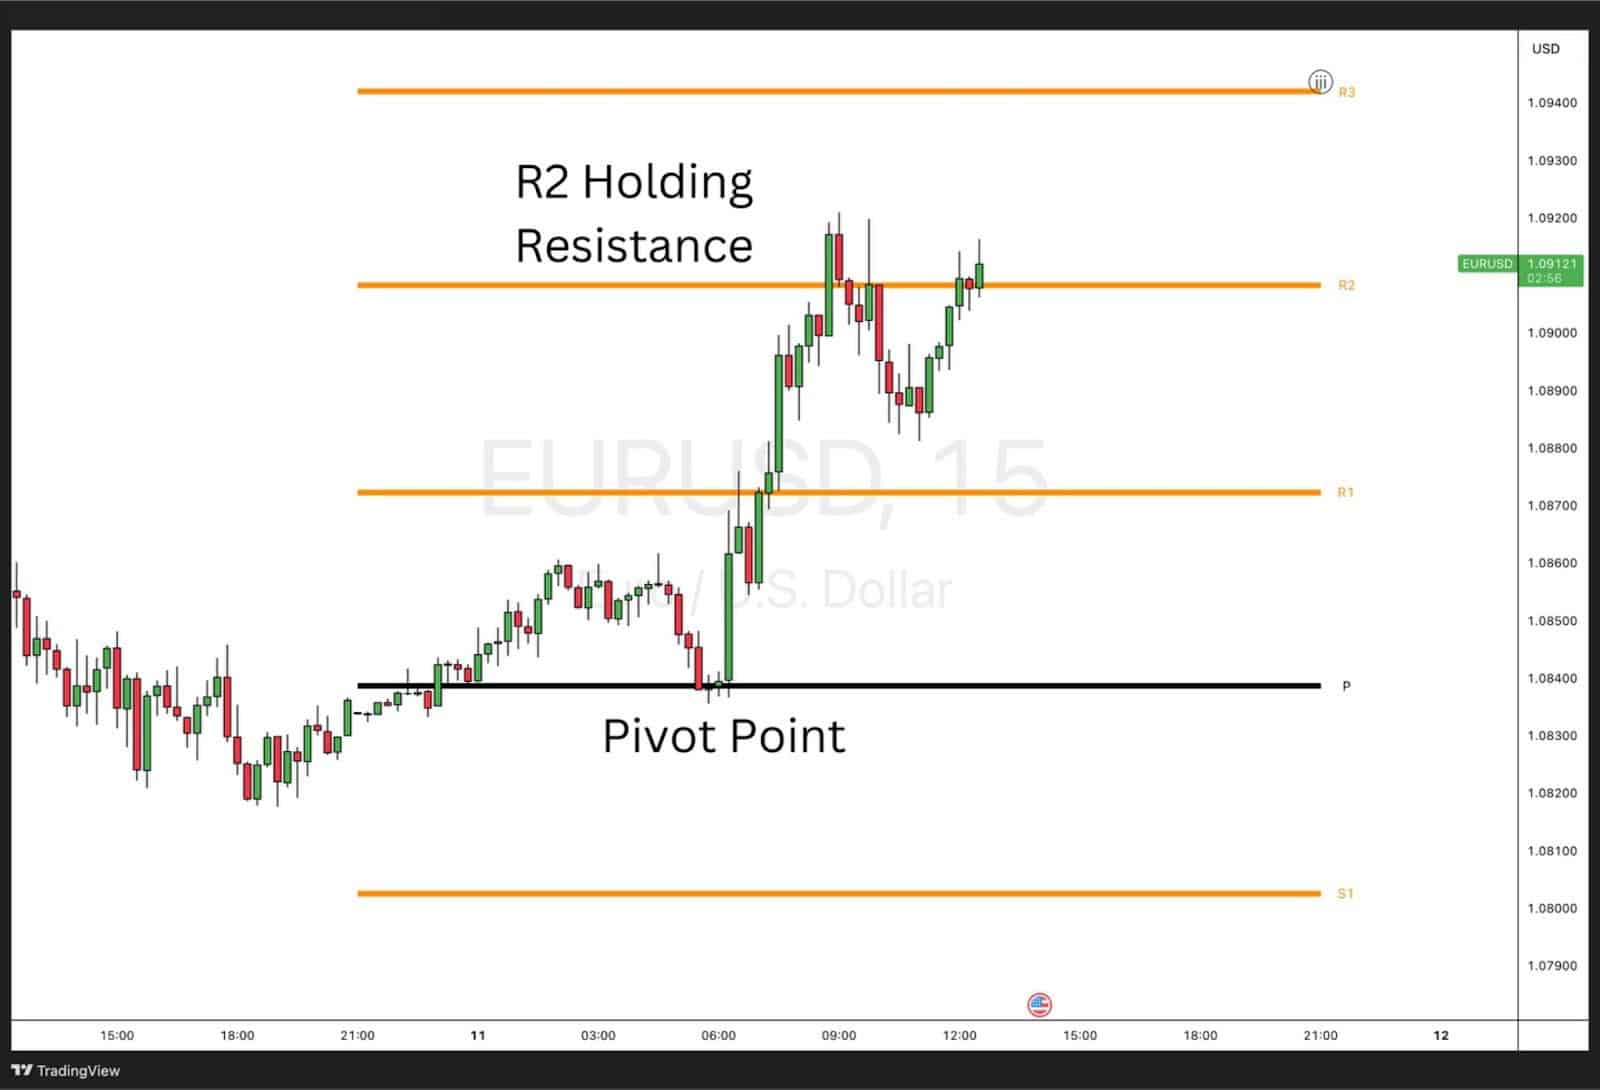
Pivot Points are calculated price levels that help traders determine potential support and resistance zones for the day. They are widely used in intraday and short-term trading, providing clear reference points based on the previous trading session’s high, low, and close.
How to use Pivot Points as a Support and Resistance Indicator
- Central Pivot Point (PP): The main pivot level acts as a midline; if the price stays above it, the market is considered bullish, while below it, the market is bearish.
- Support and Resistance Levels: Pivot points generate multiple support (S1, S2, S3) and resistance (R1, R2, R3) levels, which traders use to anticipate price reactions.
- Bounce or Break Strategy: Traders look for price to either bounce off these levels or break through them for a continuation move.
- Intraday Trading Tool: Pivot points are particularly useful for day traders who need predefined levels to plan entries, exits, and stop-losses.
Pivot points offer a structured approach to identifying key price levels, making them effective for traders looking for consistent support and resistance zones.
6. Keltner Channels Indicator
What’s it about?
Keltner Channels are volatility-based bands similar to Bollinger Bands but use the Average True Range (ATR) instead of standard deviation. The indicator consists of a middle line (typically a 20-period Exponential Moving Average) and two outer bands that expand and contract based on market volatility.
How to use Keltner Channels as a Support and Resistance Indicator
- Upper Band as Resistance: When price reaches the upper channel, it often acts as resistance, signalling potential overbought conditions.
- Lower Band as Support: The lower channel serves as dynamic support, where price tends to bounce in an uptrend.
- Trend Confirmation: A price consistently hugging the upper band suggests a strong uptrend, while price sticking to the lower band indicates a downtrend.
- Breakout Signals: If price closes outside the channels with strong momentum, it may indicate a significant breakout, with the previous band level acting as new support or resistance.
Keltner Channels help traders track price movements dynamically, providing clear support and resistance levels while filtering out noise in volatile markets.
Donchian Channels Indicator
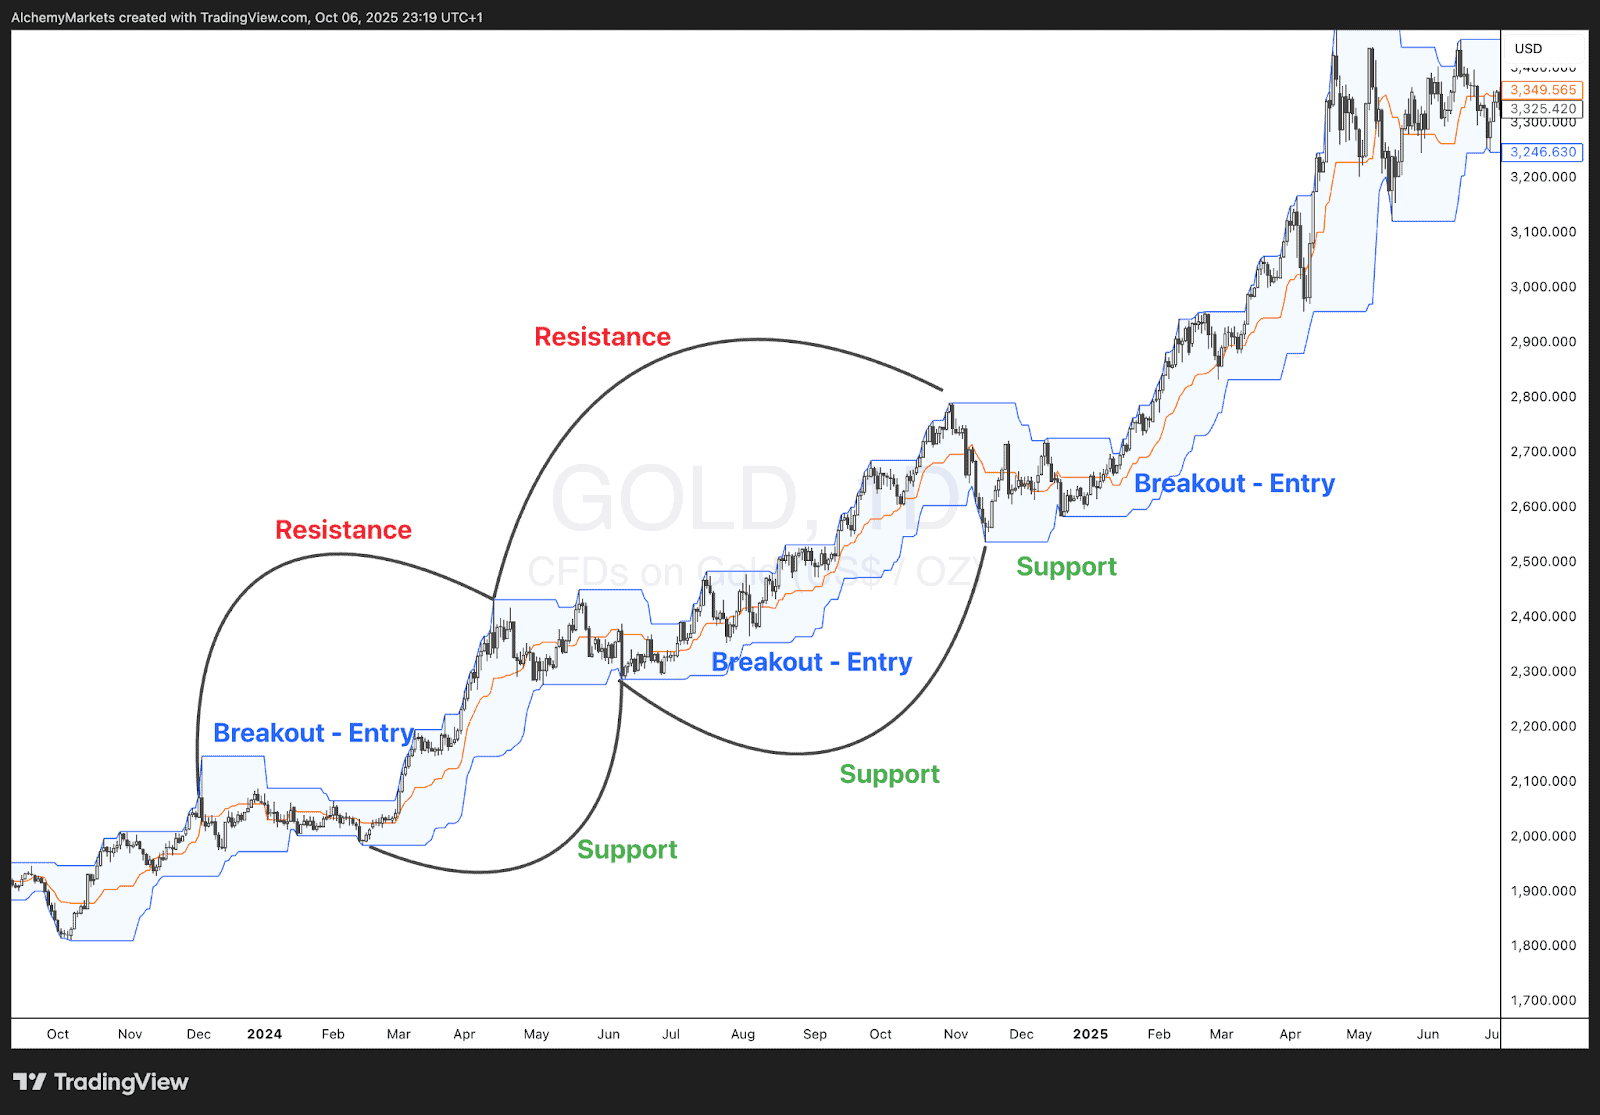
What’s it about?
Donchian Channels are volatility-based indicators that plot the highest high and lowest low over a specific period, forming a channel around price action. While they can show potential support and resistance zones, they are primarily used to identify breakout opportunities that signal the start of new trends.
How to Use Donchian Channels for Breakout Trading
- Upper Band Breakout (Buy Signal): When price closes above the upper band, it indicates a breakout above resistance, suggesting the beginning of a bullish trend or trend continuation to the upside.
- Lower Band Breakout (Sell Signal): When price drops below the lower band, it signals a breakdown below support, pointing to bearish momentum and potential trend continuation downward.
- Trend Strength: Price hugging the upper band shows strong buying pressure and an active uptrend, while staying near the lower band highlights selling strength and a sustained downtrend.
- Volatility Expansion: The widening of the Donchian Channel often precedes significant price movement, helping traders anticipate and confirm breakout momentum.
Donchian Channels are best suited for breakout traders, enabling them to capture powerful moves by trading breaks of key support and resistance levels as they occur.
8. Camarilla Pivots Indicator

What’s it about?
Camarilla Pivots are an advanced form of pivot points that calculate multiple support and resistance levels using a specific formula. They provide tighter intraday levels, making them ideal for short-term trading.
How to use Camarilla Pivots as a Support and Resistance Indicator
- S3 and S4 as Support: If price approaches S3 or S4, these levels often act as strong support, signaling potential reversal zones.
- R3 and R4 as Resistance: R3 and R4 serve as resistance levels, with price frequently reversing at these points.
- Breakout Trading: A break above R4 or below S4 signals a strong trend continuation, confirming new support and resistance levels.
9. Murrey Math Lines Indicator
What’s it about?
Murrey Math Lines divide the price range into key horizontal levels, acting as dynamic support and resistance areas based on mathematical formulas.
How to use Murrey Math Lines as a Support and Resistance Indicator
- Major Lines (0/8, 8/8): Extreme levels where price often reverses due to overbought or oversold conditions.
- Mid-Level (4/8 Line): Acts as a major support/resistance level, often indicating trend reversals.
- Breakout Confirmation: A strong move beyond 8/8 or below 0/8 suggests an extended breakout or breakdown.
10. Average True Range Indicator
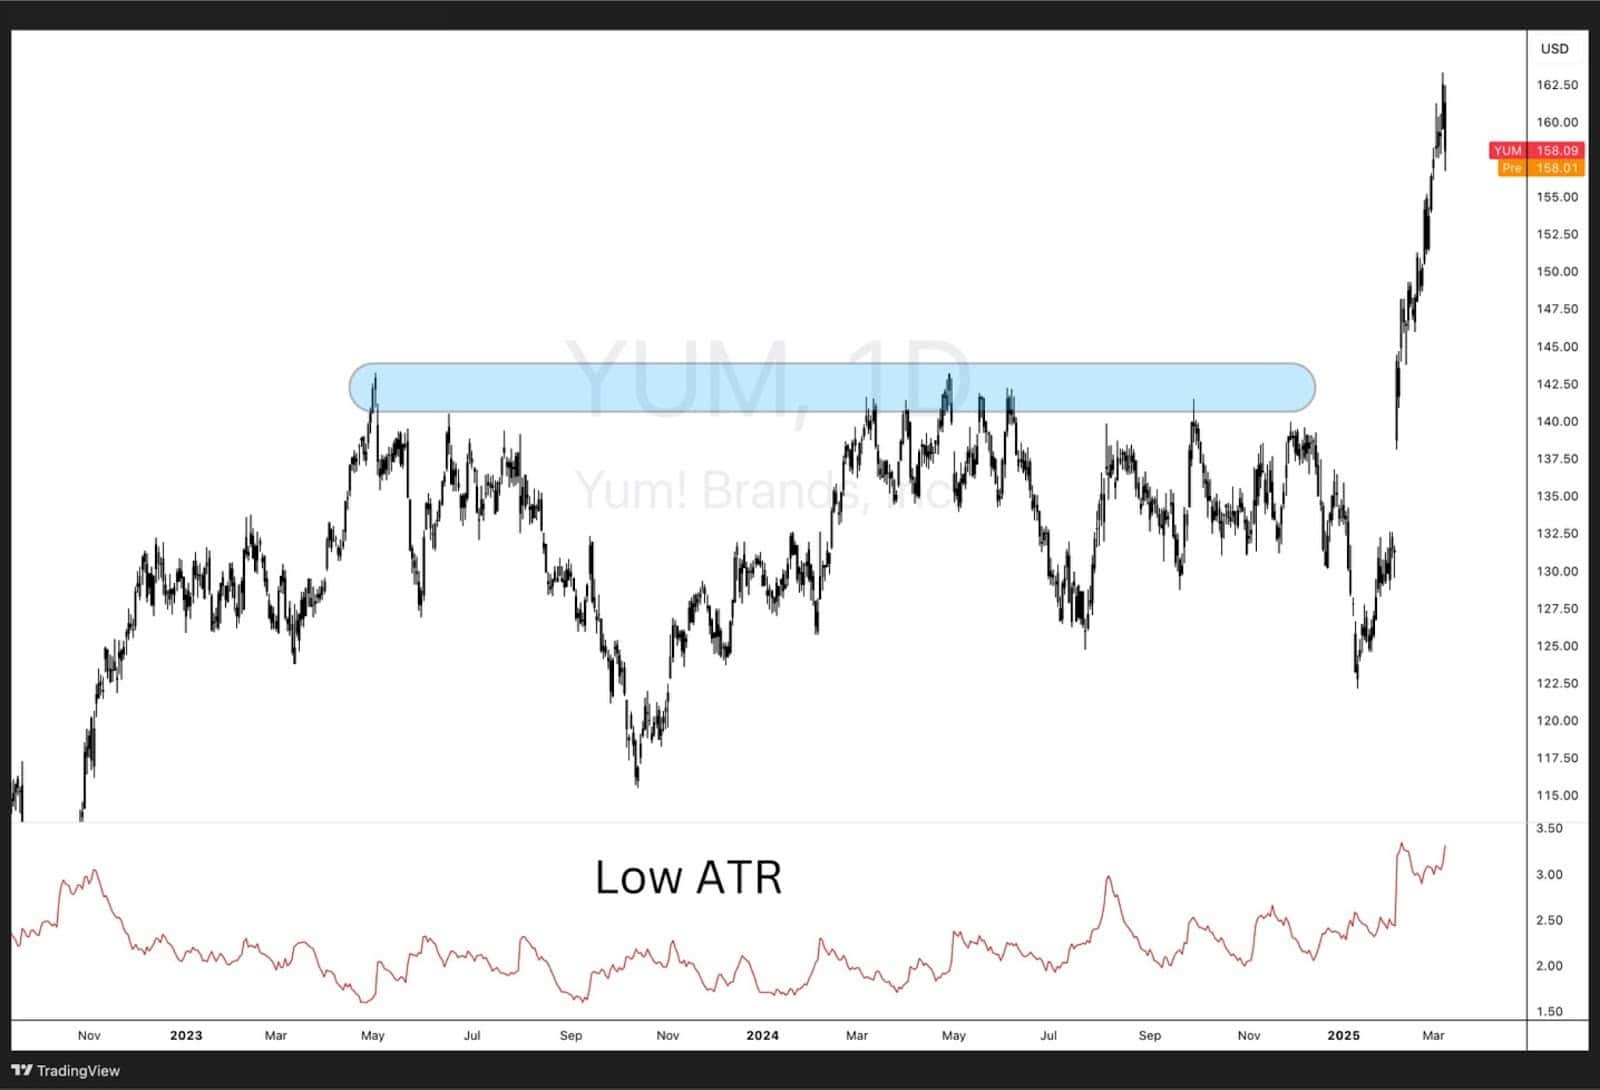
What’s it about?
ATR measures market volatility, helping traders gauge how far price is likely to move in a given period.
How to use ATR as a Support and Resistance Indicator
- Volatility-Based Stop Loss: ATR helps set dynamic stop-loss levels based on market conditions.
- High ATR = Stronger Breakouts: When ATR is high, support and resistance levels are more likely to be broken.
- Low ATR = Range-Bound Market: If ATR is low, price is likely to respect support and resistance levels.
11. Average Daily Range Indicator
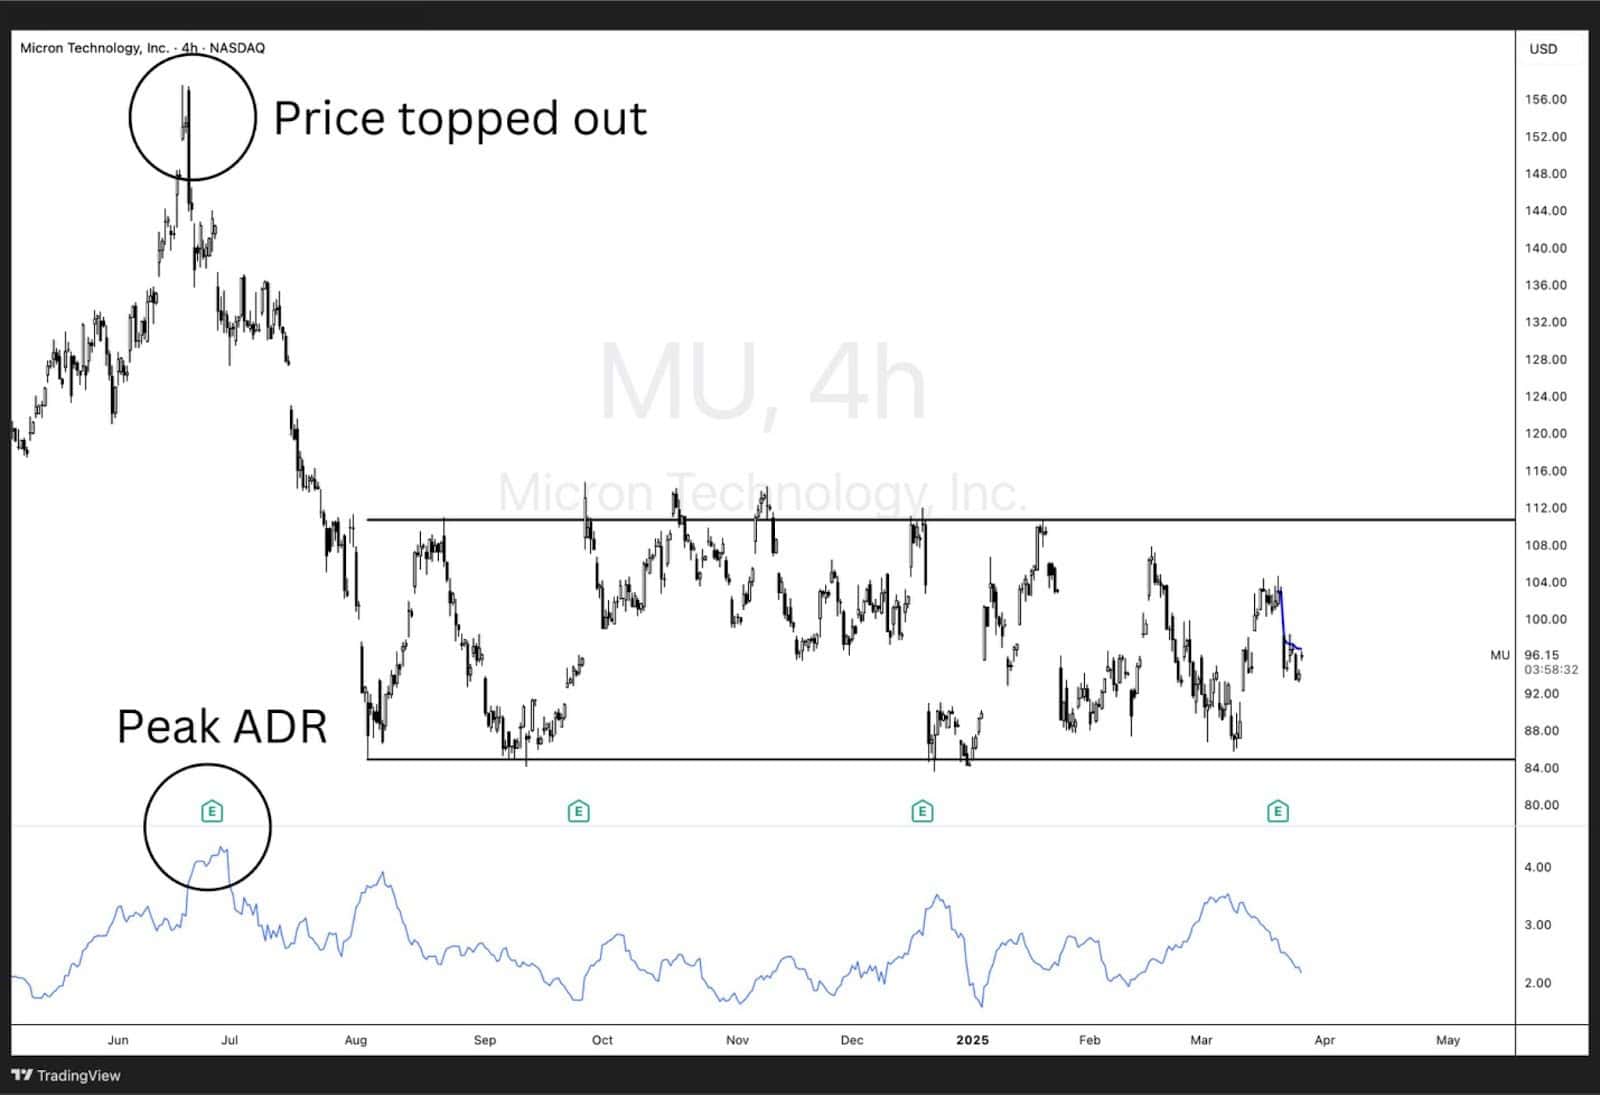
What’s it about?
ADR calculates the average price movement of an asset within a day, helping traders set expectations for price action.
How to use ADR as a Support and Resistance Indicator
- Projected High/Low Levels: Traders use ADR to estimate where price might find support or resistance.
- Mean Reversion Trading: If price reaches the ADR extreme, it may act as a reversal zone.
- Breakout Confirmation: If price extends beyond ADR, it signals an unusually strong trend.
12. Pre-market High Low Indicator
What’s it about?
This indicator marks the highest and lowest price levels from the pre-market session, which often act as key support and resistance levels.
How to use Pre-Market High Low as a Support and Resistance Indicator
- Pre-Market High as Resistance: If price struggles to break above the pre-market high, it can act as intraday resistance.
- Pre-Market Low as Support: Price may find support at the pre-market low, bouncing off this level.
- Breakout Strategy: A break above the pre-market high or below the low suggests strong momentum.
13.Wolf Waves Trendline Indicator
What’s it about?
Wolf Waves use trendlines to predict future price movements based on wave structures.
How to use Wolf Waves Trendline as a Support and Resistance Indicator
- Wave 3 and Wave 5 as Support/Resistance: These levels often act as key turning points.
- Breakout Confirmation: A strong move beyond the trendline suggests a breakout.
- Trend Reversals: Wolf waves often signal upcoming reversals near support/resistance zones.
14. Auto Trendline Indicator
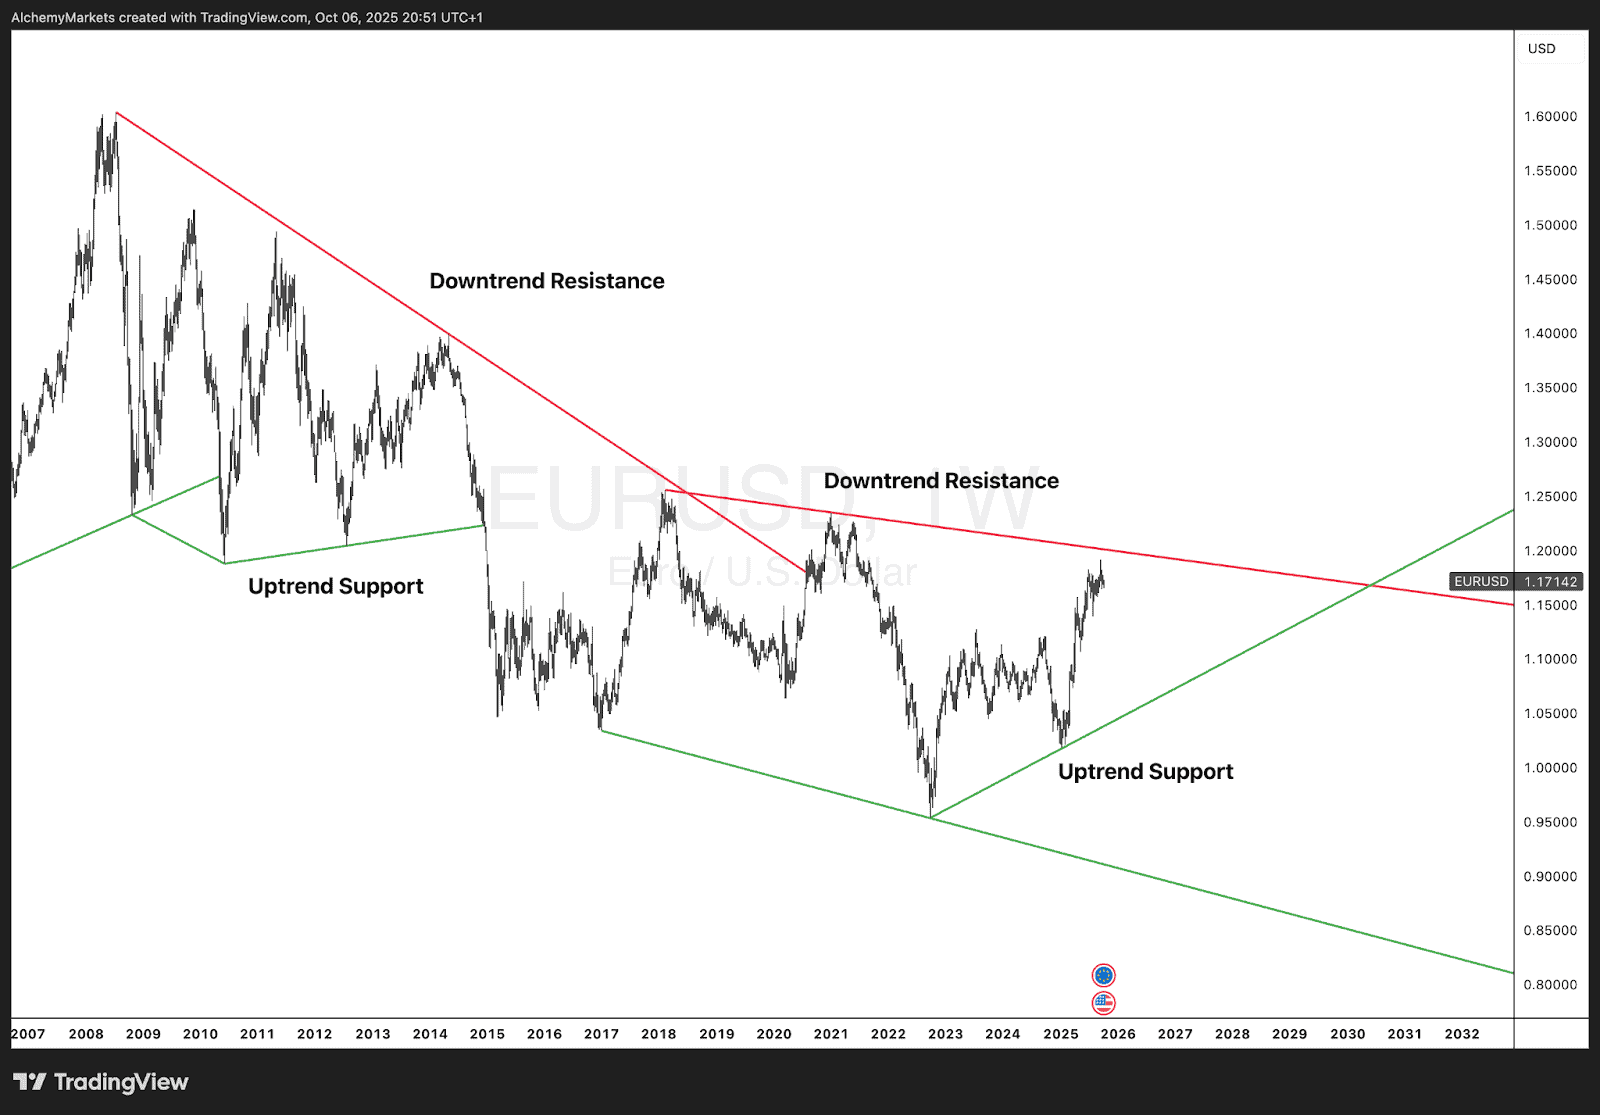
What’s it about?
This indicator automatically plots trendlines based on price action, helping traders identify support and resistance dynamically.
How to use Auto Trendline as a Support and Resistance Indicator
- Uptrend Support: Price tends to bounce off upward trendlines.
- Downtrend Resistance: Price often struggles to break above downward trendlines.
- Breakout and Retest Strategy: When a trendline breaks, it can become new support or resistance.
15. Dynamic Support and Resistance Indicator
What’s it about?
This indicator automatically adjusts support and resistance levels based on live price movements.
How to use Dynamic Support and Resistance Indicator
- Real-Time Levels: Adjusts dynamically as new highs and lows form.
- Trend Adaptation: Helps traders find evolving support and resistance.
- Breakout Confirmation: Price breaking a dynamic level indicates strong momentum
16. Weekly and Monthly Pivot Points Indicator
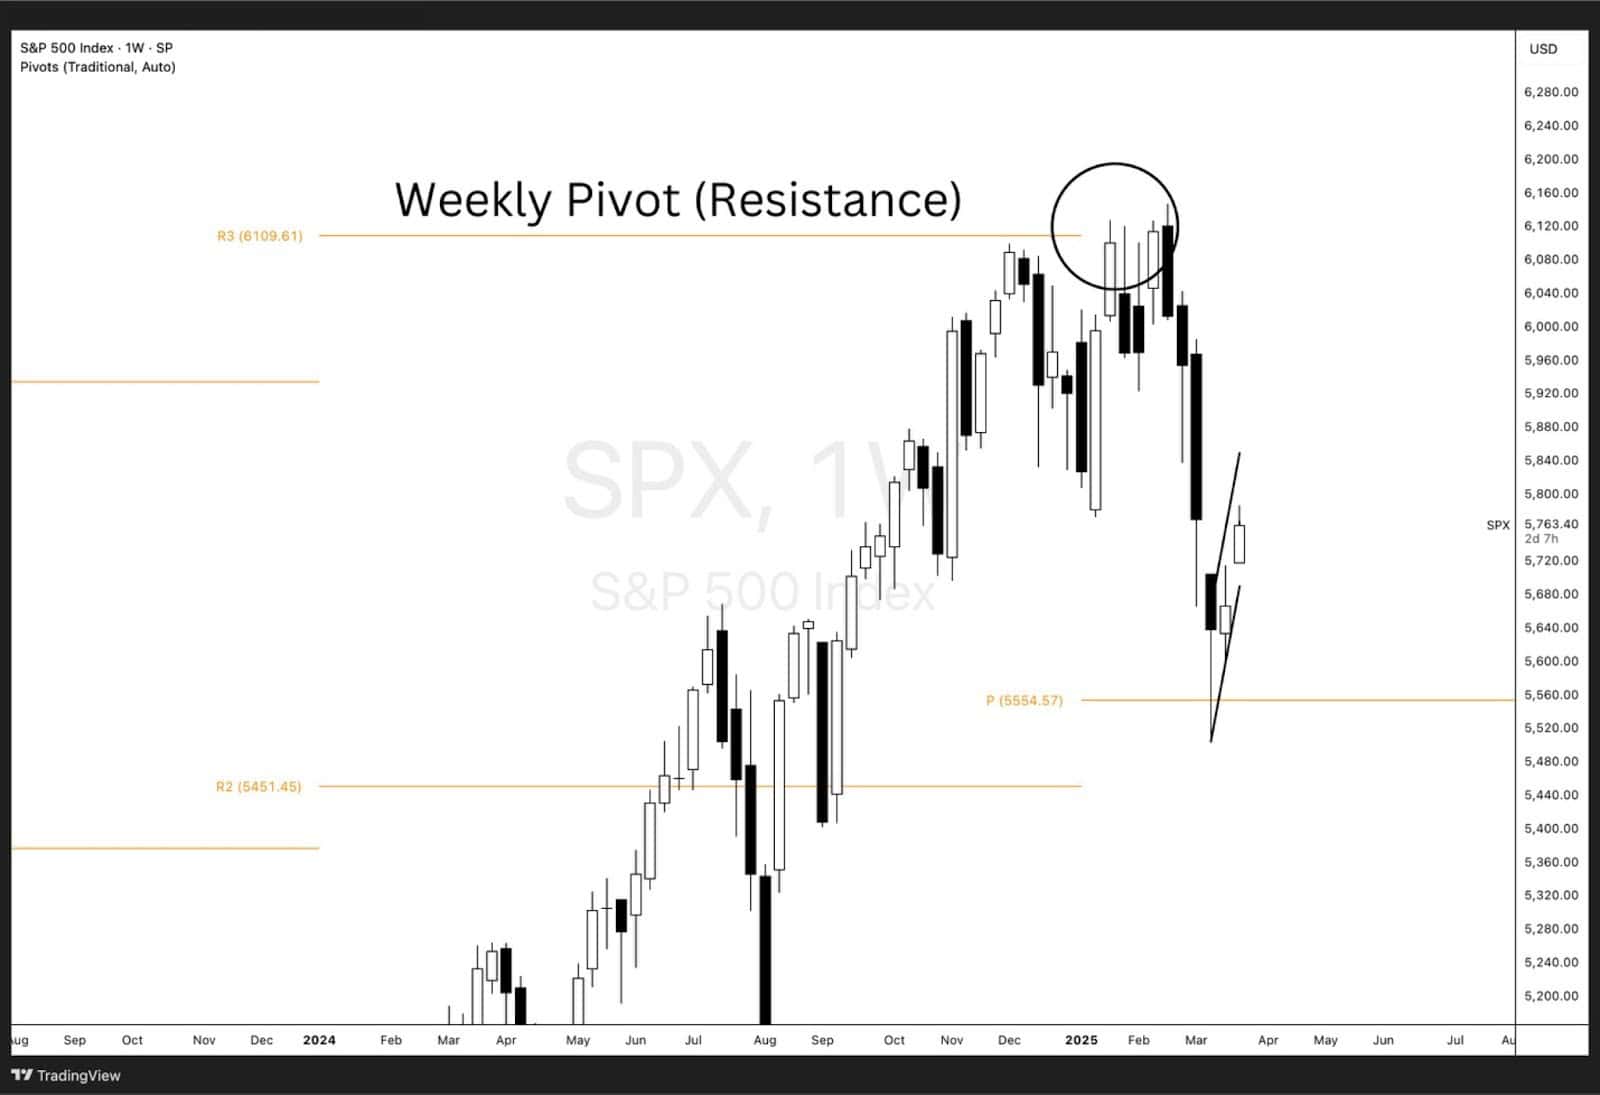
What’s it about?
Similar to daily pivot points but calculated over weekly or monthly timeframes, offering stronger support and resistance levels.
How to use Weekly and Monthly Pivot Points as a Support and Resistance Indicator
- Weekly Levels for Swing Trading: Helps identify key zones for multi-day trades.
- Monthly Pivots for Long-Term Trading: These levels act as strong support and resistance for long-term traders.
- Confluence with Other Indicators: Aligning with moving averages or Fibonacci strengthens the level.
17. Daily Range System Indicator
What’s it about?
Tracks the expected daily range of an asset to define key support and resistance areas.
How to use Daily Range System as a Support and Resistance Indicator
- Overextended Moves: Price reaching the extreme of the daily range may signal a reversal.
- Intraday Trading Levels: Helps set stop-loss and take-profit levels.
- Trend Strength Confirmation: If price exceeds the expected range, momentum is strong.
18. Ichimoku Cloud
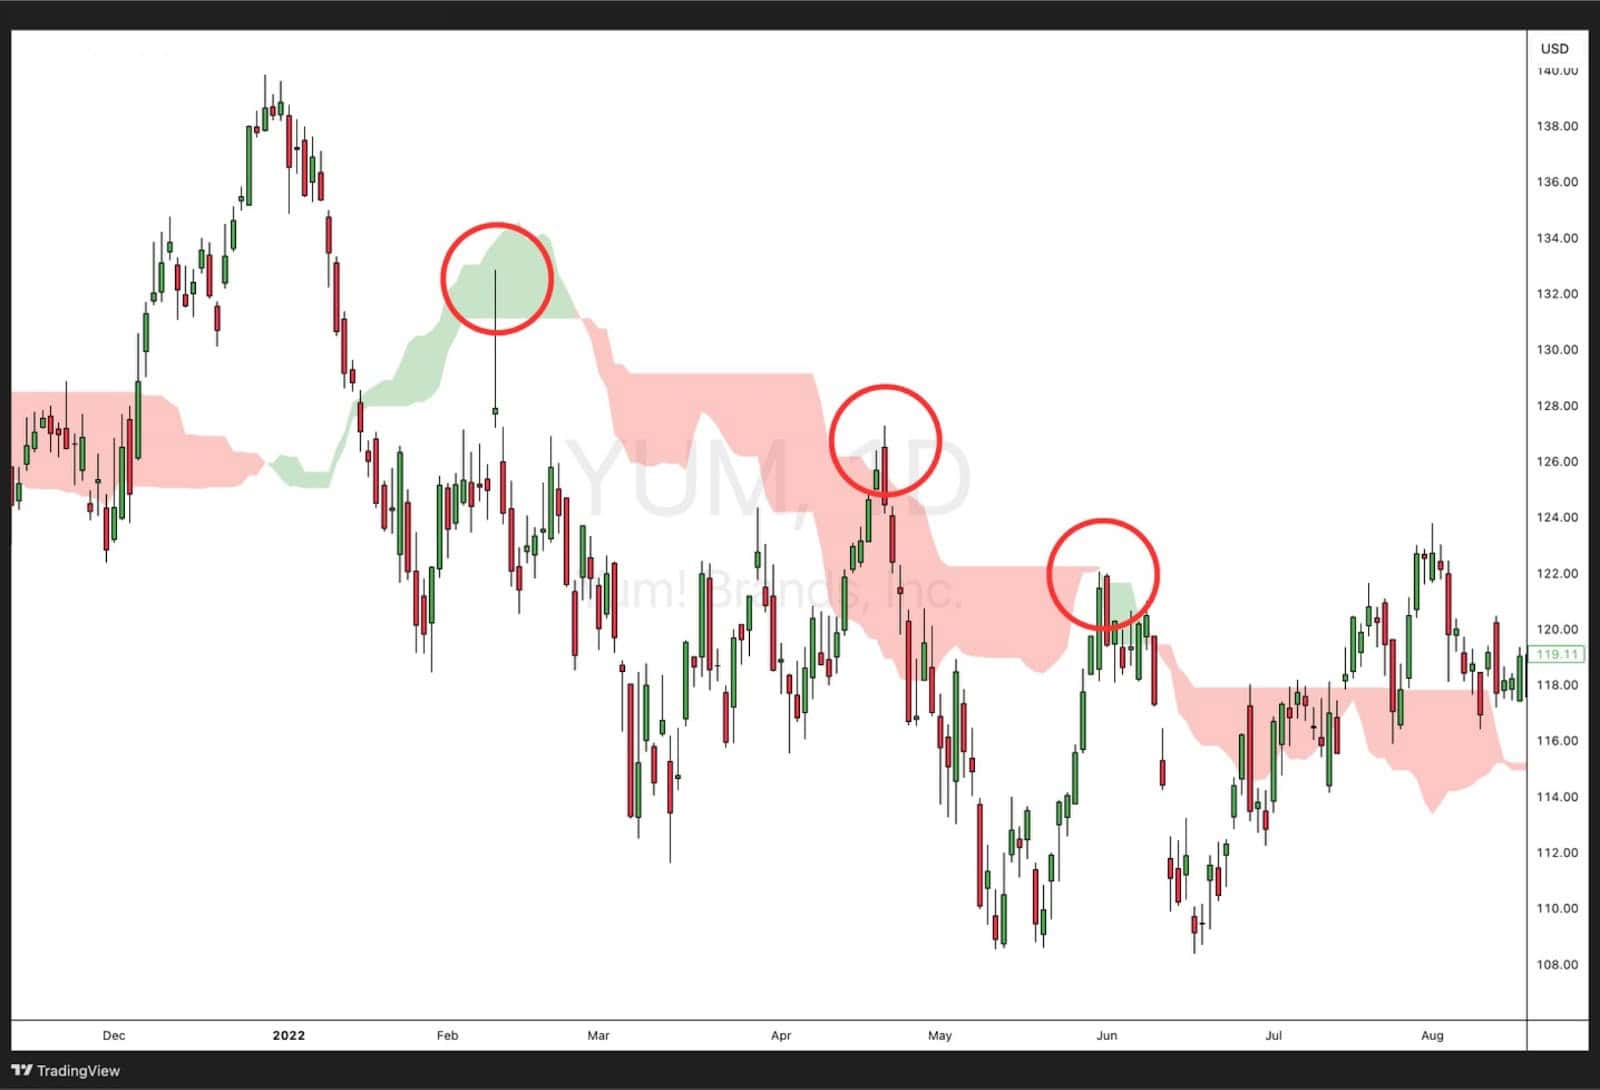
What’s it about?
A multi-component indicator that provides support and resistance levels along with trend direction and momentum.
How to use Ichimoku Cloud as a Support and Resistance Indicator
- Kumo Cloud as Support/Resistance: Price inside the cloud signals consolidation, while above it is bullish and below is bearish.
- Senkou Span A & B Levels: Act as dynamic support and resistance zones.
- Trend Confirmation: A strong move outside the cloud confirms a trend continuation.
19. Parabolic SAR
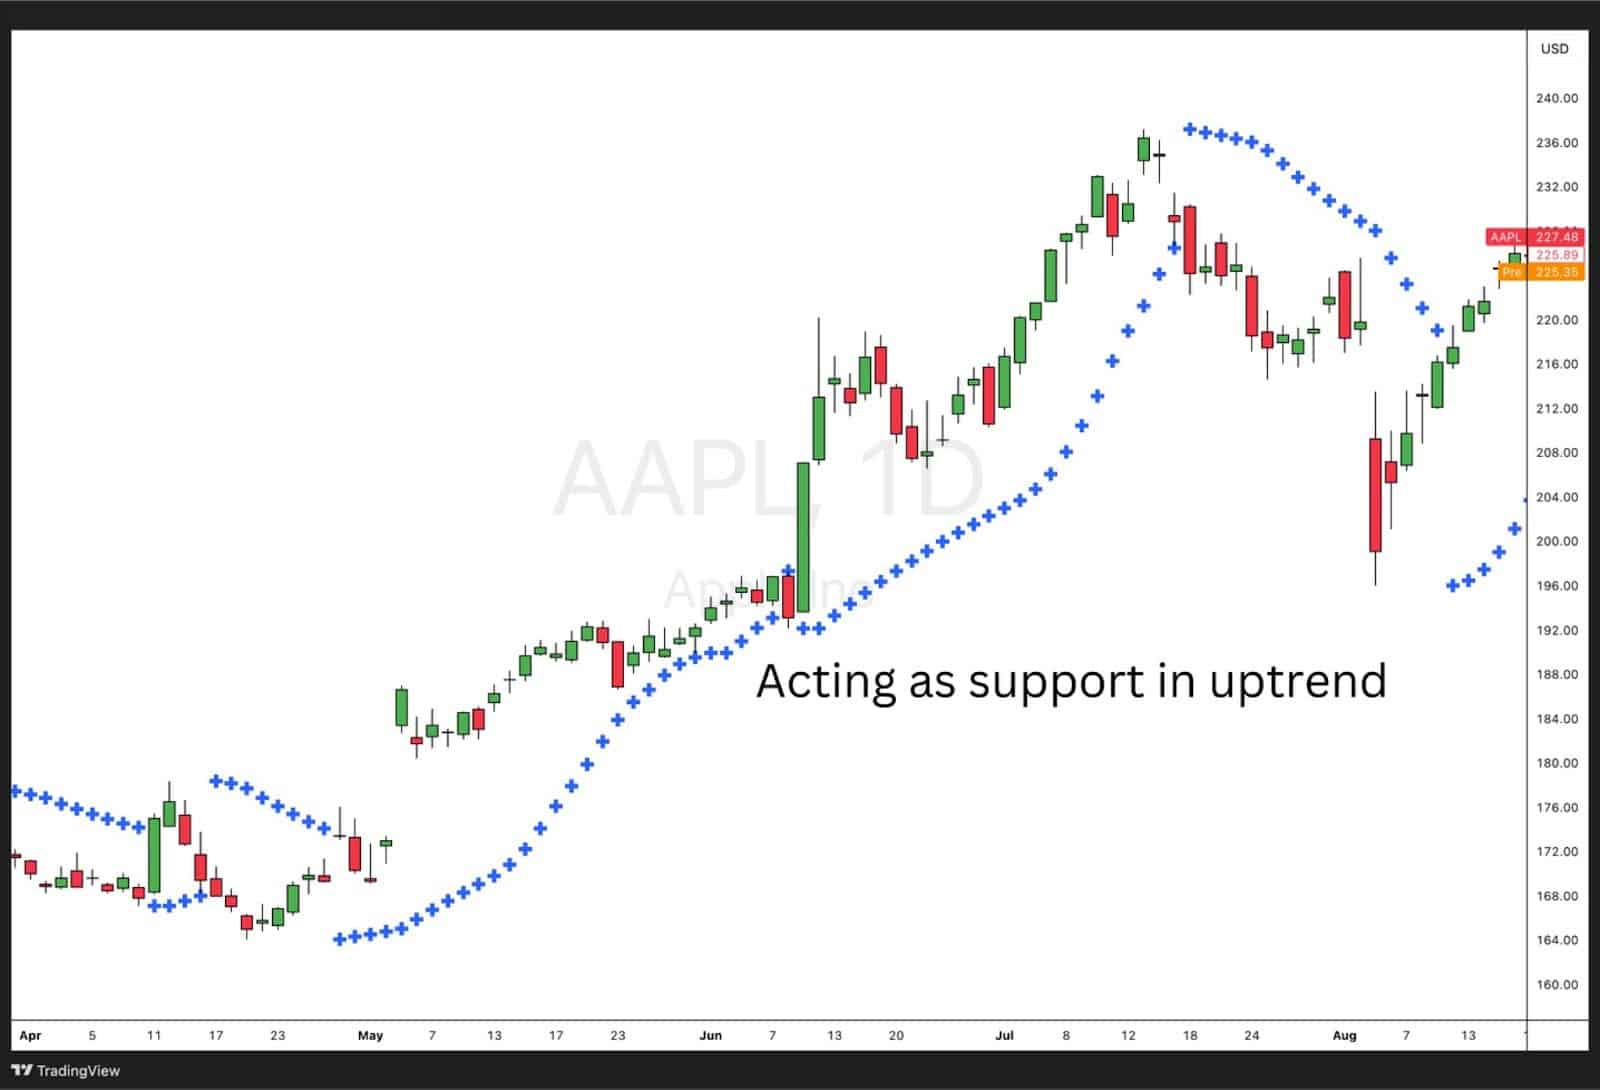
What’s it about?
A trend-following indicator that helps identify potential reversals and trailing stop-loss levels.
How to use Parabolic SAR as a Support and Resistance Indicator
- Dots Below Price = Support: In an uptrend, the SAR dots act as dynamic support.
- Dots Above Price = Resistance: In a downtrend, the dots serve as resistance.
- Trailing Stop-Loss: Traders use SAR dots to adjust stop-loss positions.
20. Volume Weighted Average Price (VWAP)
VWAP (Volume Weighted Average Price) is not just a measure of the average price based on both volume and price — it’s also a powerful dynamic support and resistance indicator used by institutional and retail traders alike.
VWAP as Intraday Support and Resistance
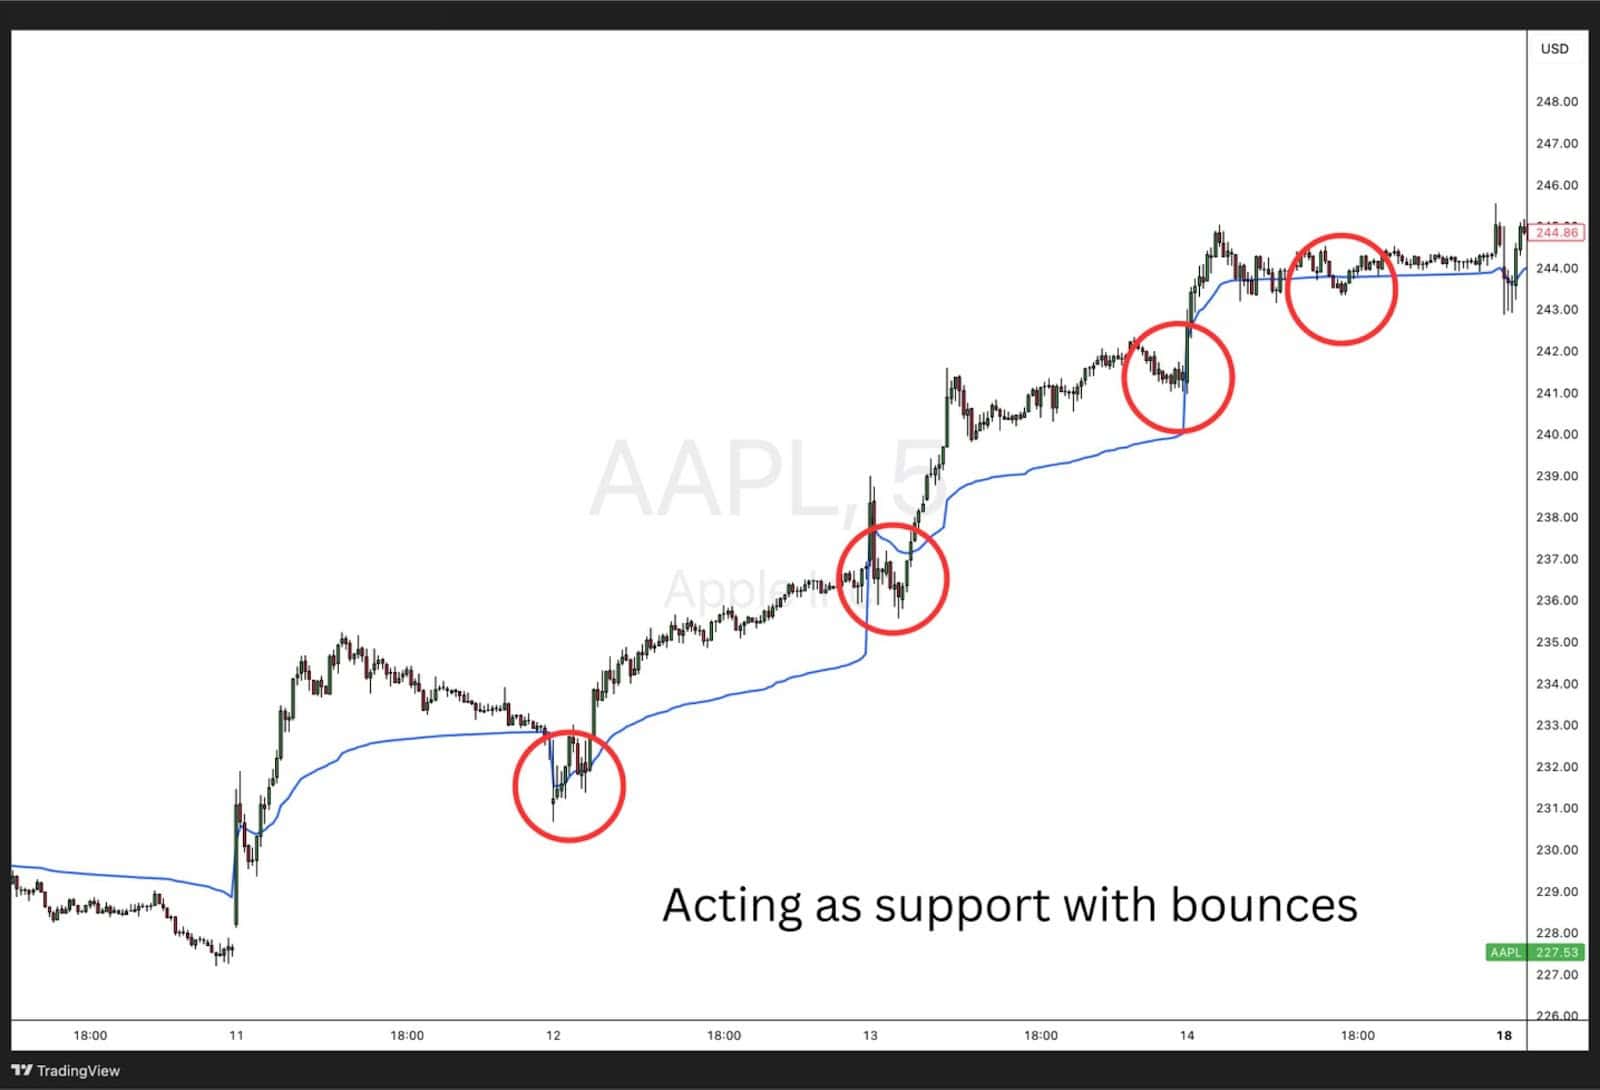
- Regular VWAP: On intraday charts, the regular VWAP line is recalculated at the start of each trading session.
- When the price is above VWAP, the line tends to act as support, signaling that the market sentiment is bullish.
- Conversely, when the price is below VWAP, it often acts as resistance, reflecting bearish pressure.
- Traders frequently use the regular VWAP to identify optimal entry and exit zones during the trading day, especially in high-volume assets.
Anchored VWAP for Key Market Levels
Anchored VWAP (AVWAP) allows traders to “anchor” the VWAP calculation to a specific point in time — such as a major news event, earnings report, or a significant swing high/low.
This version of VWAP helps visualize how the average participant’s cost basis evolves from a critical moment, making it valuable for spotting longer-term support and resistance levels.
Institutional traders often anchor VWAP to major reversal points to understand where large participants entered the market and how price is reacting relative to that cost basis.
Trend Confirmation and Mean Reversion
- Trend Confirmation:
- Staying above the VWAP (regular or anchored) indicates sustained buying strength and bullish momentum.
- Staying below VWAP reflects selling pressure and bearish control.
- Mean Reversion Strategy:
- Since price tends to revert to VWAP over time, both regular and anchored VWAP act as strong reference points for trade entries and exits.
- Traders can anticipate potential reversions to VWAP during overextended moves, using it to manage risk and take profit efficiently.
Advantages of Using Support and Resistance Indicators in Trading
- Improves Trade Timing – Helps traders identify optimal entry and exit points.
- Works Across Different Markets – Can be used for stocks, forex, crypto, and commodities.
- Enhances Risk Management – Provides levels for stop-loss and take-profit placement.
- Confirms Trends and Reversals – Helps traders determine whether a trend is continuing or weakening.
- Adaptable to Various Strategies – Useful for day trading, swing trading, and long-term investing.
- Combines Well with Other Indicators – Works alongside moving averages, RSI, MACD, and Fibonacci tools.
Disadvantages of Using Support and Resistance Indicators in Trading
- Not Always Accurate – Price can break through support and resistance unexpectedly.
- Can Be Subjective – Different traders may identify different levels.
- Lagging Nature – Some indicators rely on past price data, making them reactive rather than predictive.
- Prone to False Breakouts – Price may temporarily break support or resistance before reversing.
- Requires Confirmation – Best used with other indicators for stronger signals.
- Market Conditions Affect Reliability – In highly volatile or ranging markets, certain indicators may be less effective.
FAQ
What is the best indicator for resistance and support?
There is no single best indicator, but moving averages, pivot points, Fibonacci retracements, and VWAP are widely used.
How far back should you look for support and resistance?
It depends on your trading style; intraday traders may look at a few days to weeks, while swing and long-term traders may analyse months or years.
How do you make a support and resistance indicator?
You can create one by coding a custom script using trading platforms like MetaTrader, TradingView, or NinjaTrader, based on historical price levels and volume.
What are the Support and Resistance indicators in MT4?
MT4 includes built-in tools like moving averages, pivot points, Fibonacci levels, and custom support and resistance indicators available for download.


