


Written by:

Reviewed by:

- May 1, 2026
- 24 min read
Position Trading Explained With Examples
Sometimes the best move in trading is simply to zoom out.
While short-term traders focus on every small fluctuation, position traders step back and look at the bigger picture. They focus on trends that can last for months or even years.
The goal is not to catch every small move, but to capture the major trend once it begins.
In this guide, you will learn what position trading is, how traders identify long-term trends, which strategies are commonly used, and how position trading compares with other trading styles.
What is Position Trading?
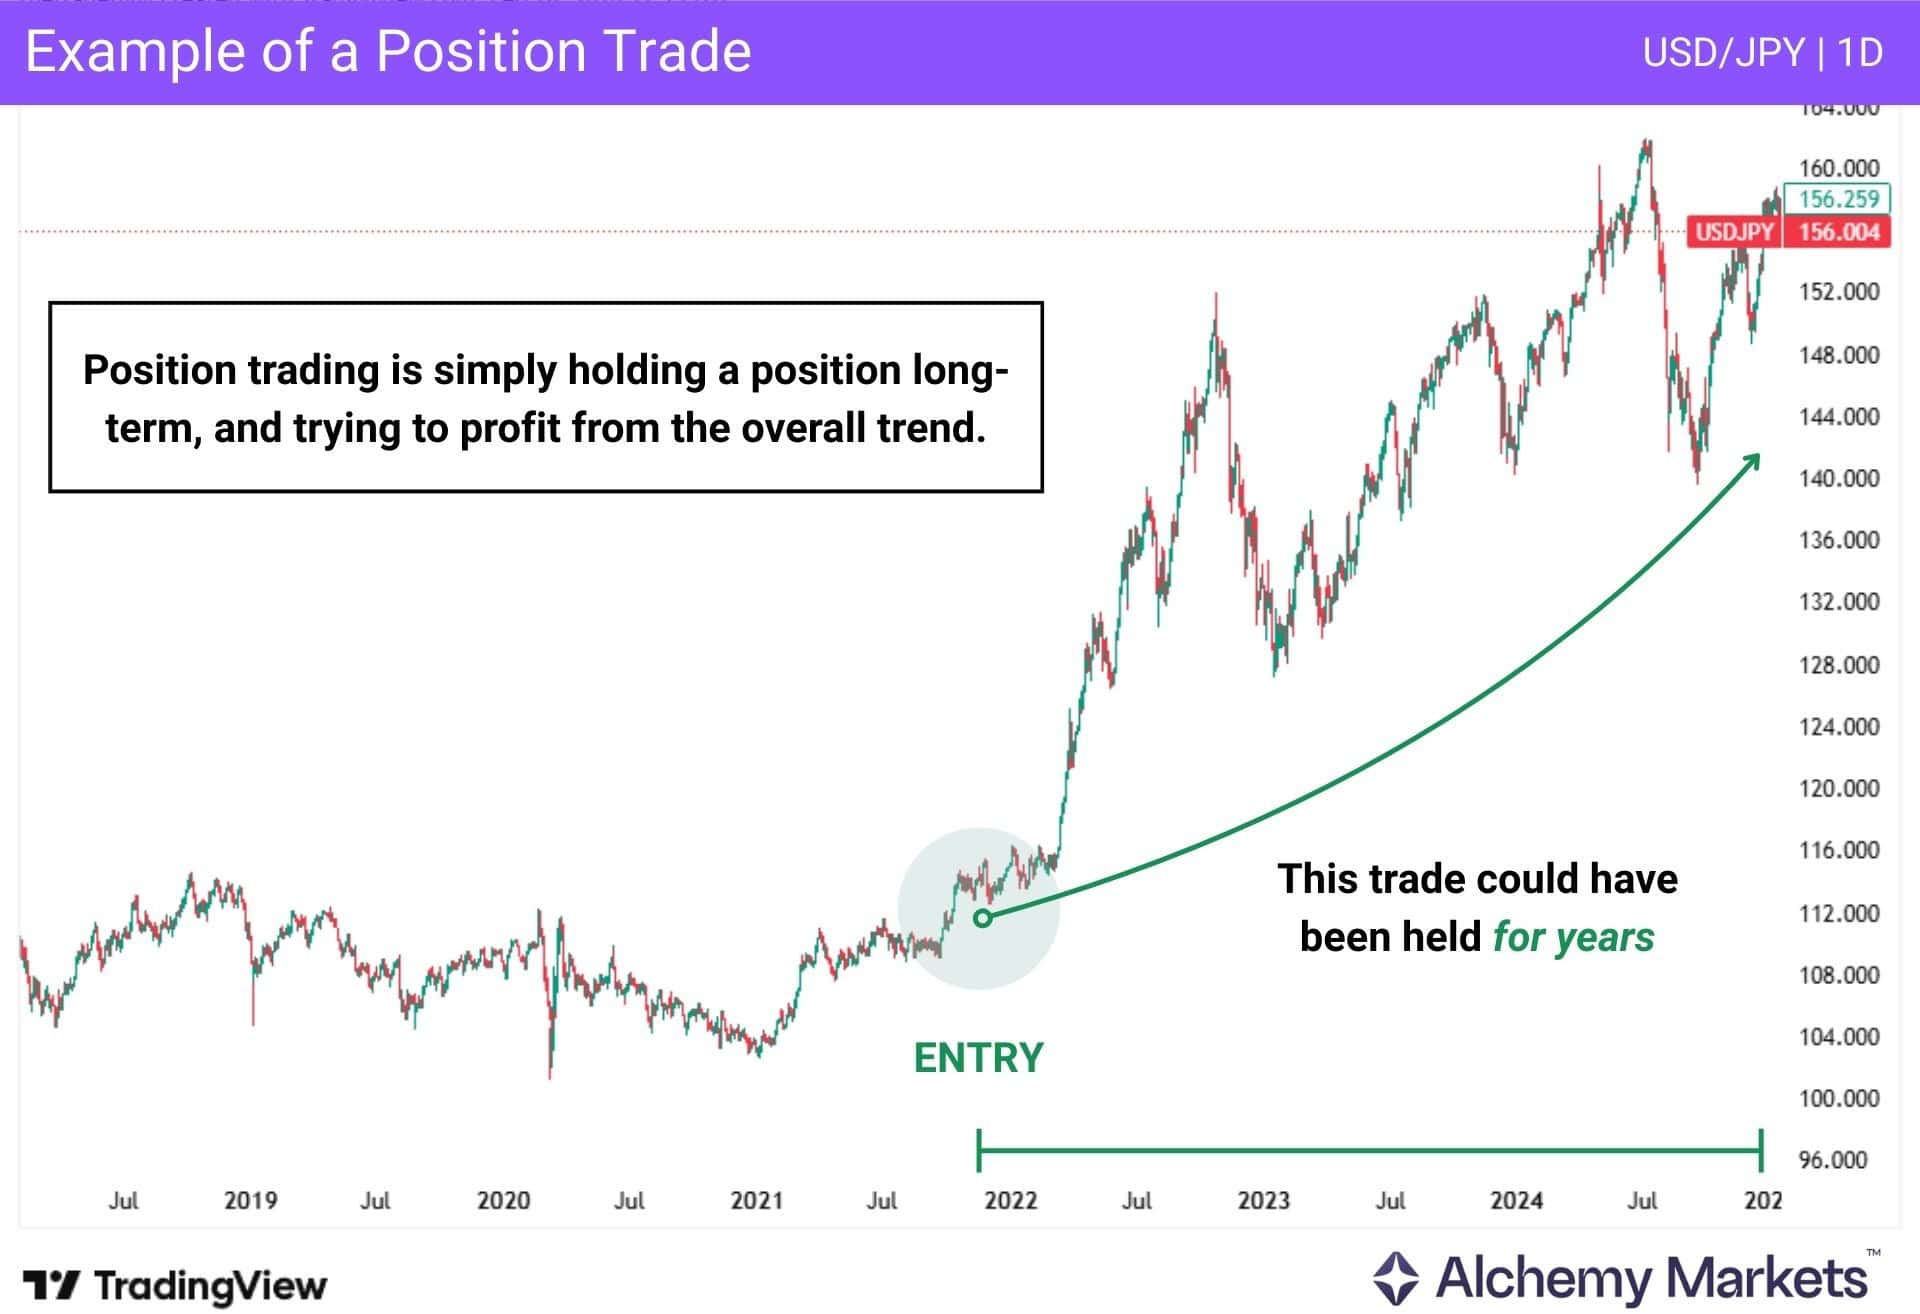
Position trading is the act of focusing on longer-term moves, often resulting in less frequent trades. While the position trader will do less trading, the idea is that they are trying to follow the broader market trends that can result in long-term growth.
The idea is to catch the “big moves”, and stay in them for months or even years.
What Is a Position Trader?
Position traders are traders that buy investments expecting long-term growth, often holding them for an extended period of time.
This is stark contrast to day traders who will act on short-term market movement, as position traders look for market trends that will continue over time. Position traders have fewer trades, making it necessary for them to pay attention to broader market trends.
All of this is true, regardless of the market, be it Forex, commodities, stocks, or any other.
How Does Position Trading Work?
Position traders will look for the longer-term trends that show the most strength.
They will often look for trends in booming sectors.
An example would be artificial intelligence in 2025, or crypto markets before that. Position traders look for a strong entry point into the market, using technical and fundamental analysis to get involved.
They often hold the position for months or years, and then attempt to exit the market in a strategic manner, when it shows signs of exhaustion, or the fundamental drivers change.
How to Identify Positions?
There are an almost limitless amount of ways for position traders to get involved in a position.
They can use both technical and fundamental analysis, which makes the idea of position trading more of an “art” rather than a trading method with set in stone rules. The real discerning factor is if the position is one the trader is planning on holding for some time.
Some of the most common ways to identify a position trading opportunity:
Moving averages
- Moving averages are often used to identify long-term trends, making them a useful tool for position traders. If the price is above a moving average the market is generally considered bullish, and if it is below it is considered bearish.
- On higher timeframes like the daily or weekly chart, position traders often use the 50 MA or 200 MA to get a broad term view of the market’s direction.
- These averages can also act as dynamic support or resistance, where price may pull back before continuing the trend.
Trendlines
- One of the most common ways to be used by long term traders will be using simple trend lines. The trendline is a straight line drawn on the chart by connecting a series of higher lows for an uptrend, and lower highs for a downtrend. They are a visual representation where buying and selling could happen.
Support and Resistance
- These are price levels where buying or selling pressure have been observed in the past, can be used by some position traders to identify the direction of the long term move, and where to place stop losses or targets at times.
- Traders will look for breakouts above resistance, or breakdowns below support to enter a position, with a stop loss behind the entry point based on the idea that there is market interest in that area to protect their position.
Interest Rate Differential
- Interest rate differential between two currencies is often used to trade long term positions. For example, “currency A” pays a yield of 5%, while “currency B” pays a yield of 2%. In the FX markets, yield payments are settled at the end of the day, with many brokers adding two extra “days worth” of interest payments to account for Saturday and Sunday.
- This means that you get paid at the end of the day in the currency market to hold the higher yielding currency. For example, it is common for traders who buy a higher yielding currency against the Japanese yen. By collecting interest payments daily, this allows for the trader to gain over the longer-term as long as the trend is agreeable.
Other Fundamental Factors
- There are almost unlimited fundamental factors that traders will use as well. Because of this, it takes study of economics to make a trade.
- Some potential positives:
- GDP higher than expected for your currency.
- Earnings come in better than expected for your stock.
- An election win for a pro-business candidate in the country of your index.
- War, in the case of “safe haven assets.”
- Some potential positives:
- Some potential negatives:
- GDP lower than anticipated for your country’s currency.
- Earnings come in lower than thought.
- War, in the case of “Risk On” assets.
- Employment numbers are weaker than expected for your country.
Position Trading Trading Strategies
Position traders can use a variety of strategies to take advantage of long term trends. Generally speaking, most strategies focus on the ability of the trend to continue, and this can make them very valuable strategies, as the trader should find themselves in the position for a longer duration than expected.
The average position trader will use both technical and fundamental analysis, but ultimately, they will also use specific indicators, depending on their level of comfort and belief in them.
While there is no “one size fits all” approach, some of the following combinations are popular.
Position Trading with RSI
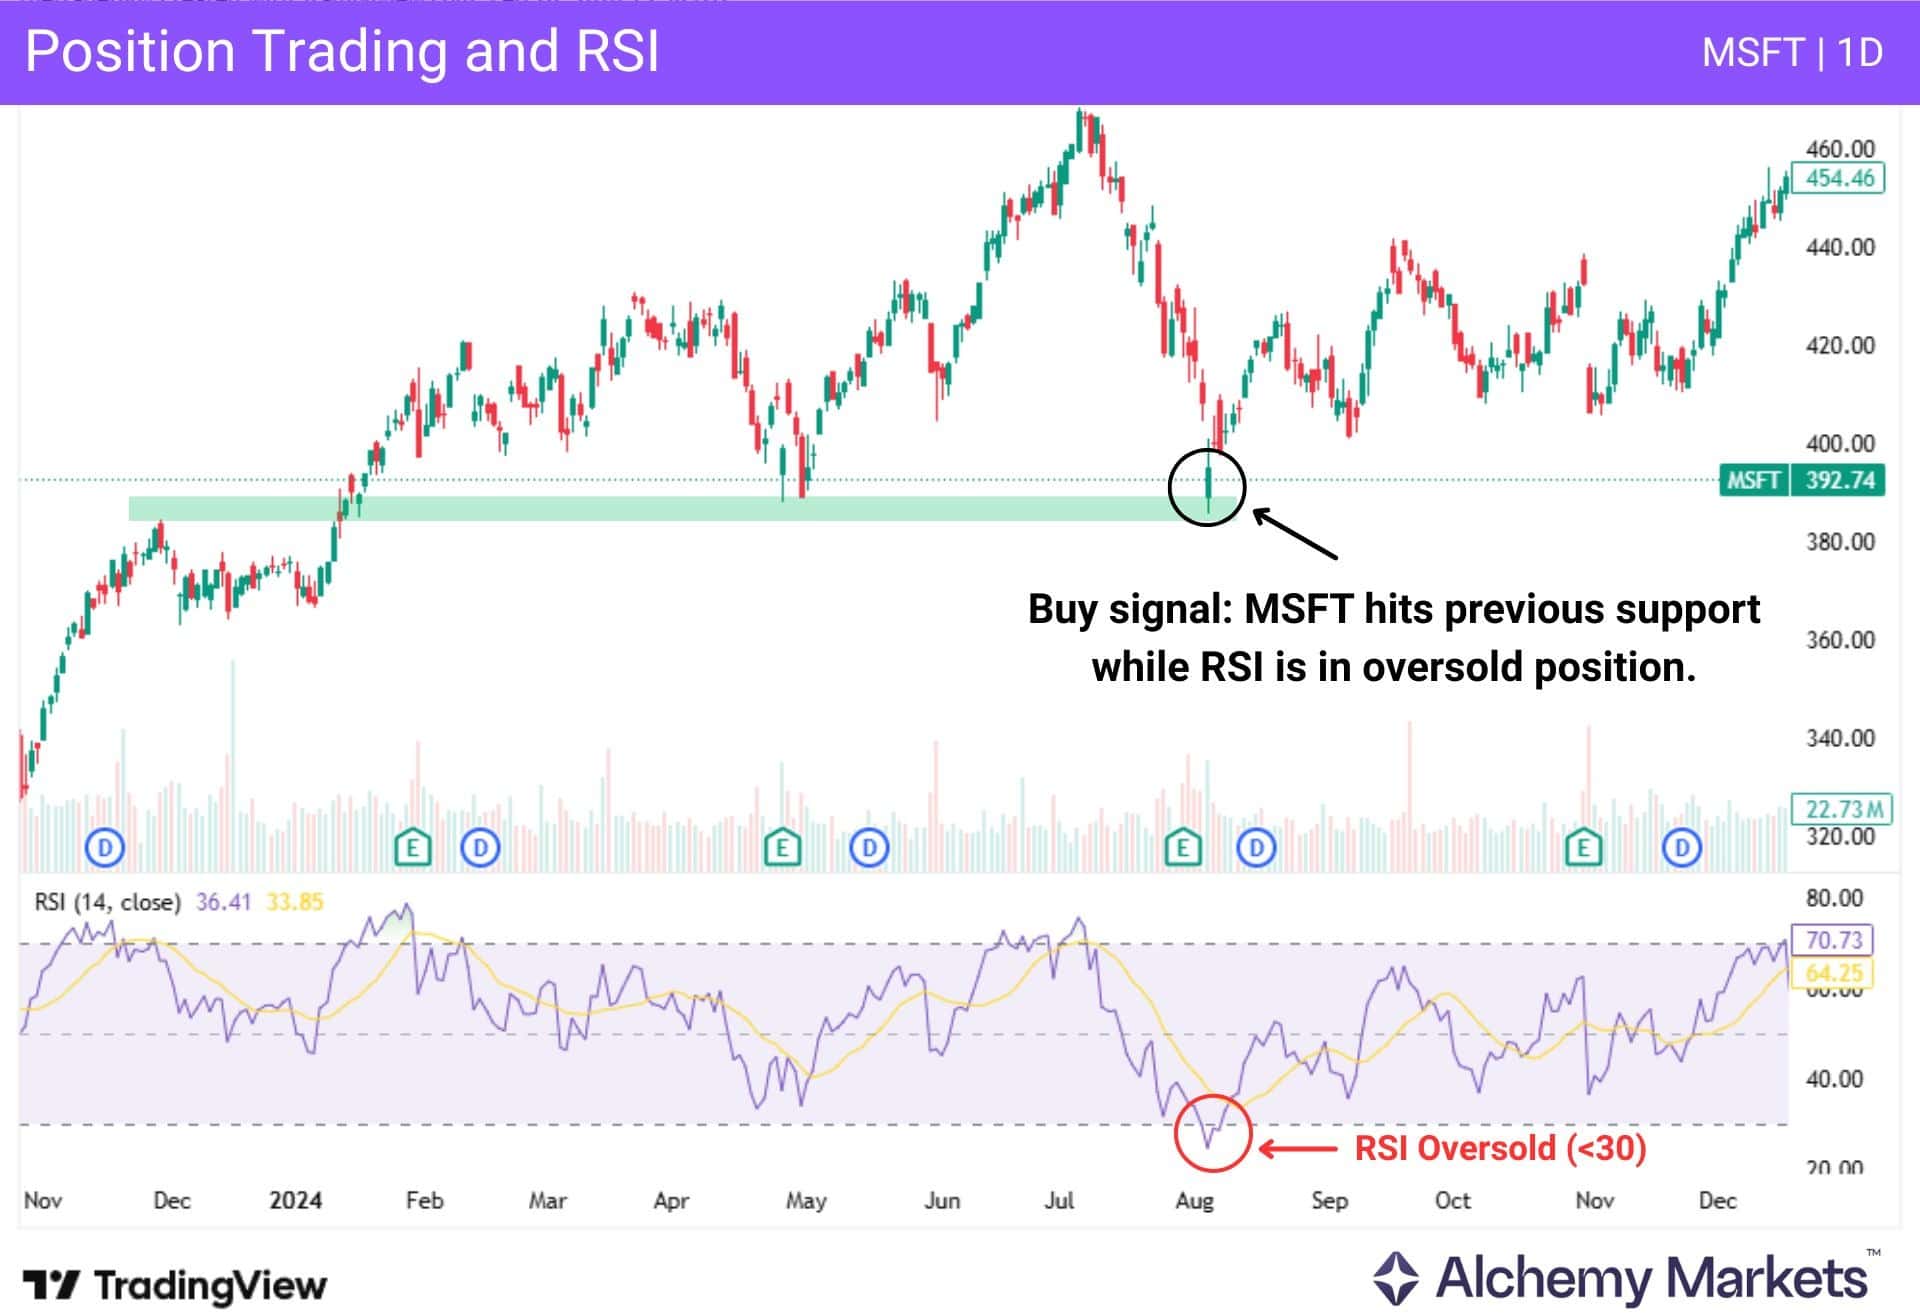
Relative Strength Index, or the RSI, is an indicator that measures the momentum of a market. There are two levels, the 30 and the 70 levels, that represent overbought (70) and oversold (30) conditions.
If a trader sees an area that people could be interested in taking a trade, it is worth looking to see if the RSI is giving you another reason to take the position. For example, in the Microsoft stock chart above, you can see a previous support level holding, while the RSI signalled that the stock was oversold. Together, these two factors create a buy signal for a position trader.
Position Trading with Fibonacci retracement
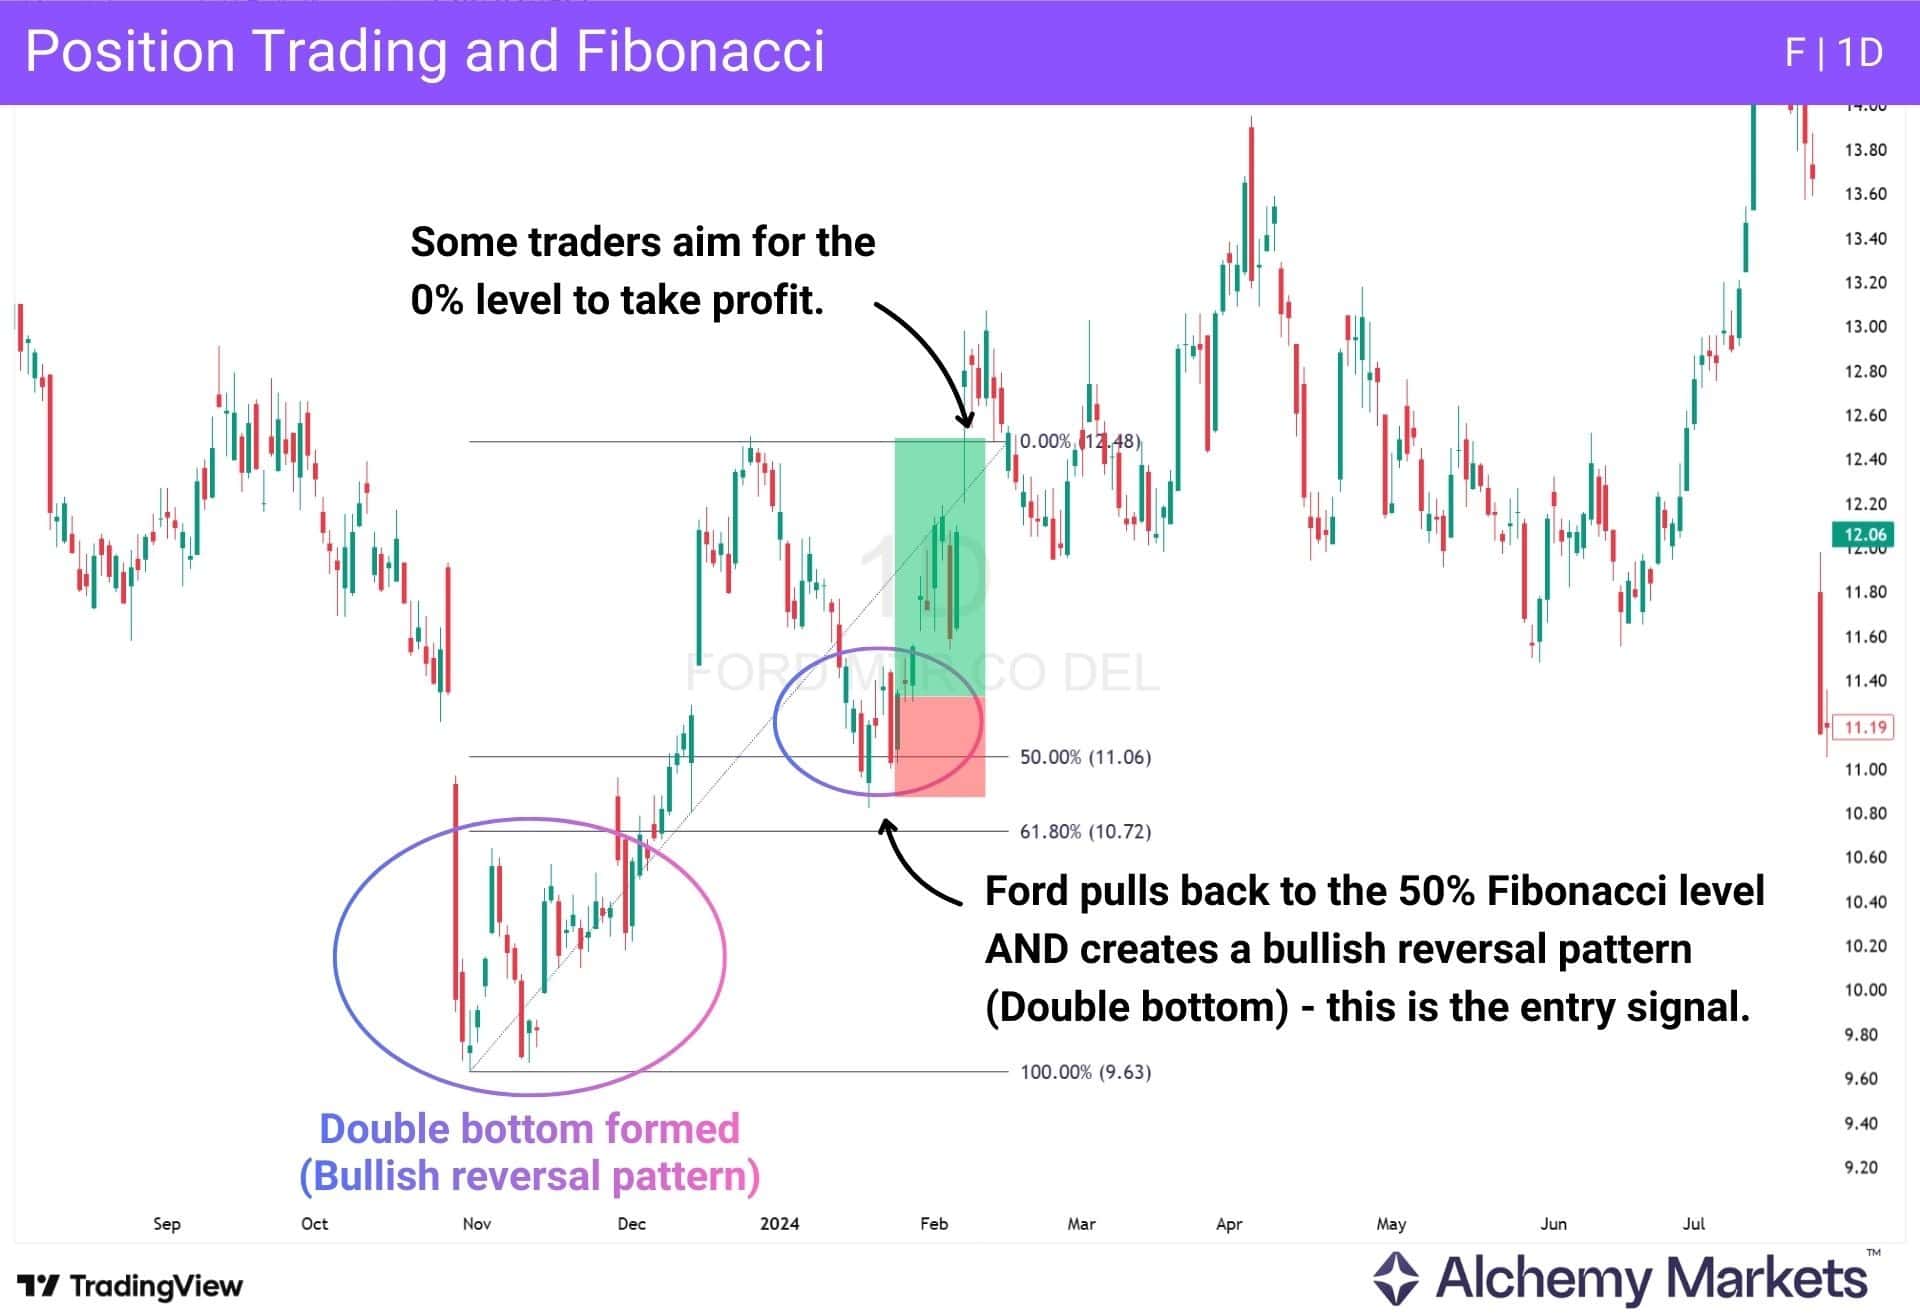
Fibonacci retracements are a mathematical calculation of how things in nature can move or reproduce.
There are a few percentages that are more followed than others, such as the 61.8% retracement of the initial move, the 31.8% level, and ironically – the 50% retracement level, which isn’t actually a true Fibonacci level.
While there are a lot of questions about whether this is something in financial markets that actually works, the reality is that in trading — the Fibonacci can be somewhat of a self-fulfilling prophecy. Many traders believe these levels are of importance, and therefore, they do become important.
Coincidentally, many Fibonacci levels often line up with prior support or resistance, which can strengthen their relevance. As a general rule, Fib levels tend to be more meaningful when they align with these areas. The idea is to stack multiple reasons for a trade rather than relying on a single signal.
Trend Trading Strategy
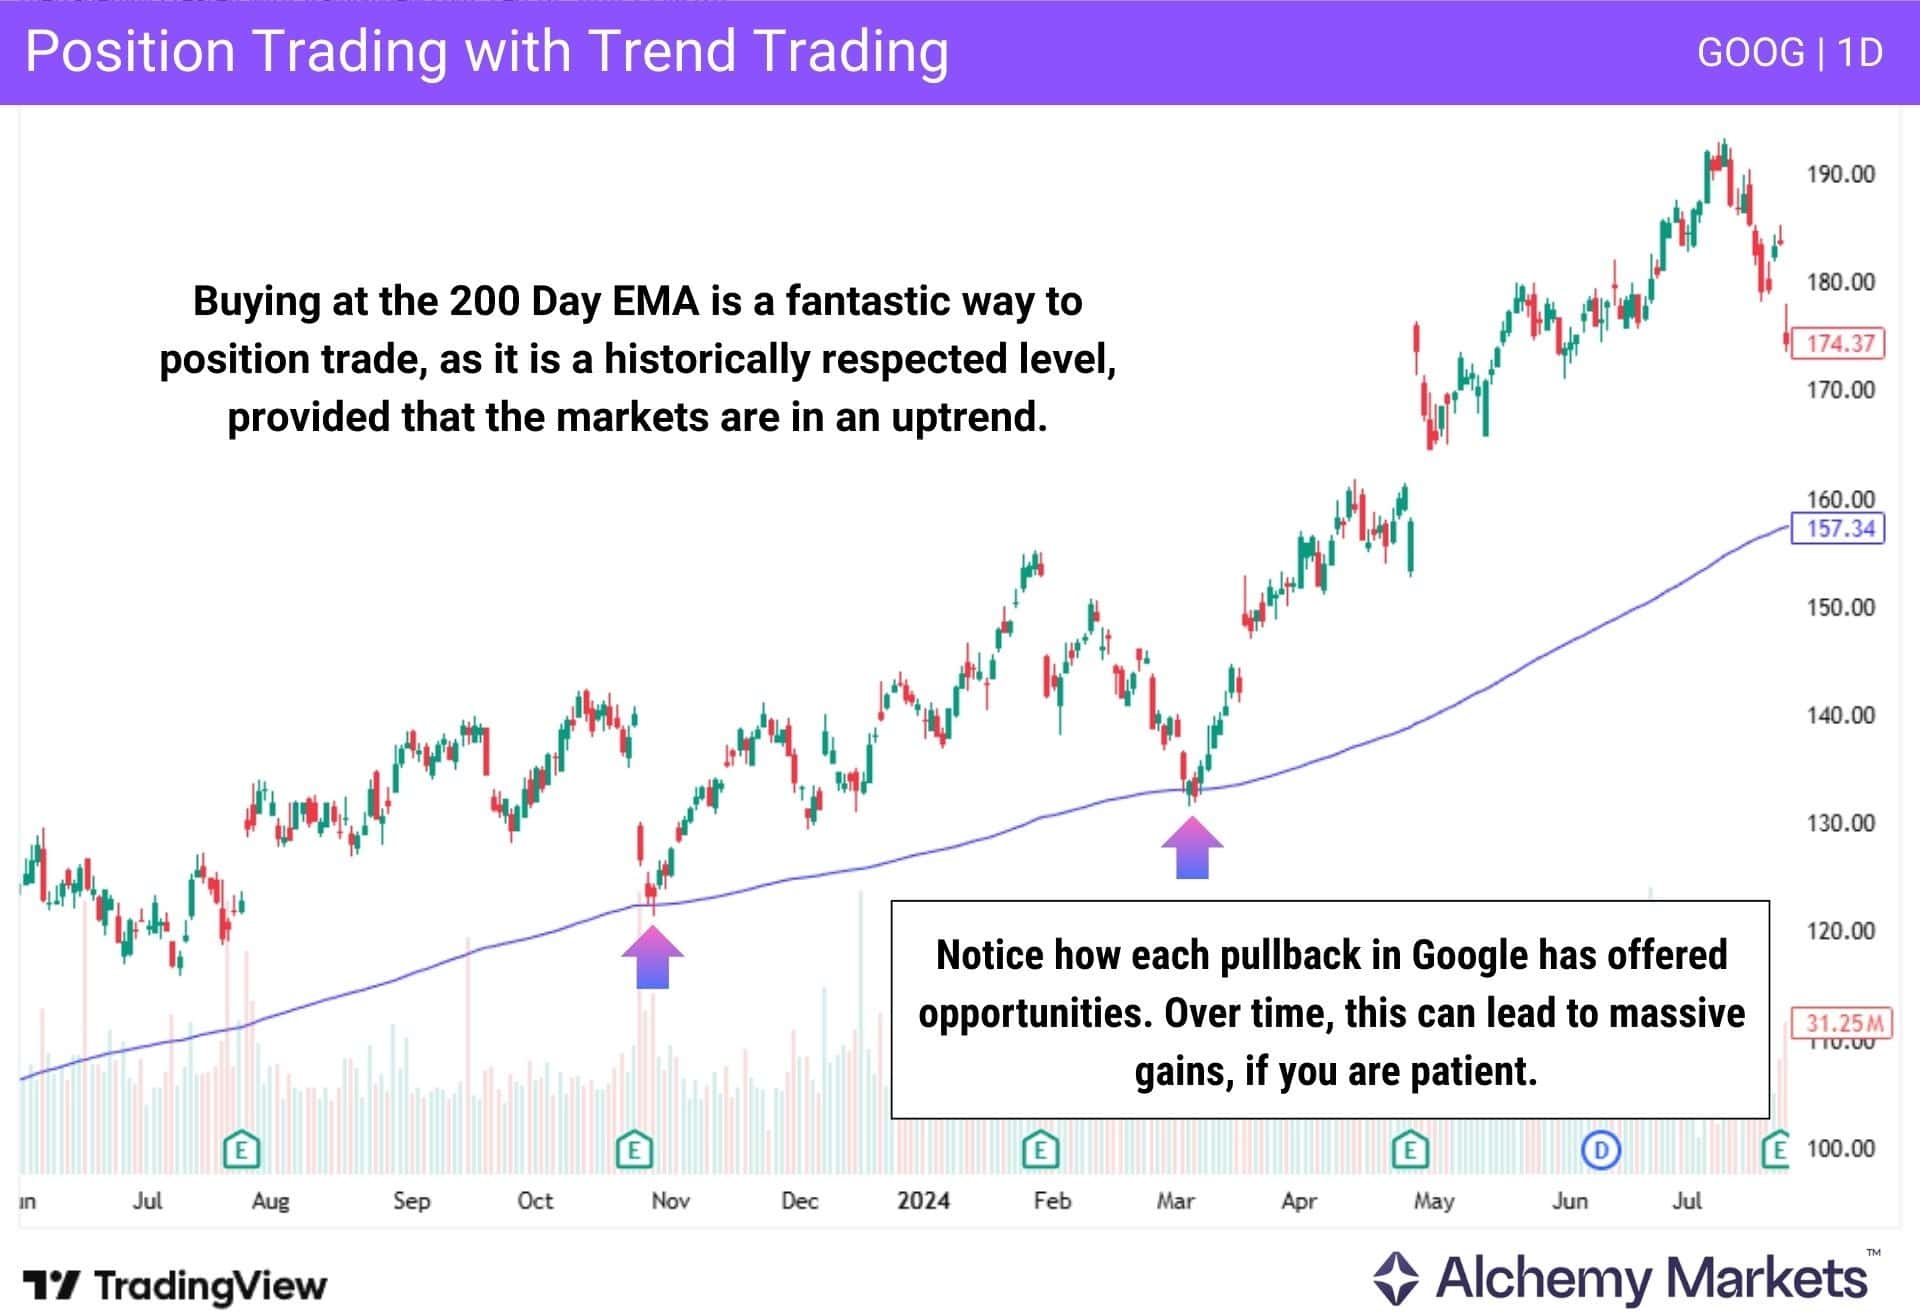
Position trading is more often than not with the overall trend. Trends can be defined by a lot of different factors, but the most obvious and common one is whether or not the market is above or below the 200 day EMA.
In other words, if the market is above the 200 day EMA, then the trader is only looking to buy the market, and vice versa. This kind of position trading demands that you are very patient, and this is something that can be lucrative – if you can hang onto the trade.
Breakout Trading
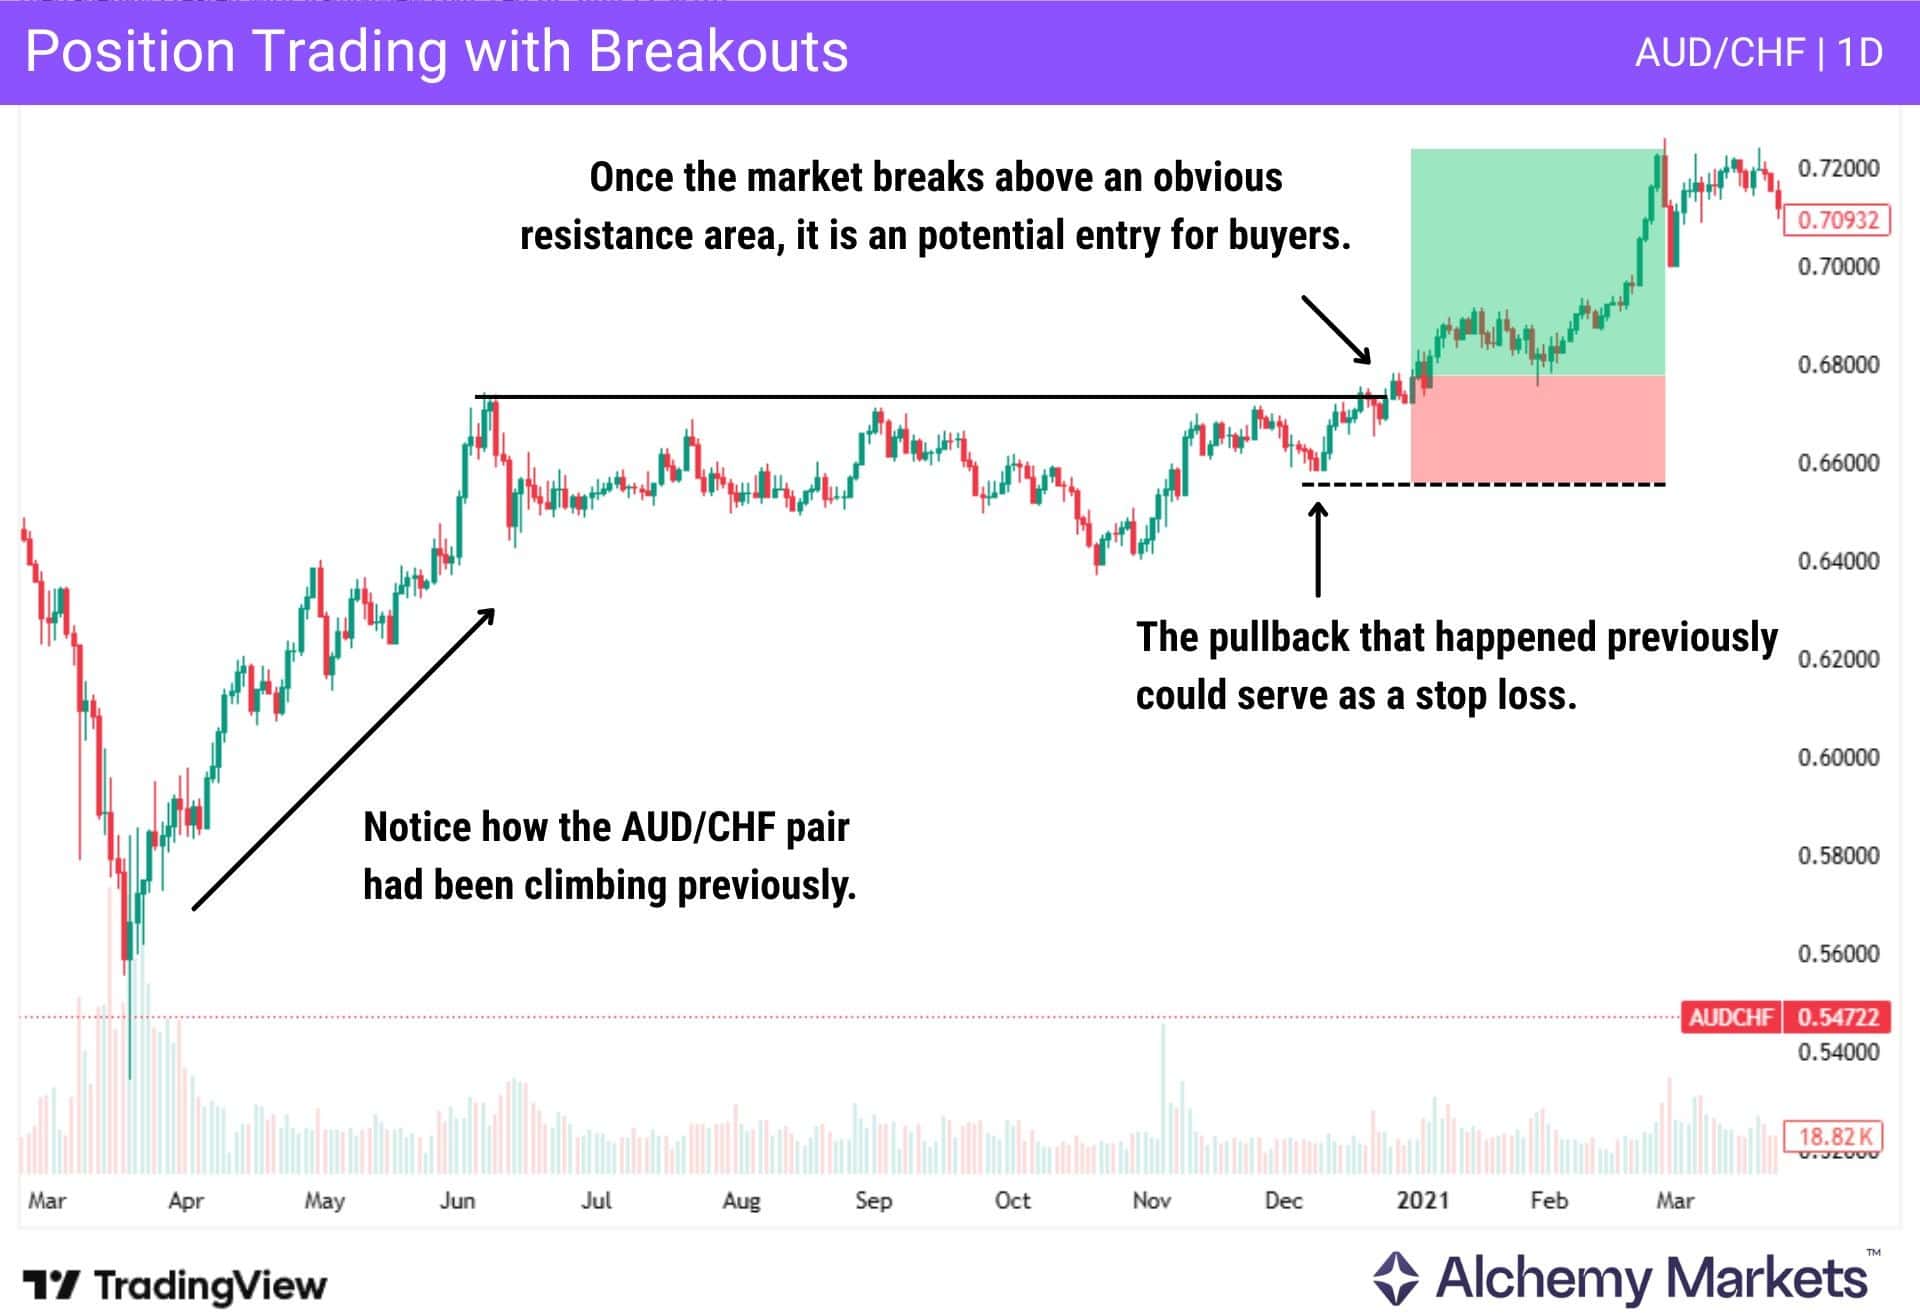
Breakout trading is a common theme in many trading strategies, with position trading being no different. Position traders will potentially look for a break of previously held resistance or support, and then trade in that direction.
Typically, position traders will look at daily timeframes for obvious resistance or support, and trade once they are broken. Often, on the close of the candle for the day.
Position trading by its very nature tends to favor higher time frames, but in theory at least – one could enter from any timeframe. However, it is important to note that higher timeframes will typically be followed by many other people looking to get into position trading set ups.
Pullback Trading
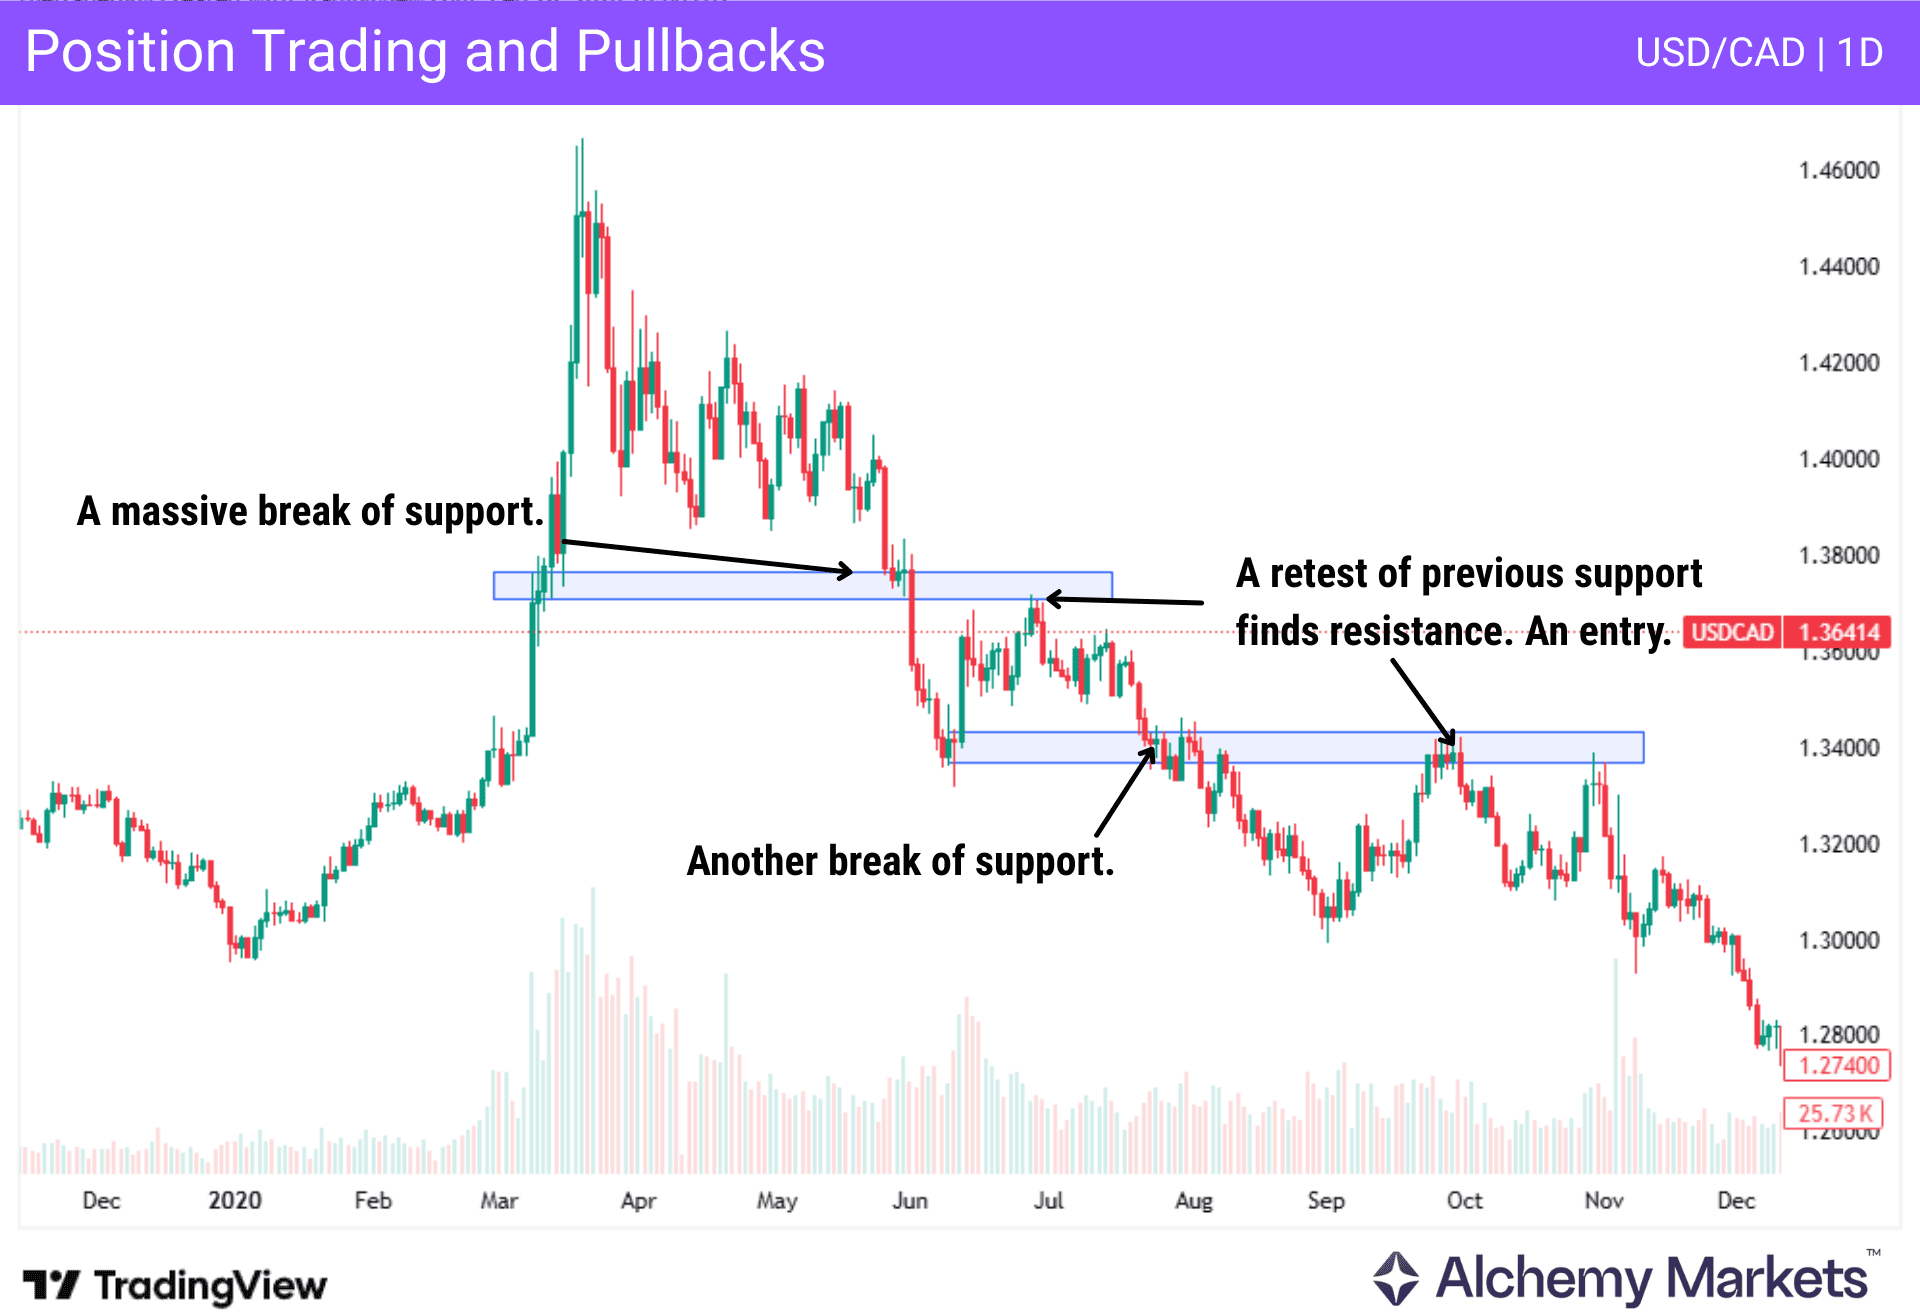
With any move or trend, there will be the occasional pullback, be it an uptrend or downtrend. Typically, this is at a previous level of importance, as there are a lot of trades/orders sitting there to cause potential “market memory.”
By waiting for the market to come back to a previous area of interest, you can find a better entry price. Therefore, at least in theory, you’re able to cut some of your risk.
Once the price of the market reacts to one of these previous areas of interest, a position trader will either enter or add to their existing position.
Range Trading
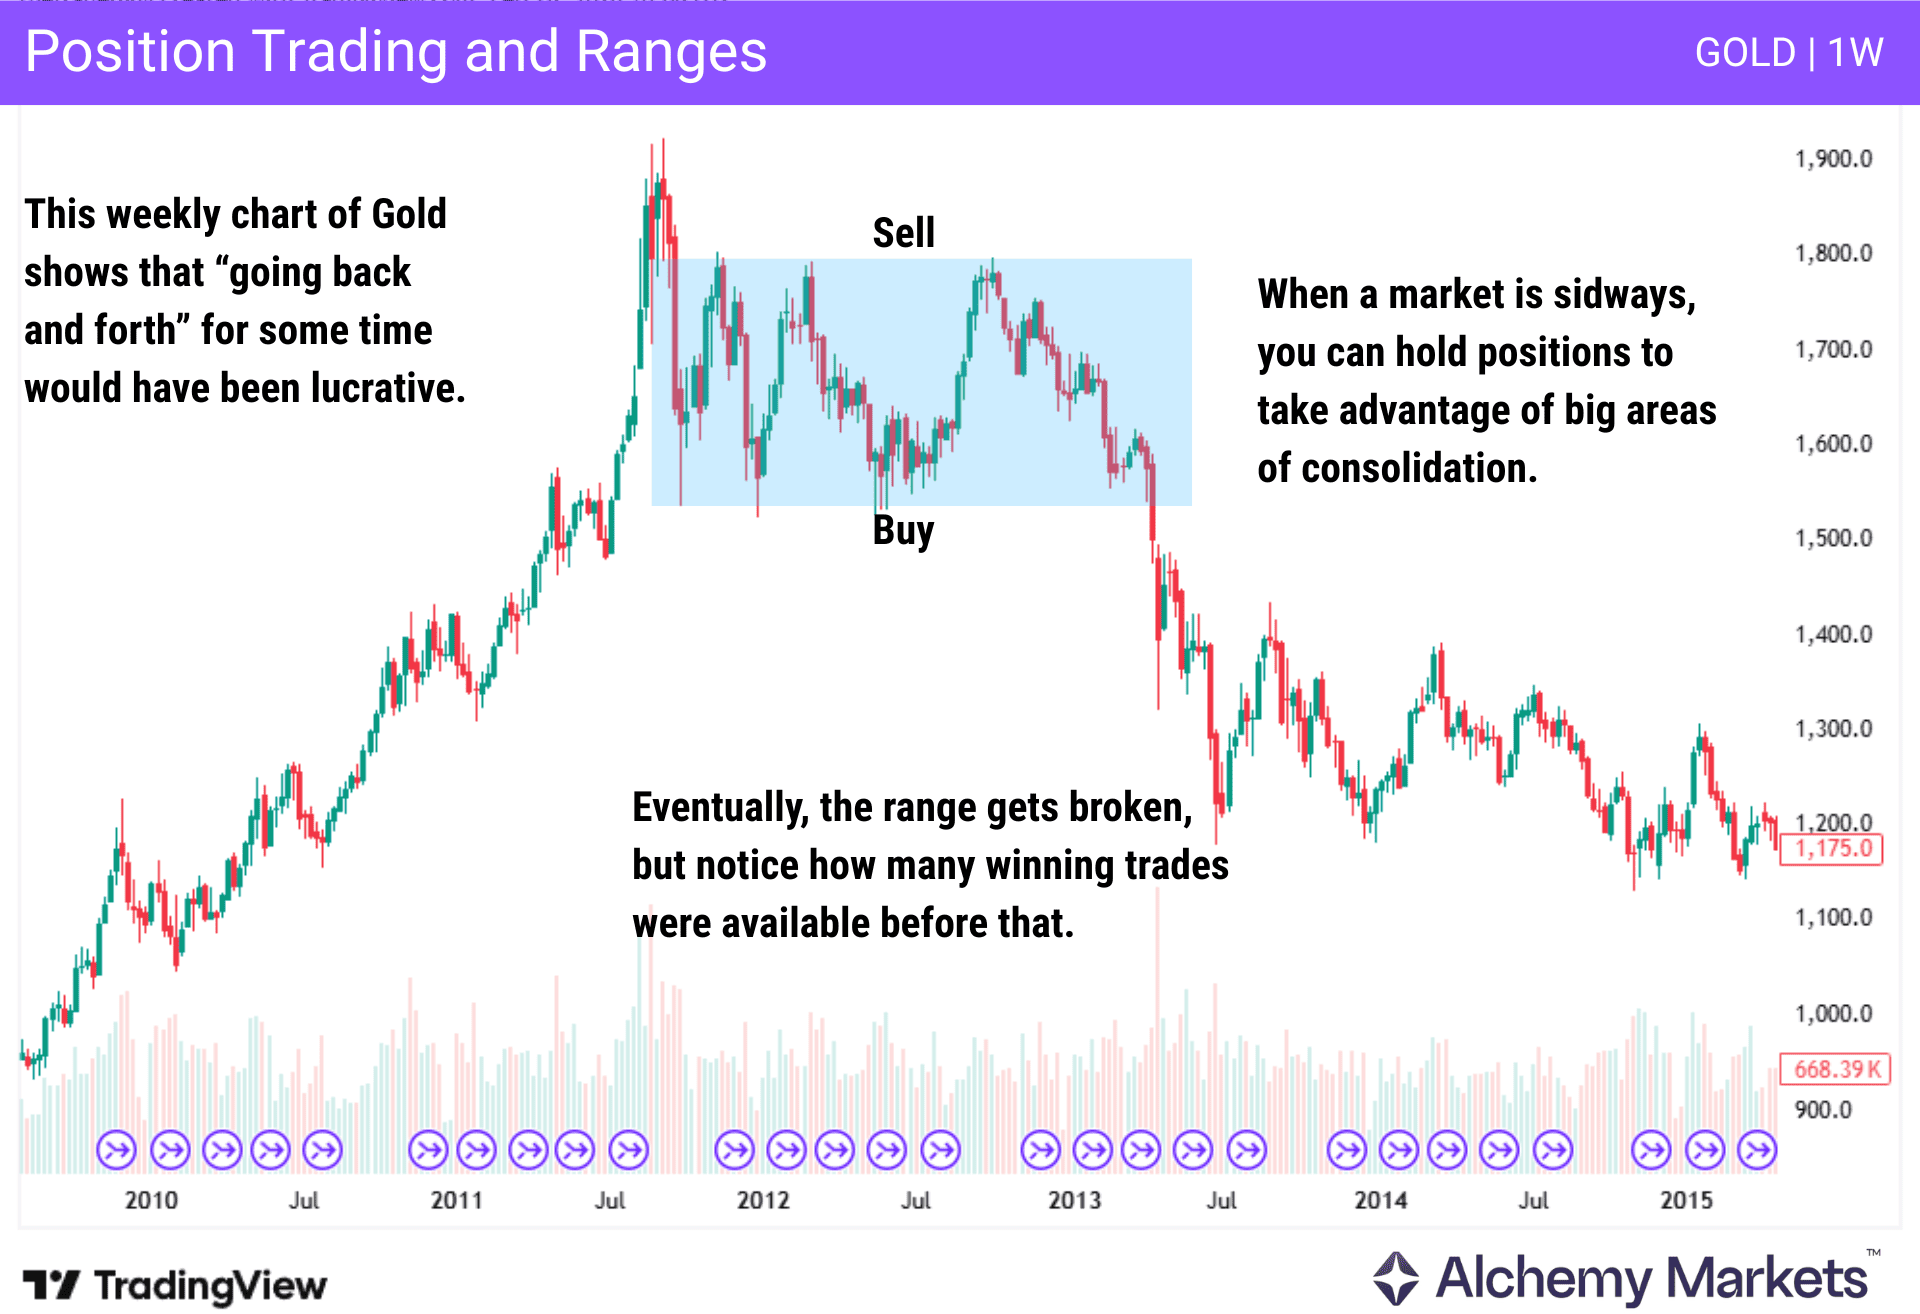
Quite often, markets will move in ranges for a long time. While there are a multitude of indicators that could be used to determine overbought and oversold conditions, the reality is that when markets are in balance, many traders will buy at the bottom, and sell at the top. Sure, eventually this area will be broken, but with a strong range, you can get several winners before you eventually have a losing trade. This is the goal of all trading strategies, to win more than you lose.
There are some studies that suggest markets will trade in a range 80% of the time, so being able to trade in this environment is a big advantage. In the chart above, we have the gold market going sideways for almost two years — this is a weekly chart.
For any position trader looking to range-trade, this was a great opportunity.
Support and Resistance
When someone decides to start position trading, one of the first things that they will pay attention to is support and resistance, or levels where the market sees “push back” against buying or selling.
By navigating entries and potential exits around these levels, position traders can typically stay responsible with risk-management.
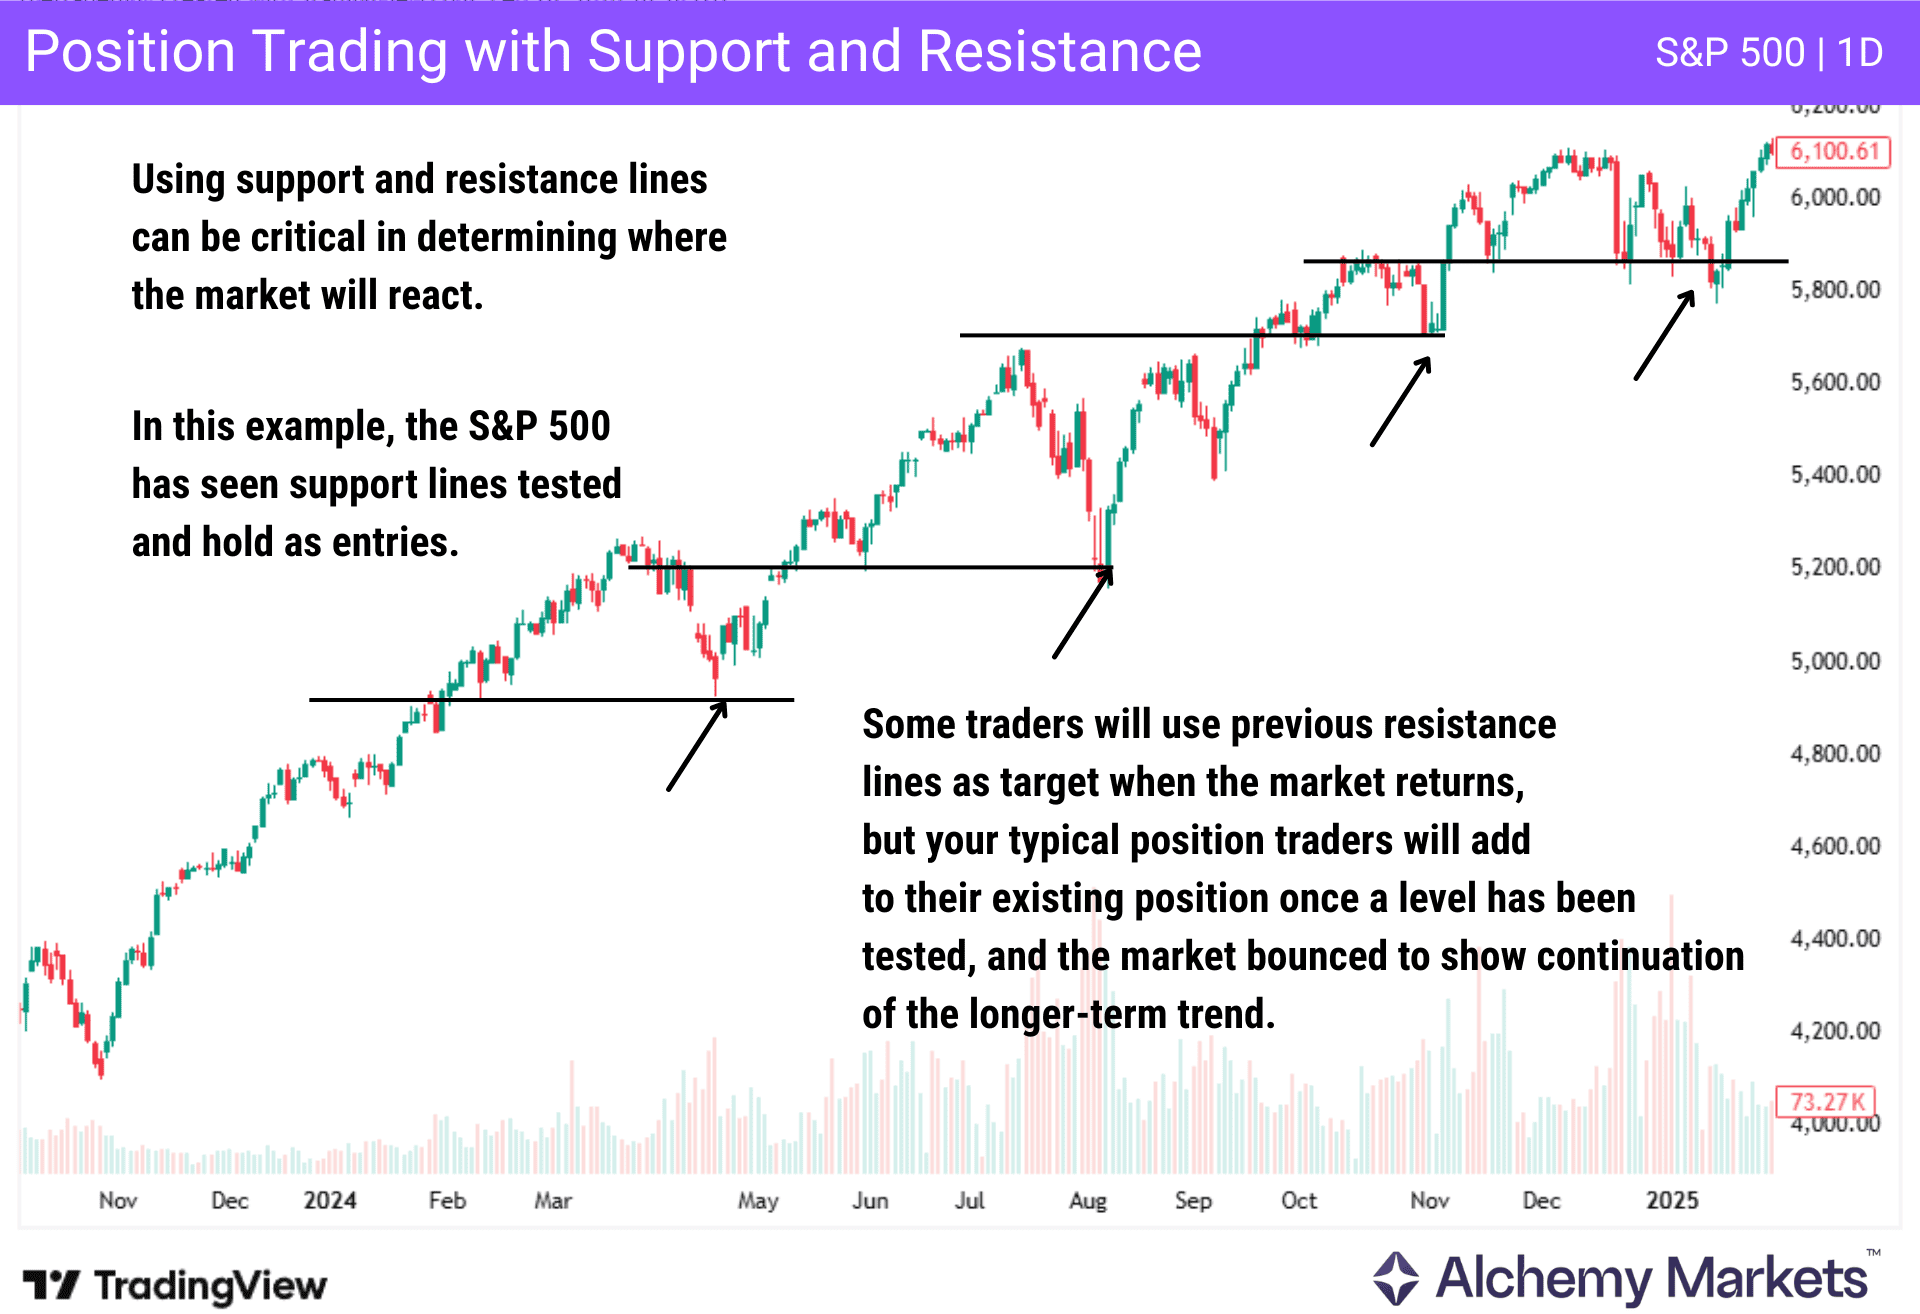
In the example above, the S&P 500 has reacted to every pullback to the previous support level. This is a great example of a strong trend, and is quite typical of a bullish market. The market can bounce from these levels, and if they do – many will add to a “core position” to increase profits. Eventually, support will be broken, and this could be a sign to collect profits.
50-days and 200-days EMA Crossover
The EMA, or exponential moving average, is a calculation of the average price over a set amount of candles. The EMA puts more weight on the later candles, so that it is a bit more sensitive to momentum, and many traders will use these indicators to determine the overall direction or trend of the markets.
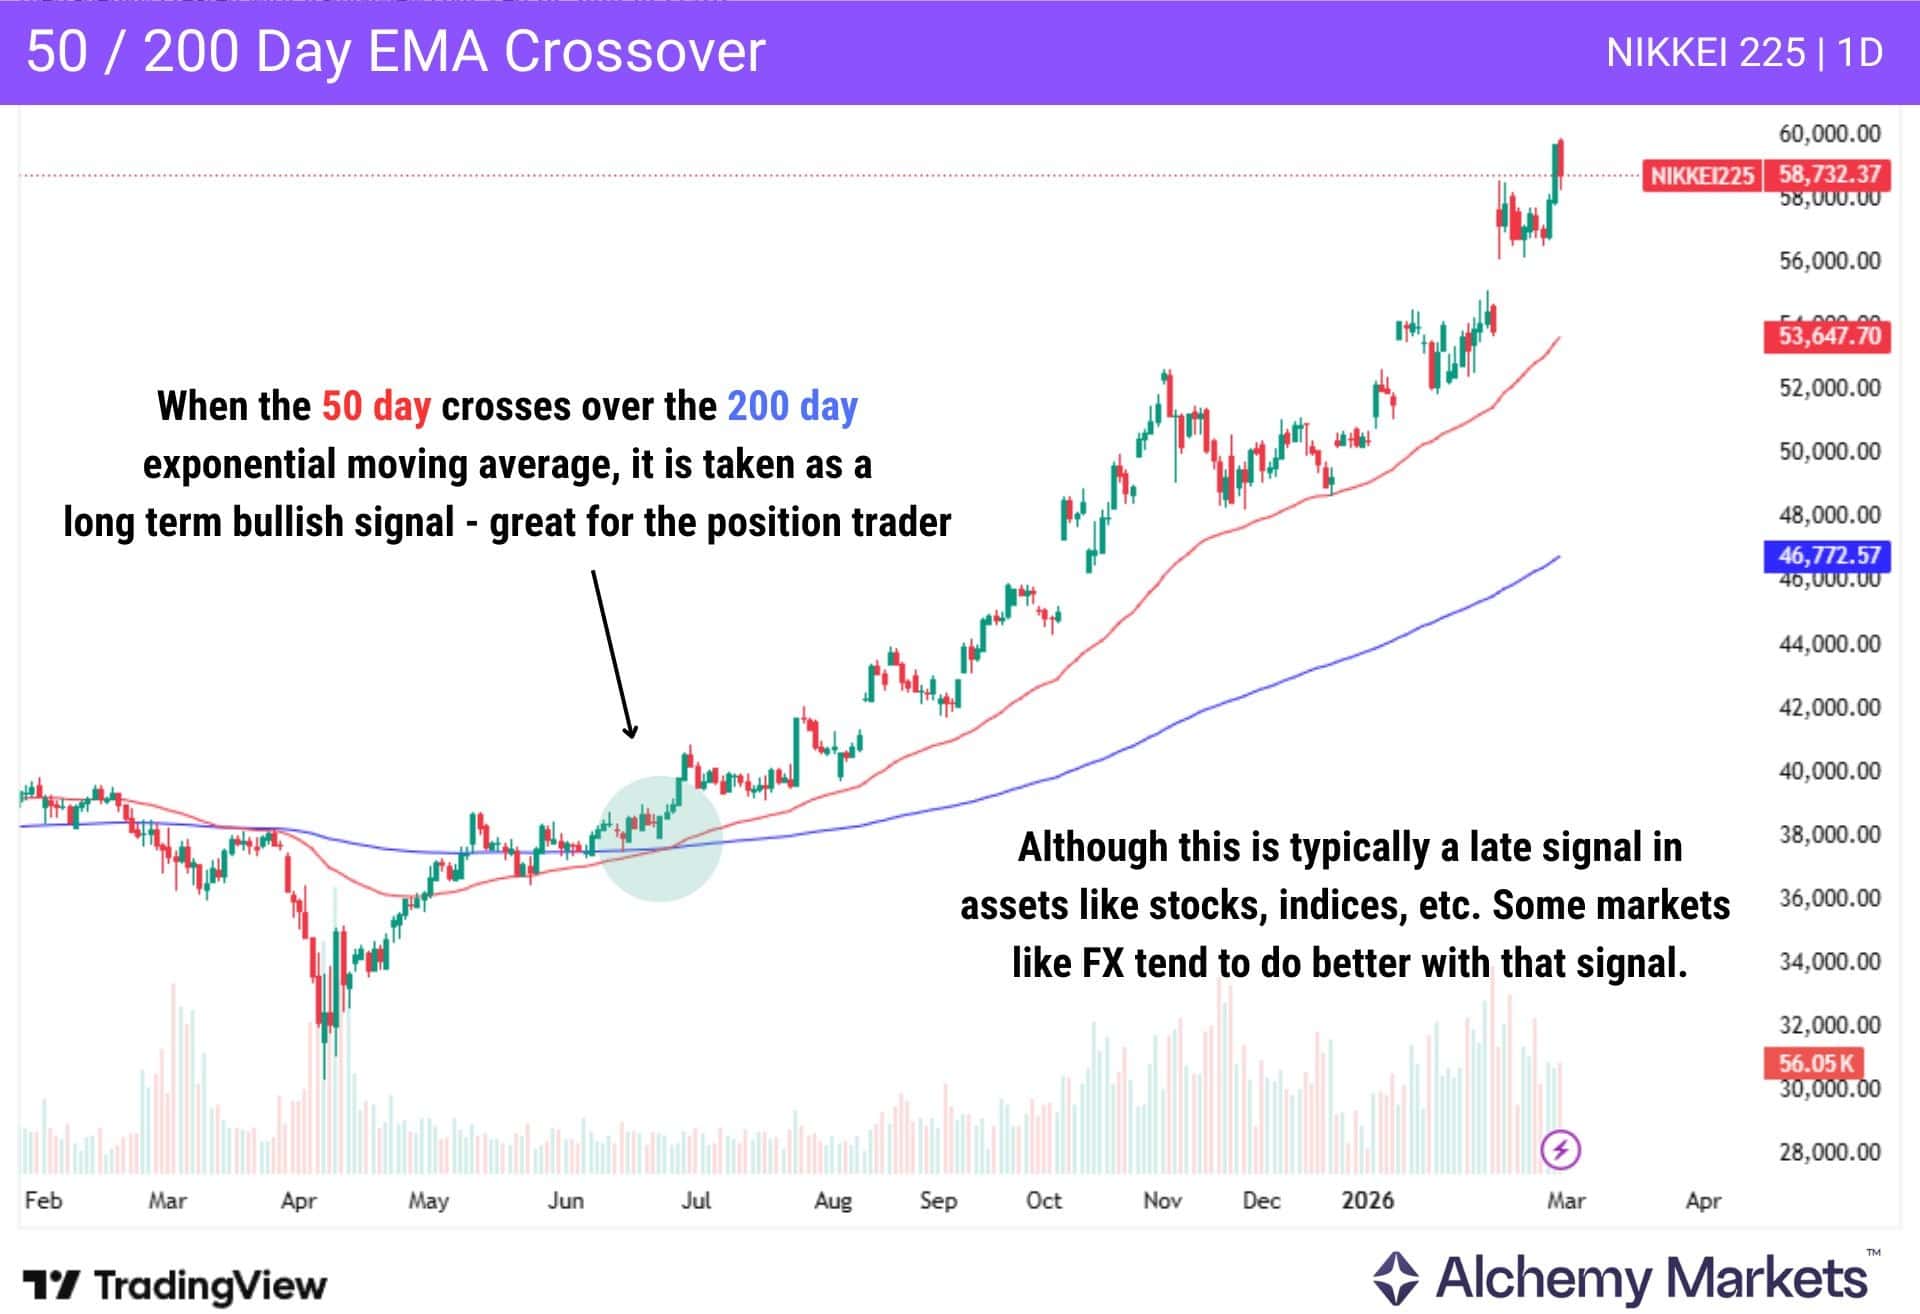
50 day EMA and 200 day EMA are both commonly used indicators on the daily timeframe. Because of this, it is common for position traders to use them as entry and exit signals, as many long term traders will see the shorter EMA rising above the longer one as a sign that momentum is picking up in that direction.
There are various ways trades use them, including crossovers, dynamic support and resistance, and even just a trend filter.
As a simple position trading signal – the 50 day EMA crossing above the 200 day EMA is noted as the Golden Cross. This means an asset is general in a positive long term trend, and can be considered as a long term hold.
Fundamental analysis strategy
Fundamental analysis is the study of interest rates, geopolitics, earnings, central bank policies, elections, GDP, and many other sets of data. In other words, the results of a company or the reasons for a market to move. While there are a seemingly unending amount of announcements that can be important, the markets will be interested in some more than others, but it is a result of other things going on at the same time, quite often.
For example, if traders are concerned about the growth of the United Kingdom’s economy, the Gross Domestic Product numbers can greatly influence how the British pound behaves. A surprise number can send the market racing. Other times, it might be earnings, as traders are trying to gauge how a company is performing. If a company has a bad earnings call with bad results, it can send a company much lower. Conversely, a company that reports excellent earnings is often rewarded with gains in the markets.
Fundamental analysis is a very complex field of study, but it also is very important, as it is a study of the “reasons a market moves.” The idea is to pay attention to the underlying numbers and factors that might make an asset trend.
Technical analysis strategy
Technical analysis strategies focus on chart patterns and indicators that can give a bit of a “heads up” as to where a market might be heading. Things like support and resistance, hammer and shooting star candlesticks, Fibonacci retracements, moving averages, triangles, and hundreds of other objects and patterns that you can see on a chart can be used by position traders to place and exit positions.
Position Trading for Beginners
Position trading can be very fruitful for beginning traders, as they can focus on long term moves, and don’t have to worry about the latest hiccup, as sometimes people will have to deal with day trading.
Position trading isn’t about short term volatility, it is about trying to find broader market trends, by using trading strategies that focus on the long term outlook for an asset. A long term strategy makes life easier without worrying about short term fluctuations. By focusing on what happens over a long term move, this makes position trading one of the best trading styles to focus on.
Position trading also allows traders to focus on learning over time, as the fewer trades that are set up allow a person to take their time and focus on entry and exit with intention, without worrying about the latest noise in the markets. Trading strategies can vary, but slowing down the game allows people to relax and build their skills over time.
Advantages of Position Trading
There are many advantages when position trading, and this makes it popular. One of the biggest advantages is that by being in long term positions, you have the ability to realize huge gains when the trend lasts for a long time. The amount of gains when holding a winning position dwarfs day trading most of the time.
The brokerage fees that add up during day trading can really be a hindrance, but in position trading, this isn’t as big of an issue. The lower frequency of trades mean that there are less expenses involved, meaning substantial savings for your business over time.
Perhaps the biggest advantage for many traders will be that they will spend less time looking at the charts, leading to your money working for you, not the other way around. Furthermore, the stress level is significantly less for most traders in relation to day trading.
Disadvantages of Position Trading
While position trading is simpler for a lot of traders, it doesn’t come without some potential disadvantages. One thing to think about is the large stop losses that might be necessary. However, this can be mitigated by the position trader by adjusting the position size accordingly.
Position traders will also have to consider that there can be overnight holding fees, depending on the market. Another potential issue that traders can face is the possibility of an overnight gap in markets that close, and in markets that are moving 24 hours a day, there is concern of sudden news while the trader is asleep.
In contrast with day trading, the position trading means that there will be less opportunities on a day to day basis. This can cause some traders a bit of an issue, waiting for a long term set up.
Position Trading vs Swing Trading
Position traders may hold trades lasting weeks, months, or even years. The position trader has the goal of capturing large trends, with little time commitment. They will often use both technical and fundamental analysis, only occasionally checking in on the market. They have lower daily risk, but larger long term exposure. It benefits those who can be patient.
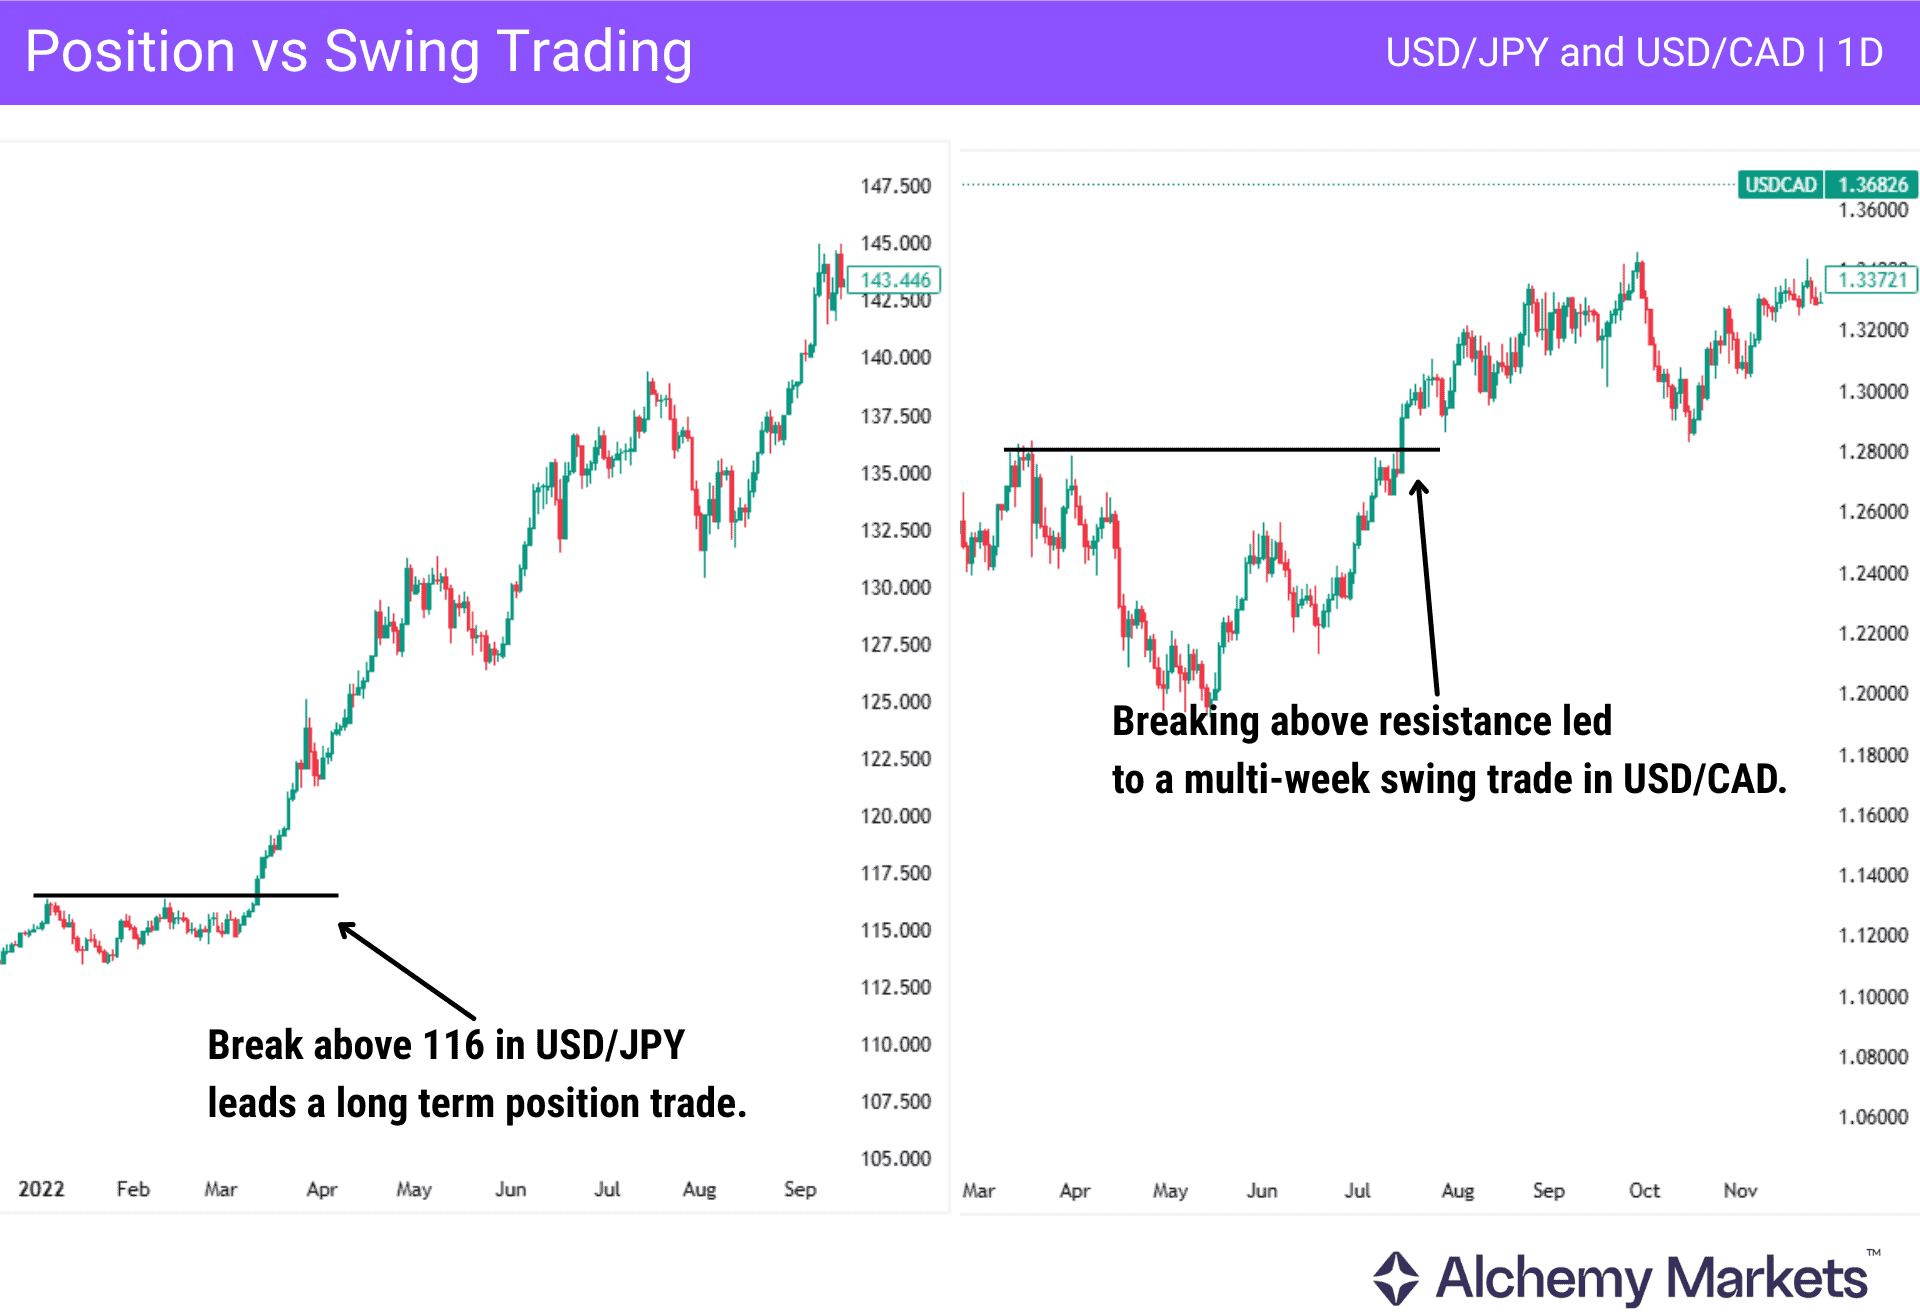
Swing traders will typically hold a position for days, or even weeks. They look to profit from market moves that occur somewhat frequently, and as a result will have to have more time commitment following what is happening. The risk tolerance for swing traders is somewhat higher short term, but can be mitigated with risk management.
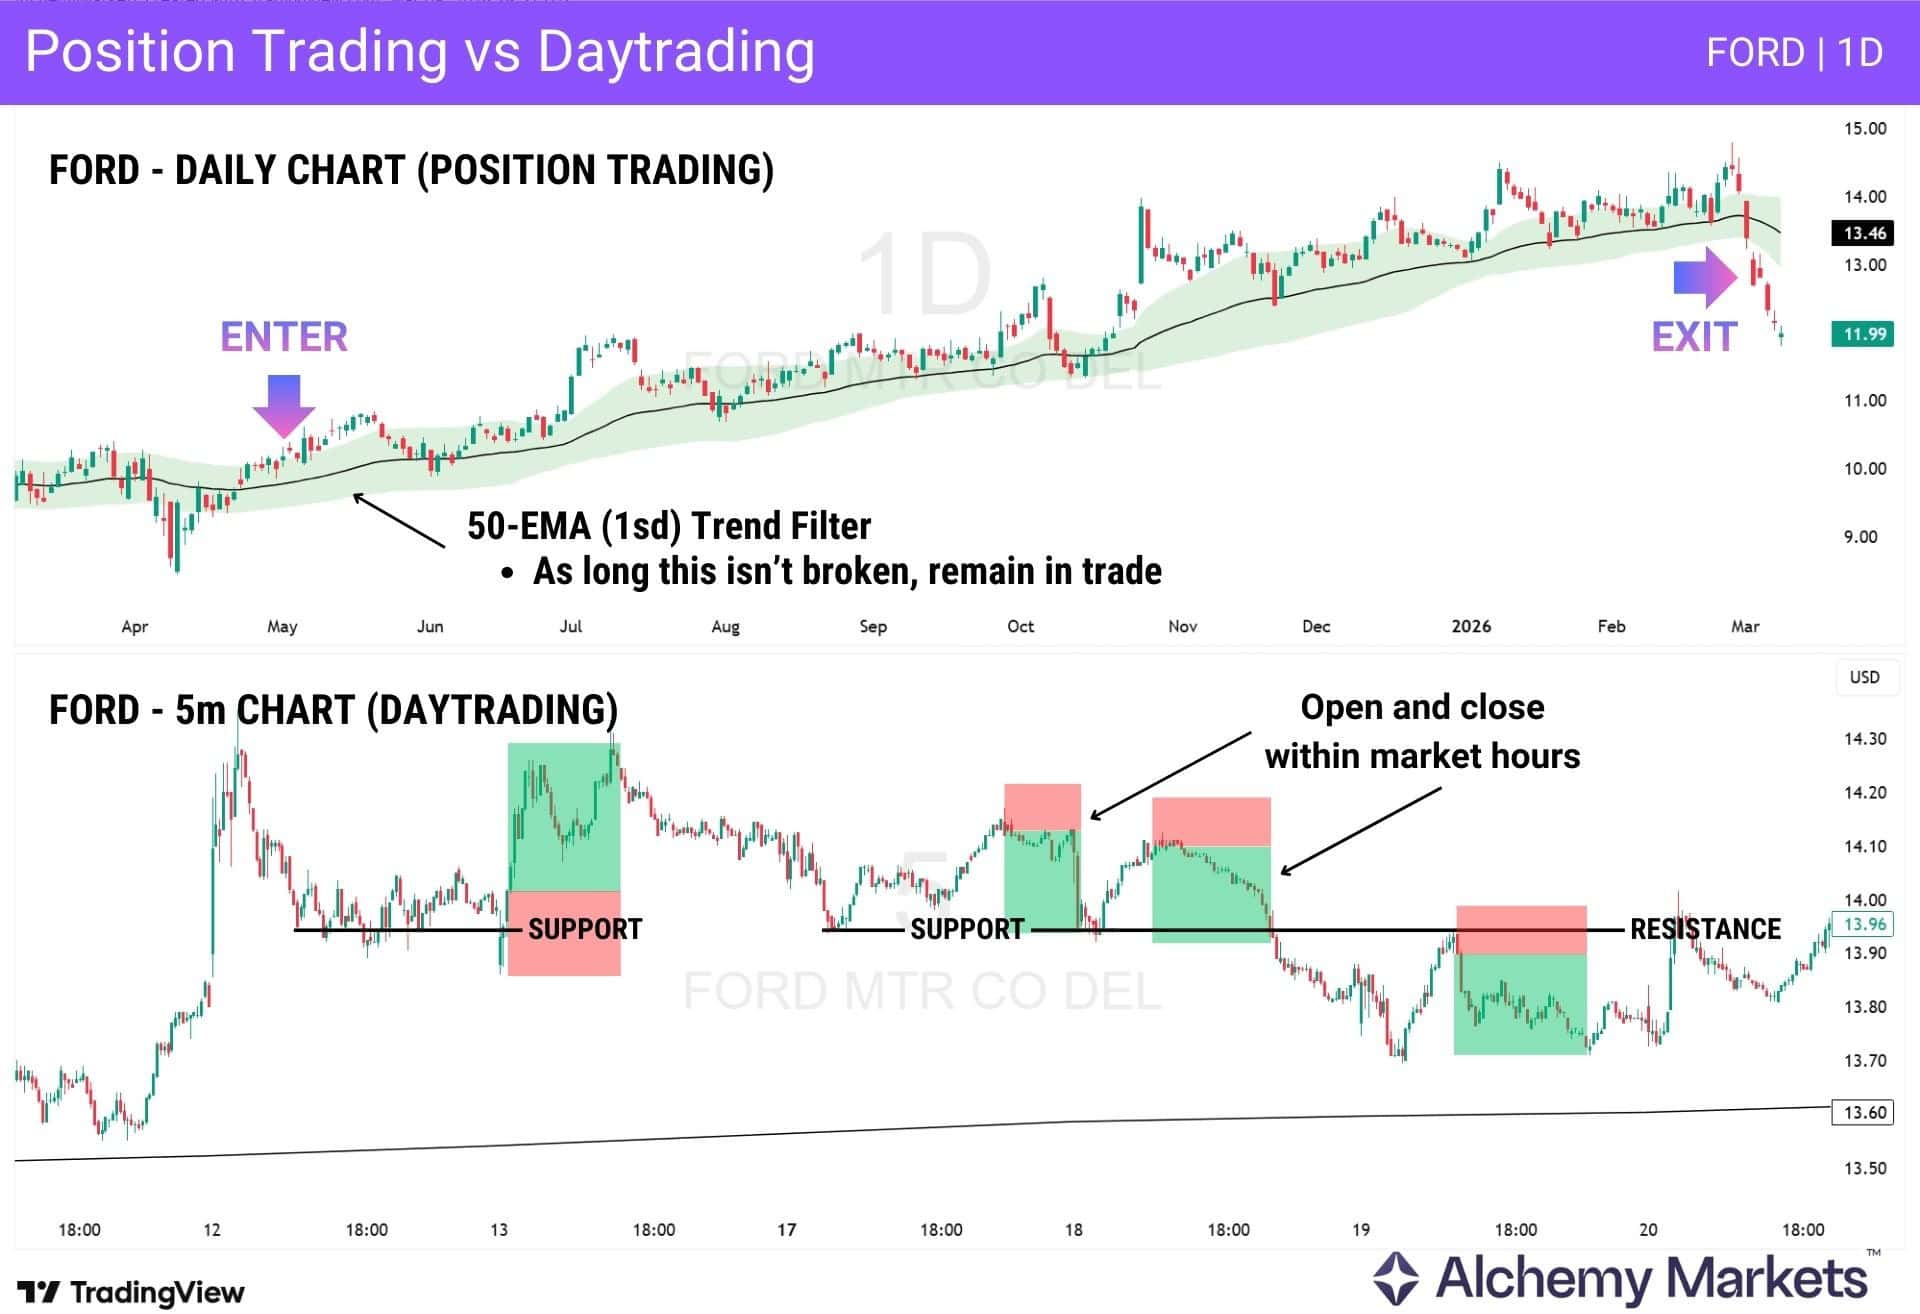
Position Trading vs Day Trading
Position trading is a long term strategy, with positions being held for weeks, months, or even years. In contrast, day trading is a method of trading that involves opening and closing the trade on the same day, sometimes in as little as a few seconds.
Position Trading vs Passive Investing
While there are some similarities between position trading and passive trading, there are also some differences which differentiate the two methods. Take a look at the chart below.
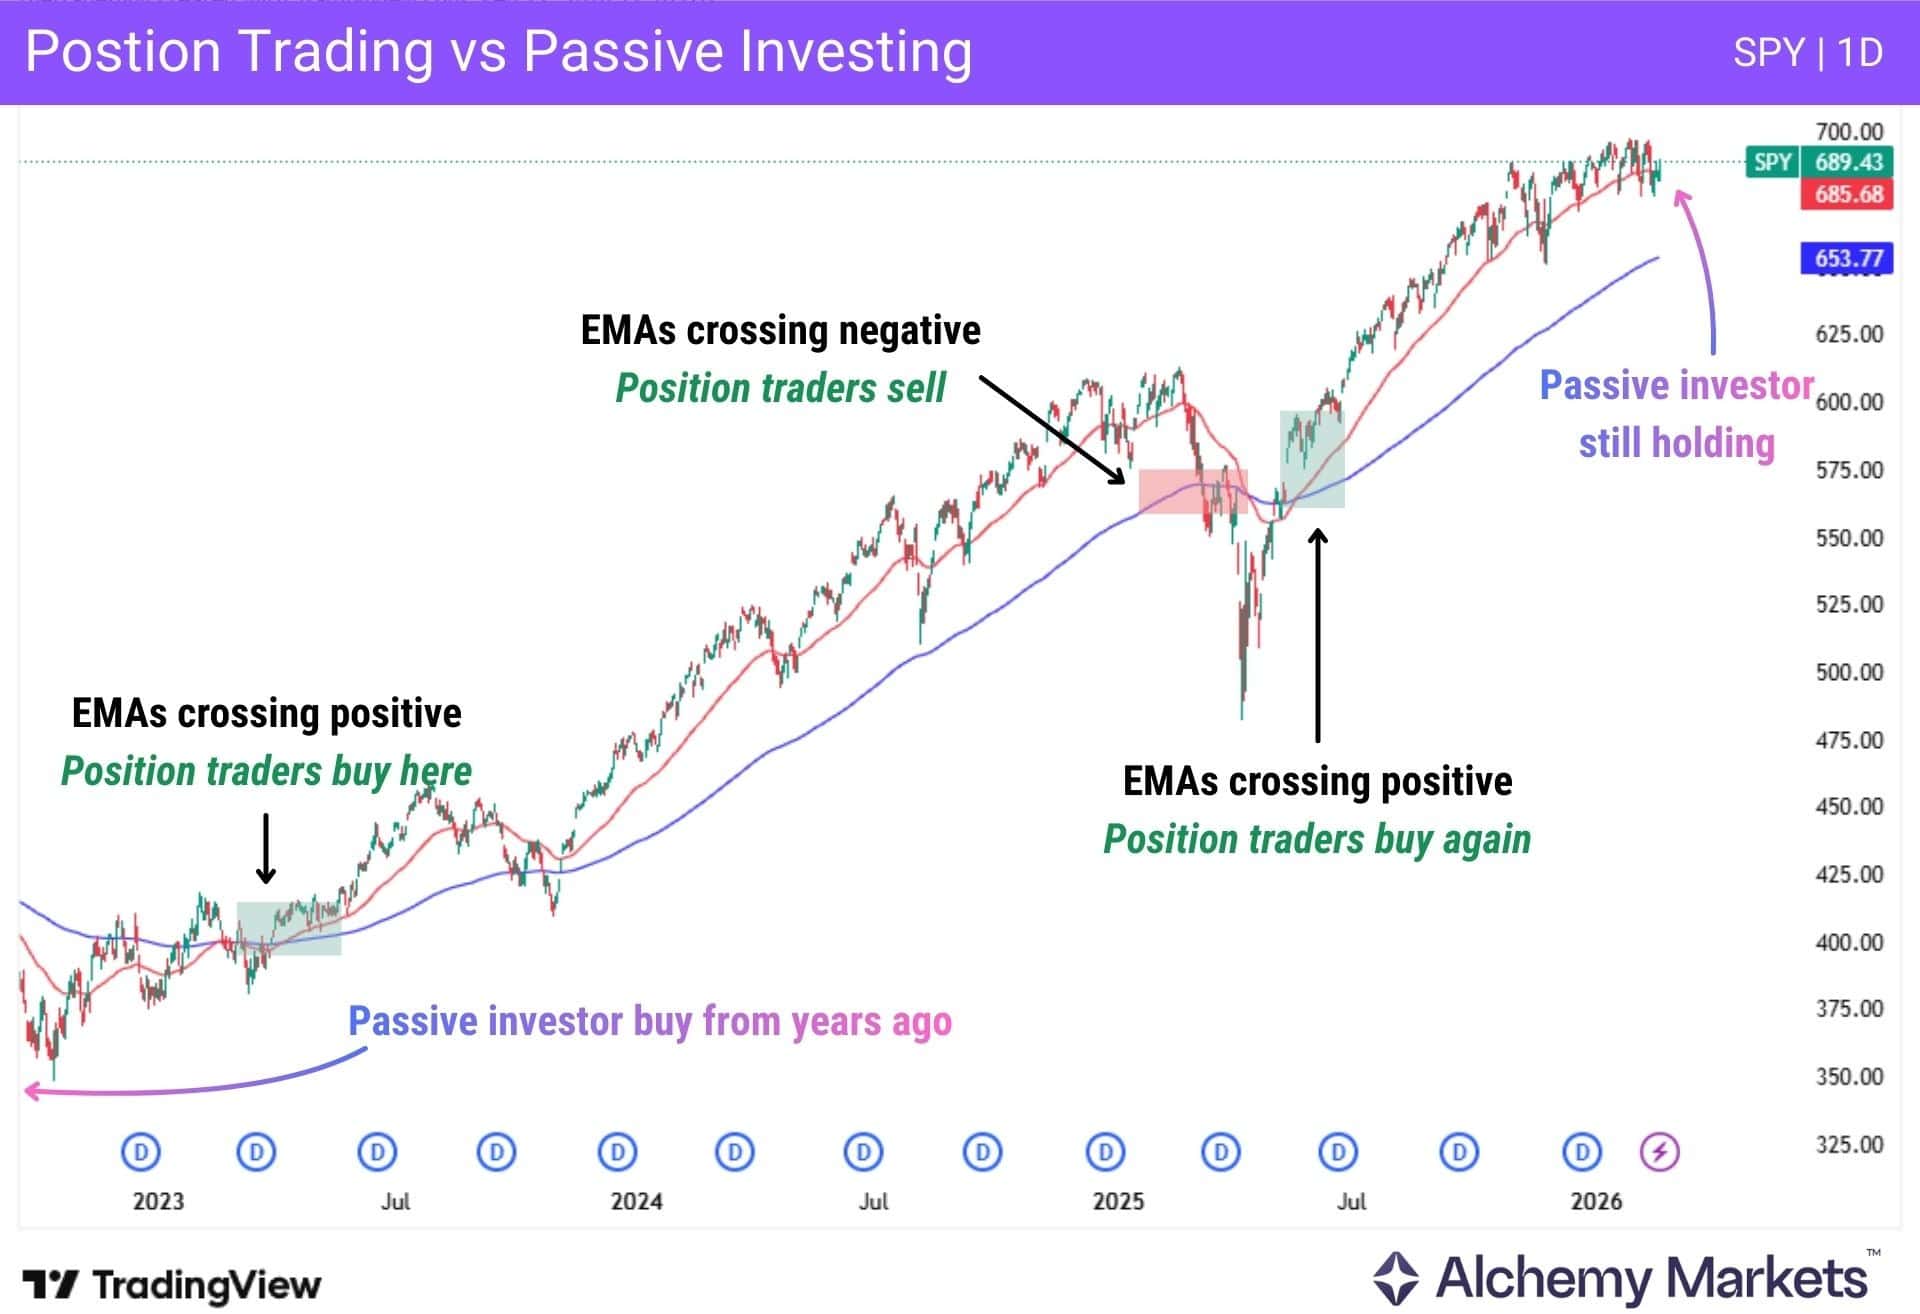
This is SPY, an ETF that tracks the S&P 500 (SPX or US500 as a CFD). Many investors hold it passively, but some traders use it for position trading. A passive investor may have bought the ETF years ago and still holds it today.
A position trader, however, may have entered and exited several times by following signals such as moving average crossovers.
In short, position traders, despite appearing “passive,” are still actively monitoring the market and exiting when long-term trend conditions turn against them. Passive investors, on the other hand, typically only sell when they need the money. They aim to benefit from the long-term growth of a stock, asset, or index, as well as the dividends paid over time—something position traders rarely focus on.
Here is a table below to highlight their key differences:
| Aspects of Trading | Position Trading | Passive Investing |
| Goal | Attempts to capture profits from medium to long term movements. | Looking for steady returns over the long term. Rarely reacts to short term moves. |
| Monitoring | Will sometimes have to monitor positions and market news. | Focus on overall growth over years. Will rarely check markets. |
| Decisions | Buys and holds based on identified trends but prepares entry and exit strategies. | Buy and hold without frequent buying or selling. |
| Hold Long? | Can last for weeks, months, or even years depending on the trend. | Often holds assets for years, sometimes even decades. |
| Risk | Takes trades and adjusts positions when trends show signs of a reverse. | Accepts there will be ups and downs, ignoring most volatility. |
| Focus of Trader | Trades specific market trends and opportunities. | Long term wealth creation via compounding returns. |
Position Sizing in Position Trading
Position sizing plays a different role in position trading, as many traders scale into positions over time rather than committing capital in a single entry. This approach, often resembling dollar-cost averaging (DCA), shifts the focus from precise trade sizing to broader capital allocation across multiple entries.
A common approach is the 3–5 layer model, where an initial position is established, followed by additional entries at key drawdown levels or volatility expansions, allowing traders to improve their average entry while controlling overall exposure.
| The “Tranche Allocation” Model (Institutional standard) |
|---|
| Structure: Total intended position = 100% Deploy in 3–5 tranches Example (clean + common): 30% → initial entry 30% → on −10% drawdown 20% → on −20% 20% → on −30% |
More advanced approaches refine this by tying position sizing to risk and volatility, rather than price alone.
| Volatility-Based Scaling (ATR / Risk Parity) |
| Entries are triggered by volatility expansion instead of fixed % drops. As volatility increases, positions are added with lower sizing, or spaced further apart, preventing overexposure during unstable conditions. A famous case study of this approach is the Turtle Trader Program. |
| Kelly / Conviction-Based Allocation (advanced) |
| Capital is allocated based on edge and probability. Larger size is deployed when expected returns are higher, though this approach is more aggressive and less commonly used in full. |
Position Sizing Formula
In position trading, the basic formula still anchors each entry:
| Position Size = (Account Size × Risk %) ÷ Stop Loss Distance |
Traders use this to define a fixed risk per entry, typically between 0.5% to 2% of their account, and then size the position according to the stop loss distance.
This ensures that regardless of how wide or tight the setup is, the amount at risk remains consistent. Wider stops naturally reduce position size, while tighter stops allow for larger positions, keeping risk stable across trades.
However, this approach can be refined further by incorporating market volatility. Instead of relying solely on price structure, traders may adjust position size using:
| Position Size = Risk per Trade ÷ (ATR × Multiplier) |
Here, ATR acts as a proxy for volatility. As market volatility increases, position sizes are reduced while stop distances widen, ensuring that each entry adapts to current conditions rather than fixed price levels. This prevents overexposure during unstable periods and keeps risk more consistent in dynamic markets.
In practice, position traders combine these ideas by scaling into positions rather than committing full size upfront.
A well-documented example are the Turtle Traders, who sized each position using a variation of the volatility formula, and added only as trades moved in their favour.
This allowed exposure to grow progressively under confirmation, while maintaining controlled downside risk throughout the trade.
Position Sizing Calculator
Online position sizing calculators allow traders to quickly find out how much to trade by inputting their account size, risk per trade, and stop loss distance.
Instead of estimating lot size, you can use these tools before every trade to ensure your risk stays within your predefined limits.
This is especially useful when scaling into positions, as it helps you consistently size each entry without overexposing your account.
What Common Mistakes Should Traders Avoid When Position Trading?
Position trading requires patience and a long-term perspective, but traders can still make several mistakes that weaken their strategy. One common issue is abandoning the long-term mindset. Position trades are meant to capture large market trends, yet some traders exit too early because of short-term volatility or small pullbacks that are normal within a broader trend.
Another mistake is ignoring fundamental drivers. Long-term market moves are often influenced by macroeconomic factors such as interest rates, economic growth, corporate earnings, or sector momentum. Traders who rely only on short-term technical signals may miss the bigger forces shaping the trend.
Risk management is also important when holding trades for extended periods. Using excessive leverage or failing to size positions properly can expose traders to large drawdowns during normal market fluctuations. Because position trades often require wider stop losses, position sizing must be adjusted to maintain controlled risk.
Finally, many traders struggle with impatience and constant monitoring.
Position trading is not about reacting to every small movement in price. Traders who frequently adjust their positions or overanalyse short-term noise may end up interfering with trades that require time to develop.
FAQ
While position trading is relatively simple, as the timeframe is slowed down, there are several things to consider when being involved in the market for an extended period.
Which market is best suited for position trading?
The markets that are best for position trading are the ones that have the strongest trends, or are about to begin a long term move. While there are multiple trading strategies that you can use, the best markets are the ones that have cyclical moves.
Over time, it can be utility stocks, crypto, currencies, or anything else that moves. It comes down to what is undervalued, and when people come to that conclusion, pushing the markets higher, or lower.
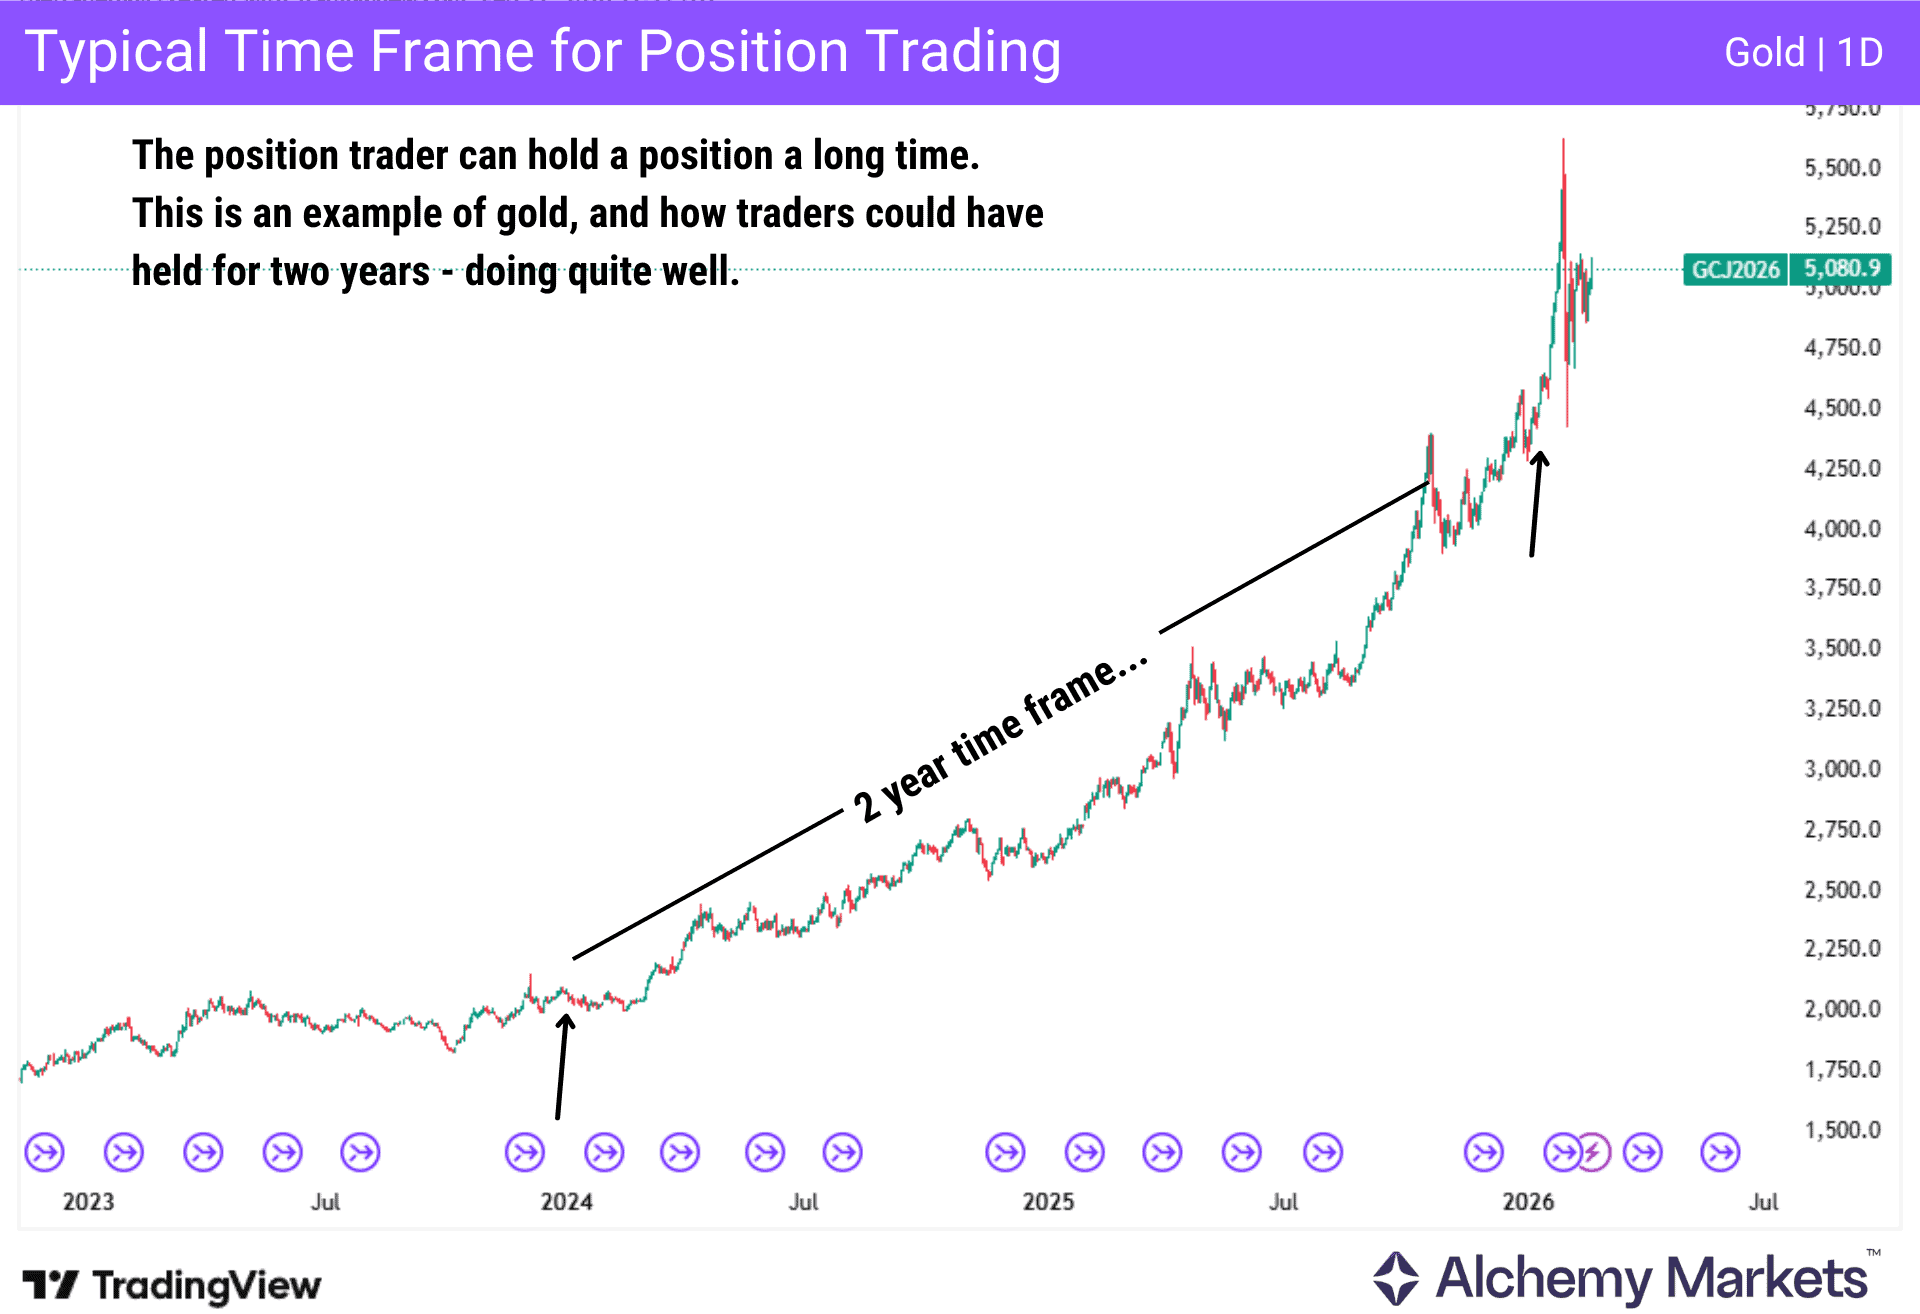
What is the typical time frame for holding a position in position trading?
When position trading, the typical time frame for holding onto a position can be from several months to several years. The exact duration isn’t necessarily written in stone, but as a general rule, you are trying to capitalize on major market trends when they occur. The day to day noise isn’t a thought.
Is position trading profitable?
Position trading is the same as many other trading methodologies, as it can be either profitable or not. This comes down to the strategy, the underlying assets traded, and the skill of the investor. However, it is worth noting that many of your retirement accounts use position trading to determine entry and exit parameters.
Can you use a position trading strategy for shares?
Yes, you can, and it is quite common for investors to do so. There are multiple trading strategies that people use to trade shares for long term moves. Major market trends are what traders will be looking for, and shares are commonly found to be the vehicle. Short term fluctuations are often ignored, as investors look for the bigger moves.
Can you use a position trading strategy for indices?
Yes, and most people that have a retirement account already hold indices in their accounts for long term moves. Buy and hold investors, as well as money managers often will have an index, possibly through an ETF, as a core holding over years, if not decades.
Can you use a position trading strategy for commodities?
Commodities can be used as well, but there are a few things to think about. The futures markets roll over, meaning they change months and contracts, which can complicate things. The CFD markets are more straightforward, and simpler for a lot of people.
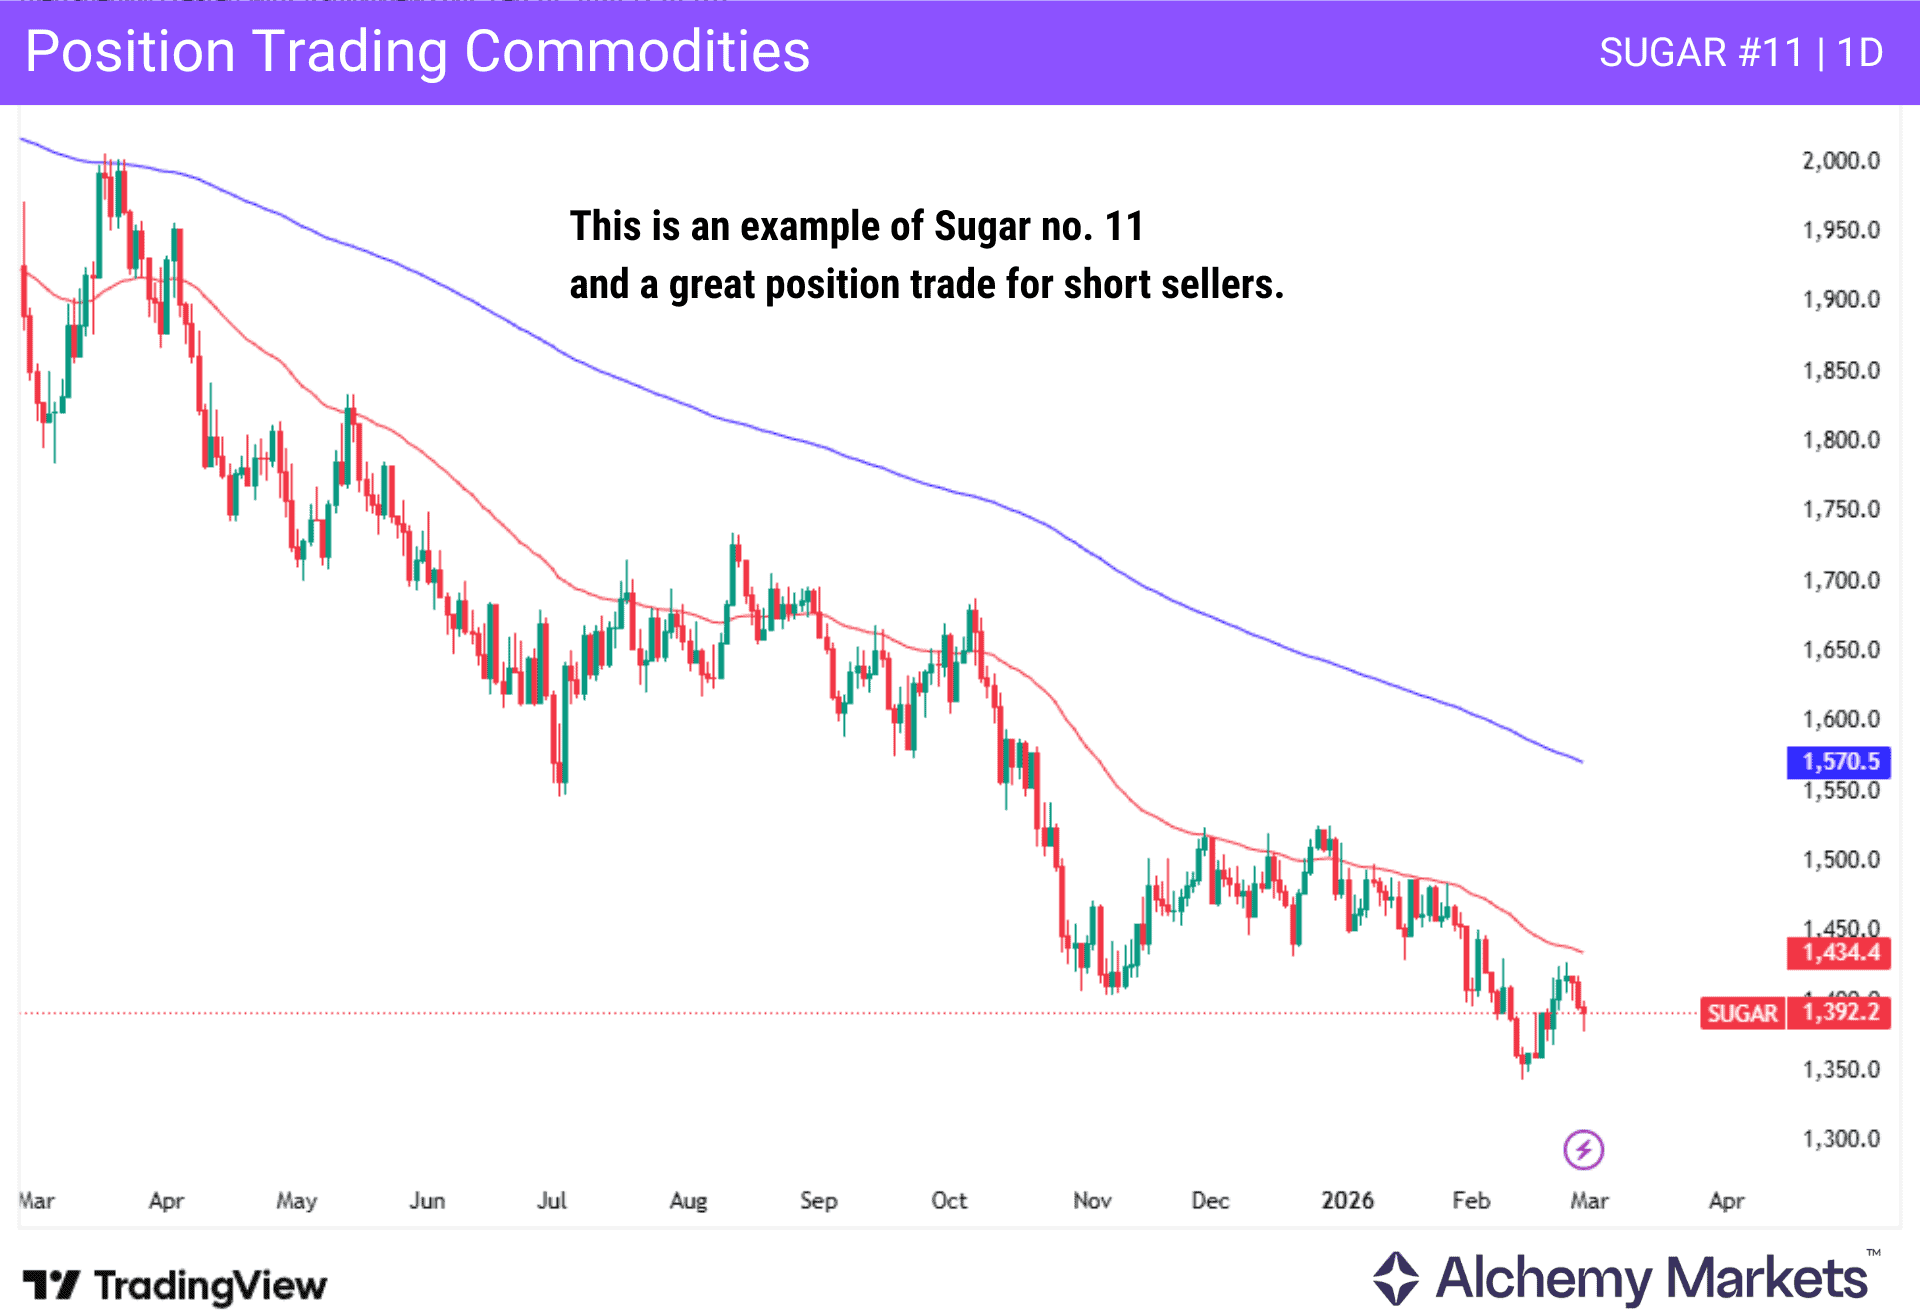
The commodity markets also can take a lot of margin for traders to become involved in futures, making it very expensive to hold onto a contract. However, through CFDs and ETFs, it can be more possible for the average trader.
Can you use a position trading strategy for forex?
Yes, and it is quite common for Forex traders to use position trading. This is also because of the swap at the end of the day, and traders will often buy a higher yielding currency with a lower yielding one. The interest that is paid at the end of the day will only add to potential gains, assuming you understand the current macroeconomic trends.
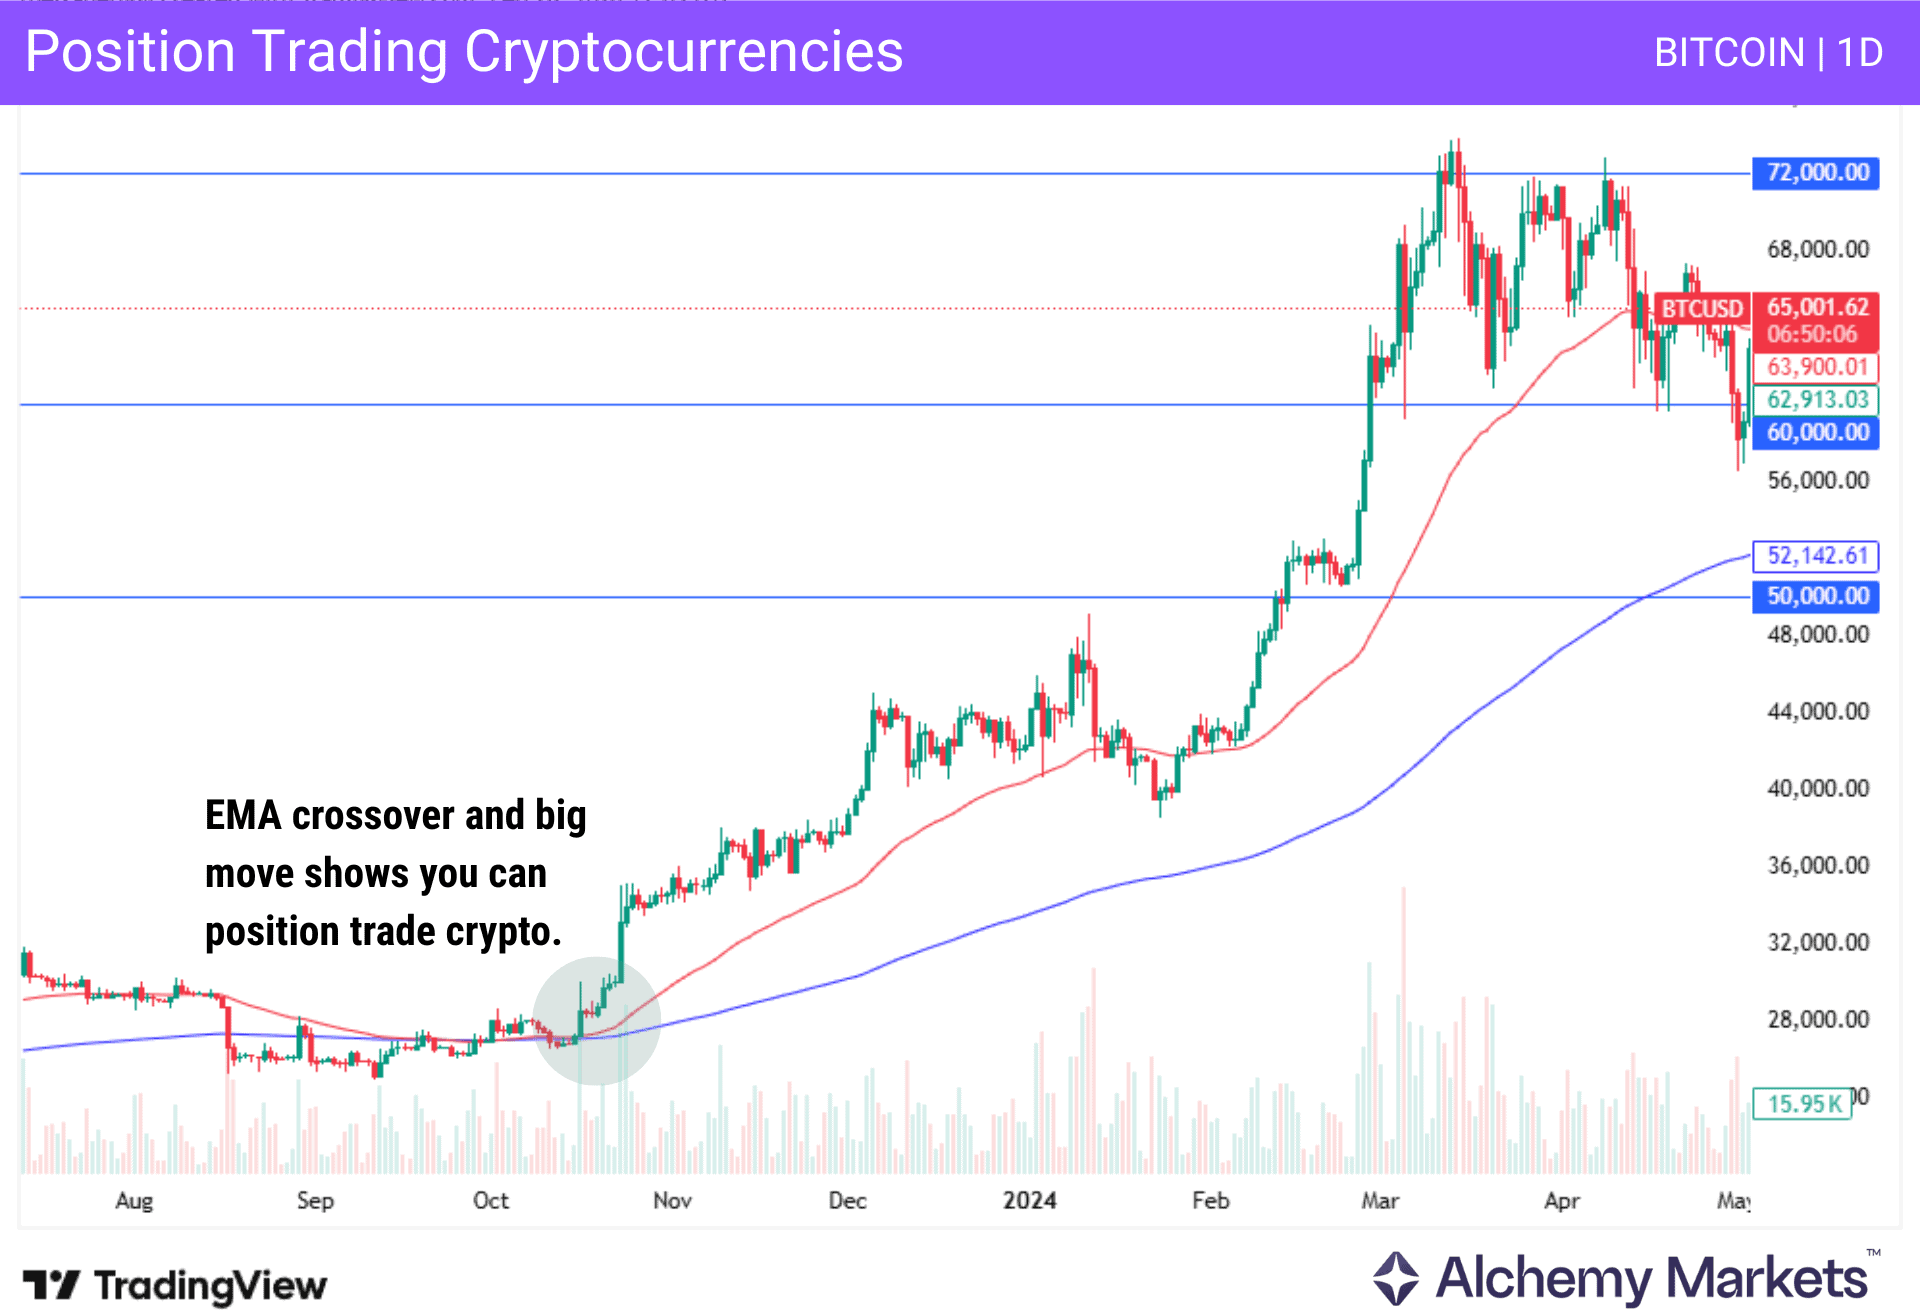
Can you use a position trading strategy for cryptocurrencies?
While it certainly can be used in cryptocurrencies, position trading relies on stability and clear trends. The crypto market tends to be a bit too volatile for a lot of position traders to deal with, so as a general rule, only Bitcoin and Ethereum have been position traded with success. The smaller markets tend to be too “fly by night.”
Is position trading good for beginners?
Yes, it can be. This is because it is a slower pace of trading, ignoring the noise that comes with day trading. It is common for new traders to start position trading early, as they will often buy assets they believe will “rise over time.”
This allows those with careers to participate, and to grow their accounts without being stuck at their computers. Beginners can take their time to utilize a long term strategy, as long as they withstand market fluctuations. It is slower than short term trading, and as a result allows people to take their time, allowing them to take into account market sentiment, market movements, and the broader trend without pressure.
Which stock is most suitable for positional trading?
Any stock showing a long term trend and clear fundamentals will be a candidate for position trading. The long term is what position traders are looking to take advantage of, and anything that is going to move in one direction for an extended period is a potential candidate for this method.


