Neutral
- November 4, 2024
- 32 min read
Inside Bar Candlestick Pattern
What Is an Inside Bar Candle Pattern?
An inside bar is a two-candlestick pattern where the second candle is completely engulfed by the first candle. The pattern represents indecision, uncertainty, or simply a breather among market traders or investors. This pattern is ideally observed during trending market periods or after a series of consecutive—and often large—decisive moves in a specific direction. Therefore, the relatively smaller move made by the pattern can present viable entry points with more defined risk and upside potential.
What is a Bullish Inside Bar Pattern?
Unlike other candlestick patterns, the bullish inside bar is not defined by the color of its first or second candle. In fact, the “bullish” nature of an inside bar has nothing to do with the candles’ colors and everything to do with the pattern’s position on the chart. An inside bar is considered bullish when it serves as either a continuation pattern during an uptrend or a reversal pattern during a downtrend. We will discuss this further and provide an example in the following sections.
What is a Bearish Inside Bar Pattern?
Similar to the bullish inside bar, the bearish inside bar is not defined by the color of its first or second candle. The ‘bearish’ nature of the inside bar is determined by its position on the chart. Therefore, an inside bar is considered bearish when it acts as a reversal pattern during an uptrend or as a continuation pattern during a downtrend, especially when followed by a third candle with a lower high and lower low. We will discuss this further and provide an example in the following sections.
How to Identify the Inside Bar Pattern?
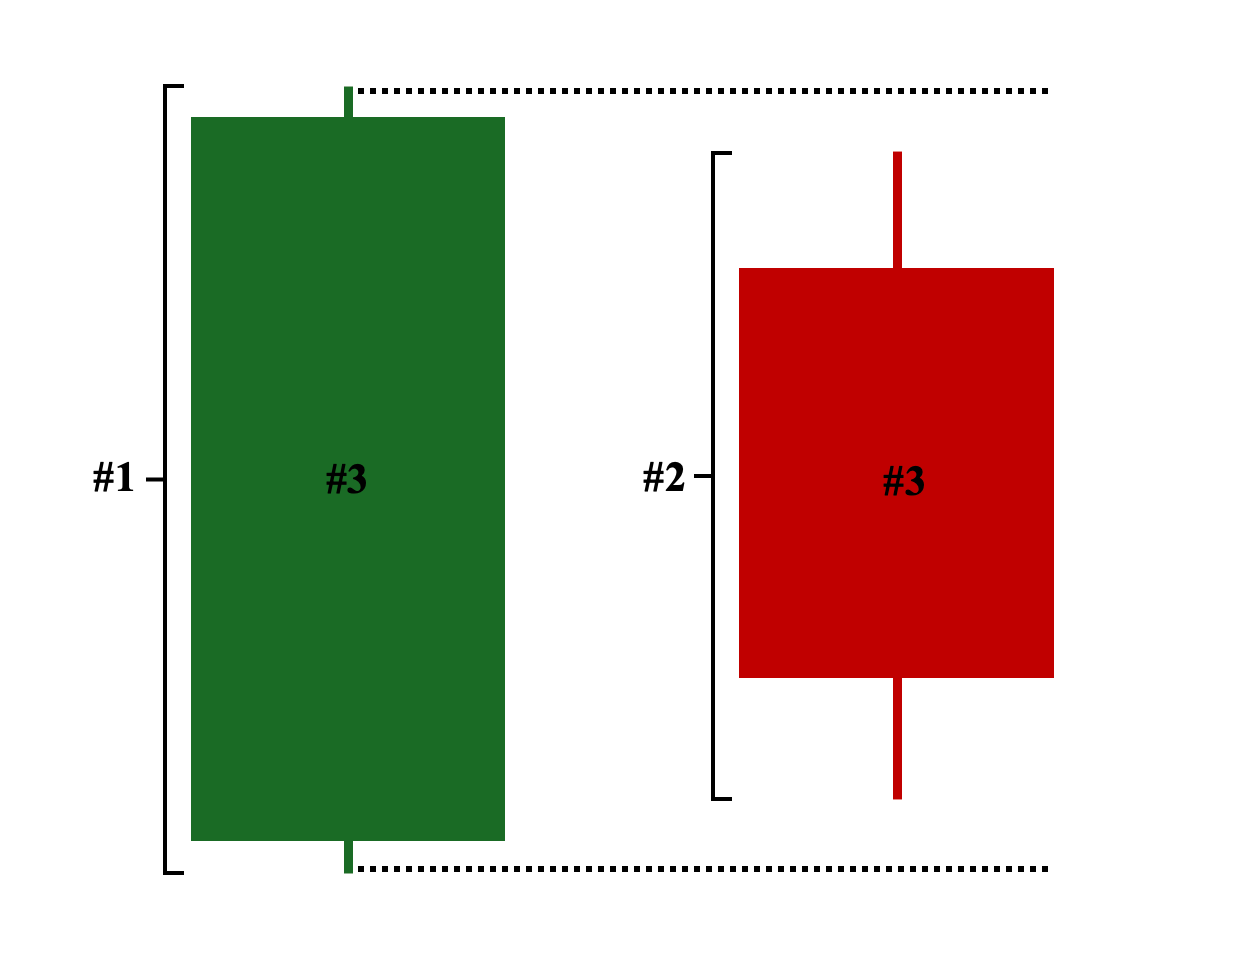
Here are the three primary criteria for identifying a valid inside bar pattern on a price chart:
- 1st Candle (Mother Bar): Must be a relatively long-bodied candlestick that completely engulfs the 2nd Candle’s range.
- 2nd Candle (Inside Bar): The candle’s range—both its body and shadows—must be entirely covered by the previous candle (mother bar).
- Color: The color of either candle is not important; the position on the chart takes precedence.
Note: The next candle following the pattern, referred to as the “confirmation candle,” indicates the likely direction of price action and market sentiment.
a. Bullish = if it closes above the high of the previous candle (inside bar candle)
b. Bearish = if it closes below the low of the previous candle (inside bar candle)
Two Types of Confirmation Signal
With that said, the confirmation candle can signal either of the following:
- Continuation Signal – The 3rd candle breaks either the range of the inside bar (aggressive approach) or the mother bar (conservative approach) in the direction of the original trend.a. Continuation Signal on an Uptrend – The 3rd candle breaks the high of either the inside bar or the mother bar, depending on your chosen approach, indicating that price action will likely continue its upward move.b. Continuation Signal on a Downtrend – The 3rd candle breaks the low of either the inside bar or the mother bar, depending on your chosen approach, signifying that price action will likely continue its downward trajectory.
- Reversal Signal – This is the exact opposite of the continuation signal. In this case, the 3rd candle breaks either the range of the inside bar (aggressive approach) or the mother bar (conservative approach) in the opposite direction of the original trend.a. Reversal Signal on an Uptrend – The 3rd candle breaks the low of either the inside bar or the mother bar, depending on your chosen approach, indicating that the upward momentum may halt and transition into either a prolonged sideways movement (consolidation period) or a downtrend.b. Reversal Signal on a Downtrend – The 3rd candle breaks the high of either the inside bar or the mother bar, depending on your chosen approach, signifying that the downward trend may pause and transition into either a sideways movement (consolidation period) or an uptrend.
Inside Bar Pattern Chart Examples
Here are five examples of inside bar patterns in different market conditions:
Example #1: Uptrend Inside Bar Setup – Bullish Inside Bar Pattern
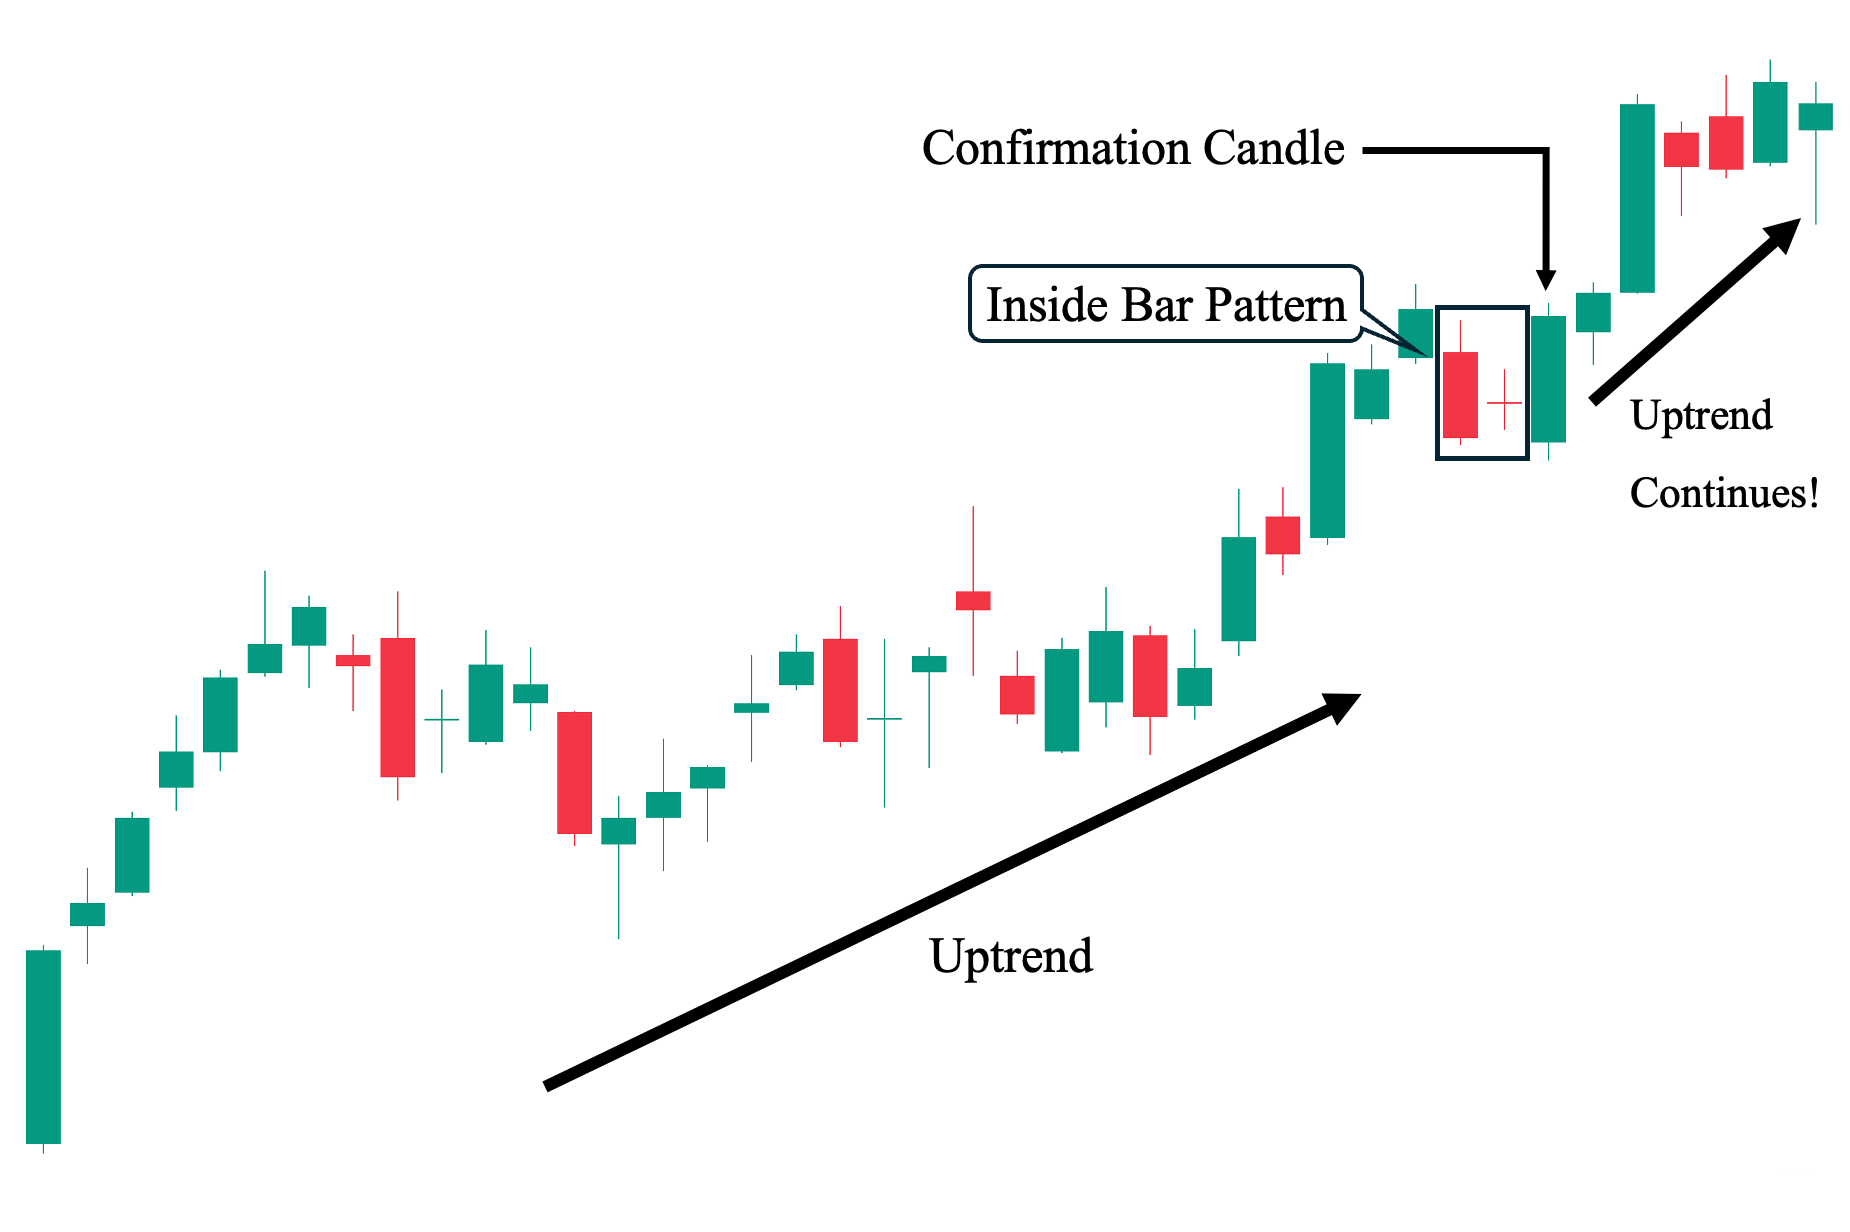
Let’s examine our first example to illustrate that an inside bar can be considered a bullish variant based solely on its position on the chart, rather than its color. As shown, an uptrend was evident before the pattern appeared. First, a long-bodied red candle, which serves as the pattern’s first candle (the mother bar), formed. This was followed by a much smaller bearish candle that resembles a doji, given how close the open and close prices are. Despite these two consecutive bearish candles, a confirmation candle then followed, closing above the high of both the first (mother bar) and second (inside bar) candles, signaling a bullish continuation. Thus, the uptrend persisted.
As traders, you may have noticed that the two candles in the inside bar pattern often serve as short-term resistance levels. Therefore, breaking these price levels is crucial for the success of a potential long trade in the market.
Note: Even doji variants, which are typically indecisive candles, can serve as the inside bar candle.
Example #2: Downtrend Inside Bar Setup – Bearish Inside Bar Pattern
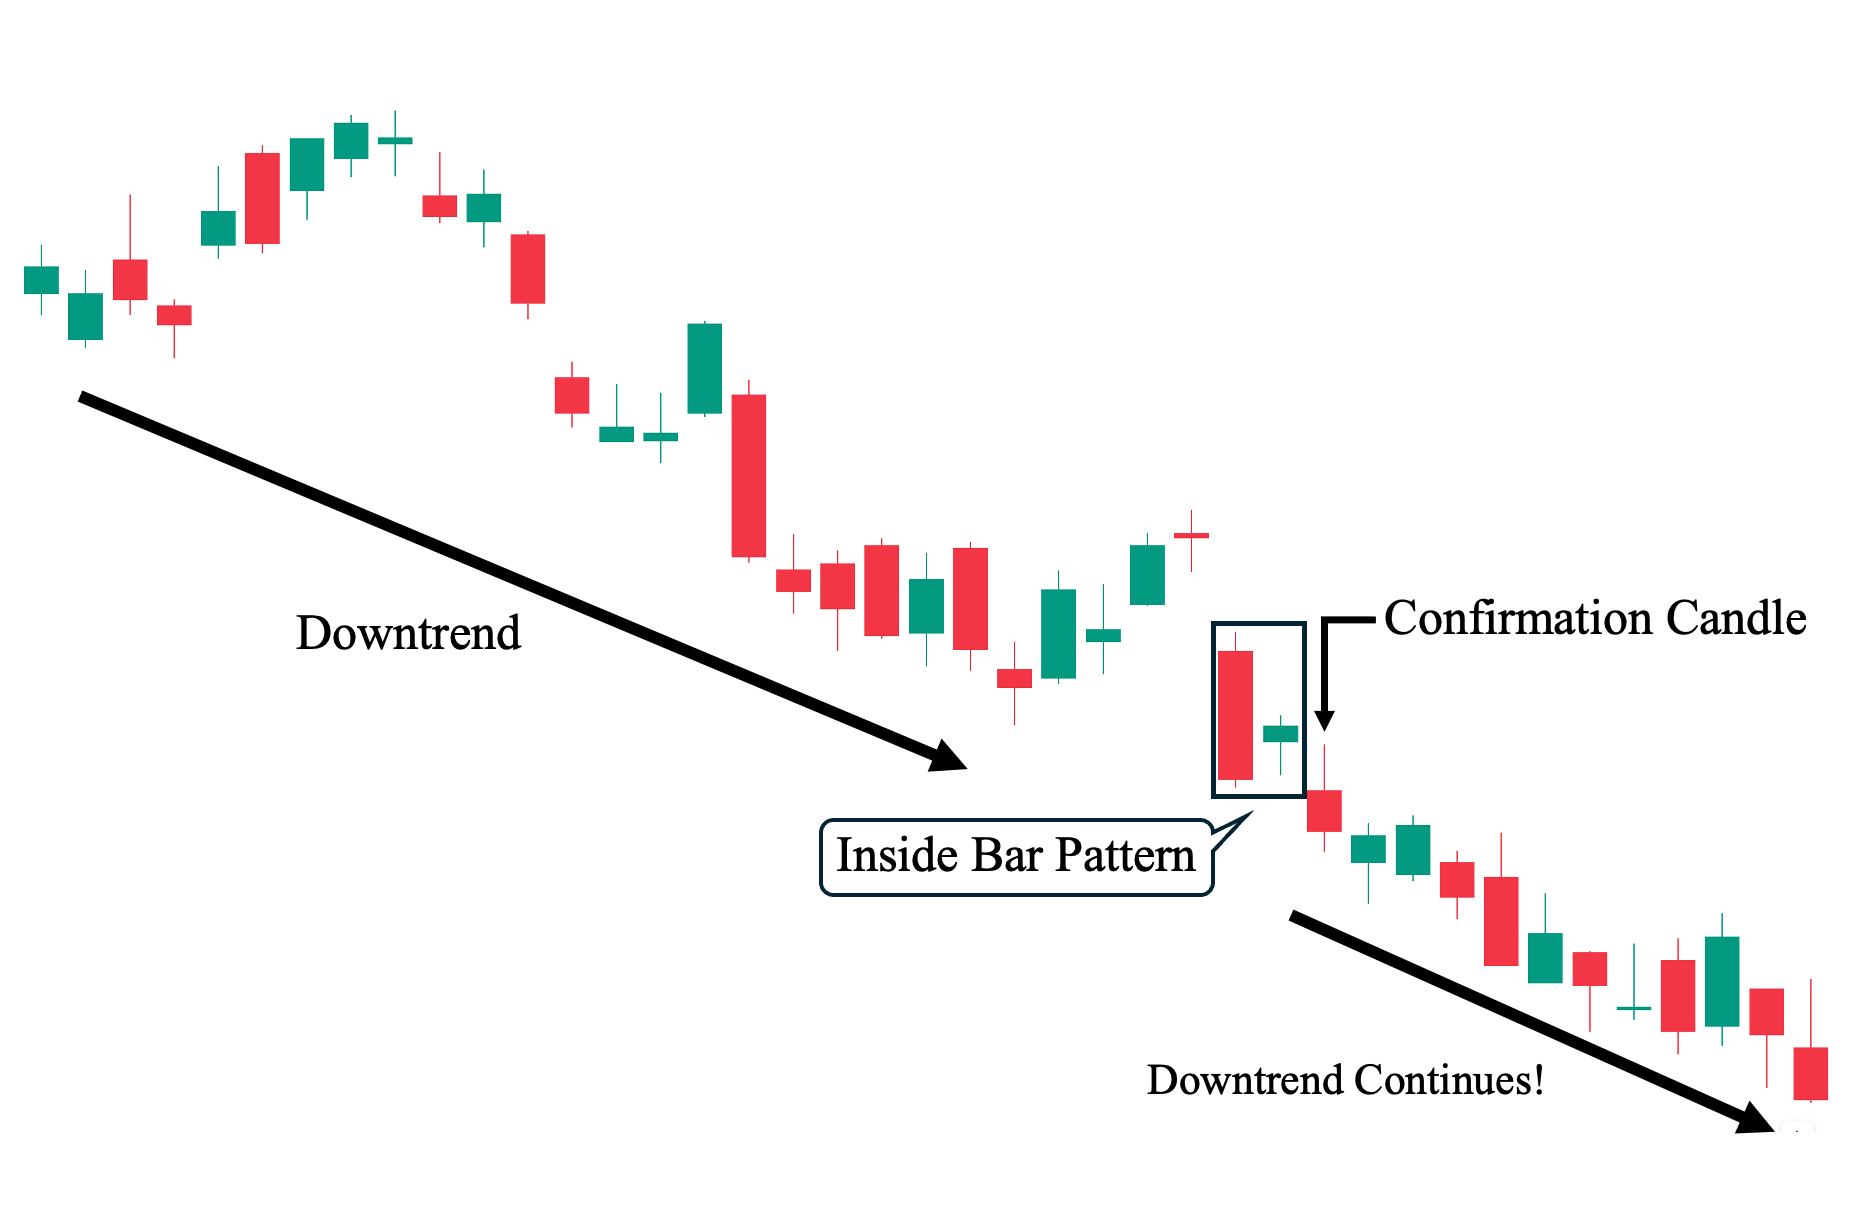
Compared to our first example, here we have an inside bar setup that functioned as a bearish pattern. Again, the color of the candles does not tell us much: the mother bar is red, while the inside bar candle is green. Regardless, we encourage you to focus on the market structure, as it provides an additional, much-needed clue about where the price action is likely headed. As shown, the mother bar effectively triggered a downward breakout (referred to as a ‘breakdown’), piercing through the previous low and support level and turning it into the new resistance level.
But why is this important? As traders, it’s crucial to remember that market structure takes precedence over any candlestick pattern, including the inside bar. You might have missed this breakdown if you were too focused on the inside bar pattern in this example. This is precisely the lesson here: although a third candle closed below the mother bar and inside bar, serving as a confirmation signal that the downtrend was still intact, you didn’t really need this information for this specific trade. The first candle making a new low is enough to effectively point towards further downward pressure.
Example #3: Inside Bar Setup for Trend Change
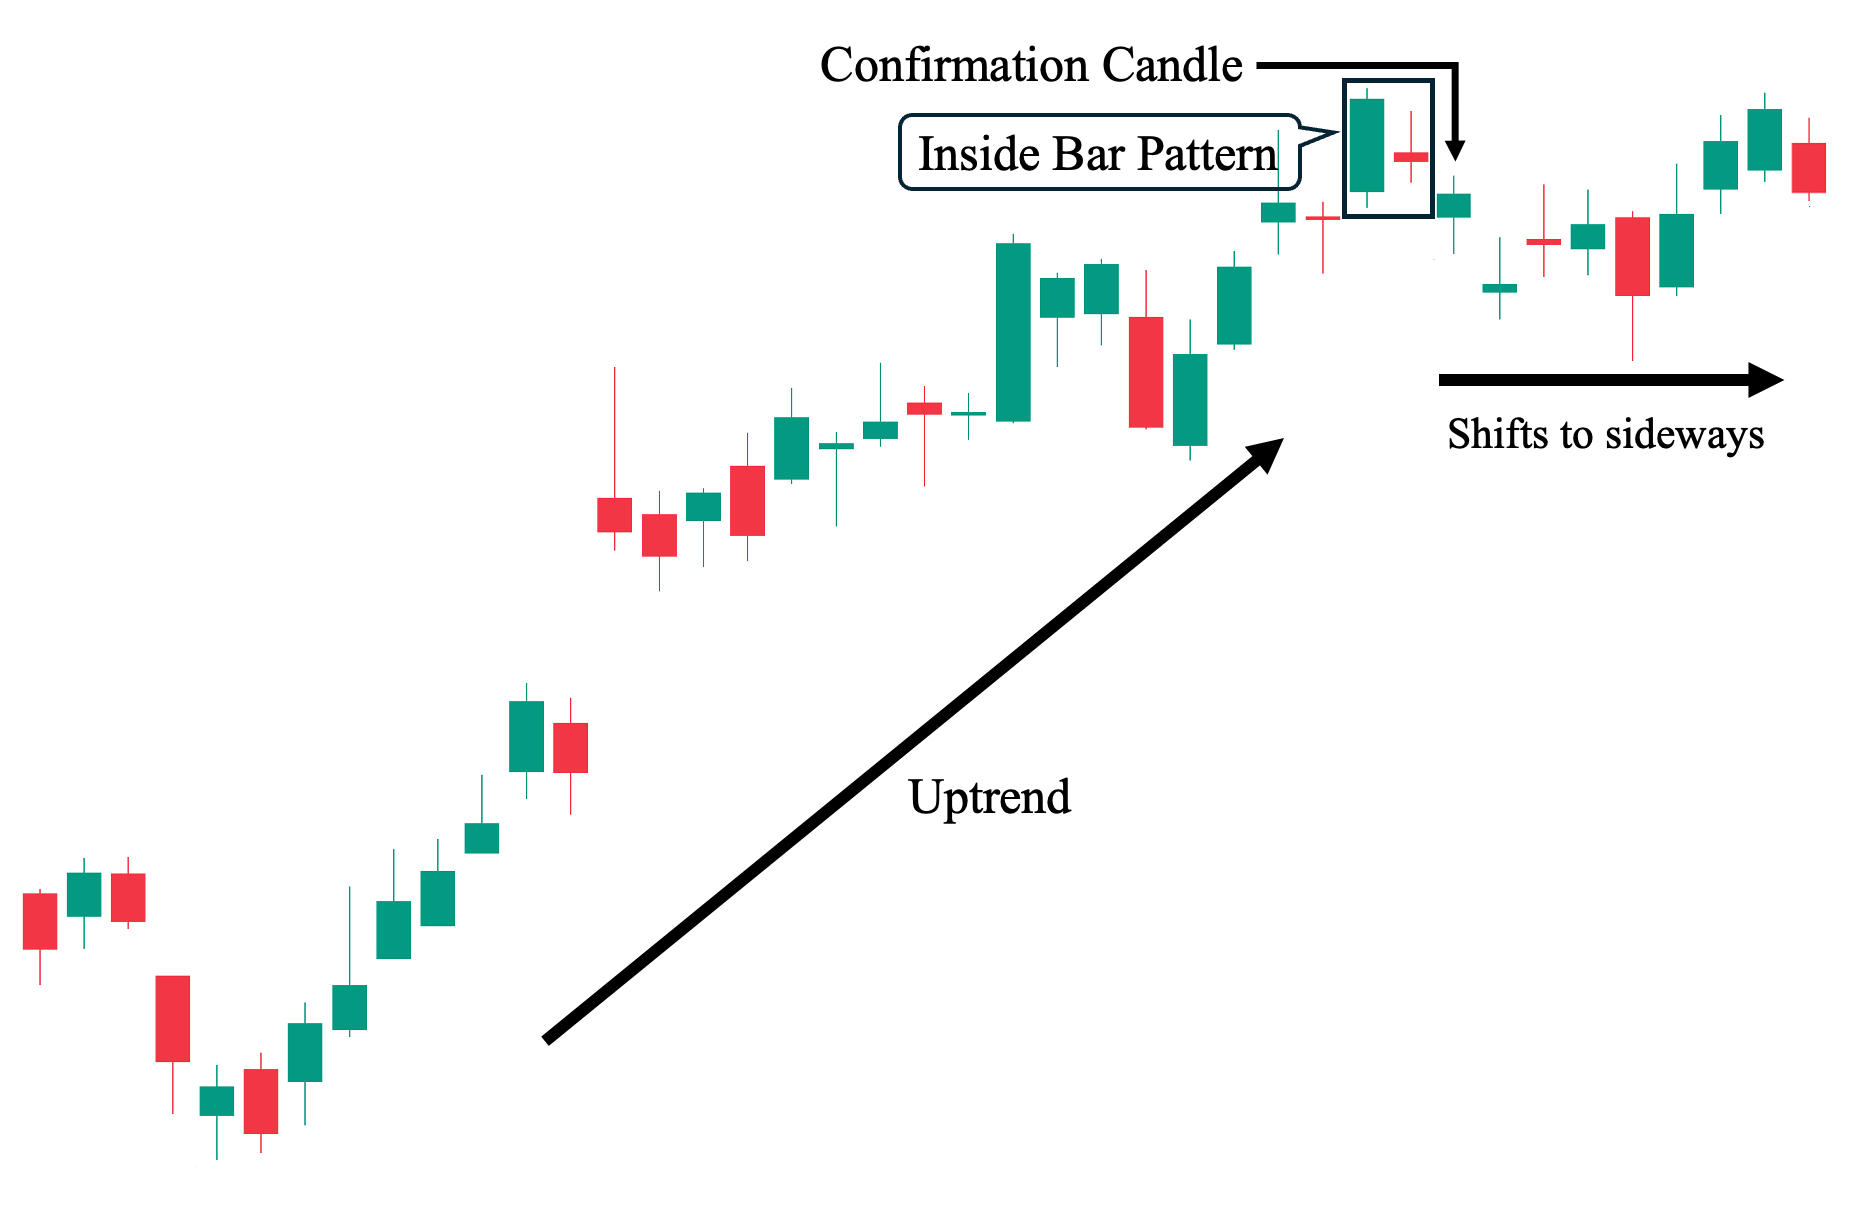
Finally, let’s take a look at example #3. Here, we see a strong uptrend leading into the inside bar pattern. Looking at the two bars, the mother bar is represented by a long-bodied, bullish candle that made a new high, followed by a small bearish candle symbolizing the inside bar. However, unlike the first two trade examples, the third candle—which serves as the confirmation signal—closed below the bodies of the two bars and below the range of the inside bar. This led to a change in market direction from an uptrend to a sideways movement, where it is currently consolidating near the top, bouncing back from the newly established support area, which was previously a resistance level during the uptrend.
In this market environment, where the trend did not reverse but instead shifted to a sideways movement, means that market sentiment remains uncertain for this trade. Therefore, as traders, it’s best to wait for a potential breakdown from the newly established support (for a short position) or a breakout above the previous high (for a long position) as potential trading setups.
Inside Bar Pattern Trading Strategies
Here are various ways to incorporate inside bar patterns with other market analysis tools (e.g., technical indicators) under the following market conditions:
Trading Inside Bars in a Trending Market
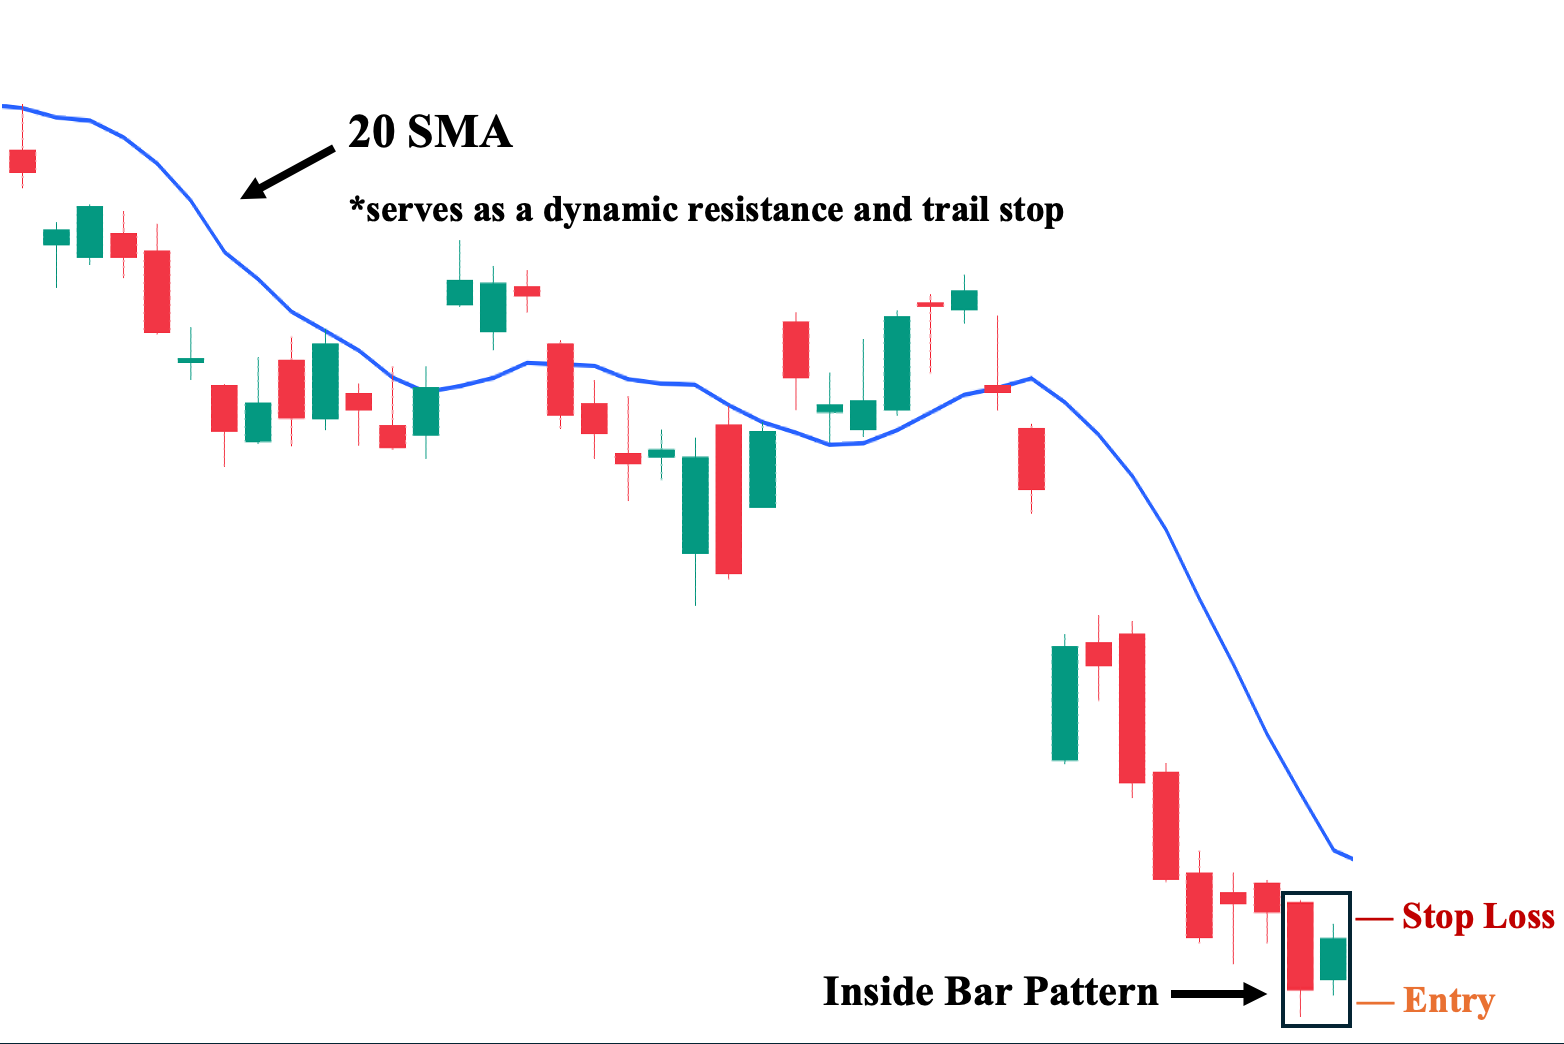
First, in a trending market environment, one strategy that complements an inside bar trading strategy well is the use of one of the most well-known technical indicators—the moving average (MA). Specifically, we are using the 20-period simple moving average (SMA) to act as dynamic resistance and a trailing stop, supporting the static structural pivot points.
As shown, an inside bar pattern developed after a sharp decline in the last few trading sessions. Here, we can see that the high of the previous bar (mother bar) in the pattern made a new lower high and a new lower low before the inside bar candle appeared. From here, two prominent potential outcomes are possible: a continuation of the bearish pattern or the start of a possible bullish reversal. If the 3rd or confirmation candle points downward, here’s a trade plan we can follow:
1. Entry Point: We recommend two potential entry points depending on your risk appetite and timeframe:
a. Aggressive Entry – A few ticks below the inside bar’s low – higher risk, suitable for short-term traders.
b. Conservative Entry – A few ticks below the previous bar’s low (mother bar’s low) – relatively lower risk, better for medium to longer-term traders such as swing and position traders.
2. Stop Loss Points: Depending on your entry, we recommend placing your stop-loss order at one of the following levels:
a. Tight Stop Loss – A few ticks above the inside bar’s high (more appropriate if you used an aggressive entry).
b. Wide Stop Loss – A few ticks above the mother bar’s high (more appropriate if you used a conservative entry).
3. Take Profit (TP) Level: Once the pattern is successful and the price moves further down, set your first TP a few ticks above the nearest structural support area or dynamic support area, using the SMA 20 as shown. You can also use the SMA 20 as a trailing stop for your trade.
4. Risk-Reward Ratio: Must be at least a 1:1 ratio. We strongly advise not taking trades with a risk/reward ratio below 1:1 in any trading situation. The higher the potential reward relative to the risk, the better. That said, make sure you have an objective approach to determining your TP and SL levels.
Trading Inside Bars Against the Prevailing Trend
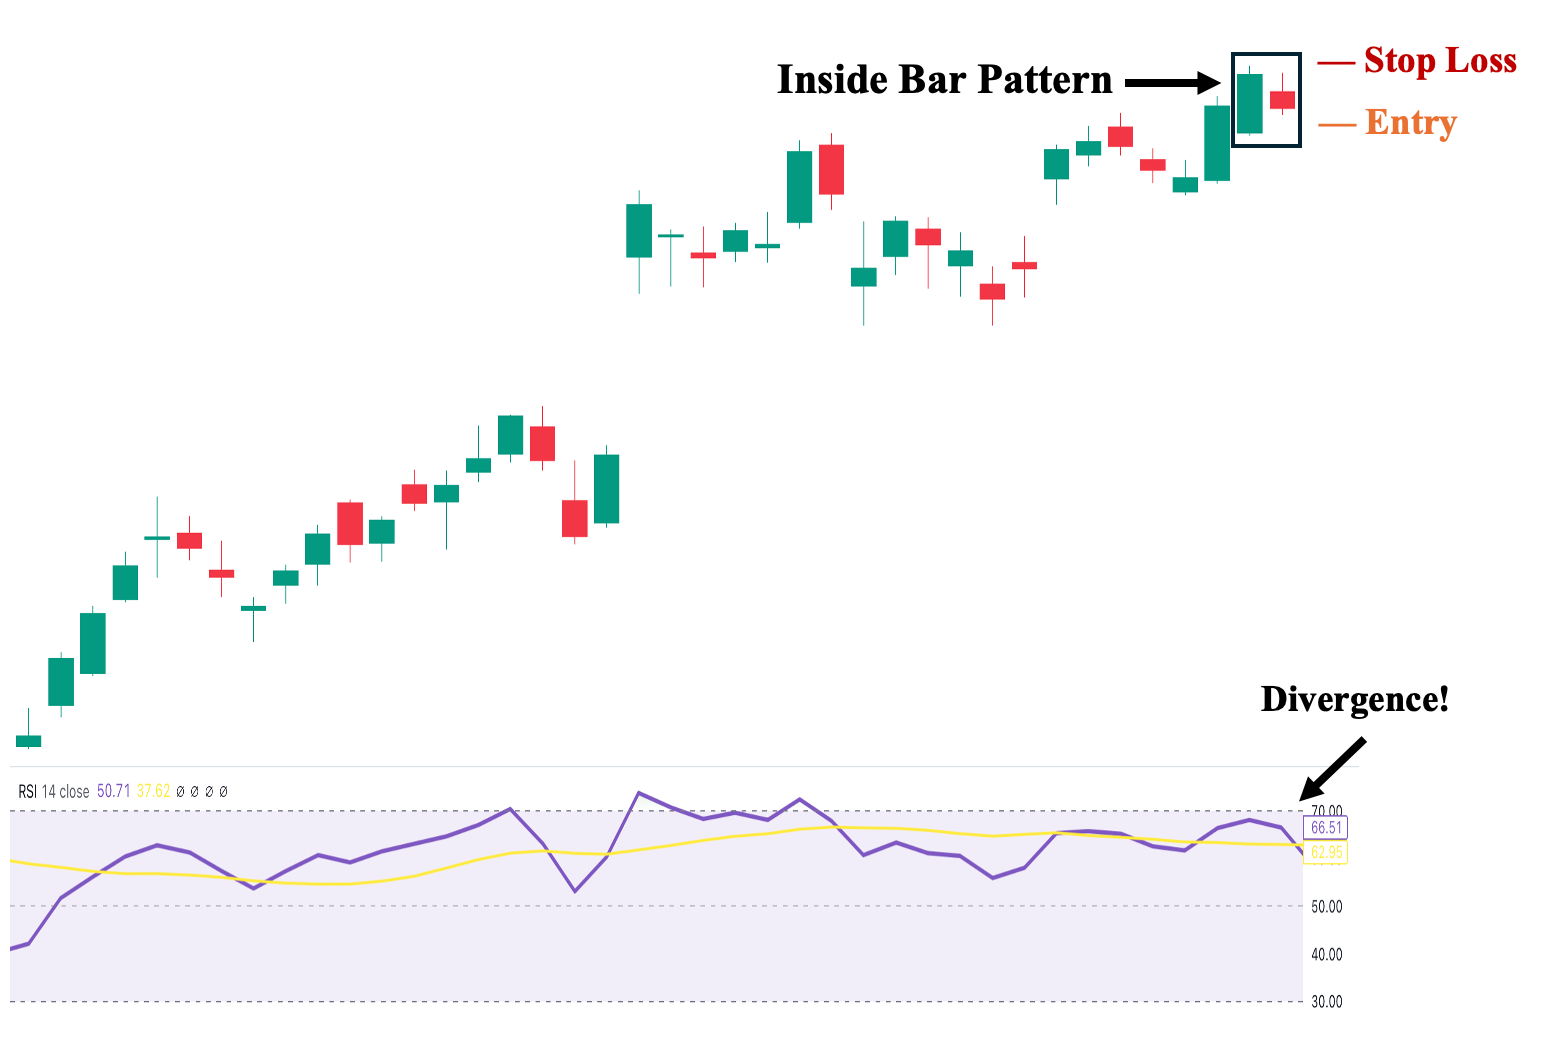
In contrast to the previous example, in this trading scenario, we will utilize an inside bar strategy to trade against the prevailing trend, betting that the price will move in the opposite direction. To do this, we will use one of the most popular technical indicators—specifically, an oscillator—the relative strength index (RSI). However, we will not use the RSI merely to indicate whether the asset is overbought or oversold; instead, we will leverage its ‘leading’ capability as a divergence tool. Simply put, a divergence occurs when the price and a technical indicator move in opposite directions.
When a divergence occurs, we follow the direction indicated by the technical indicator, as it signals an upcoming reversal ahead of other market tools. In the trade illustration above, we observe an established uptrend before the inside bar pattern appeared. However, while the trend remains intact, we notice the RSI diverging and pointing downward. This suggests that a bearish reversal is likely to begin. Therefore, to take a position, here’s a trade plan you can follow:
1. Entry Point: We recommend two potential entry points depending on your risk appetite and timeframe:
a. Aggressive Entry – A few ticks below the inside bar’s low (higher risk, suitable for short-term traders).
b. Conservative Entry – A few ticks below the mother bar’s low (relatively lower risk, better for medium to longer-term traders such as swing and position traders).
2. Stop Loss Points: Depending on your entry, we recommend placing your stop-loss order at one of the following levels:
a. Tight Stop Loss – A few ticks above the inside bar’s high (more appropriate if you used an aggressive entry).
b. Wide Stop Loss – A few ticks above the mother bar’s high (more appropriate if you used a conservative entry).
3. Take Profit (TP) Level: After taking a short position to mirror RSI’s divergence, set your first TP a few ticks above the nearest key support level, which was the previous resistance level during the uptrend.
4. Risk-Reward Ratio: Must be at least a 1:1 ratio. We strongly advise not taking trades with a risk/reward ratio below 1:1 in any trading situation. The higher the potential reward relative to the risk, the better. That said, make sure you have an objective approach to determining your TP and SL levels.
Range Trading Using Inside Bars in Sideways Market
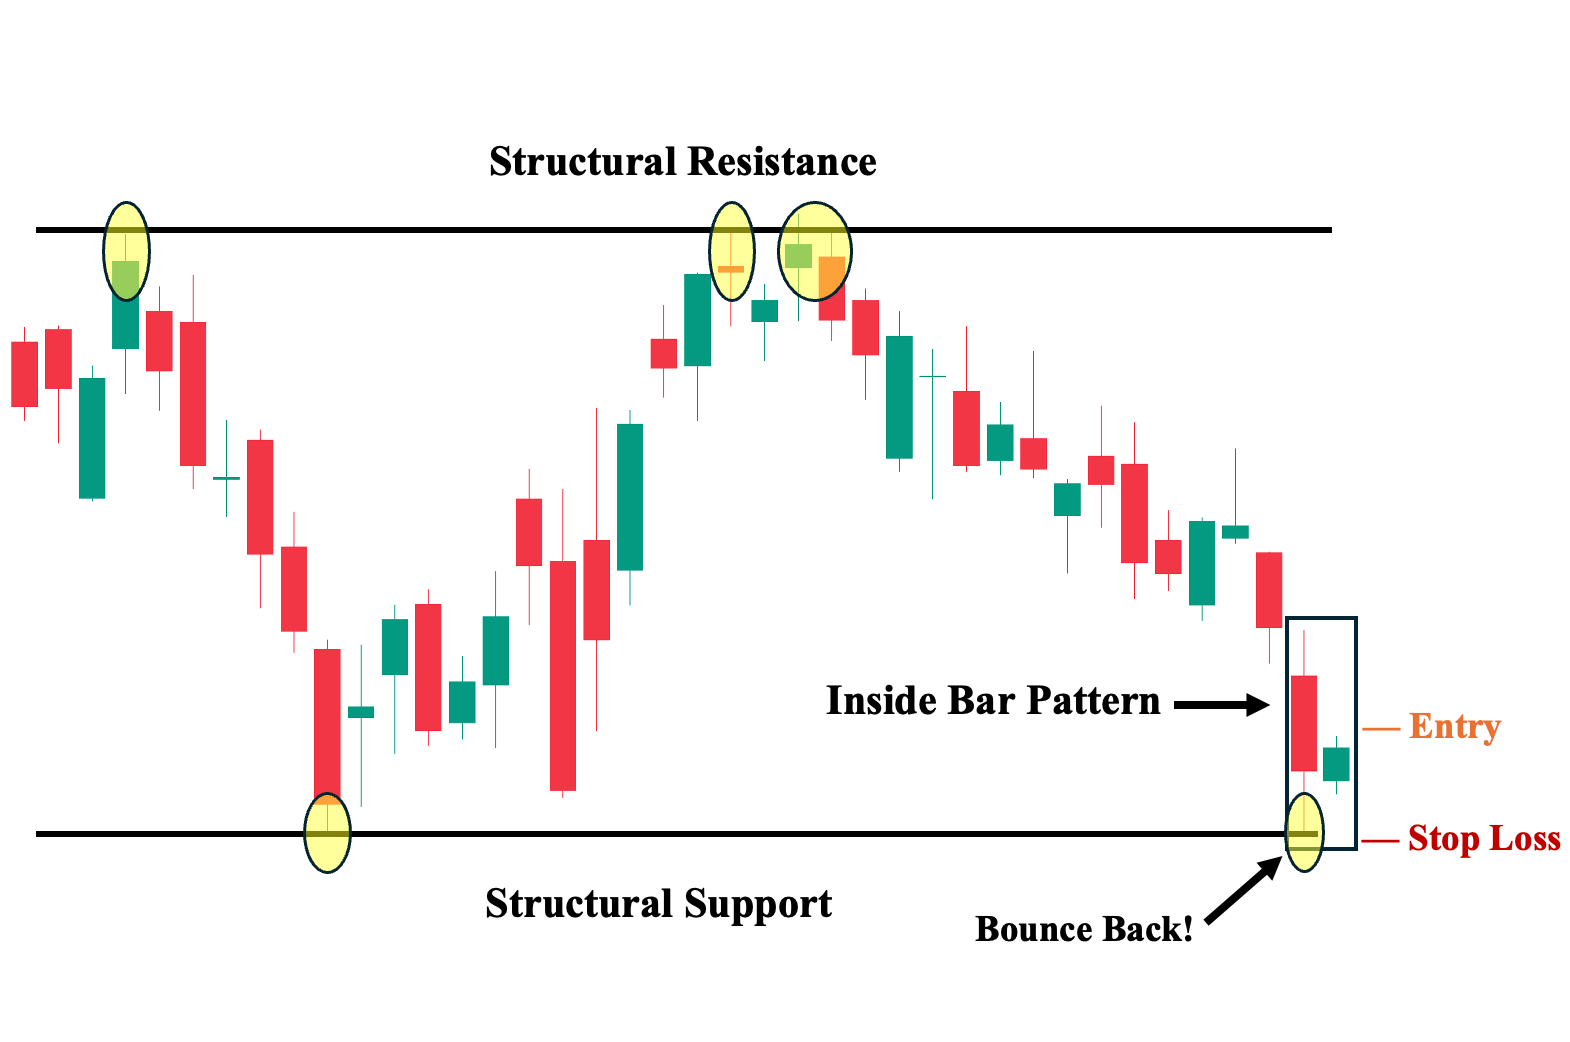
In this scenario, we will utilize the inside bar strategy in a sideways-moving market with established key support and resistance levels. Sideways trading ranges develop for a variety of reasons such as consolidating a larger trend, exhaustion and potential reversal, or simply a trendless market.
We will focus on price action analysis by observing how the price reacts to these key levels and then taking a position to capitalize on these movements. Our main goal is to focus on what truly matters—price action—while avoiding false signals that can arise from using technical indicators without considering the proper price and market context.
As shown, the asset is moving and bouncing back within our identified price range or boundaries. In this scenario, we recommend utilizing the inside bar pattern only when it occurs near these key levels. This is a result of volatility and volume tend to be higher in these areas near the extremes of trading ranges, indicating heightened interest in the asset and making bearish and bullish reversals more likely.
Inside bar patterns work well at those trading range extremes because the pattern suggests a pause. The pattern indicates the market has recognized the larger support and resistance level as important and paused its mini-trend within the larger price range.
Remember, technical analysis is less reliable in low-volatility or low-volume market conditions, where price moves are far more random. With that in mind, here’s a trade plan you can follow:
1. Entry Point: We recommend two potential entry points depending on your risk appetite and timeframe:
a. Aggressive Entry – A few ticks above the inside bar’s high (higher risk, suitable for short-term traders).
b. Conservative Entry – A few ticks above the mother bar’s high (relatively lower risk, better for medium to longer-term traders such as swing and position traders).
2. Stop Loss Points: Since the trade setup is close to a key price level, we recommend placing your sell-stop order just a few ticks below the structural support level, as this may indicate an impending breakdown rather than a price bounce.
3. Take Profit (TP) Level: Set your TP a few ticks below the nearest key structural resistance level, as a bounce back down from that area is likely.
4. Risk-Reward Ratio: Must be at least a 1:1 ratio. We strongly advise not taking trades with a risk/reward ratio below 1:1 in any trading situation. The higher the potential reward relative to the risk, the better. That said, make sure you have an objective approach to determining your TP and SL levels.
Trading Inside Bars in a Breakout
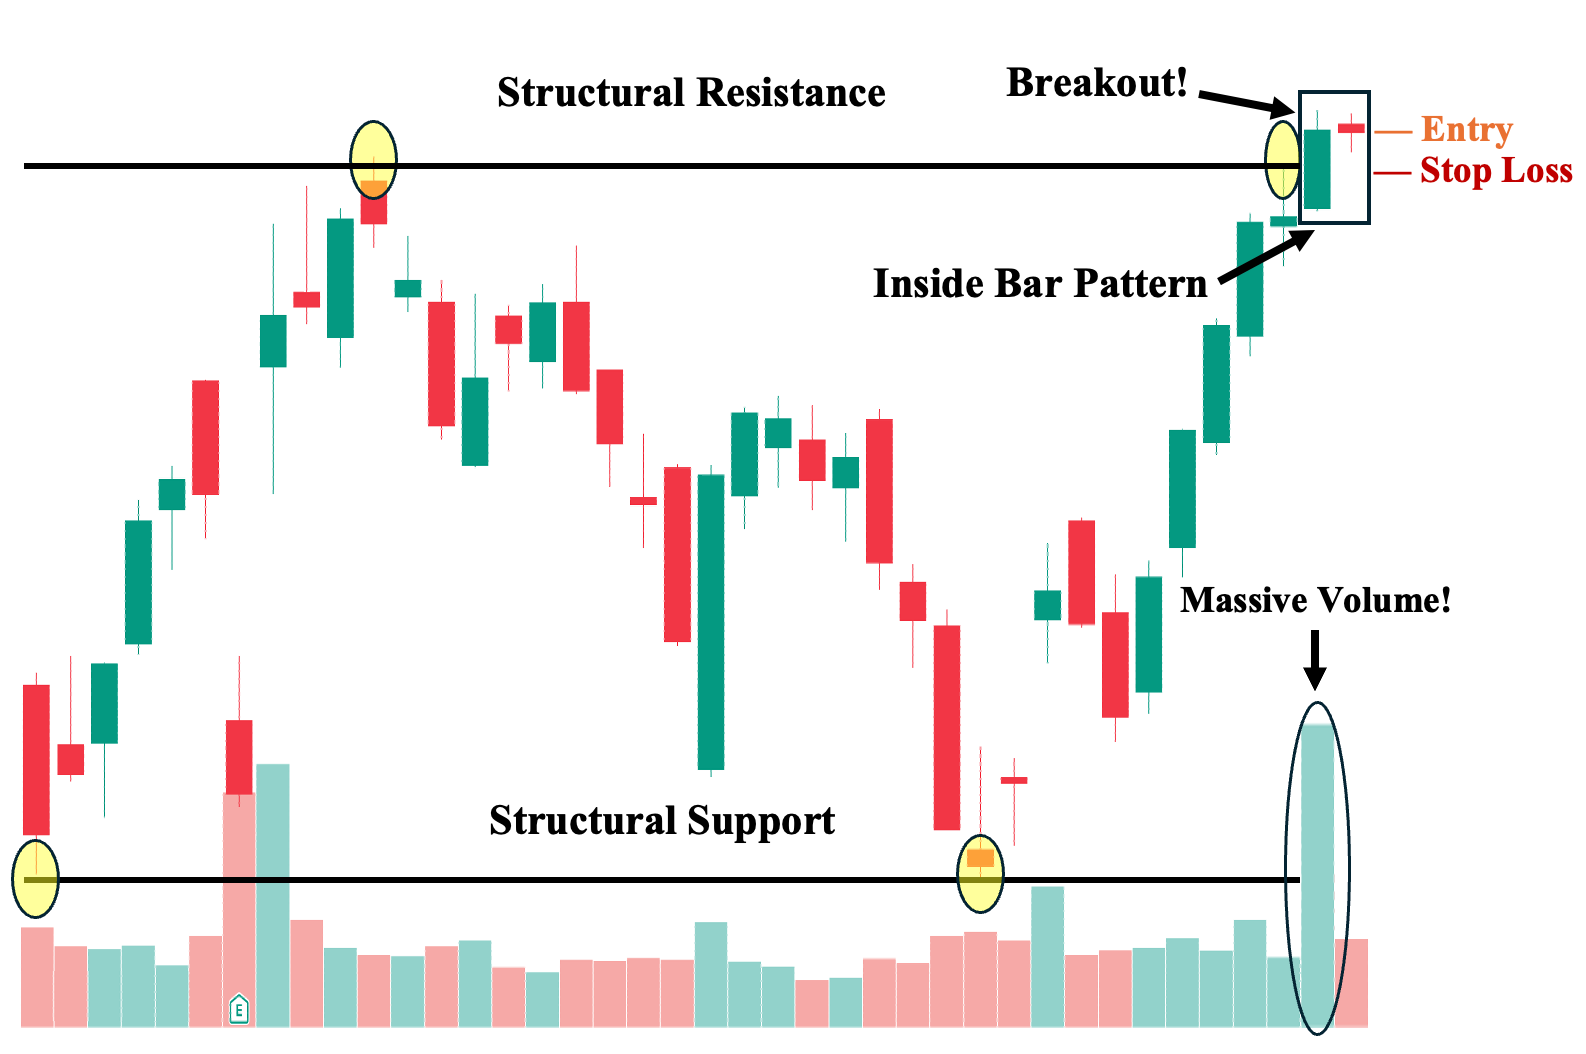
Finally, one of the ideal trade scenarios occurs when the pattern appears after a decisive breakout from established key levels. In this trading strategy, we are essentially looking for a defined range, as in #3, while also watching for potential price breakouts—when the price breaks or closes beyond the previous key level. To enhance our price action analysis, we strongly suggest integrating volume to identify valid breakouts. An ideal breakout is one accompanied by significant volume, as demonstrated above, which confirms the strength of the move and helps to avoid potential ‘fakeouts’ or false breakouts.
1. Entry Point: We recommend taking a position just a few ticks above the structural resistance level. Again, market structure triumphs any candlestick formation. In this situation, a clear breakout by the first candle was supported by a massive volume spike during that trading session.
2. Stop Loss Points: Since the trade setup is close to a key price level, we recommend placing your stop loss just a few ticks below the structural resistance level, as this may signal a “fakeout” or false breakout where the price is likely to return to the established range.
3. Take Profit (TP) Level: Set your TP a few ticks below the next structural resistance level
4. Risk-Reward Ratio: Must be at least a 1:1 ratio. We strongly advise not taking trades with a risk/reward ratio below 1:1 in any trading situation. The higher the potential reward relative to the risk, the better. That said, make sure you have an objective approach to determining your TP and SL levels.
15 Minute Inside Bar Strategy
When trading on a smaller intraday price chart, like the 15-minute chart, traders need to be aware of the typical market conditions. For example, the heaviest volume, and therefore most trending opportunities in forex appear during the London and New York sessions. Outside of this time period, the forex market is known to stagnate and not produce strong trends.
Since the Inside Bar strategy is a breakout strategy, when implementing it on the 15-minute chart you’ll want to consider opportunities between 8am London to noon New York time as this period represents the greatest potential for a breakout.
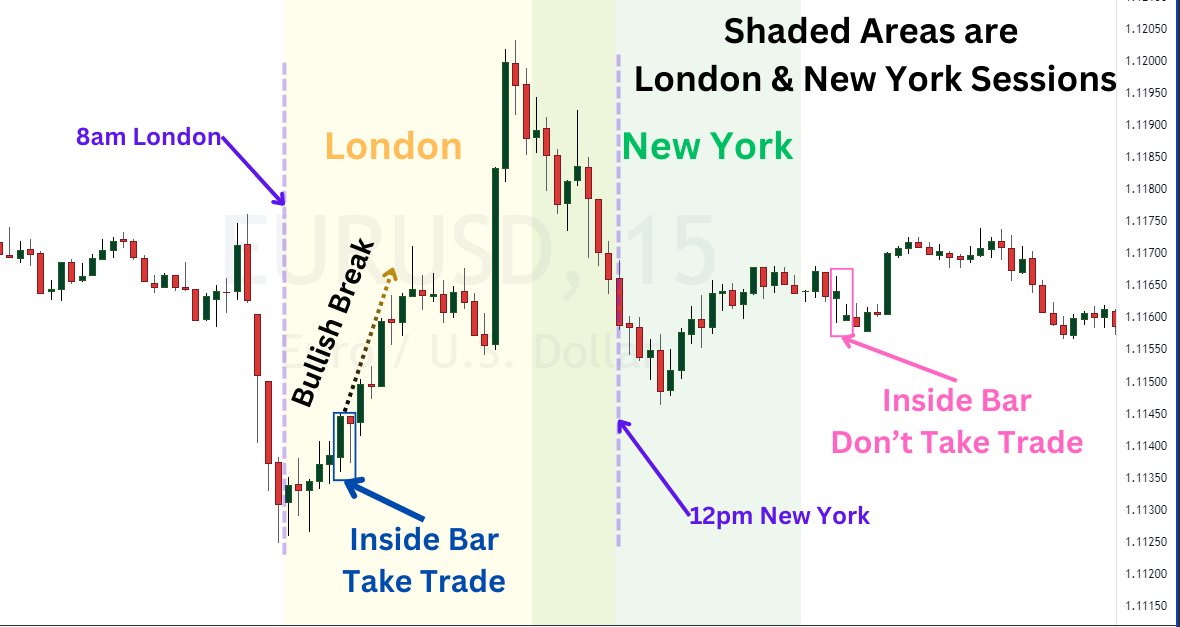
If an inside bar pattern develops during the 8a London to 12p noon New York session, then take an inside bar setup buying a break above the mother bar high or short a break below the mother bar low.
If an inside bar setup develops outside of those hours, then do not take the trade as the market is less likely to trend far enough to yield a positive risk to reward ratio.
1. Entry Point: We recommend taking a position just a few ticks above the structural resistance level for a buy break or just below the support level in a sell break. Again, market structure triumphs any candlestick formation. In this situation, a clear breakout by the first candle was supported by a massive volume spike during that trading session.
2. Stop Loss Points: Place a stop loss at the other side of the break on the mother bar. If price breaks higher, then set the stop loss just below the low of the mother bar. If the price breaks lower, then set the stop loss just above the high of the mother bar.
3. Take Profit (TP) Level: Set your TP at 2x the distance to your stop loss. If the stop loss is 20 pips, then set the target at 40 pips.
4. Risk-Reward Ratio: Must be at least a 1:2 risk to reward ratio. We strongly advise not taking trades with a risk/reward ratio below 1:1 in any trading situation. The higher the potential reward relative to the risk, the better. That said, make sure you have an objective approach to determining your TP and SL levels.
Trading Inside Bar with Relative Strength Index
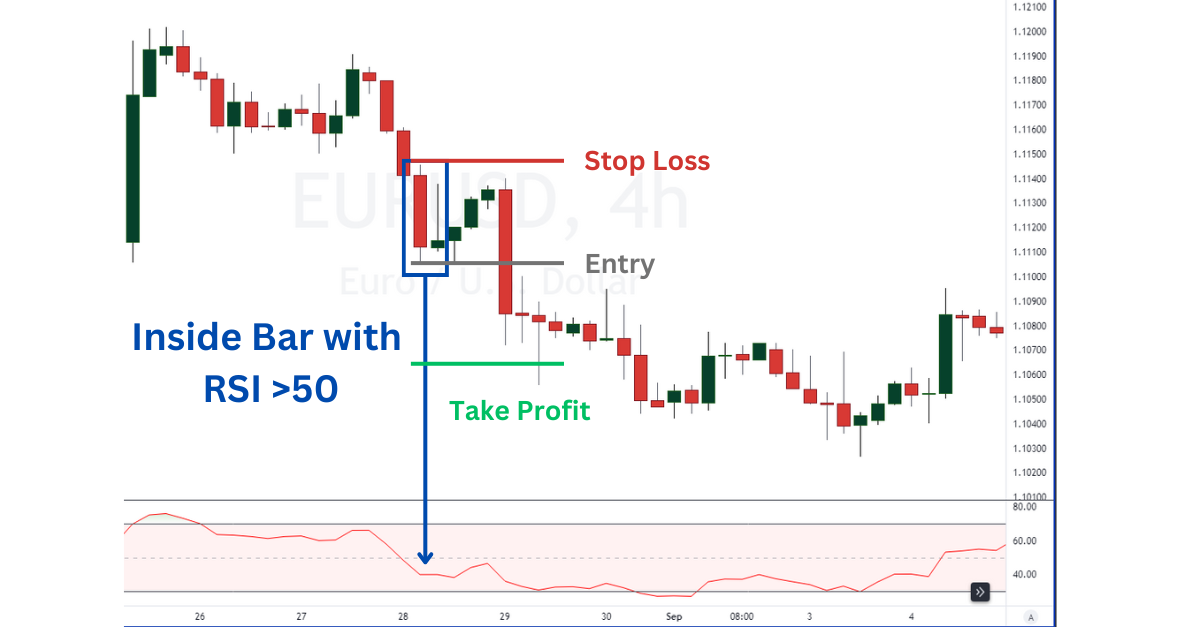
You can use the Relative Strength Index (RSI) as a tool to help confirm that direction of a potential breakout. Any RSI values above 50 suggest that there has been strength behind the price trend. Any RSI value less than 50 exhibits weakness.
When an inside bar develops, check the RSI oscillator to gauge whether there is underlying strength or weakness in the market. In the EURUSD example above, then the inside bar pattern appeared, the RSI value was at 40 exhibiting a weak price trend.
Therefore, a trader could anticipate a break and trade accordingly.
1. Entry Point: Once the RSI value is observed, take trades in the direction of the RSI value. If RSI > 50, then take a long position just a few ticks above the mother bar high. If RSI < 50, then take a short sell position just a few ticks below the mother bar low.
2. Stop Loss Points: Place a stop loss at the other side of the mother bar. For long positions, place the stop loss just below the low of the mother bar. For short sell positions, set the stop loss just above the high of the mother bar.
3. Take Profit (TP) Level: Set your TP at 1x or 2x the distance to your stop loss. If the stop loss is 20 pips, then set the target at 20 (or 40) pips.
4. Risk-Reward Ratio: Must be at least a 1:1 risk to reward ratio. We strongly advise not taking trades with a risk/reward ratio below 1:1 in any trading situation. The higher the potential reward relative to the risk, the better. That said, make sure you have an objective approach to determining your TP and SL levels.
Trading Inside Bar with Moving Averages
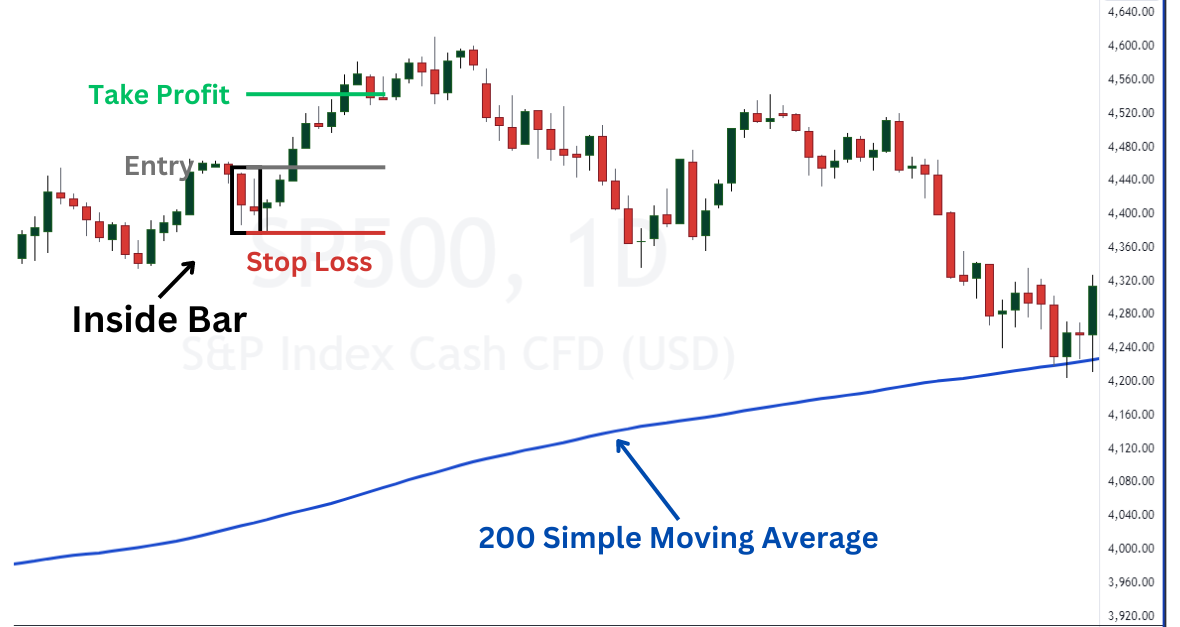
The moving average is one of the most straightforward tools for determining the direction of the trend. We can couple that with the inside bar pattern. If the inside bar setup takes place above the moving average, then we’ll anticipate a bullish breakout as the market has been in a bullish trend.
If the inside bar pattern develops below the moving average, then we’ll anticipate a bearish breakout.
In the example above, a nice inside bar setup appears in the SP500 daily chart. Since the current price was above the 200 period simple moving average, then we would anticipate a bullish breakout. A couple of candles later and the price did break above the high of the inside bar pattern.
1. Entry Point: Once the inside bar pattern is observed, take note of its placement relative to the moving average. Take trades in the direction of the moving average filter. If price > the moving average, then take a long position just a few ticks above the mother bar high. If price < the moving average, then take a short sell position just a few ticks below the mother bar low.
2. Stop Loss Points: Place a stop loss at the other side of the mother bar. For long positions, place the stop loss just below the low of the mother bar. For short sell positions, set the stop loss just above the high of the mother bar.
3. Take Profit (TP) Level: Set your TP at 1x or 2x the distance to your stop loss. If the stop loss is 20 pips, then set the target at 20 (or 40) pips.
4. Risk-Reward Ratio: Must be at least a 1:1 risk to reward ratio. We strongly advise not taking trades with a risk/reward ratio below 1:1 in any trading situation. The higher the potential reward relative to the risk, the better. That said, make sure you have an objective approach to determining your TP and SL levels.
Trading Inside Bar with MACD
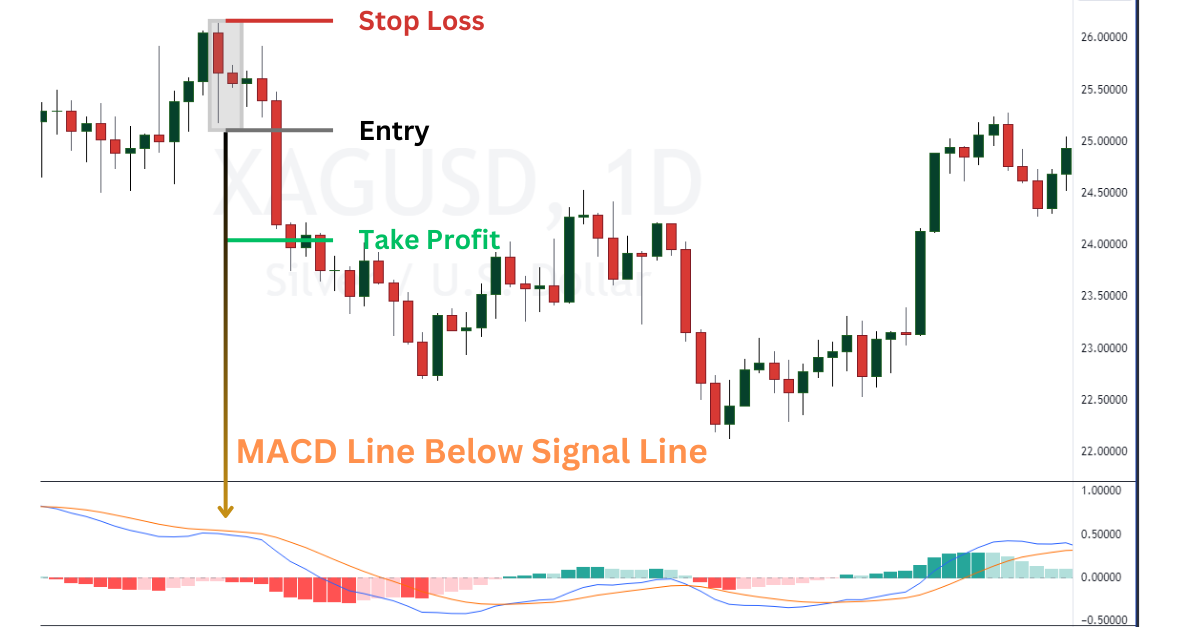
MACD is a unique indicator that can be combined with the inside bar pattern. The MACD is a trend following tool and when you have a consolidation pattern like inside bar, the MACD can provide insight to the potential direction of the breakout.
When the inside bar setup is spotted, determine how the MACD line is positioned relative to its signal line. In the silver example agove, the MACD line (blue) is below the MACD signal (orange). This creates red bars on the histogram and suggests the daily trend is considered down.
Therefore, a trade would anticipate a bearish break below the inside bar pattern.
1. Entry Point: Once the inside bar pattern is observed, take note of the placement of the MACD line relative to the MACD signal line. Filter trades in the direction of the MACD line relative to the signal line. If MACD line > MACD signal line, then take a long position just a few ticks above the mother bar high. If the MACD line < MACD signal line, then take a short sell position just a few ticks below the mother bar low.
2. Stop Loss Points: Place a stop loss at the other side of the mother bar. For long positions, place the stop loss just below the low of the mother bar. For short sell positions, set the stop loss just above the high of the mother bar.
3. Take Profit (TP) Level: Set your TP at 1x or 2x the distance to your stop loss. If the stop loss is 50 pips, then set the target at 50 (or 100) pips.
4. Risk-Reward Ratio: Must be at least a 1:1 risk to reward ratio. We strongly advise not taking trades with a risk/reward ratio below 1:1 in any trading situation. The higher the potential reward relative to the risk, the better. That said, make sure you have an objective approach to determining your TP and SL levels.
Inside Bar Pattern and Forex Trading
Inside bars are one of the many Japanese candlestick patterns traders follow in the forex market. The forex market is one of the largest in the world and therefore, attracts many buyers and sellers.
Therefore, when the inside bar forms, the pattern hints that the market is consolidating the previous trend. As a result, the consolidation is not expected to last and traders can anticipate a breakout in the direction of the new trend.
When you have an abundance of buyers and sellers, like in the forex market, the signals from candlestick patterns can be strong.
Advantages of Trading the Inside Bar Setup
The following are the three key advantages of using the inside bar patterns:
1. Flexible Use Case Versus Other Candlestick Patterns
First, unlike other candlestick patterns that have specific use cases and are only applicable to certain market conditions, the inside bar setup offers a more versatile use case in trading. It can help determine whether a trend will continue, shift to a non-trending market condition, or reverse altogether. Additionally, it can identify specific shifts in market sentiment depending on its position on the chart and the relative size of the two bars. This versatility is particularly beneficial for experienced traders who can effectively utilize the pattern and incorporate other technical analysis tools into their trading system.
2. Potential for Attractive Trades in Terms of Risk-Reward Ratio
Second, inside bars can offer well-defined and attractive risk-reward trade-offs. This is because the candle itself can form the entire trade setup. Specifically, traders can place viable entry and exit orders based solely on the mother bar or the inside bar candle. Since inside bars are inherently smaller in relative size, they allow for entry and stop-loss points that are close to each other, particularly when compared to your target price.
3. Clear Exit Ways
Third, inside bars can provide clear exit conditions for most traders in both successful and unsuccessful trades, leaving little room for second-guessing, especially if you have recorded your trade conditions. For example, both the entry and stop-loss points can be based on the opposite direction of the range of the mother bar or the inside bar candle. This clarity contrasts with other candlestick patterns, where determining entry and stop-loss points can be more tricky.
Disadvantages of Trading the Inside Bar Setup
The following are the three crucial disadvantages of using the inside bar patterns:
1. Potential for Whipsaws
First, traders may encounter false signals when an inside bar setup appears on their chosen time frames. While whipsaws can occur with any candlestick pattern, they can be more pronounced with inside bars. This is because traders often rush to act on this setup without fully considering market context, sentiment, and the overall price structure. Even when ‘confirmed’ by the third candle, inside bar trade setups should not be viewed as foolproof signals.
2. Unreliable on its Own, Particularly for Beginners
Second, relying solely on inside bar setups is unreliable, especially for beginners. This is because market context is incomplete without considering the accompanying volume and the market structure in which the setup appears. Remember, market context is crucial. However, this doesn’t mean you should rely on multiple technical indicators, as that can be counterproductive. Instead, we recommend mastering price action, market structure, and volume analysis as the foundation of your trading strategy. Jumping between different technical indicators can lead to poorer trading decisions.
3. Position Sizing Issues
Third, a genuine dilemma exists in deciding which reference to use in the inside bar setup—the mother bar or the inside bar candle. Depending on your trading preference, your position sizing can vary significantly. The mother bar is often much larger than the inside bar candle, leading to a wider stop loss and potentially delayed entries. Conversely, using the inside bar candle may result in premature stop-outs or entries that are too early. Therefore, it’s crucial to determine which bar or candle aligns better with your trading approach.
Double Inside Bar Pattern
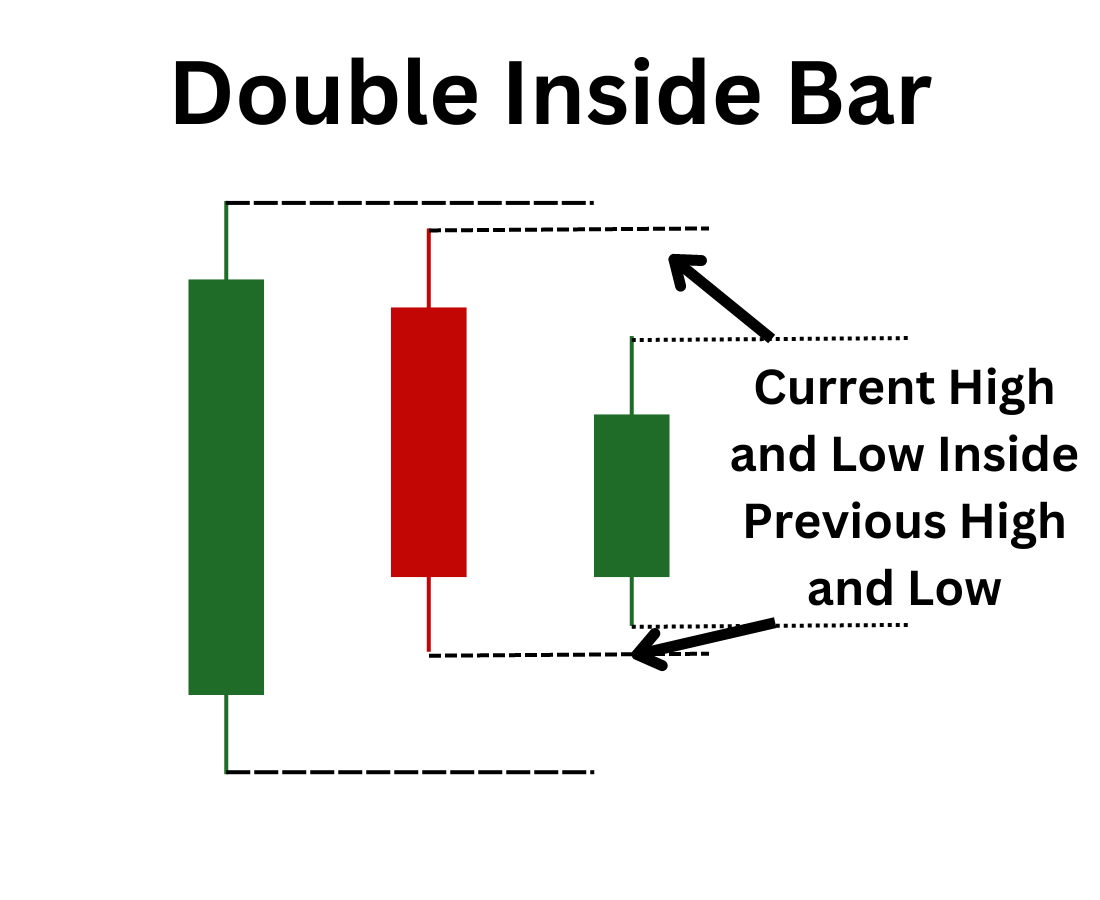
The double inside bar pattern is a variation of the traditional inside bar. The double inside bar set up is a three candle formation of two inside bars. The first candle is the mother bar. The second candle plays both the part of an inside bar to the first candle AND as the mother bar to the third candle.
In essence, the high and low of the third candle is contained within the high and low range of the second candle while the second candle’s range is contained within the first candle’s range. The price keeps squeezing tighter and tighter like a coiling spring getting ready to pop.
Inside Bar Pattern vs. Outside Bar Pattern Key Reversal Pattern
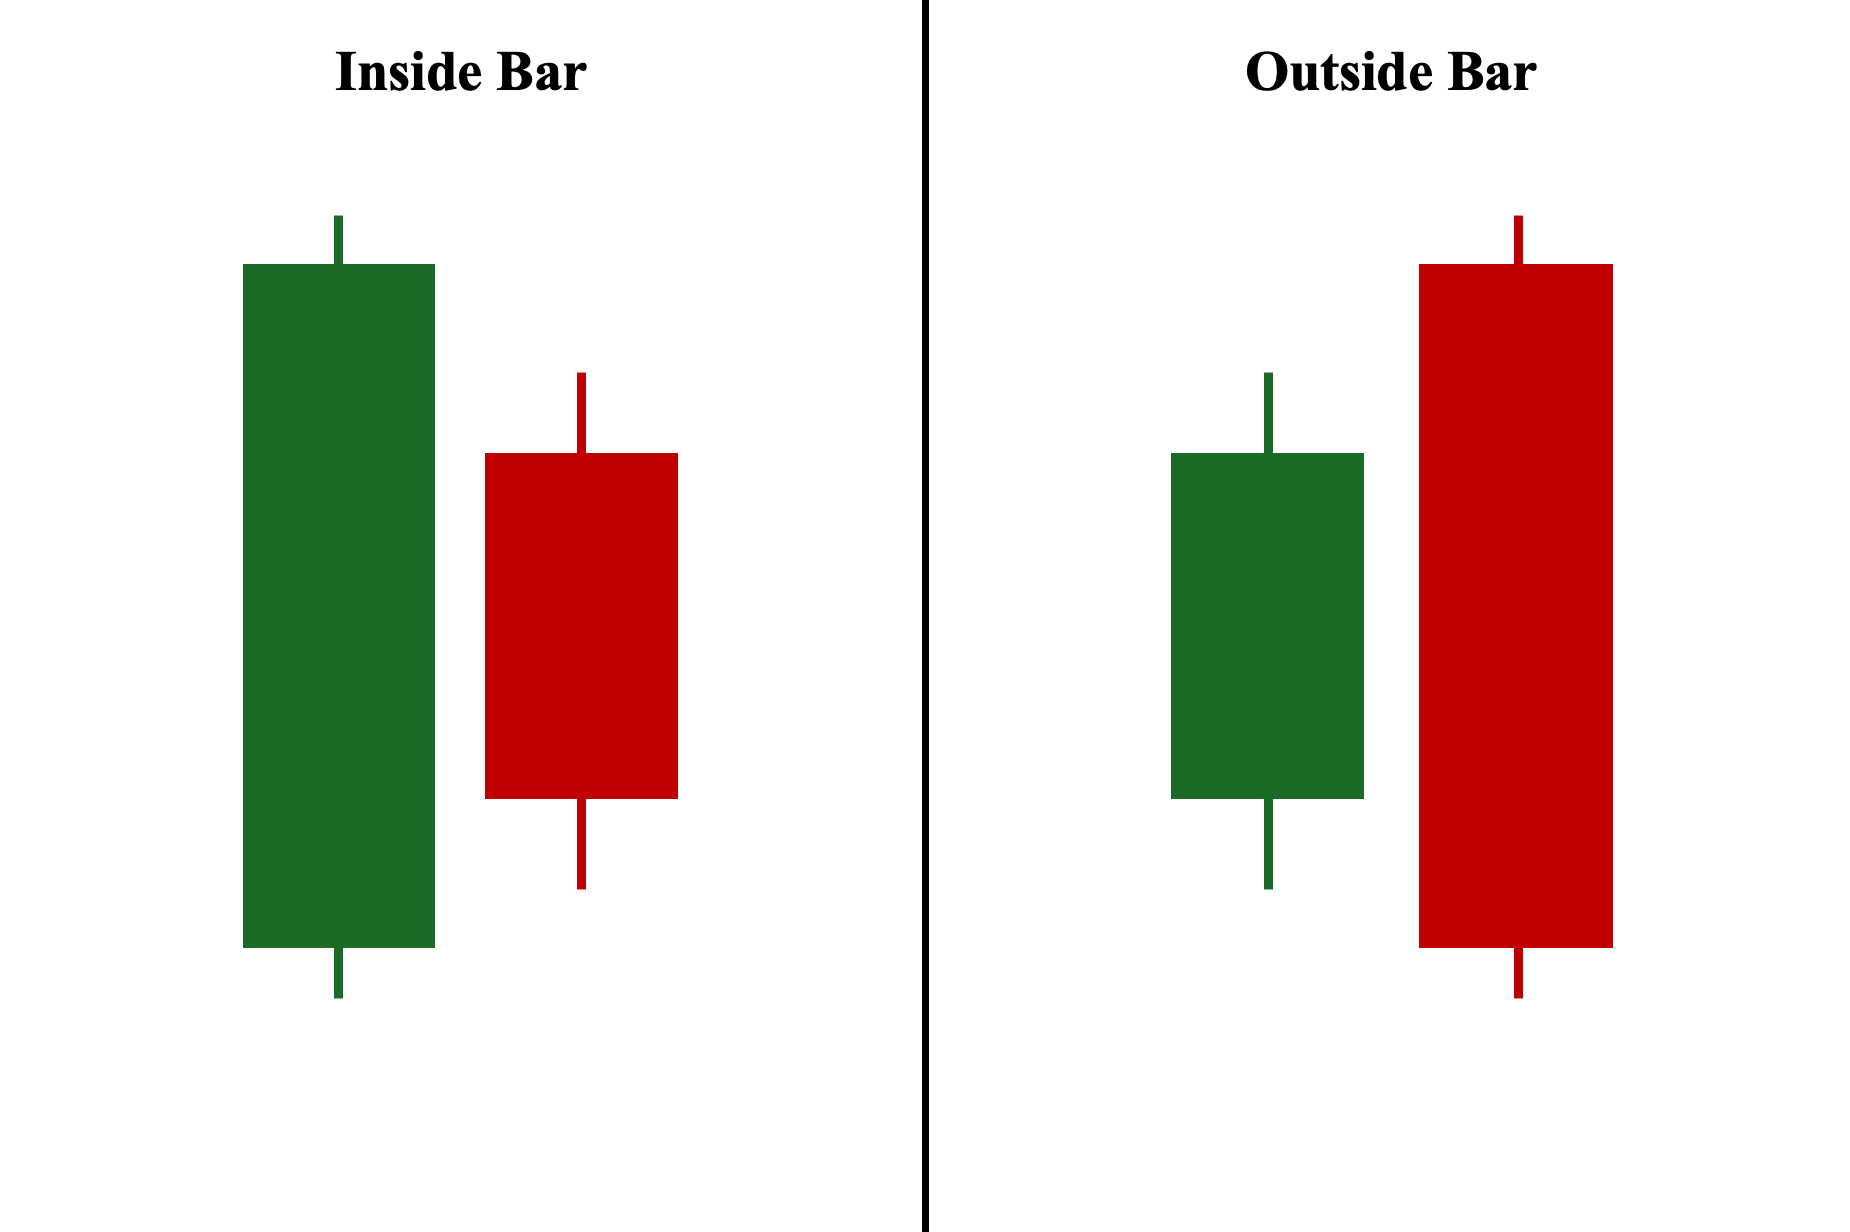
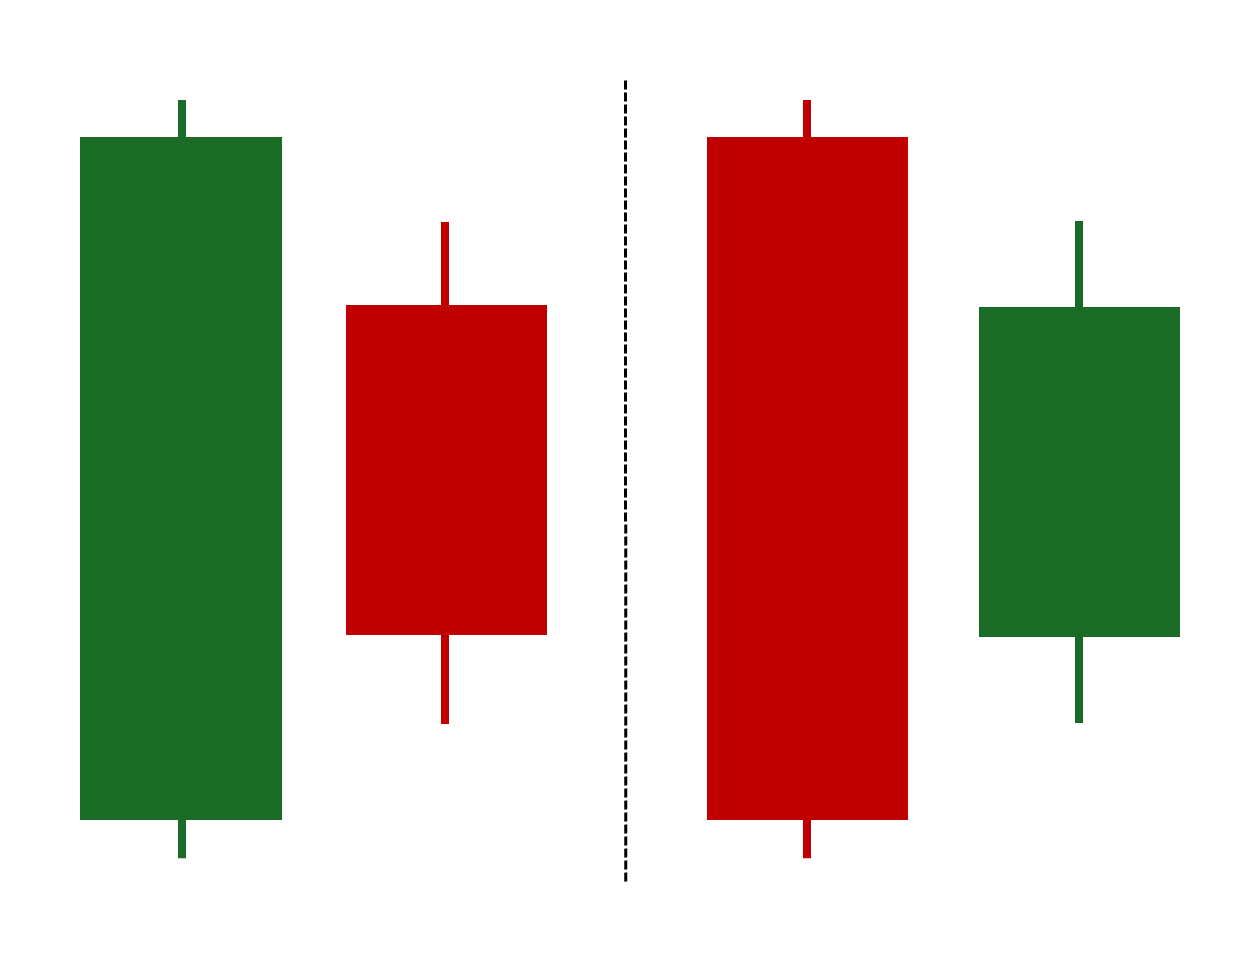
Both the inside bar and outside key reversal are two-candle patterns that consist of one long-bodied candle and a shorter candle. The key difference between them lies in their sequence. In fact, they are mirror images of each other: the inside bar has the long candle first, followed by the short candle, while the outside key reversal has the short candle first, followed by the long candle. However, they differ significantly in meaning. The outside bar’s sentiment is defined by the color of its second candle, while the inside bar’s significance is based on its position on the chart, not the color of its candles.
Inside Bar Pattern vs. Narrow Range 4 (NR4) Pattern
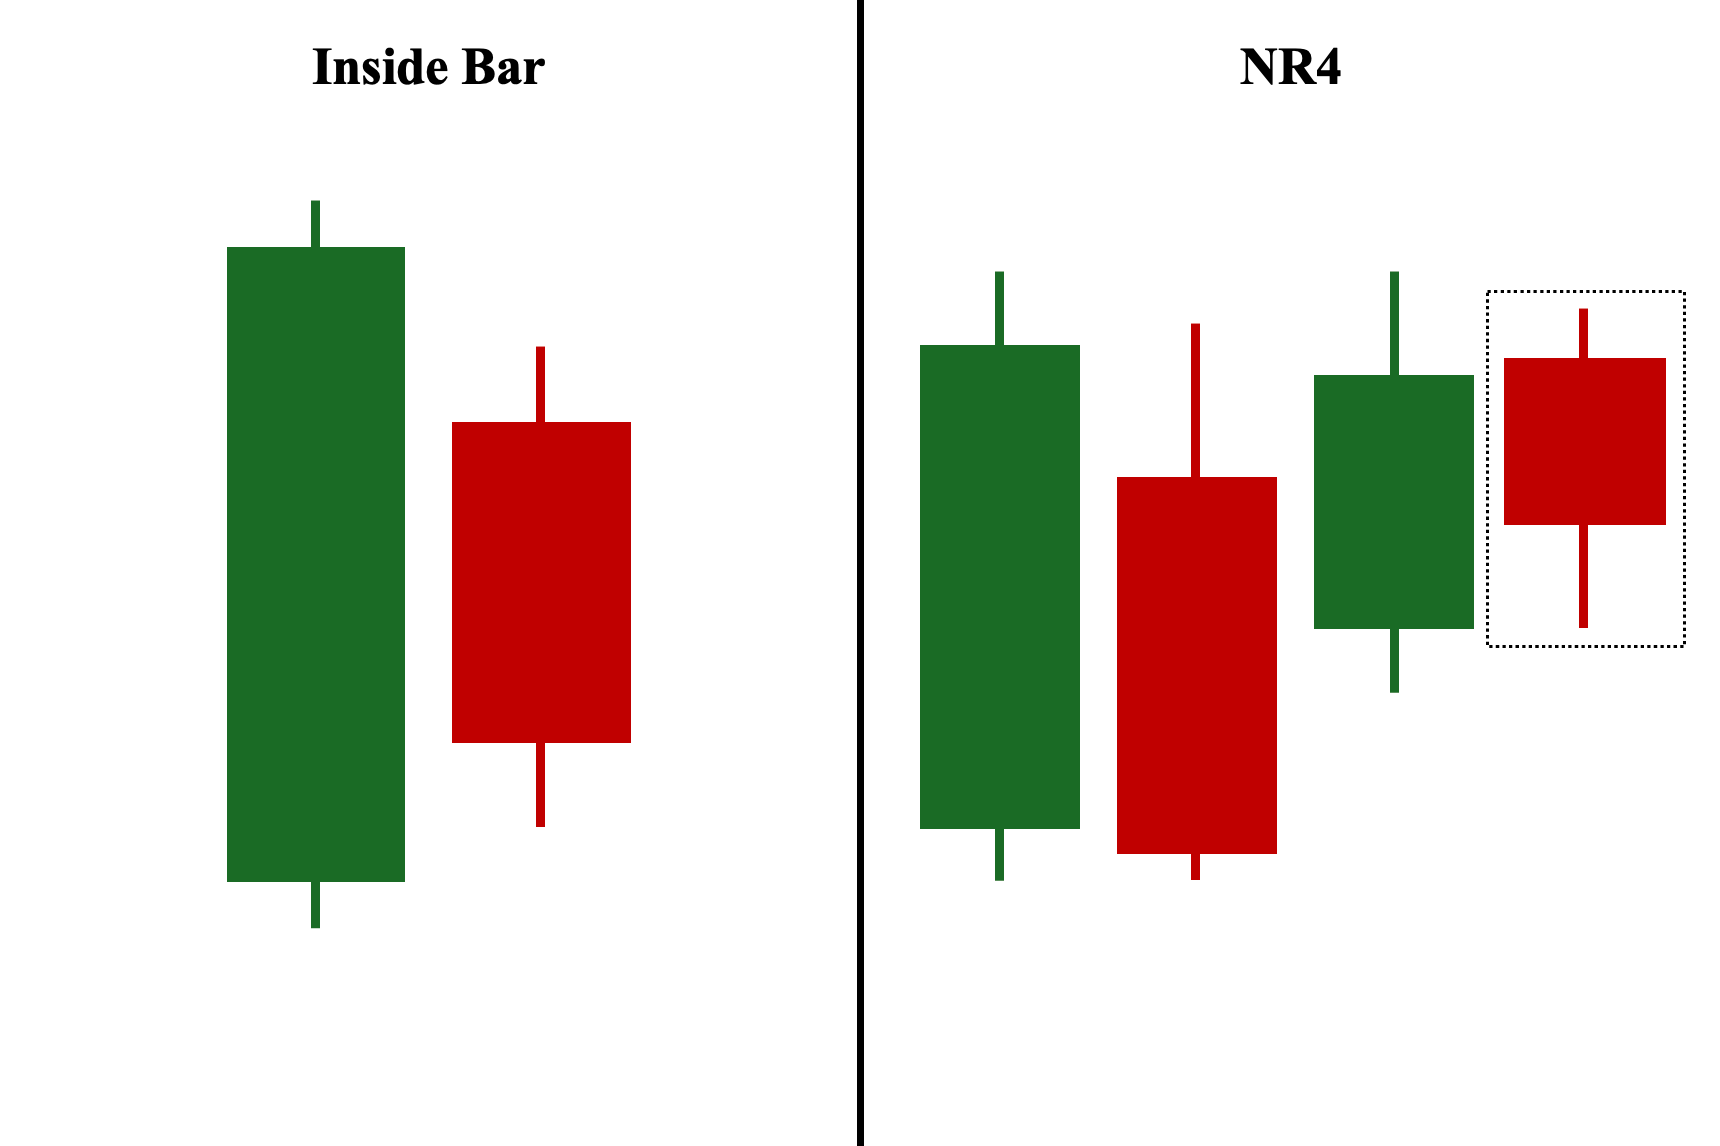
The inside bar pattern differs from the NR4 pattern regarding the number of candlesticks involved. For those unfamiliar, NR4 was a pattern discovered by Tony Crabel that has similar characteristics to the inside bar.
However, in terms of significance, they are more similar than many other candlestick patterns. This is because both represent a period of indecision and uncertainty about the direction of the price movement. In fact, an inside bar can evolve into an NR4 pattern if it is followed by two additional indecisive candles. Ultimately, the key requirement for an NR4 is that the fourth candle must have the narrowest (smallest) range among the last four candles.
Note: Unlike the inside bar pattern, where the second candle must be completely covered by the first candle’s range, in the NR4 pattern, the second, third, and fourth candles can move outside of the first candle’s range. Furthermore, when an inside bar forms on the 4th candle of the NR4 pattern, it is now called the Inside Day (ID)/NR4 pattern. This pattern is considered even stronger since it combines two significant consolidation signals: a Narrow Range 4 (NR4) and an inside bar.
Inside Bar Pattern vs. Narrow Range 7 (NR7) Pattern
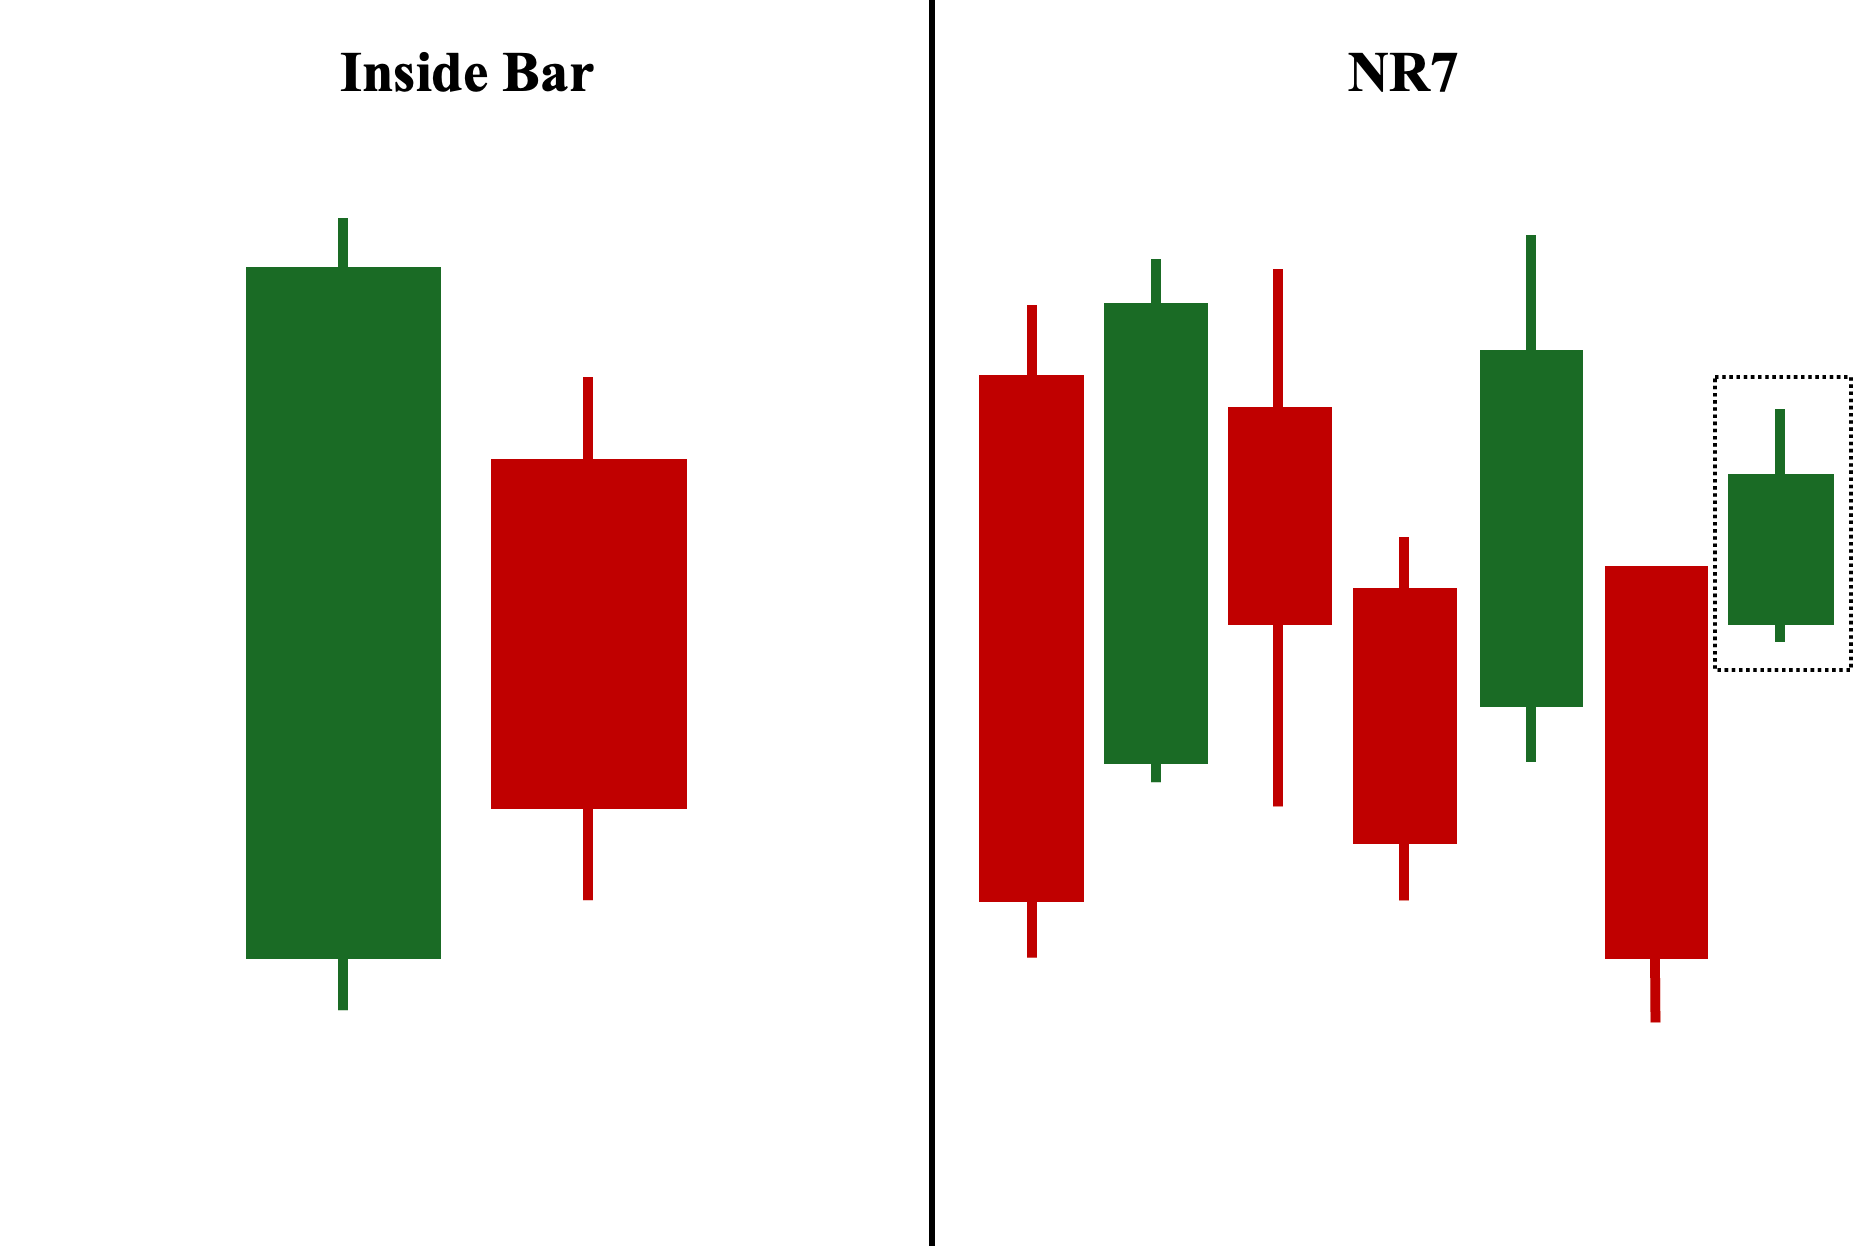
NR7 is similar to NR4, with the key difference being that NR7 refers to the narrowest (smallest) range among seven consecutive candles. An NR4 pattern can evolve into an NR7 if the 7th candle has the smallest range among the last seven candles. Additionally, NR7 is considered more significant due to the longer period of consolidation, often leading to a stronger breakout compared to NR4 or the Inside Bar pattern.
Note: Similar to NR4, the NR7 pattern allows the subsequent candles to move outside the first candle’s range, whereas the second candle in the inside bar pattern must be completely covered by the first candle’s range. Also, when an inside bar forms on the 7th candle of the NR7 pattern, it now becomes the Inside Day (ID)/NR7 pattern. This pattern is even more significant than the ID/NR4.
Inside Bar Pattern vs. Doji Pattern
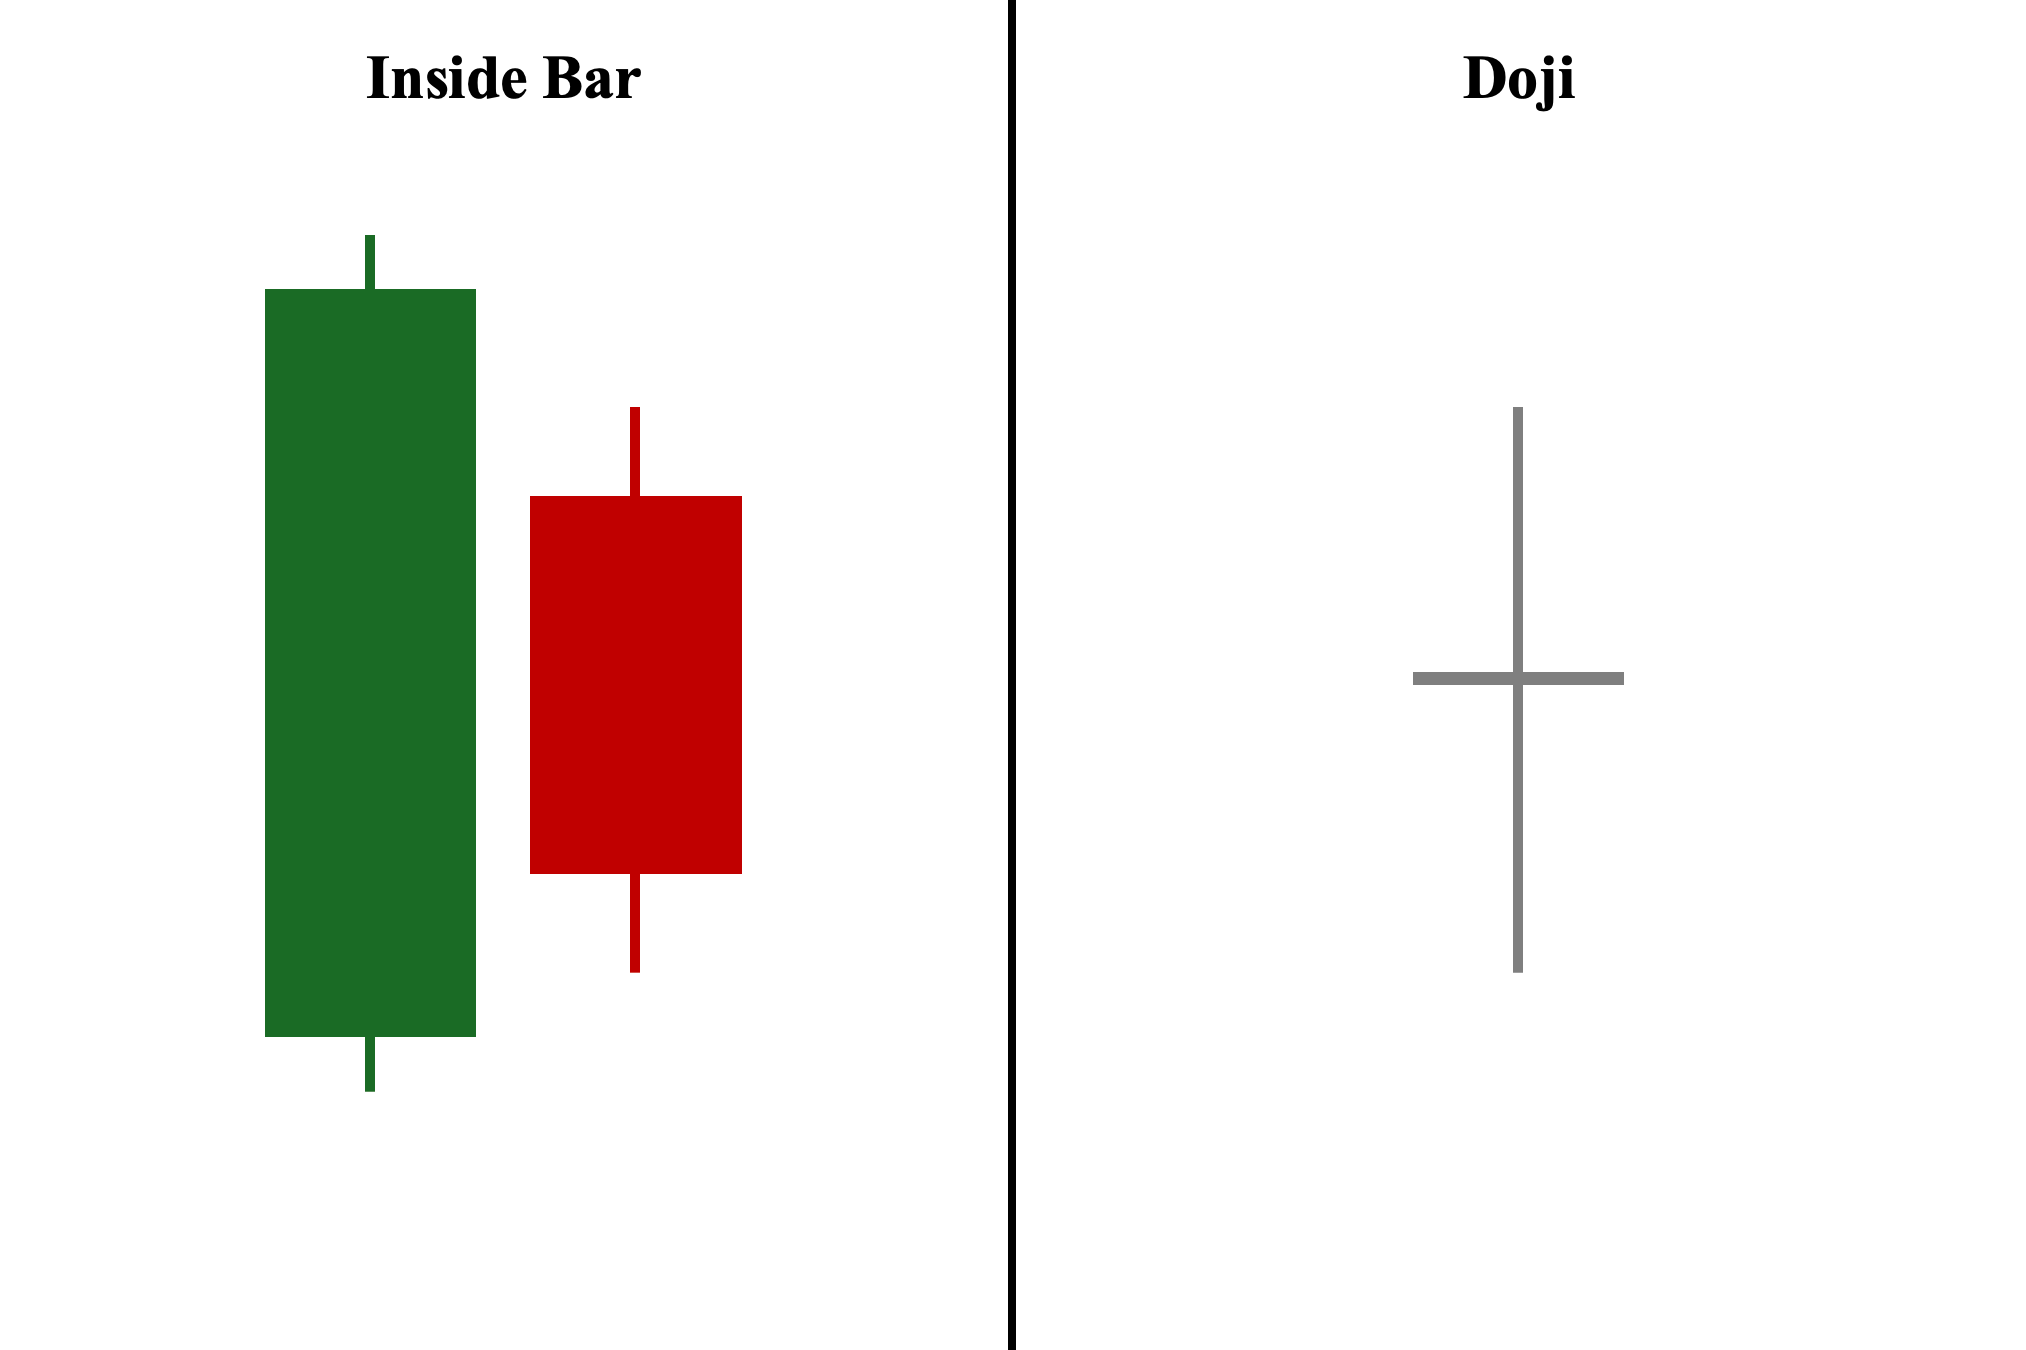
Compared to inside bars, which are two-candlestick patterns, doji candles and their variations (long-legged, dragonfly, and gravestone) are single-candle patterns. Both inside bars and doji candles generally signify a period of indecision and uncertainty about the market’s direction. Yes, this includes dragonfly and gravestone dojis, which often indicate a rejection of further decisive price movement rather than a clear reversal. In fact, dragonfly and gravestone dojis frequently precede a shift from a trending market to a sideways (non-trending) market period.
Inside Bar Pattern vs. Pin Bar Pattern
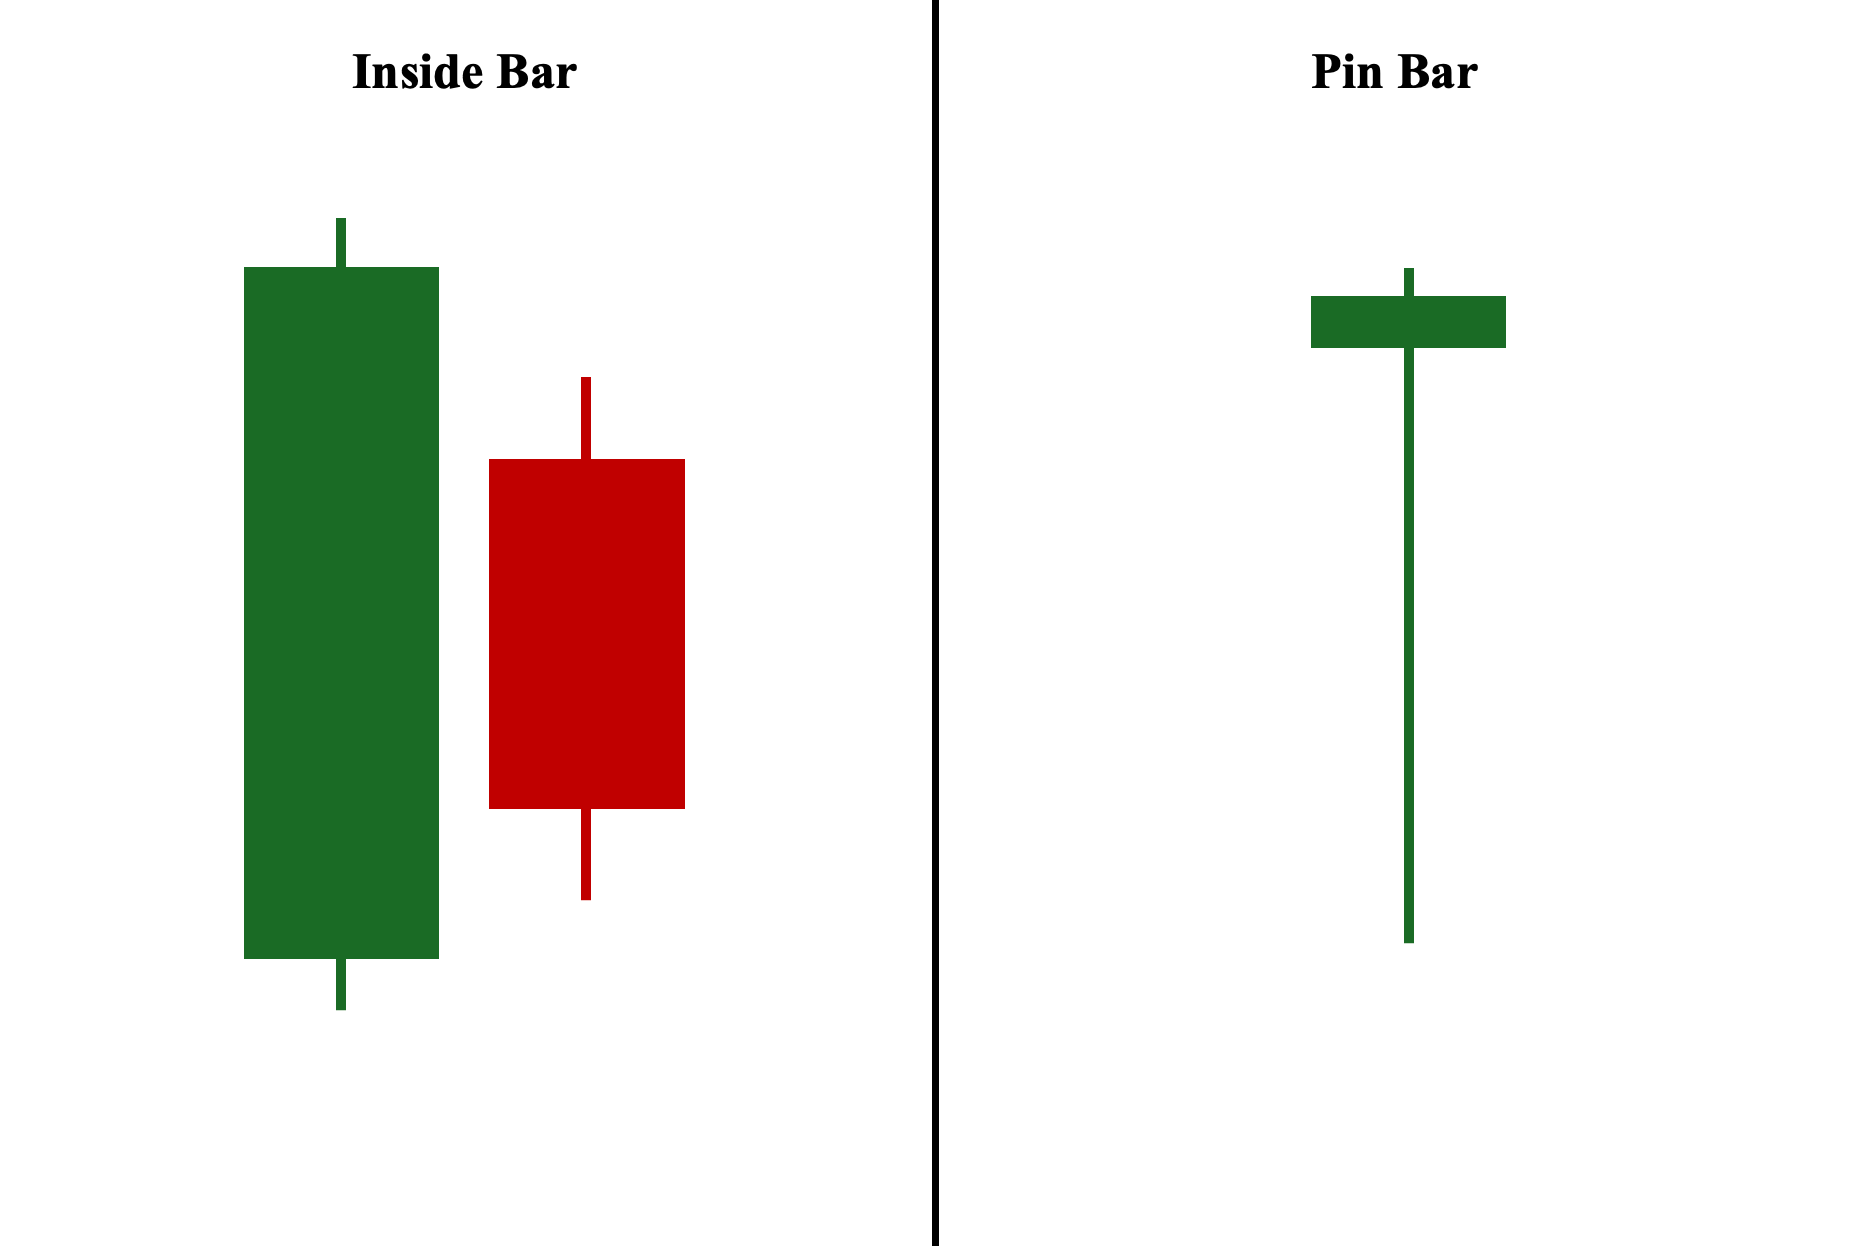
Compared to inside bars, pin bars are single-candlestick formations that indicate a rejection of further price movement in either direction, similar to dragonfly and gravestone dojis. The significance of pin bars comes from their structure rather than their color. A pin bar with a short real body and a long upper wick suggests a rejection of further upward price movement, while a pin bar with a short real body and a long lower wick indicates a rejection of further downward pressure.
Inside Bar Pattern vs. Marubozu Pattern
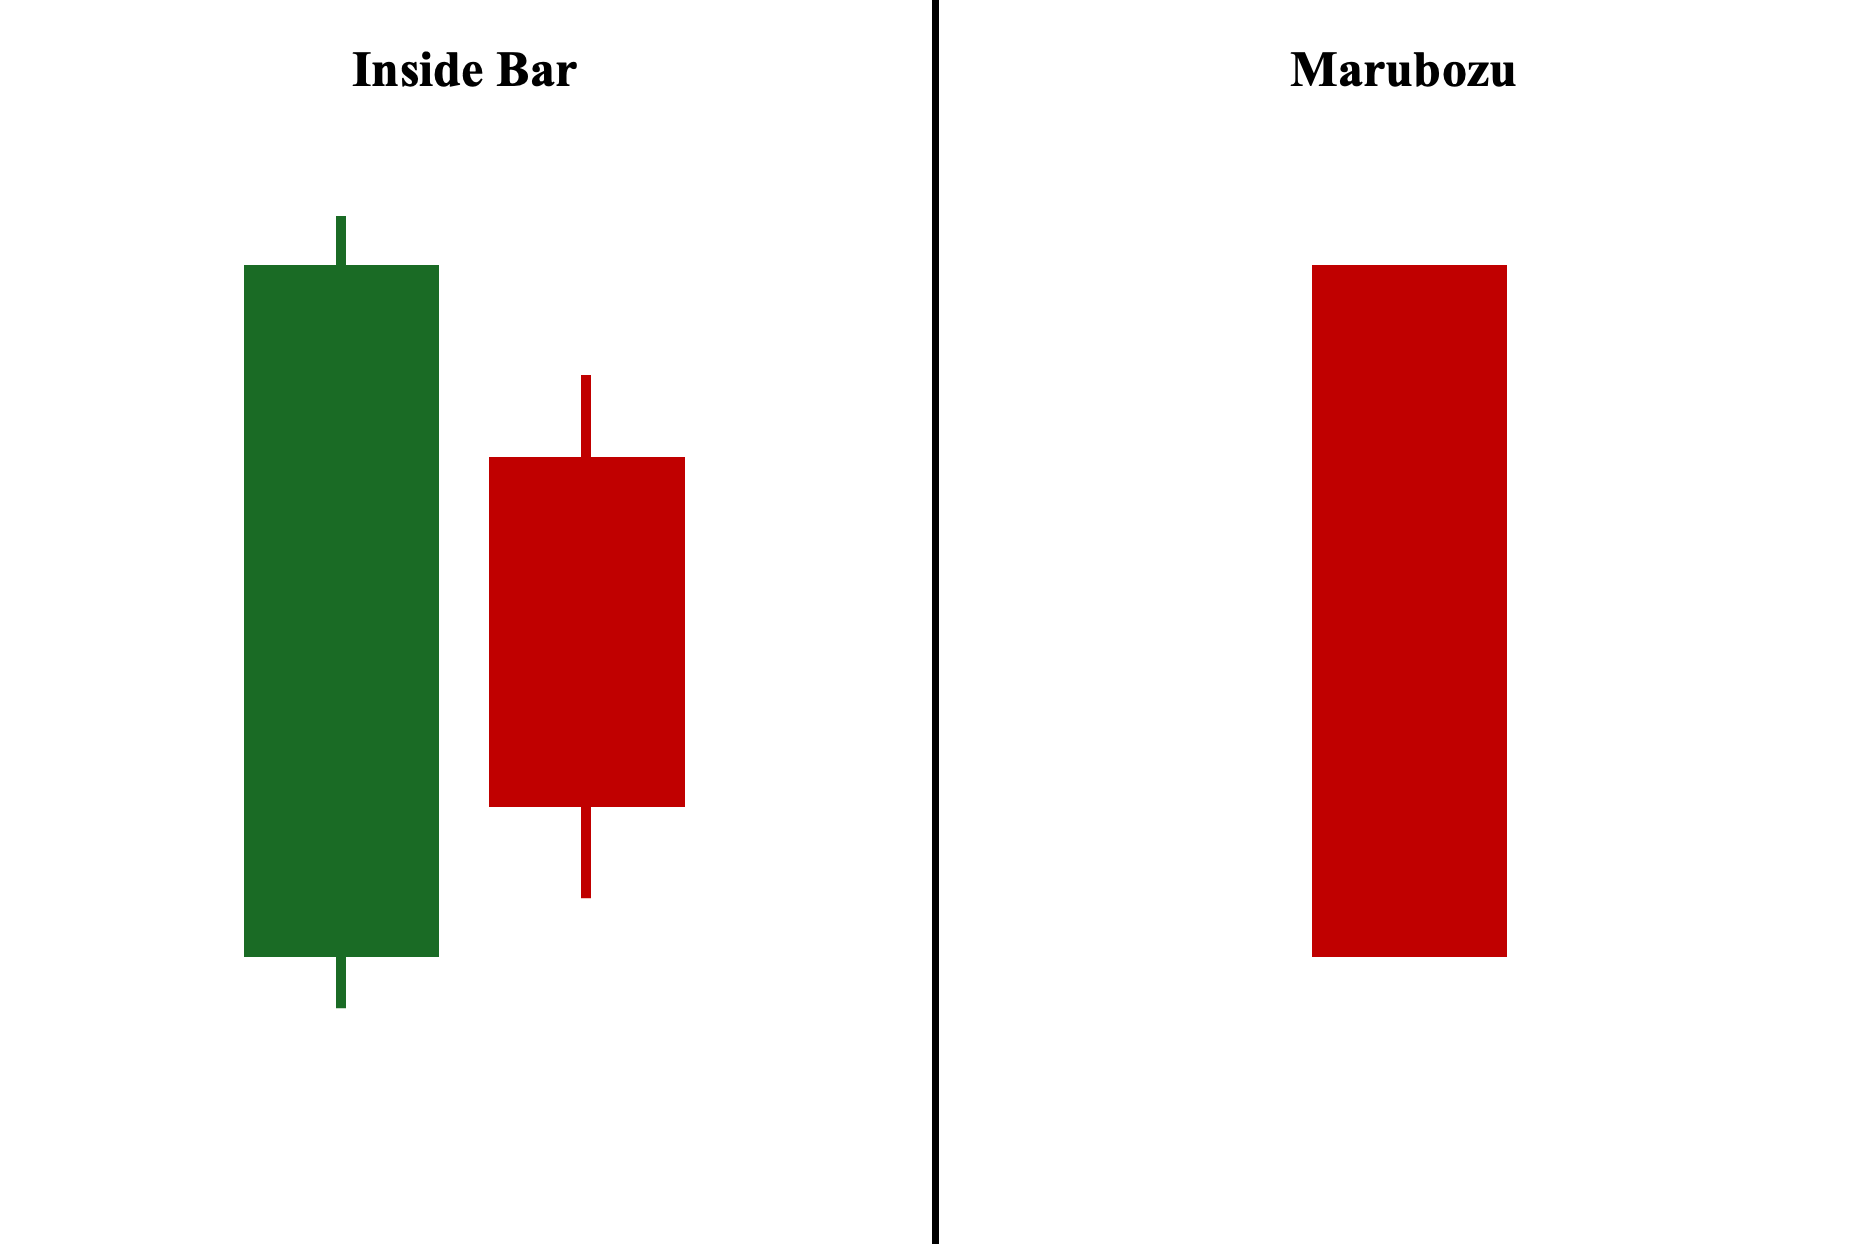
In contrast to inside bars, marubozu candles are long-bodied, single-candlestick patterns with little to no wicks, signifying a decisive move in the direction indicated by the candle’s color. Essentially, they represent the opposite of inside bars, which indicate a period of indecision and uncertainty when they occur.
Inside Bar Pattern vs. Spinning Top Pattern
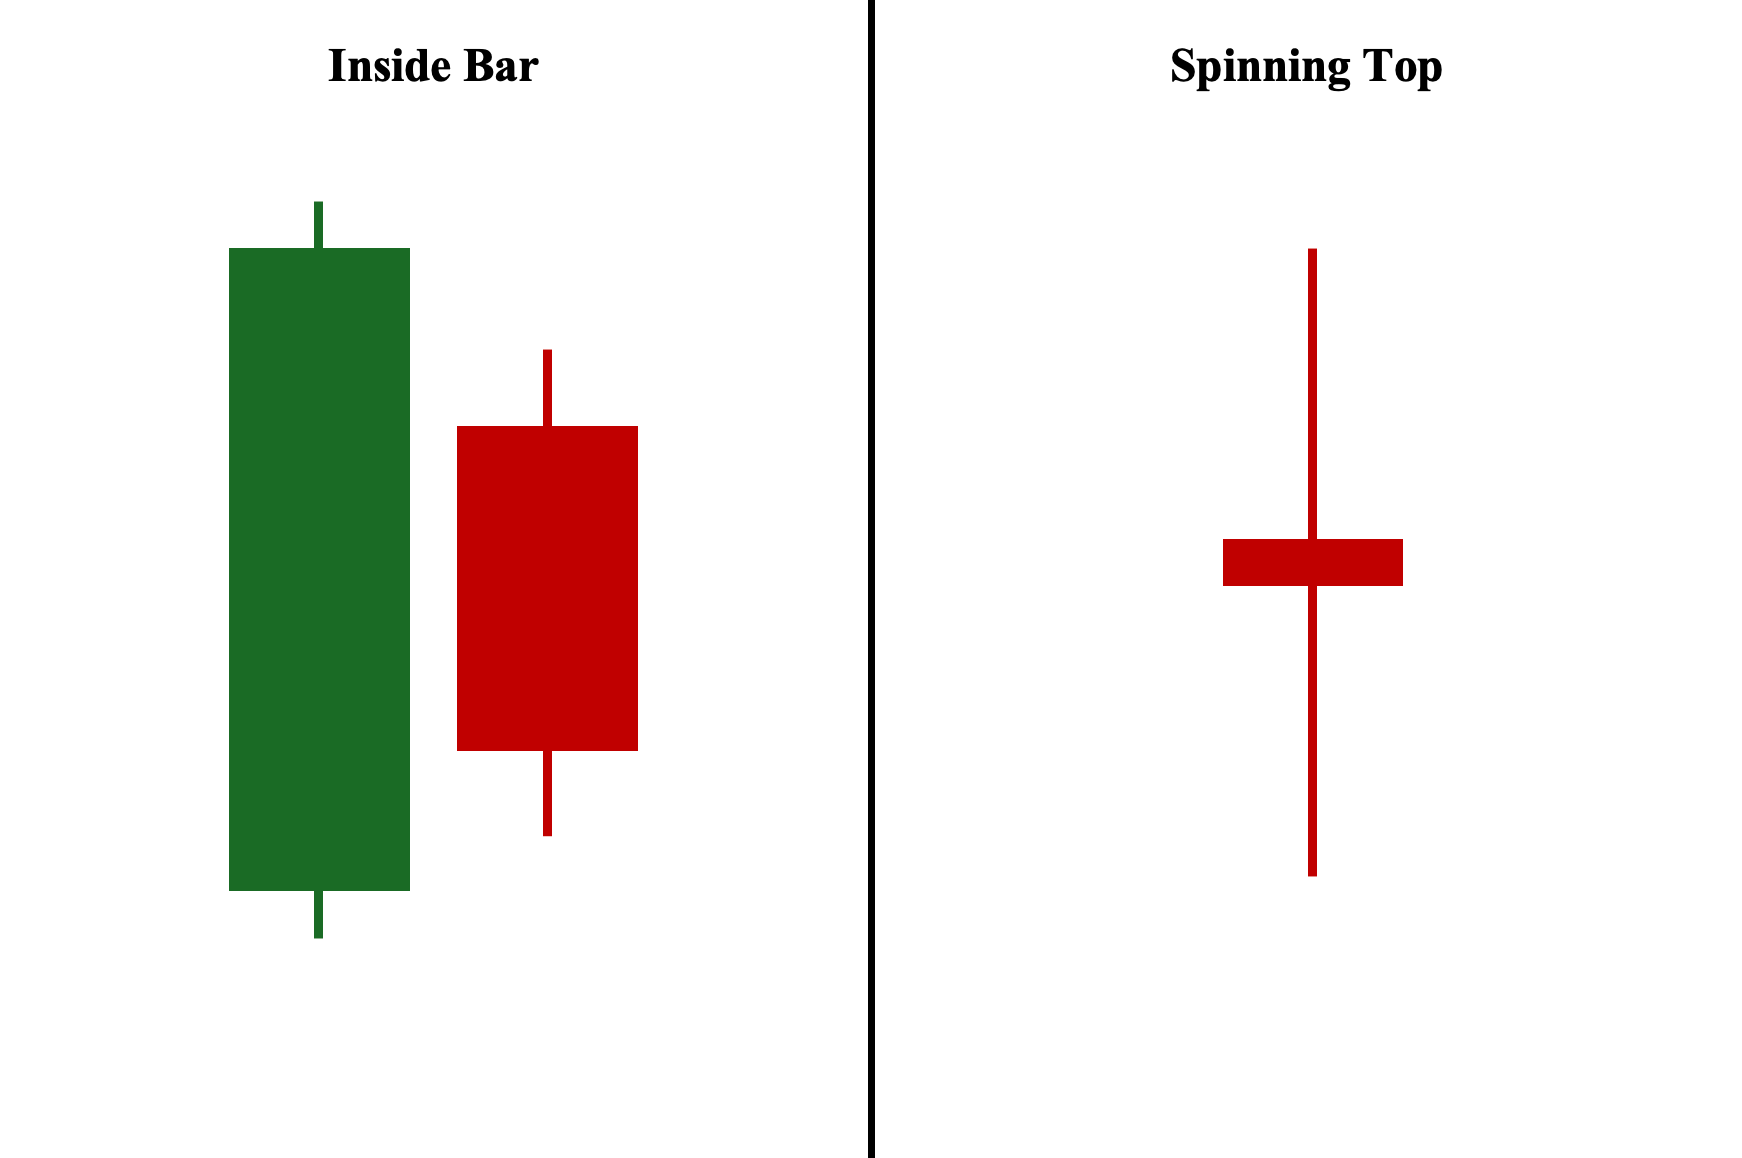
Unlike inside bars, spinning tops are neutral single-candle patterns that mark a point of market equilibrium. In this scenario, buyers and sellers battle to control the price, with each party being successful at certain points during the trading session. However, the session ends with neither party taking control, marking indecisive market sentiment about which direction the price will move next.
Inside Bar Pattern vs. Harami Pattern
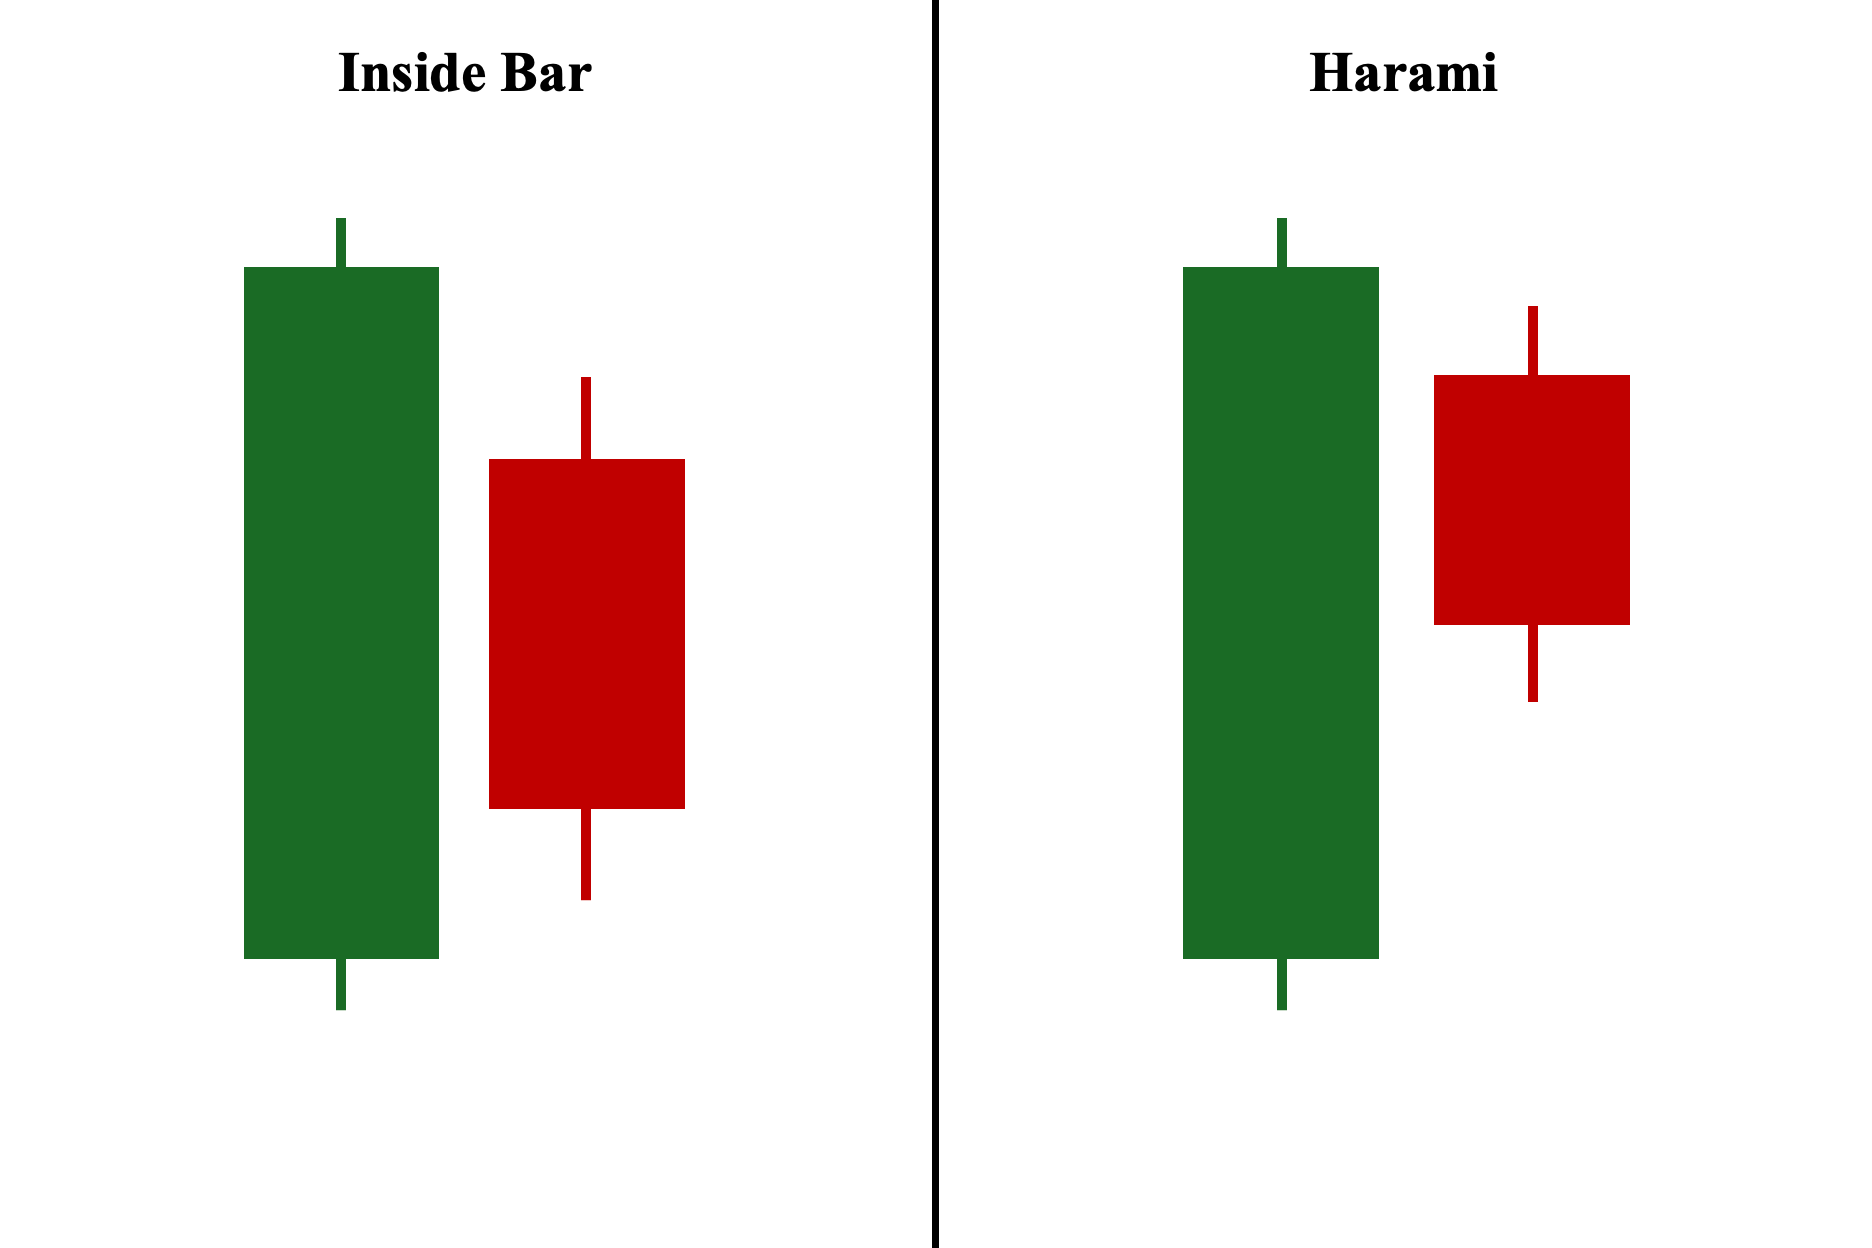
Lastly, and perhaps the most tricky, the inside bar and harami have the same visual characteristics—both are two-candlestick patterns where the second candle is much smaller and fits within the range of the first candle. With that said, here are the three key nuances you need to remember:
1. Color – In the inside bar pattern, color is NOT important; what truly matters is its position on the chart. Hence, you can have two candles with similar colors. In contrast, the harami pattern cannot have two candles of the same color and, in fact, has two distinct variations based entirely on color: the bullish harami, which consists of a red first candle followed by a green second candle, and the bearish harami, which consists of a green first candle followed by a red second candle.
2. Market Context – The inside bar is a neutral pattern that can occur in any market trend (uptrend, downtrend, or even sideways). It must then be followed by a third candle that serves as a confirmation candle to indicate the likely direction moving forward. In contrast, the harami is exclusively a reversal pattern that must occur in either an uptrend (bearish harami) or a downtrend (bullish harami).
3. Volume – Since the inside bar pattern typically marks a period of indecision or uncertainty, the volume on the second candle should ideally be below average. On the other hand, since the harami is a reversal pattern, the volume should ideally be significant (above average). This significant volume on harami reinforces the fact that despite buying or selling pressure in the direction of the trend, the counterparty prevents further decisive movement—ultimately pushing the candle to close in the opposite direction and marking the start of a potential counter move (reversal).
Frequently Asked Questions (FAQs)
The following are some of the most asked questions regarding the inside bar candlestick formation:
What is the three inside bar strategy?
The three-bar inside bar strategy is a three-candle variation of the traditional inside bar (with two candlesticks) and is seen as a more reliable trend continuation pattern. It is composed of three bars instead of two. The first bar is a trend bar and mother bar. The second candle creates an inside bar pattern. The key to the three inside bar is the third candle. If it closes the same color as the mother trend bar, then it signals an early breakout and continuation of the original trend. The three inside bar strategy was discovered by Johnan Prathap in 2011.
Is an inside bar pattern bullish or bearish?
It depends. The bullish or bearish nature of the inside bar depends entirely on its position on the chart, not on its color. An inside bar is considered bullish when it serves as a continuation pattern during an uptrend, followed by a third candle with a higher low and higher high, or as a reversal pattern during a downtrend. Conversely, an inside bar is considered bearish when it acts as a reversal pattern during an uptrend or as a continuation pattern during a downtrend, followed by a third candle with a lower high and lower low.
Why is the inside bar pattern important in trading?
The inside bar pattern is important in technical analysis and trading in financial markets (e.g., Forex, stocks) because it can serve as either a continuation or reversal candle pattern, depending on its position on the chart and the confirmation candle that follows it.
How reliable is the inside bar pattern in trading?
The reliability of the inside bar strategy in trading depends heavily on the market context and the effective use of complementary technical analysis tools. Generally, it is more reliable in range-bound markets with clear support and resistance levels and good volume or in trending markets with strong volume. However, incorporating volume significantly increases its reliability as a candlestick pattern.
What is the best time frame for using the inside bar pattern?
It depends. There is no single best time frame for using the Inside Bar pattern; it largely depends on your trading approach. However, the general rule is that the higher the time frame, the more reliable the candlestick formation becomes. For most traders, the daily chart is preferred, while others might opt for shorter time frames (for scalpers or day traders) or longer time frames (for position traders).


