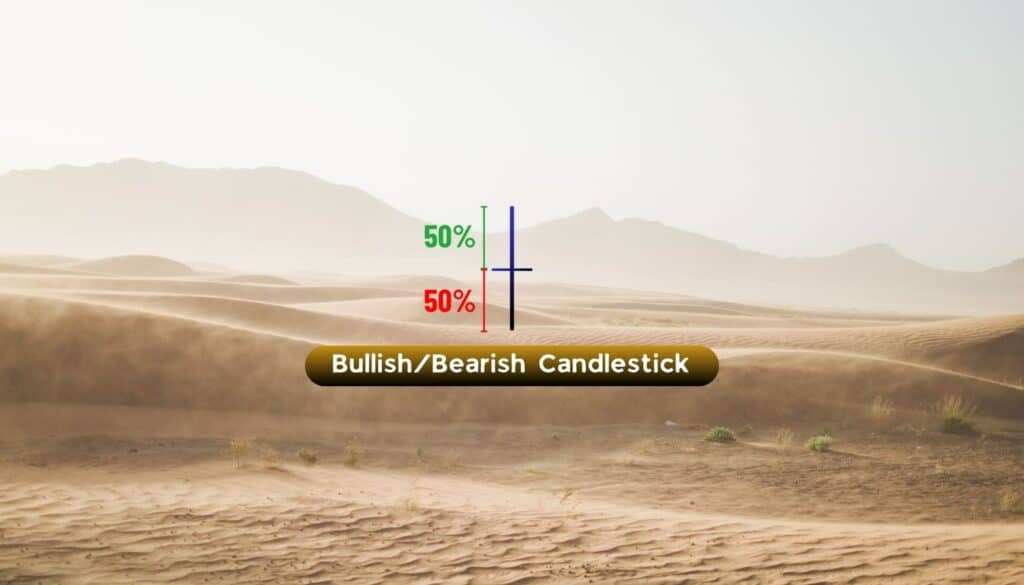
Bearish
- December 11, 2024
- 24 min read
Dark Cloud Cover – A Comprehensive Guide for Traders
What is the Dark Cloud Cover Pattern?
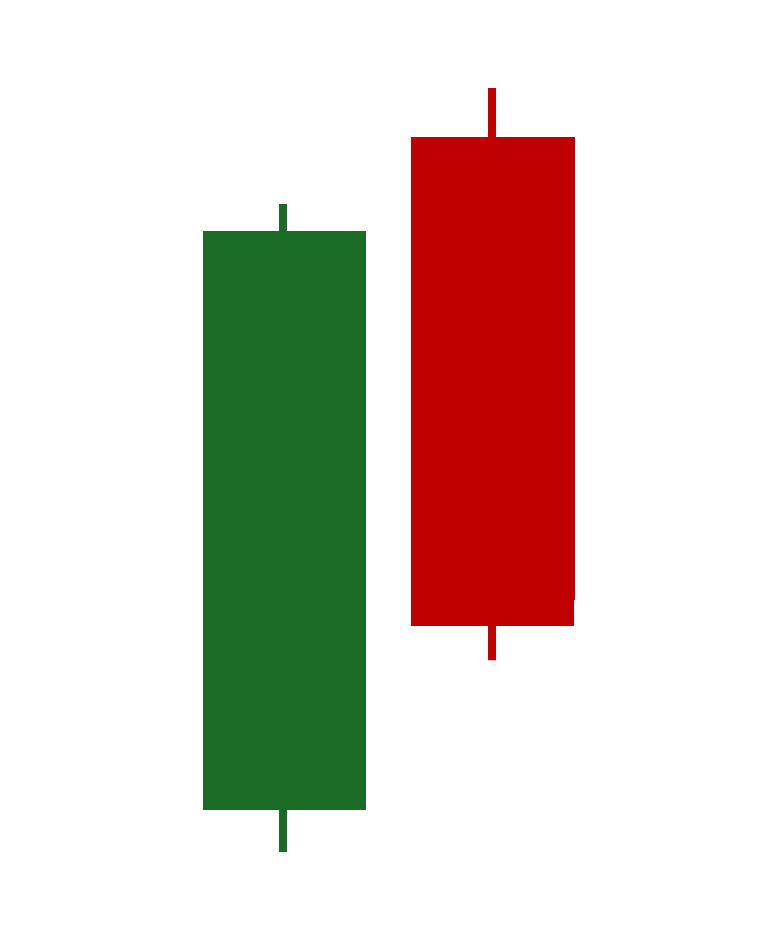
A dark cloud cover is a bearish candlestick reversal pattern that signals the potential end of an ongoing (and often extended) uptrend as bearish momentum begins to take over. The pattern consists of a long bullish green candle followed by a bearish red candle that closes below the midpoint of the first candle’s body. It illustrates a drastic change in market sentiment, where the first candle—a long bullish green candle—and the second candle’s gap up open initially suggest a continuation of the bullish trend. Yet, sudden and decisive selling pressure causes the second candle to erase much of the previous day’s gains and price advances.
How to Identify the Dark Cloud Cover Pattern?
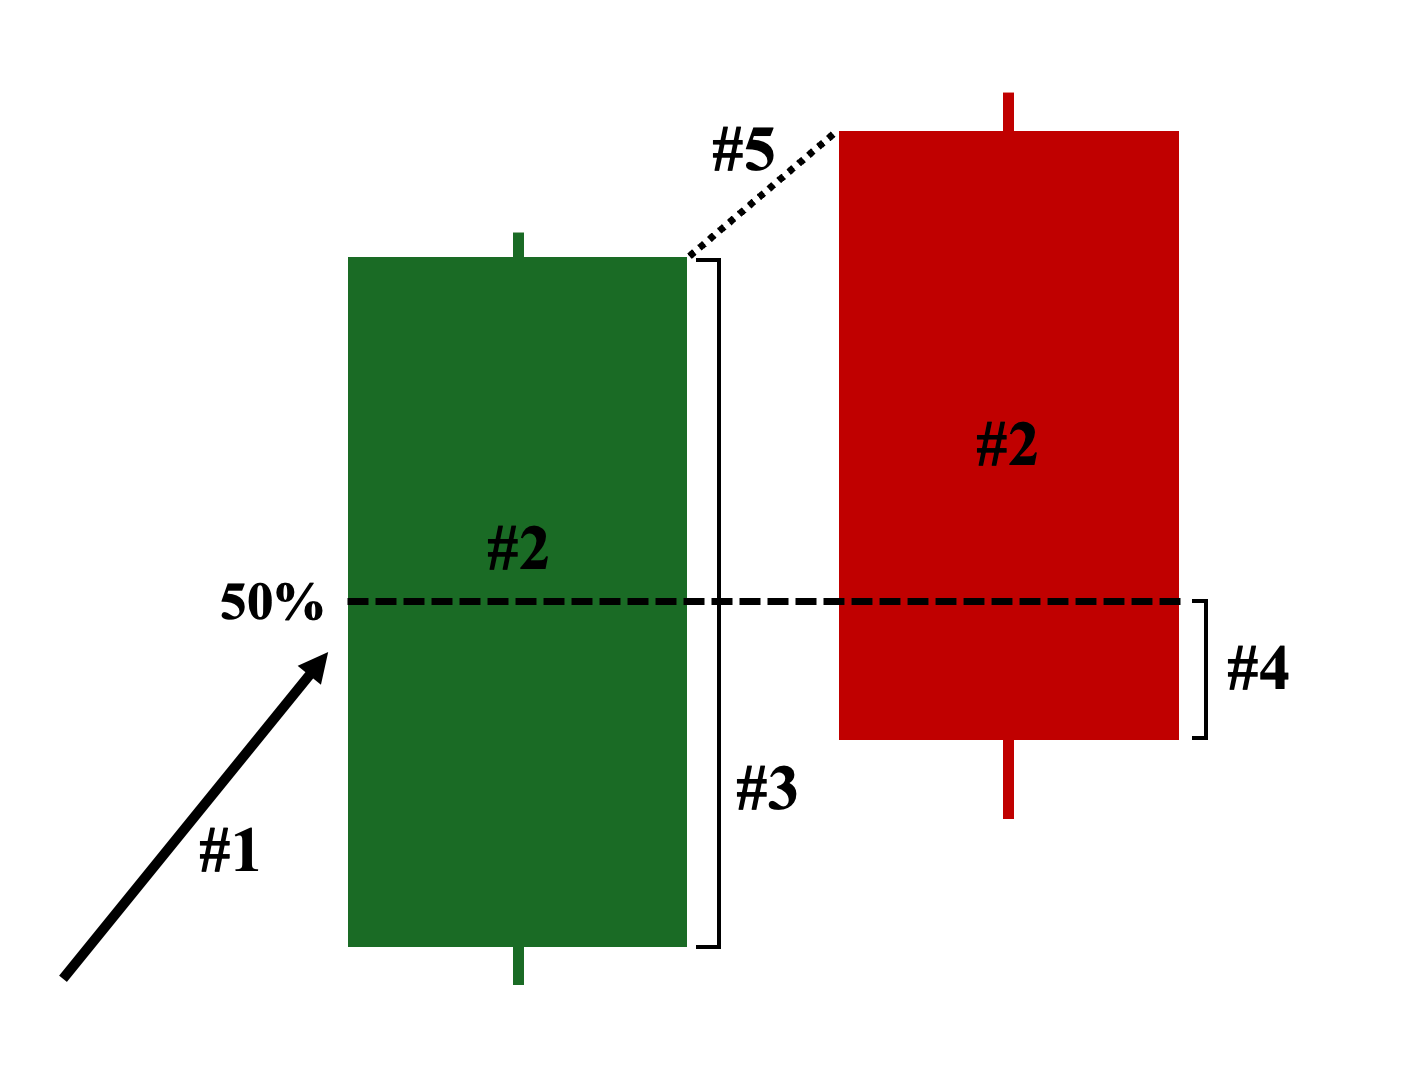
The following are the five key characteristics of a valid dark cloud cover candlestick pattern on a price chart:
- Position on the Chart – The two candles must appear at the top of an established (preferably prolonged) uptrend.
- Color: Depending on your chart settings, the first candle must be green or white, and the second candle must be red or black.
- First Candle: A relatively long bullish green candle with a large body, preferably with short or no shadows.
- Second Candle: A relatively long bearish red candle that closes below the midpoint (50%) of the first candle’s body.
- Gap Up: The second candle’s opening price must be above the closing price of the first candle, creating a noticeable gap, which initially suggests a continued bullish trend, only to be overwhelmed by bearish momentum and ultimately fail by closing below the midpoint of the first candle.
Dark Cloud Cover Pattern Examples
The following are three distinct examples of dark cloud cover candlestick patterns on a price chart:
Example 1: Successful Trend Reversal Scenario (Uptrend to Downtrend)
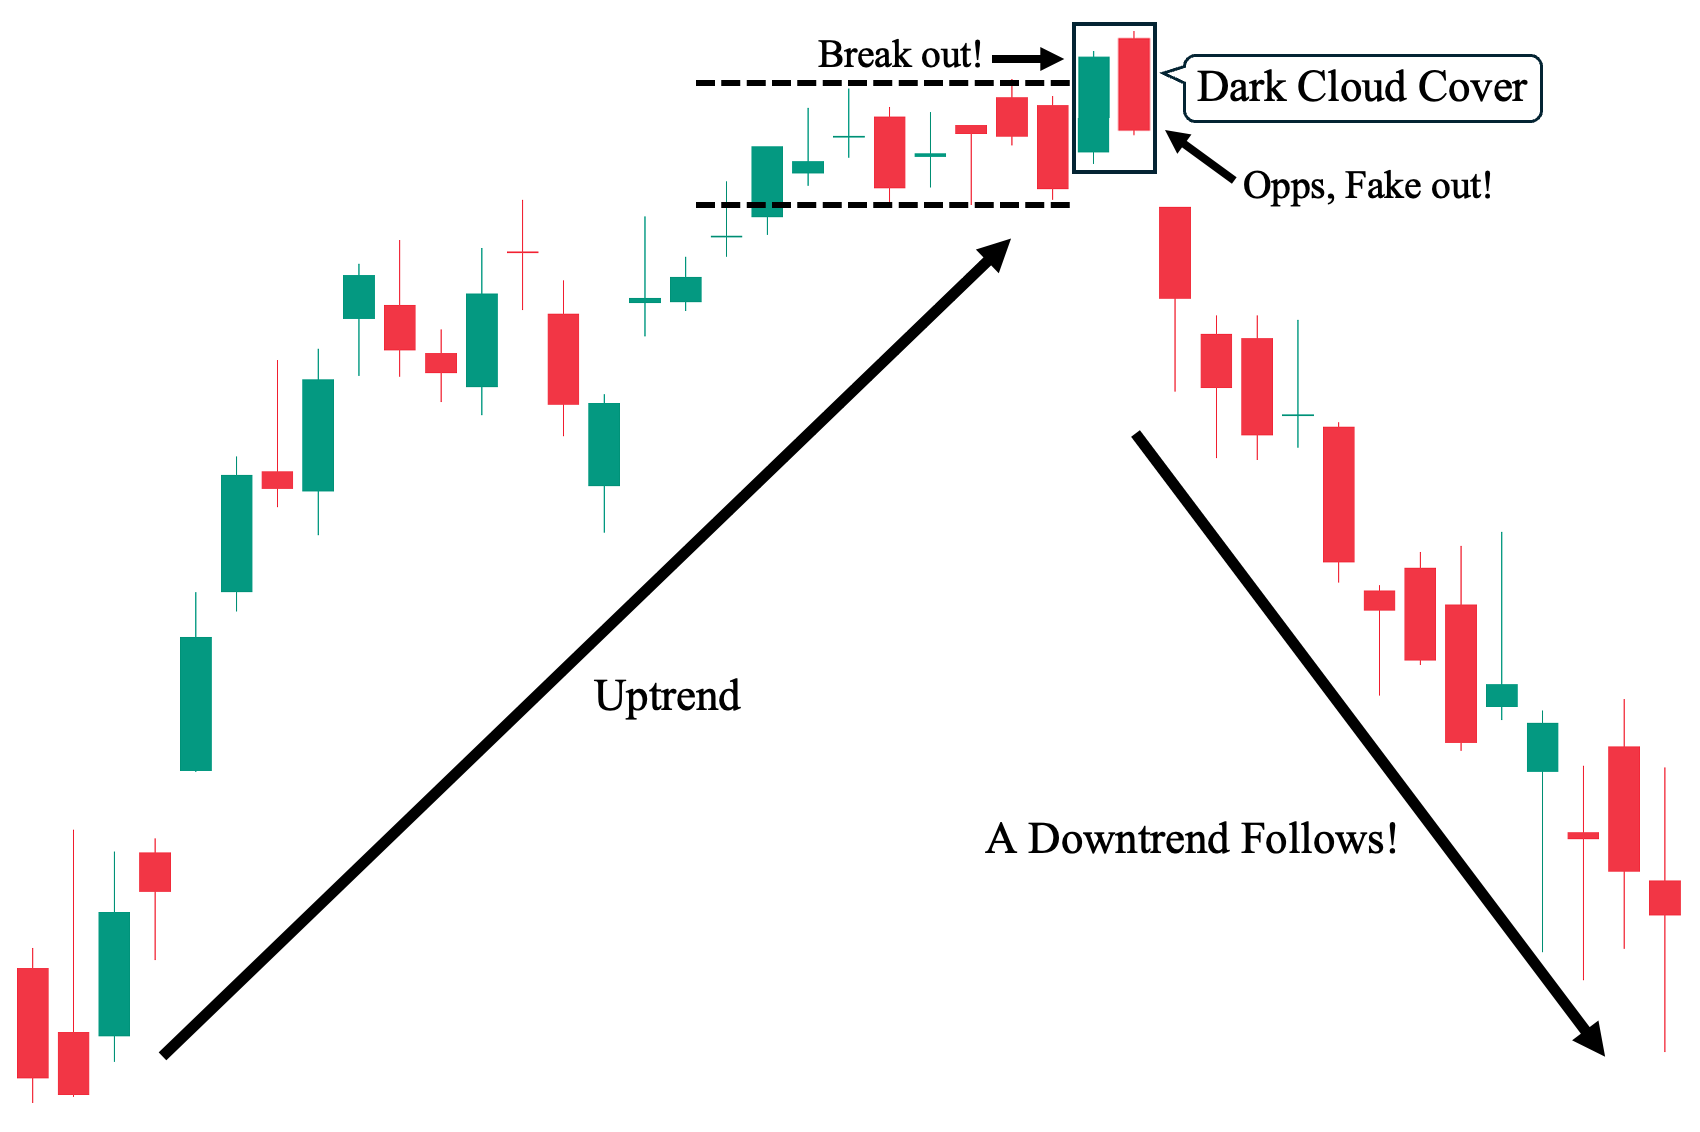
This first example shows the ideal scenario when trading the dark cloud cover pattern. As we can observe, there was an established uptrend before the appearance of the pattern. In fact, the pattern’s first candle can be considered a “breakout” candle as it successfully closes above the previous sideways channel. Hence, we could have definitely expected a potential price rally.
Nevertheless, the pattern’s second candle immediately invalidated this breakout made by the previous bullish candle as it closed back into the sideways channel. The two candles then subsequently formed a dark cloud cover and successfully served as a bearish reversal pattern, catalyzing the downtrend that soon followed.
Example 2: Failed Trend Reversal Scenario (Uptrend Continues)
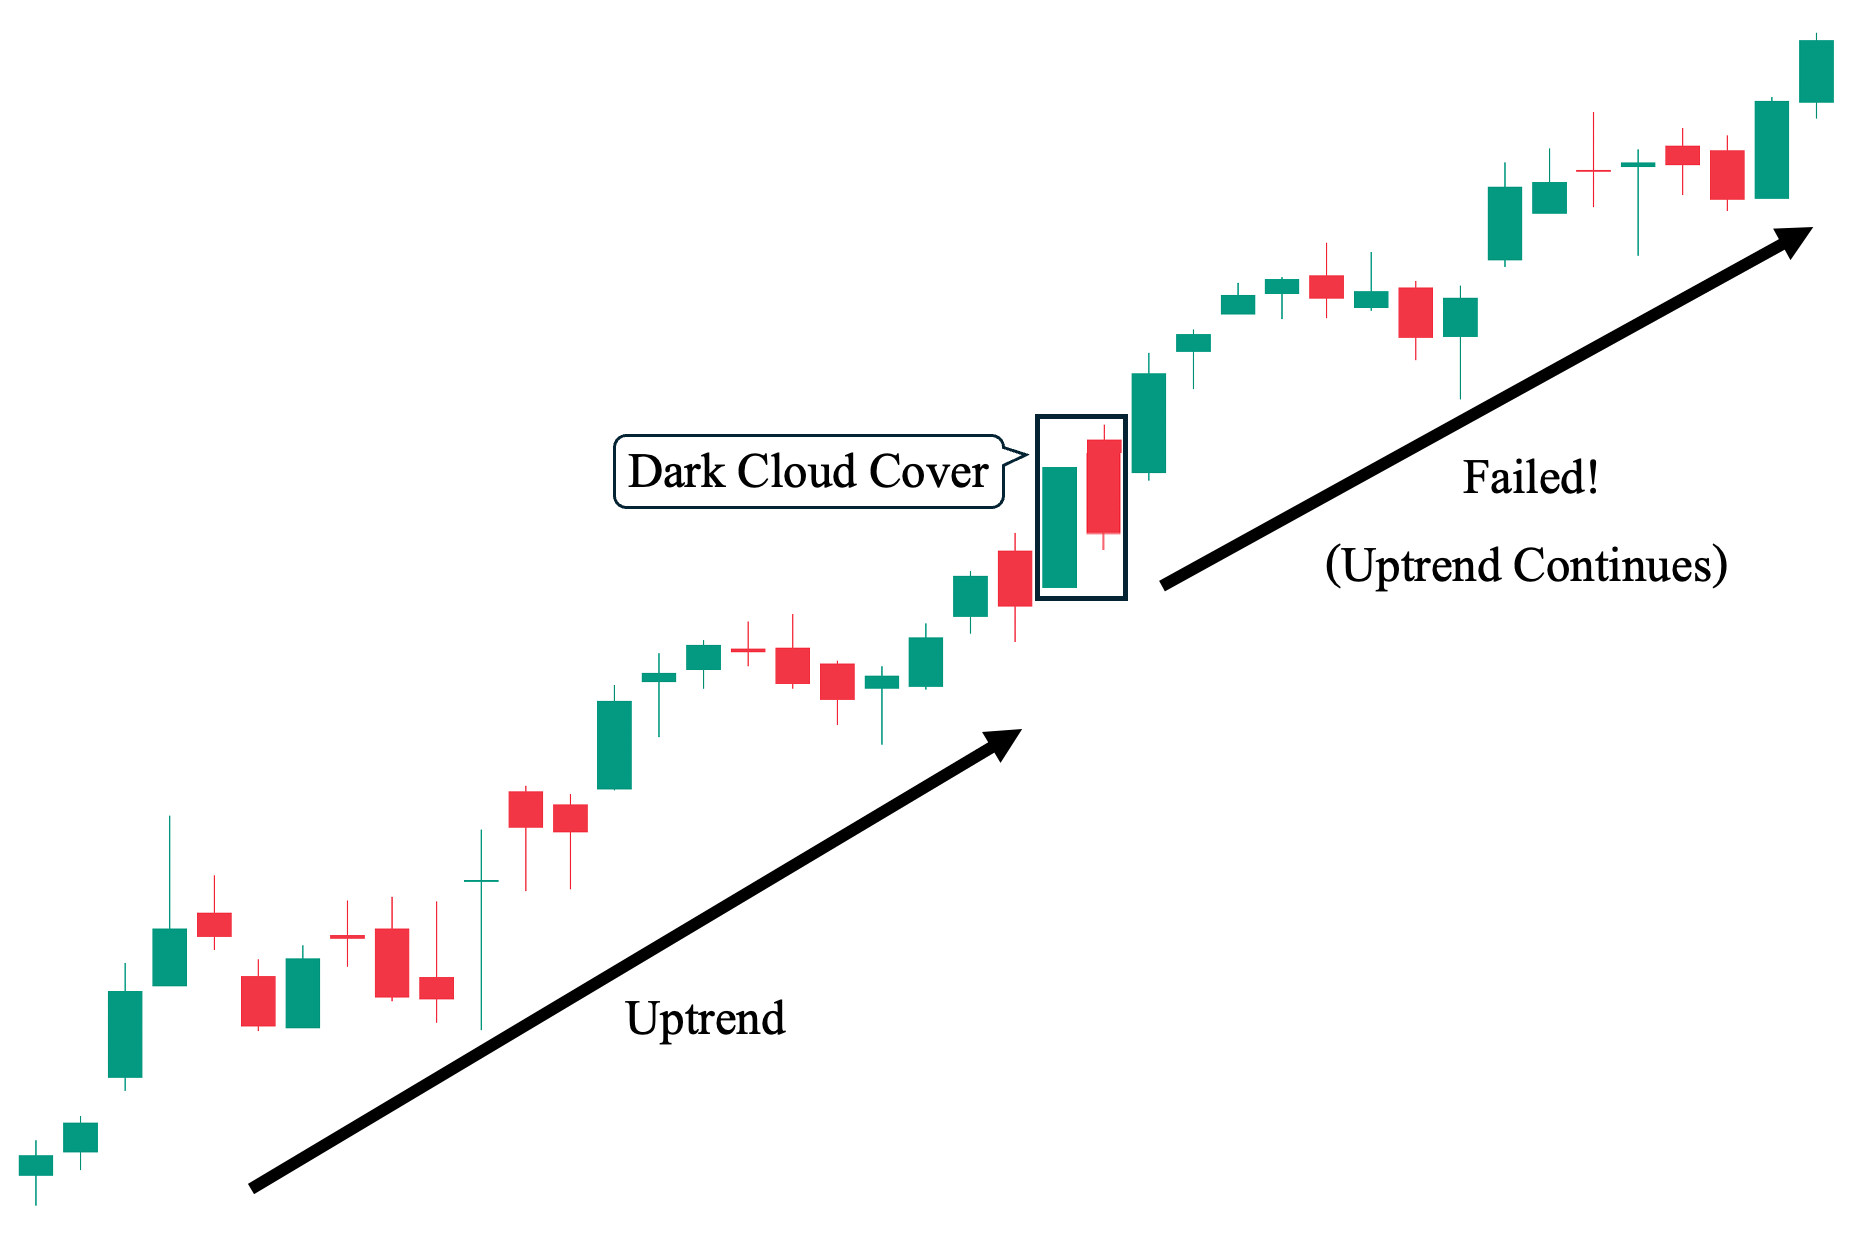
In contrast to the first example, in this second chart illustration, we can see how the dark cloud cover pattern failed to serve as a bearish reversal pattern. This is despite meeting all necessary conditions, such as occurring during an ongoing uptrend—as shown, we can see a strong uptrend leading to the formation of the pattern. In fact, instead of leading to a potential bearish reversal, the uptrend simply continued immediately. This shows how the dark cloud cover, like other candlestick patterns, can give out false signals. Hence, it is crucial to manage risk in each of the trades we take.
Example 3: Indecisive Outcome Scenario (Shifts to Non-Trending)
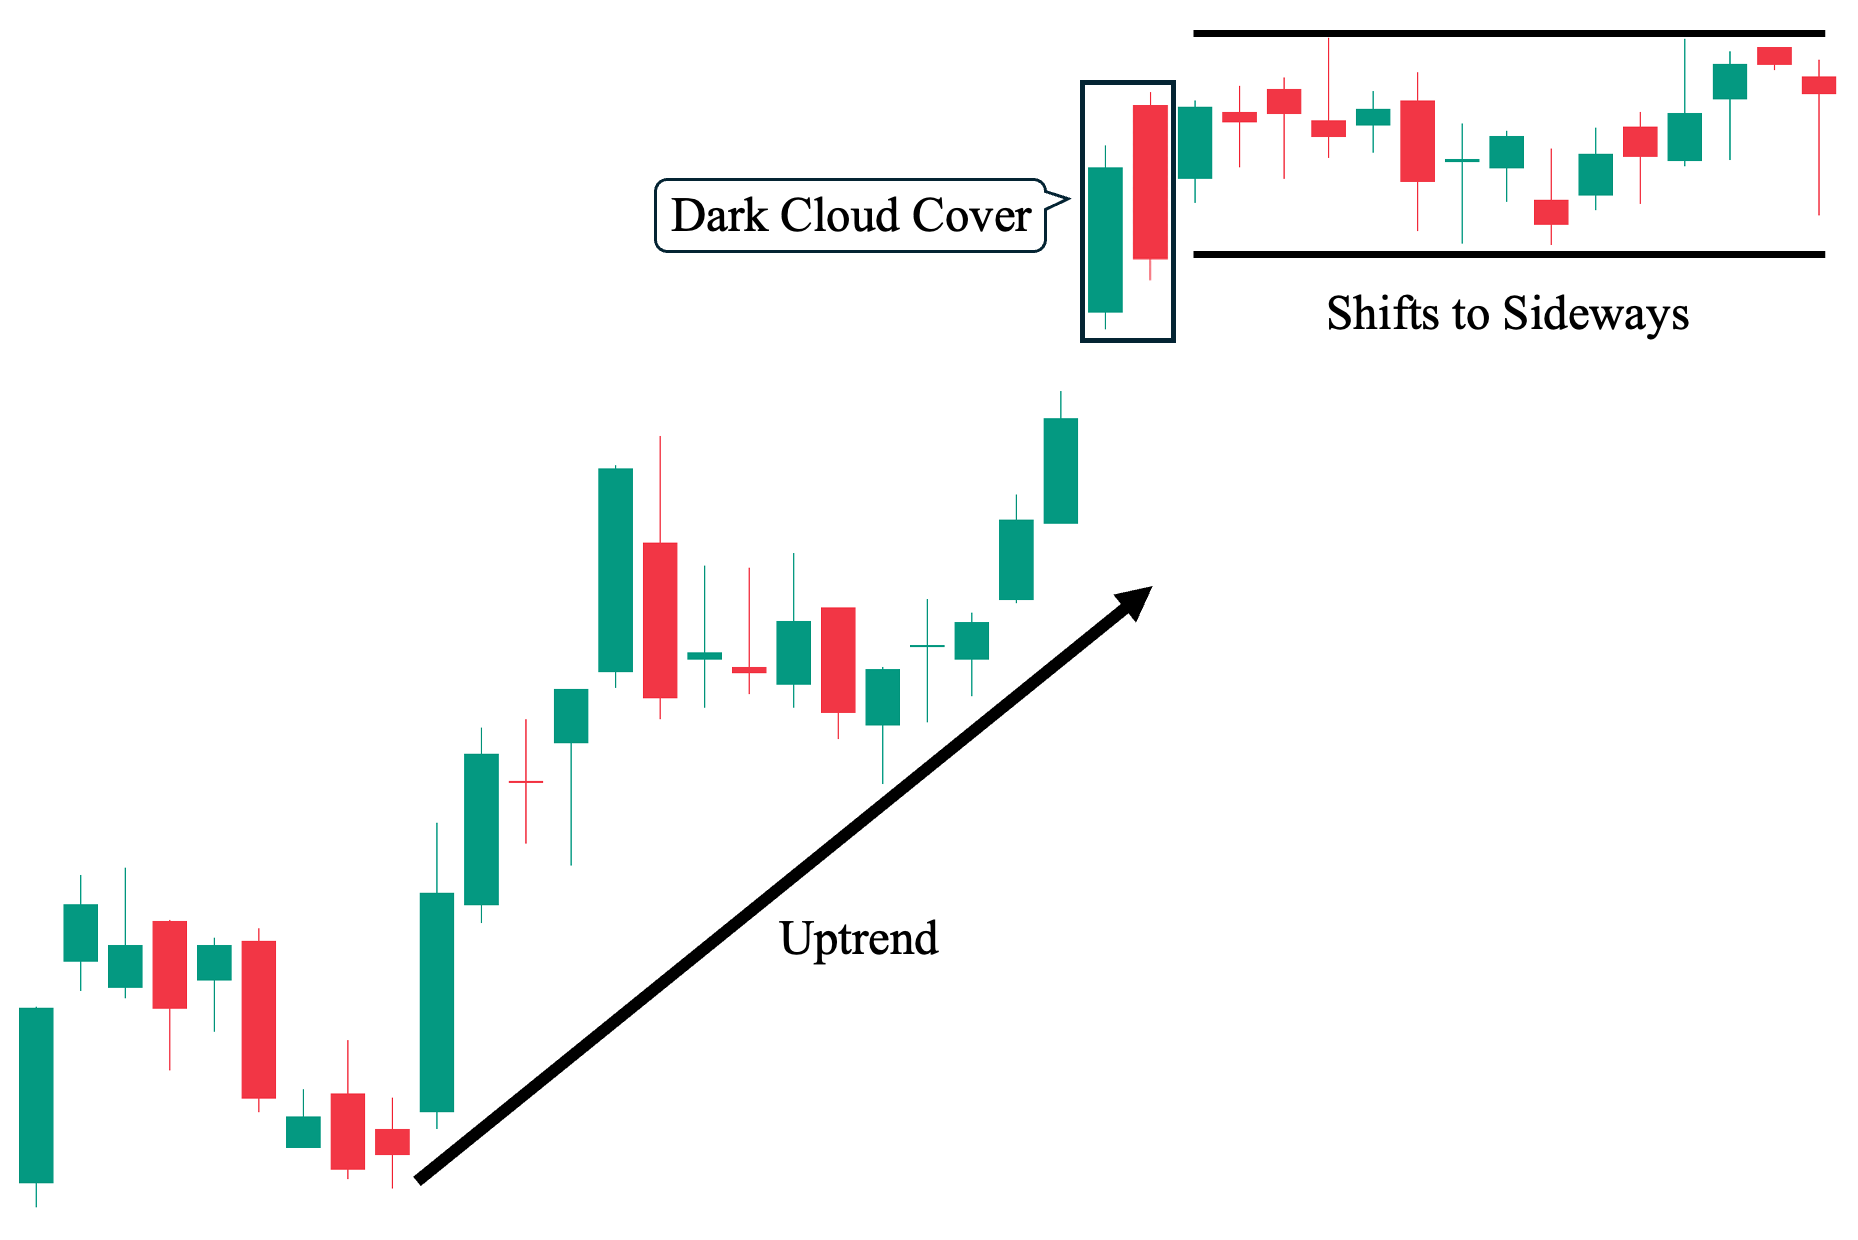
Finally, the dark cloud cover pattern can also lead to an indecisive outcome—where the pattern is not followed by either an uptrend or a downtrend but instead by a sideways price movement that can move within a set range with defined upper and lower price boundaries.
To illustrate, we can observe in the chart above a clear uptrend leading to the formation of the dark cloud cover pattern. In fact, the first candle, backed by a strong buying pressure, even made a massive gap up as it opens significantly higher than the previous candle. Yet, this bullish advance was halted by the appearance of a bearish candle (second candle) that erased a significant advance made by the previous bullish candle (first candle). Nevertheless, after the pattern forms, the price loses momentum and shifts to a non-trending state, as evidenced by non-trending smaller candles that move sideways in clearly defined upper and lower price boundaries. In this
Dark Cloud Cover Pattern Trading Strategies
Here are various ways you can incorporate the dark cloud cover candlestick pattern with the following technical analysis tools to make more informed trading decisions:
Dark Cloud Cover as a Bearish Reversal Signal on Naked Chart
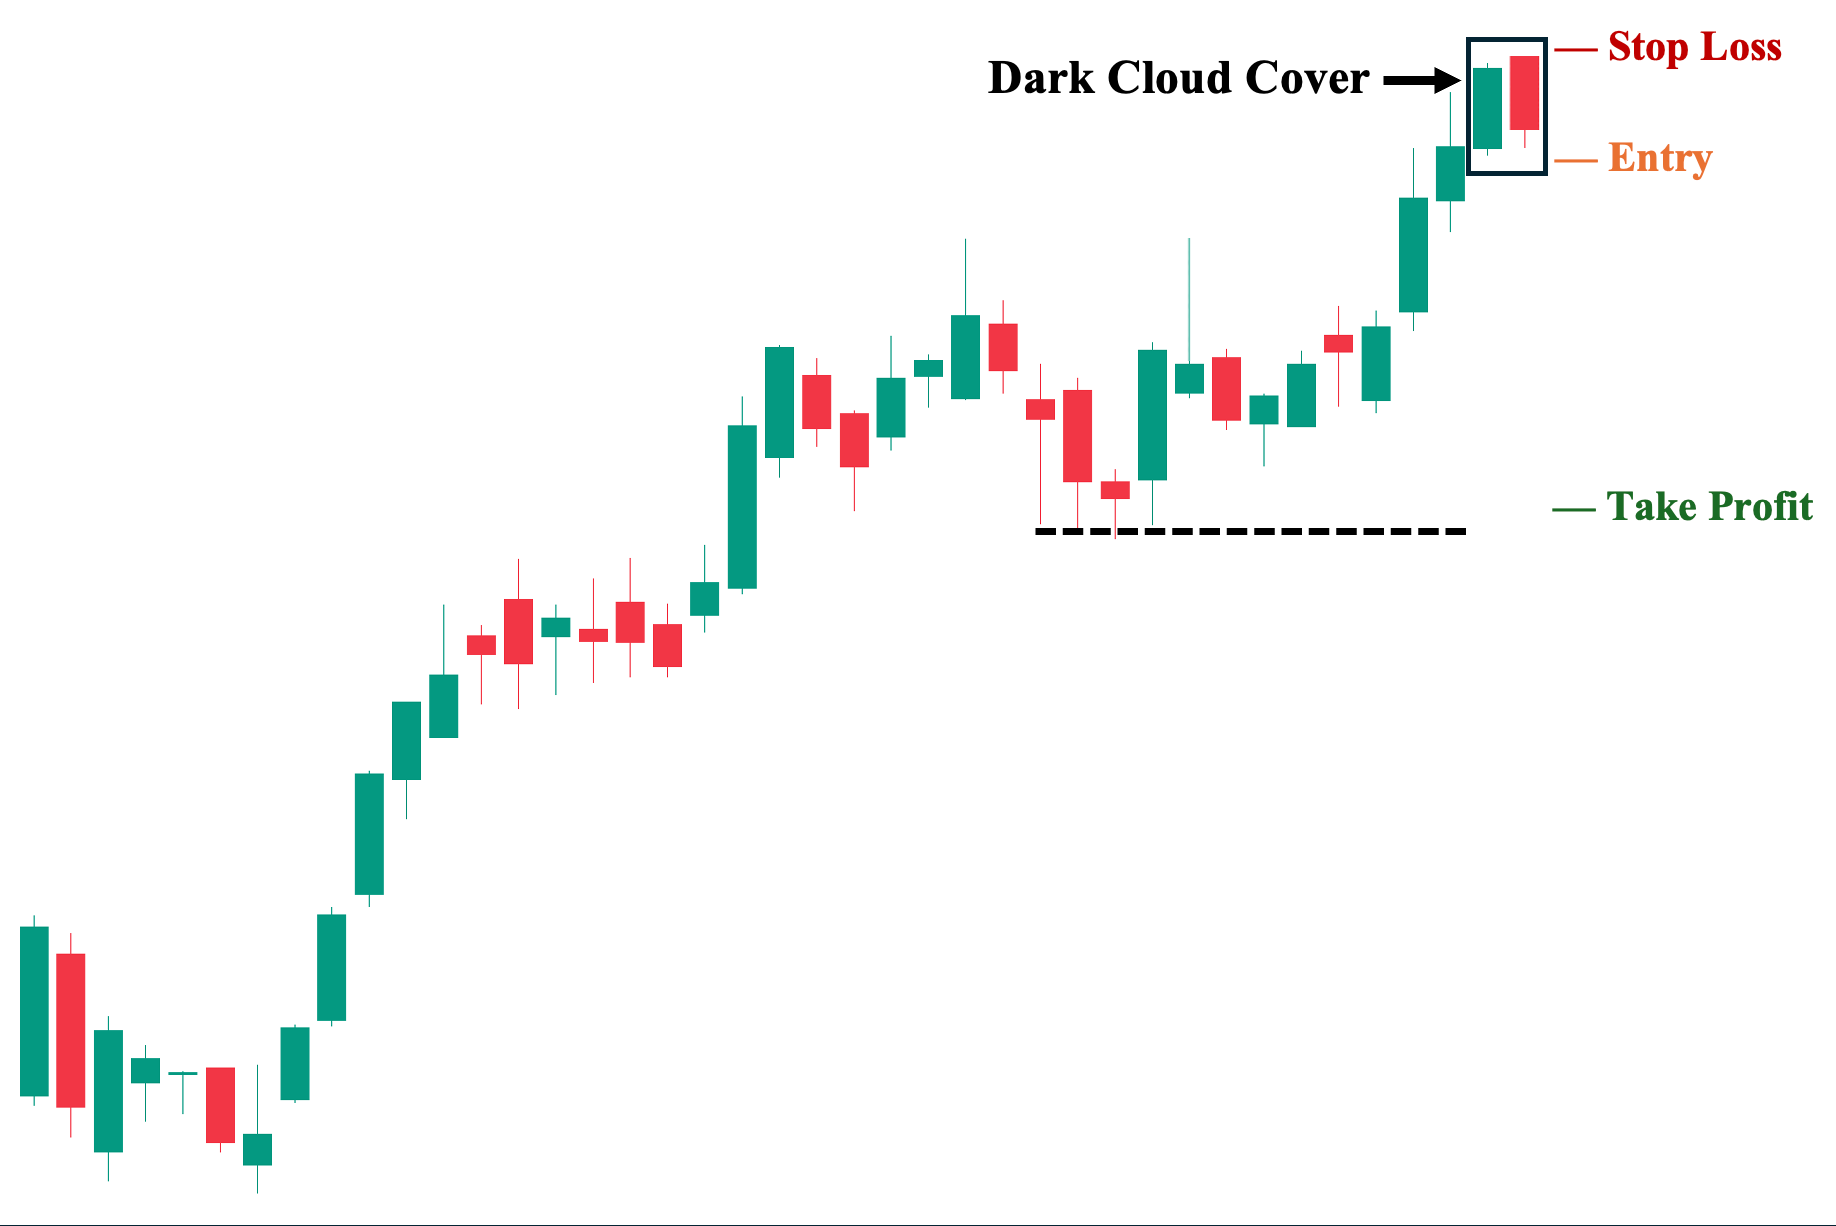
We can use the dark cloud cover pattern on its own, on a bare chart, without any technical indicators. This is the basic price action approach when using the pattern to potentially take a short position. For example, in an established uptrend, the dark cloud cover forms with the first bullish candle making a new high, followed by the second bearish candle closing below the midpoint of the first candle. Since the pattern meets all the conditions for a valid bearish reversal, as covered in the key characteristics section above, we could consider taking this trade.
Note: This trade setup is not optimal because it does not take into account the general market context or use complementary technical analysis tools for confirmation.
1. Entry Point: A few ticks below the low of the pattern’s second (bearish) candle.
2. Stop Loss Point: Set your stop loss a few ticks above the high of the pattern’s second (bearish) candle.
3. Take Profit (TP) Level: Set your TP a few ticks above the nearest key structural support level. In this case, the previous low of the uptrend.
4. Risk-Reward Ratio: The risk/reward ratio must be at least 1:1. We do not recommend taking trades with a ratio below this in any trading situation. The higher the potential reward relative to the risk, the better. However, ensure you use an objective approach when setting your TP and SL levels rather than inflating them artificially.
Dark Cloud Cover with Key (Resistance) Levels
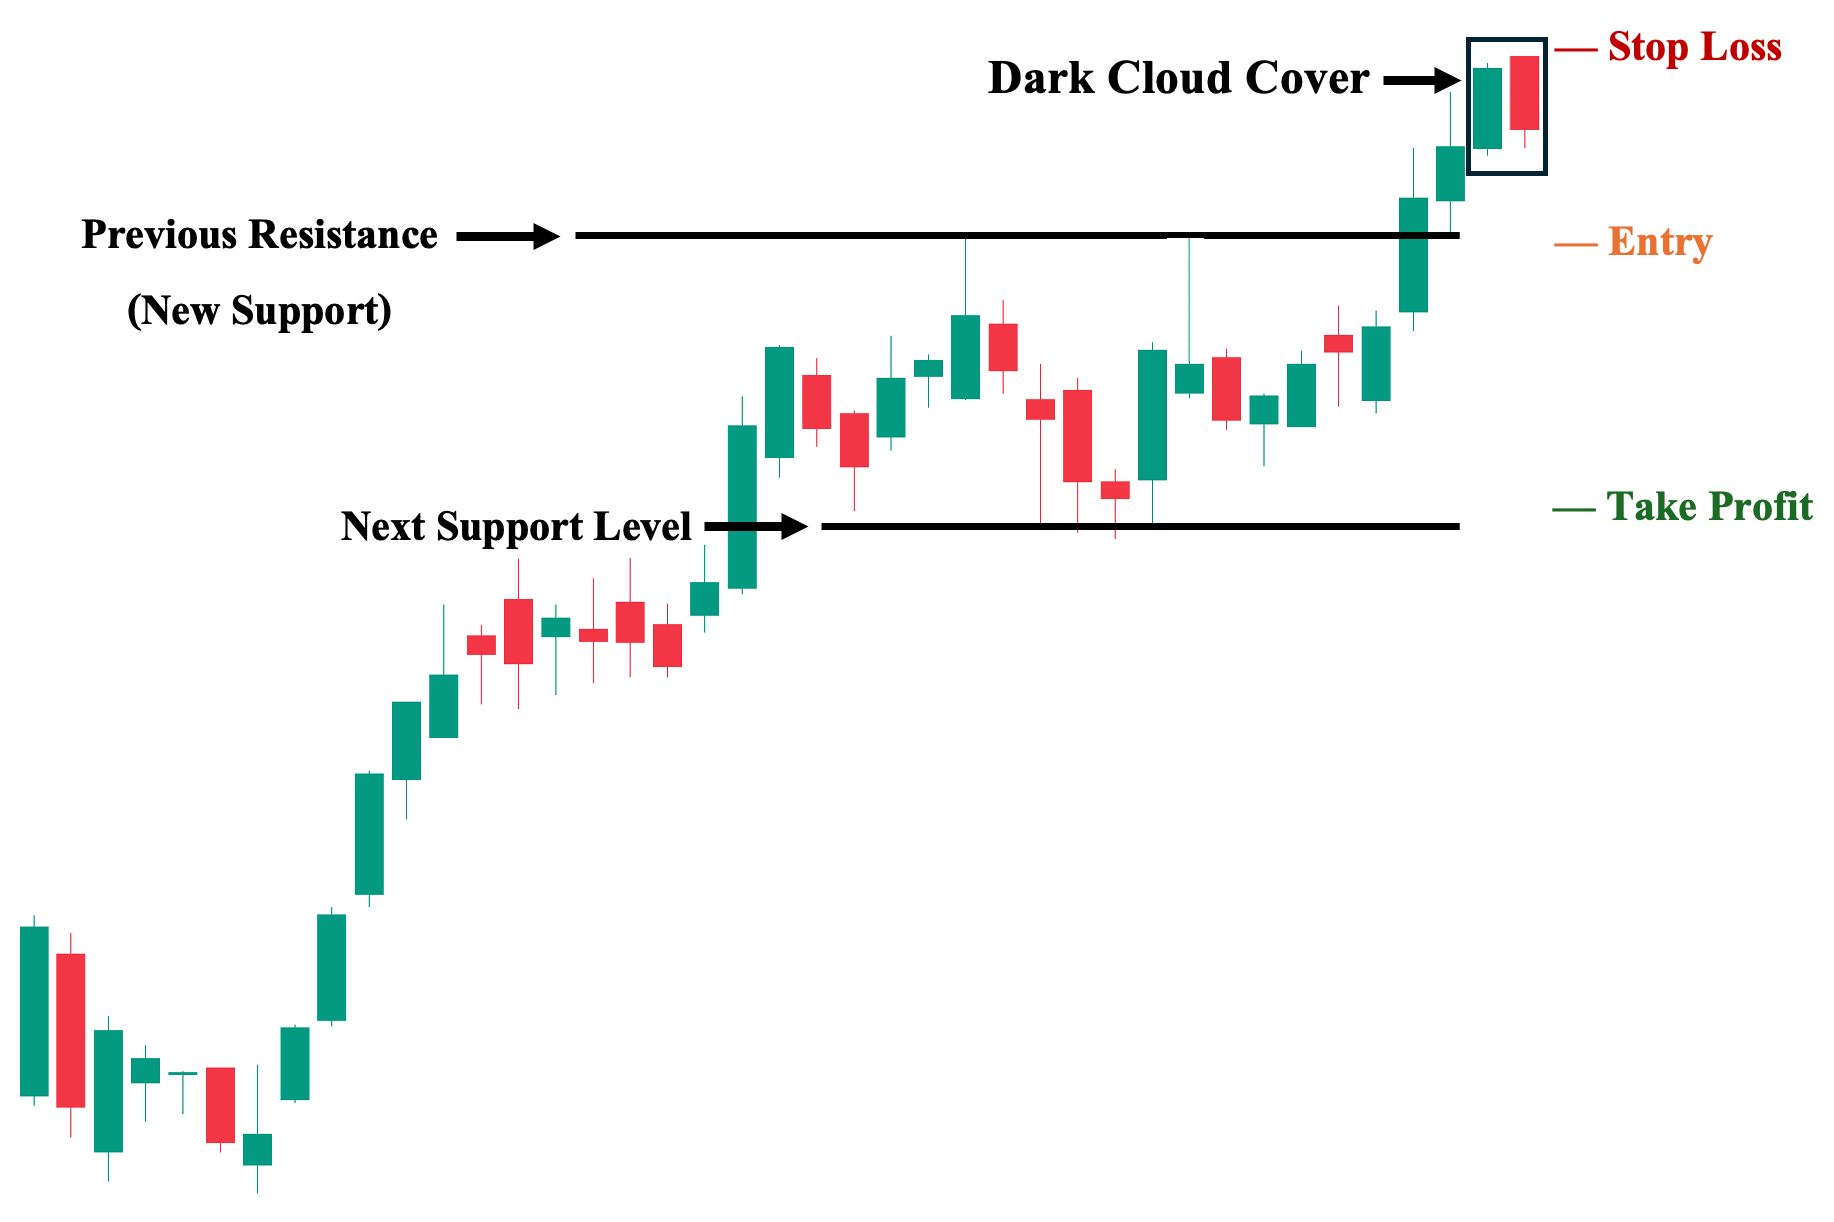
We can build on our first approach by evaluating the general market context in which the dark cloud cover appears. In this case, we are using the same chart as in the first approach, but with a more detailed price action analysis that includes market structure. Hence, we can identify two key levels: the previous resistance level, which now serves as the nearest support level, offering a basis for a more conservative short position (as a breakdown below this level confirms the bearish reversal), and the next support level, where we can set our target price.
Note: This trade approach is ideal for traders with lower risk tolerance, as it favors a “safer” trade setup.
1. Entry Point: A few ticks below the nearest support level (price must first close below this level to confirm the bearish reversal).
2. Stop Loss Point: Set your stop loss a few ticks above the pattern’s second (bearish) candle.
3. Take Profit (TP) Level: Set your TP a few ticks above the nearest key structural support level. In this case, the next support level.
4. Risk-Reward Ratio: The risk/reward ratio must be at least 1:1. We do not recommend taking trades with a ratio below this in any trading situation.
Dark Cloud Cover with Moving Averages
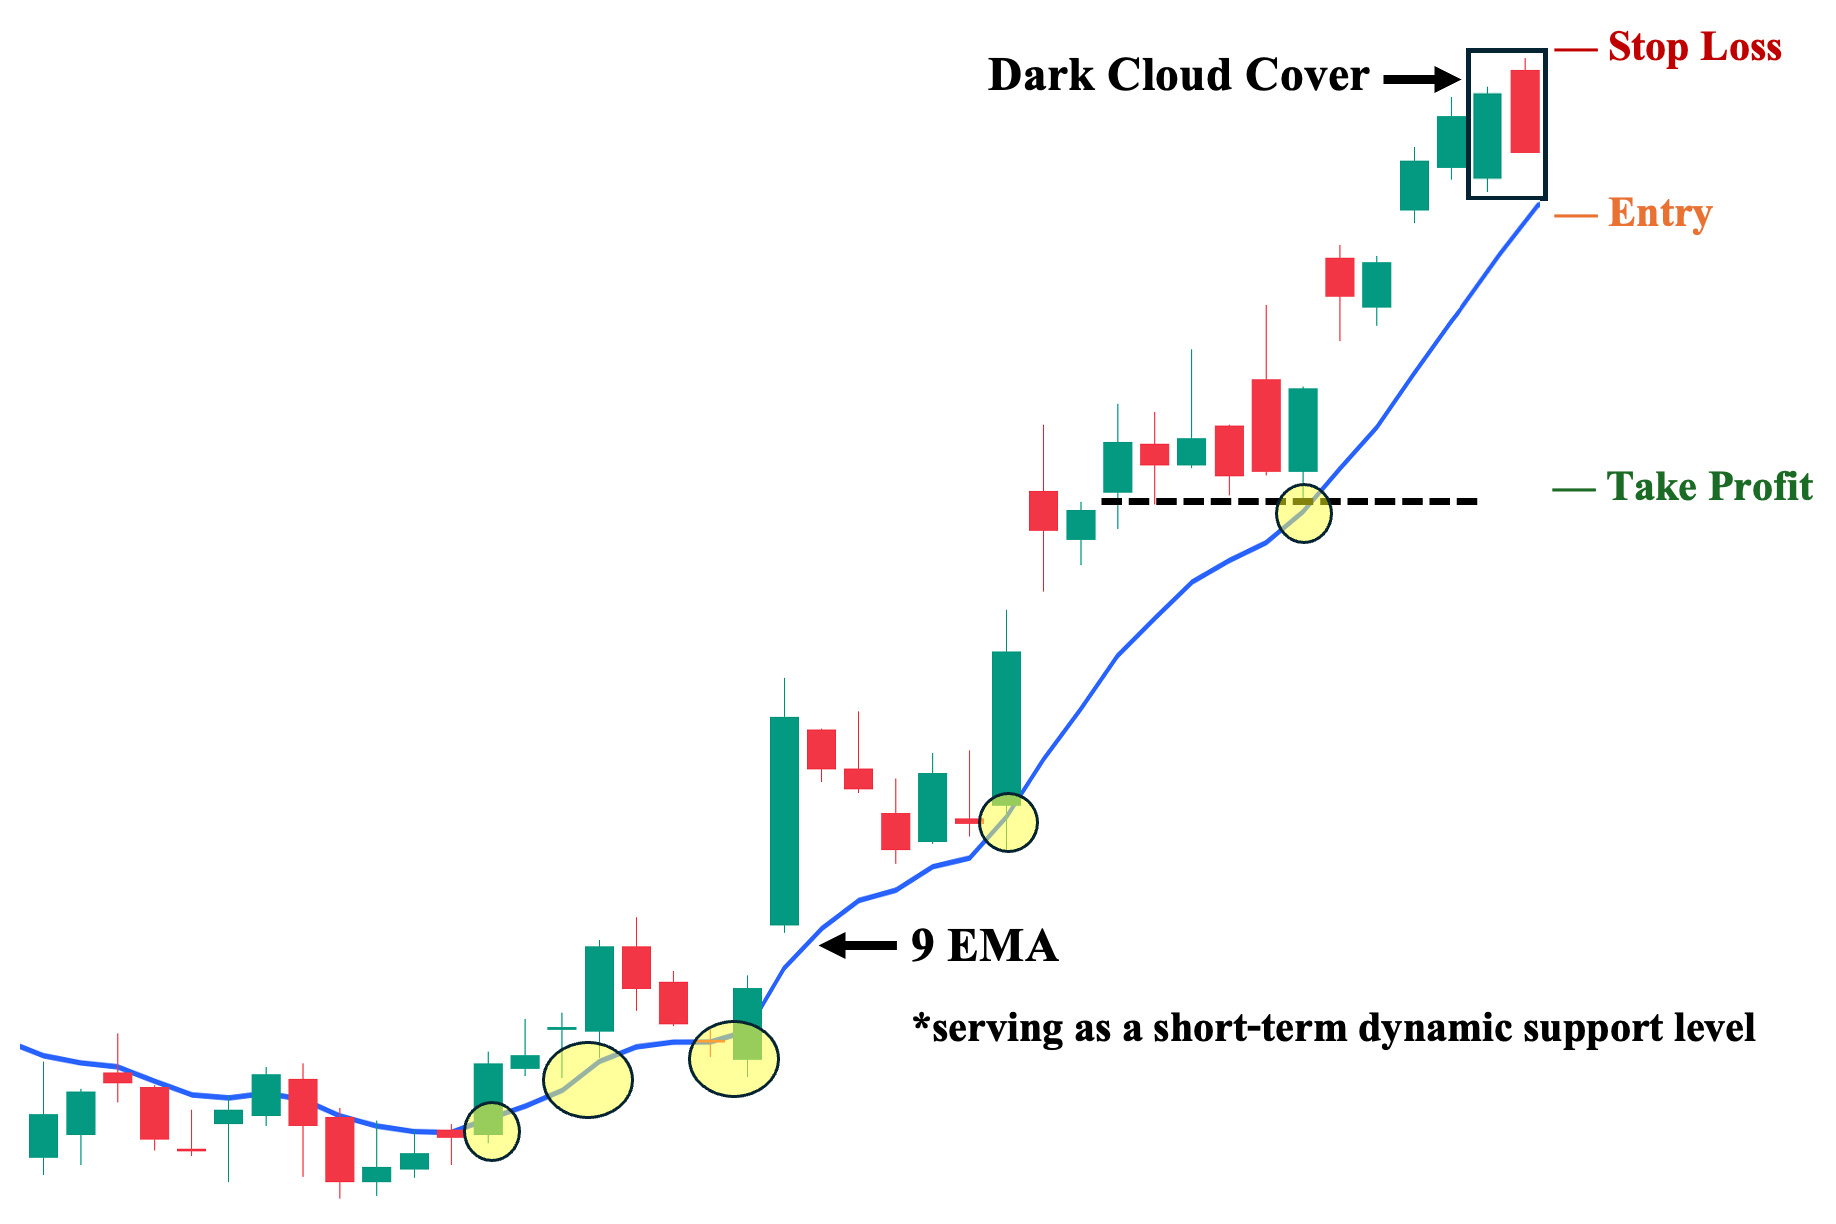
We can also incorporate a complementary moving average that aligns well with the specific trade we are analyzing. Compared to other technical indicators, moving averages (MAs) are highly versatile and can adapt to various trade scenarios, such as exiting long positions or taking short positions. For example, we can use a short-term momentum-based MA, like the 9-day Exponential Moving Average (9 EMA), as both a dynamic support level and a price reversal confirmation tool. Furthermore, observing how the 9 EMA supports the upward price rally (highlighted in yellow) shows its reliability in this trade. Therefore, after the dark cloud cover appears, we wait for a close below the 9 EMA to confirm the price reversal.
1. Entry Point: A few ticks below the 9 EMA (the price must close below this dynamic support level first).
2. Stop Loss Point: Set your stop loss a few ticks above the high of the pattern’s second (bearish) candle.
3. Take Profit (TP) Level: Set your TP a few ticks above the nearest potential key structural support level.
4. Trailing Stop: Once in the trade, sell if the price closes above the 9 EMA before reaching your TP, as this signifies a likely renewed bullish momentum.
5. Risk-Reward Ratio: The risk/reward ratio must be at least 1:1. We do not recommend taking trades with a ratio below this in any trading situation.
Dark Cloud Cover with Relative Strength Index (RSI) Divergence
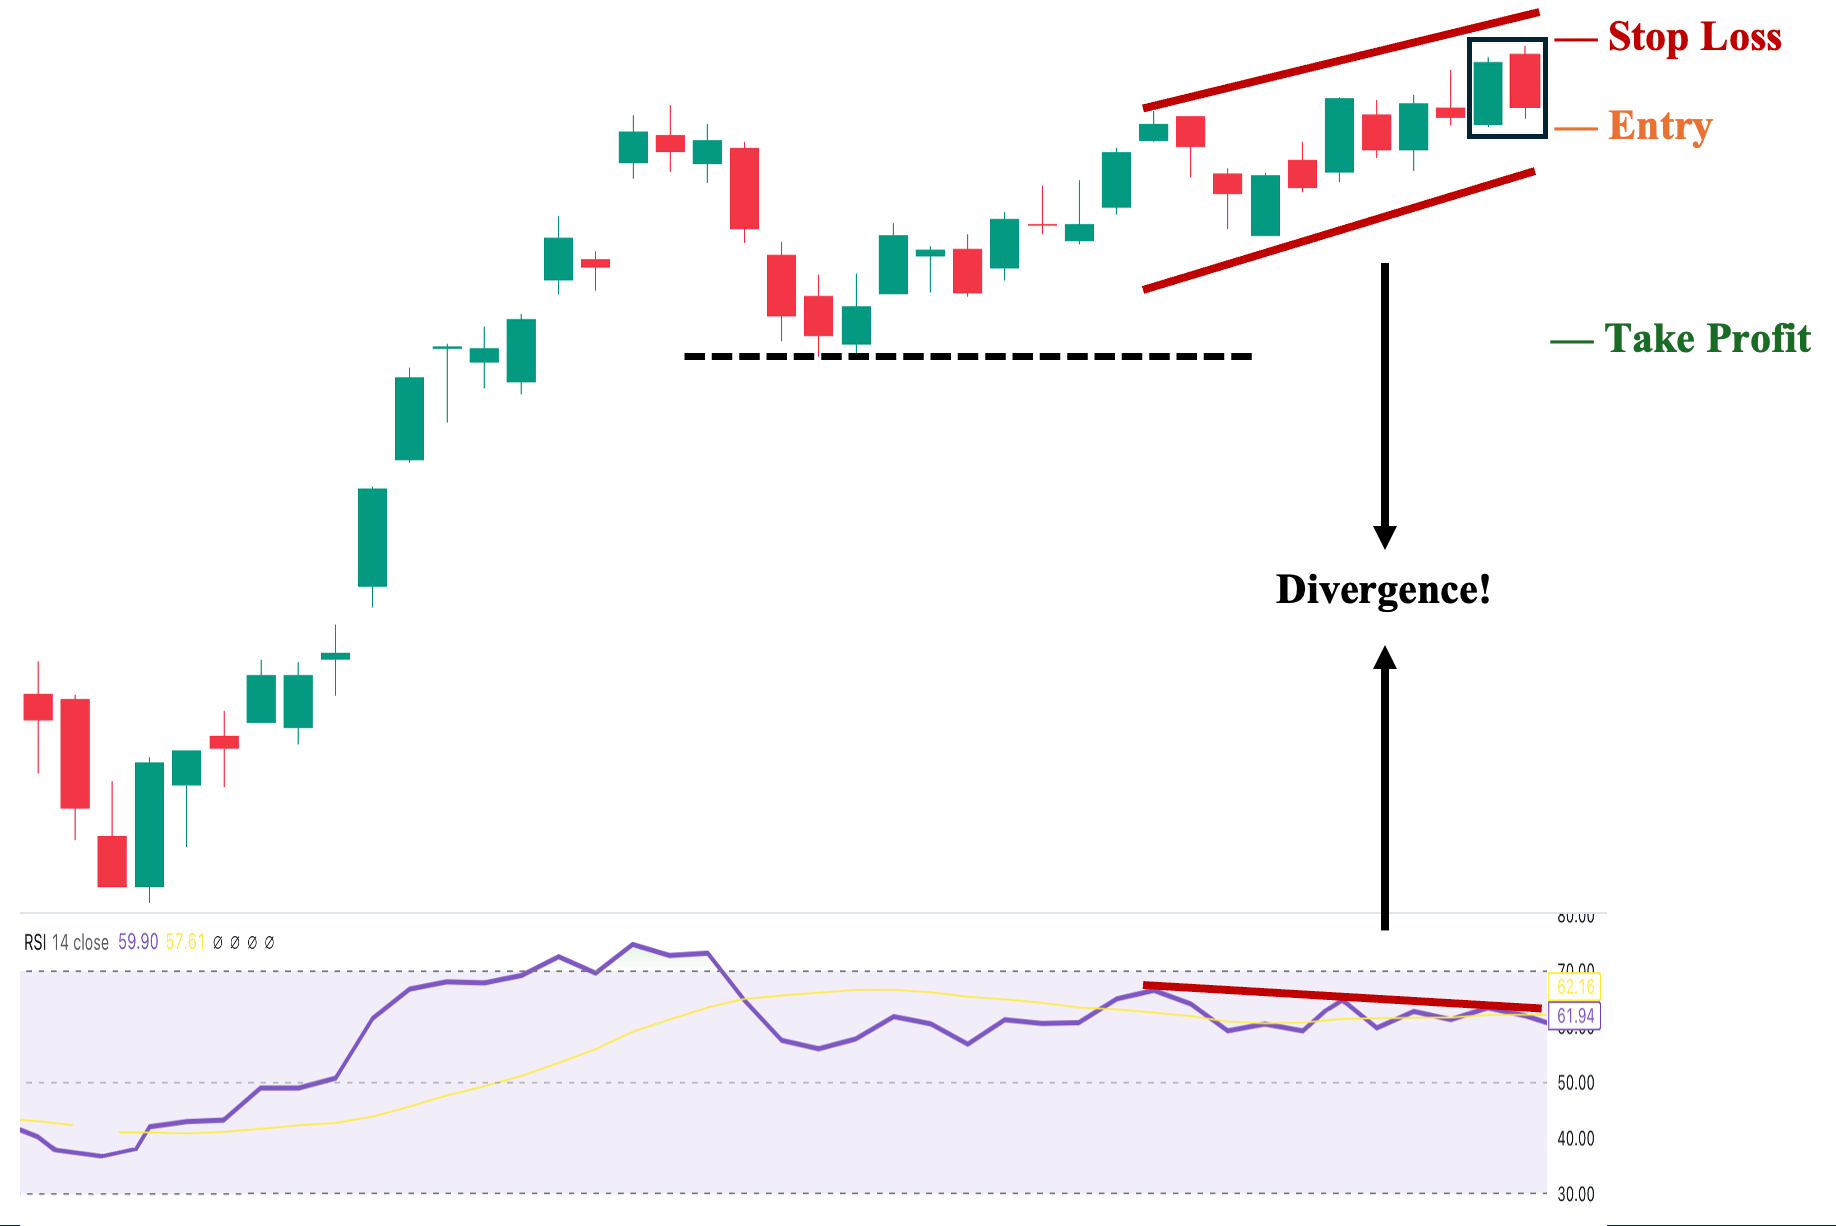
One of the most reliable tools for exiting long positions and taking short positions when paired with the dark cloud cover is the RSI’s divergence signal. A “divergence” occurs when the price and RSI move in opposite directions. In technical analysis, this often signals that the price is likely to follow the RSI’s direction. In this case, RSI acts as a “leading” indicator, predicting price movements more effectively than other technical indicators, which are typically used for confirmation.
For example, on the chart above, while the price has been making higher lows and higher highs in recent trading sessions, the RSI has been sloping downward—creating a clear visual divergence. In this case, the appearance of the dark cloud cover as a bearish reversal pattern serves as “confirmation” of the RSI divergence (hence why it’s considered a leading indicator), rather than the usual approach where technical indicators simply confirm or invalidate the reversal or continuation signal of a candlestick pattern.
1. Entry Point: A few ticks below the low of the pattern’s second (bearish) candle.
2. Stop Loss Point: Set your stop loss a few ticks above the high of the pattern’s second (bearish) candle.
3. Take Profit (TP) Level: Set your TP a few ticks above the nearest potential key structural support level.
4. Trailing Stop: Sell if the price and RSI diverge once again (the price is still going down when RSI starts to point upwards).
5. Risk-Reward Ratio: The risk/reward ratio must be at least 1:1. We do not recommend taking trades with a ratio below this in any trading situation.
Dark Cloud Cover with Moving Average Convergence Divergence (MACD)
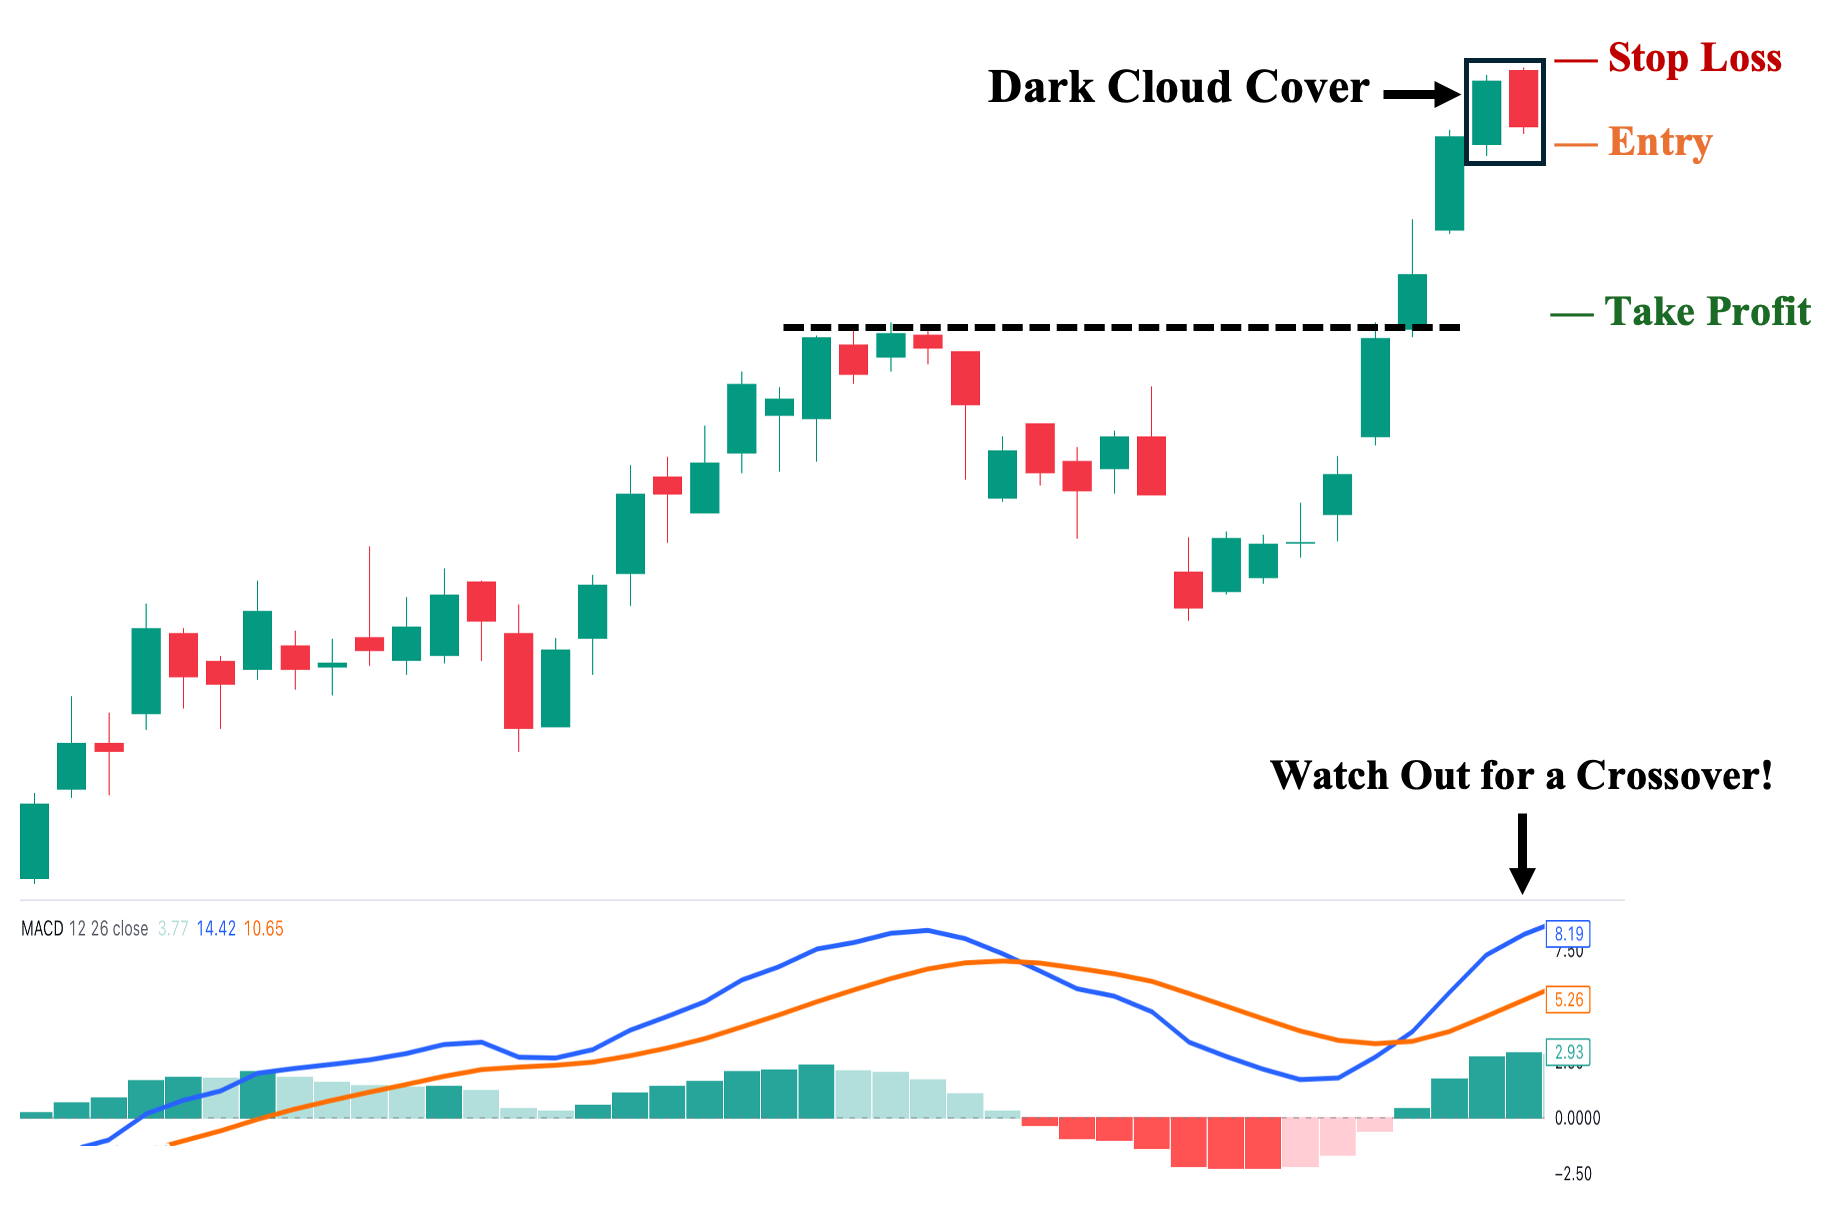
Fifth, as one of the most popular oscillator indicators, the MACD is widely used as a confirmation tool when considering long or short positions based on candlestick patterns like the dark cloud cover. In this case, we observe a clear uptrend before the formation of the dark cloud cover. After validating the candlestick pattern, we wait for the signal (orange) line to cross above the MACD (blue) line—known as a “bearish crossover.” This indicates a shift in momentum from bullish to bearish, supporting the pattern’s signal.
Note: A primary caveat of using the MACD crossover as a confirmation tool is the inherent delay. Often, by the time the crossover occurs, the price has already moved significantly, limiting the opportunity for an optimal entry.
1. Entry Point: A few ticks below the low of the pattern’s second (bearish) candle.
2. Stop Loss Point: Set your stop loss a few ticks above the high of the pattern’s second (bearish) candle.
3. Take Profit (TP) Level: Set your TP a few ticks above the nearest potential key structural support level.
4. Trailing Stop: Sell if the blue line crosses above the orange line before hitting your TP.
5. Risk-Reward Ratio: The risk/reward ratio must be at least 1:1. We do not recommend taking trades with a ratio below this in any trading situation.
Dark Cloud Cover with Fibonacci Retracement Levels
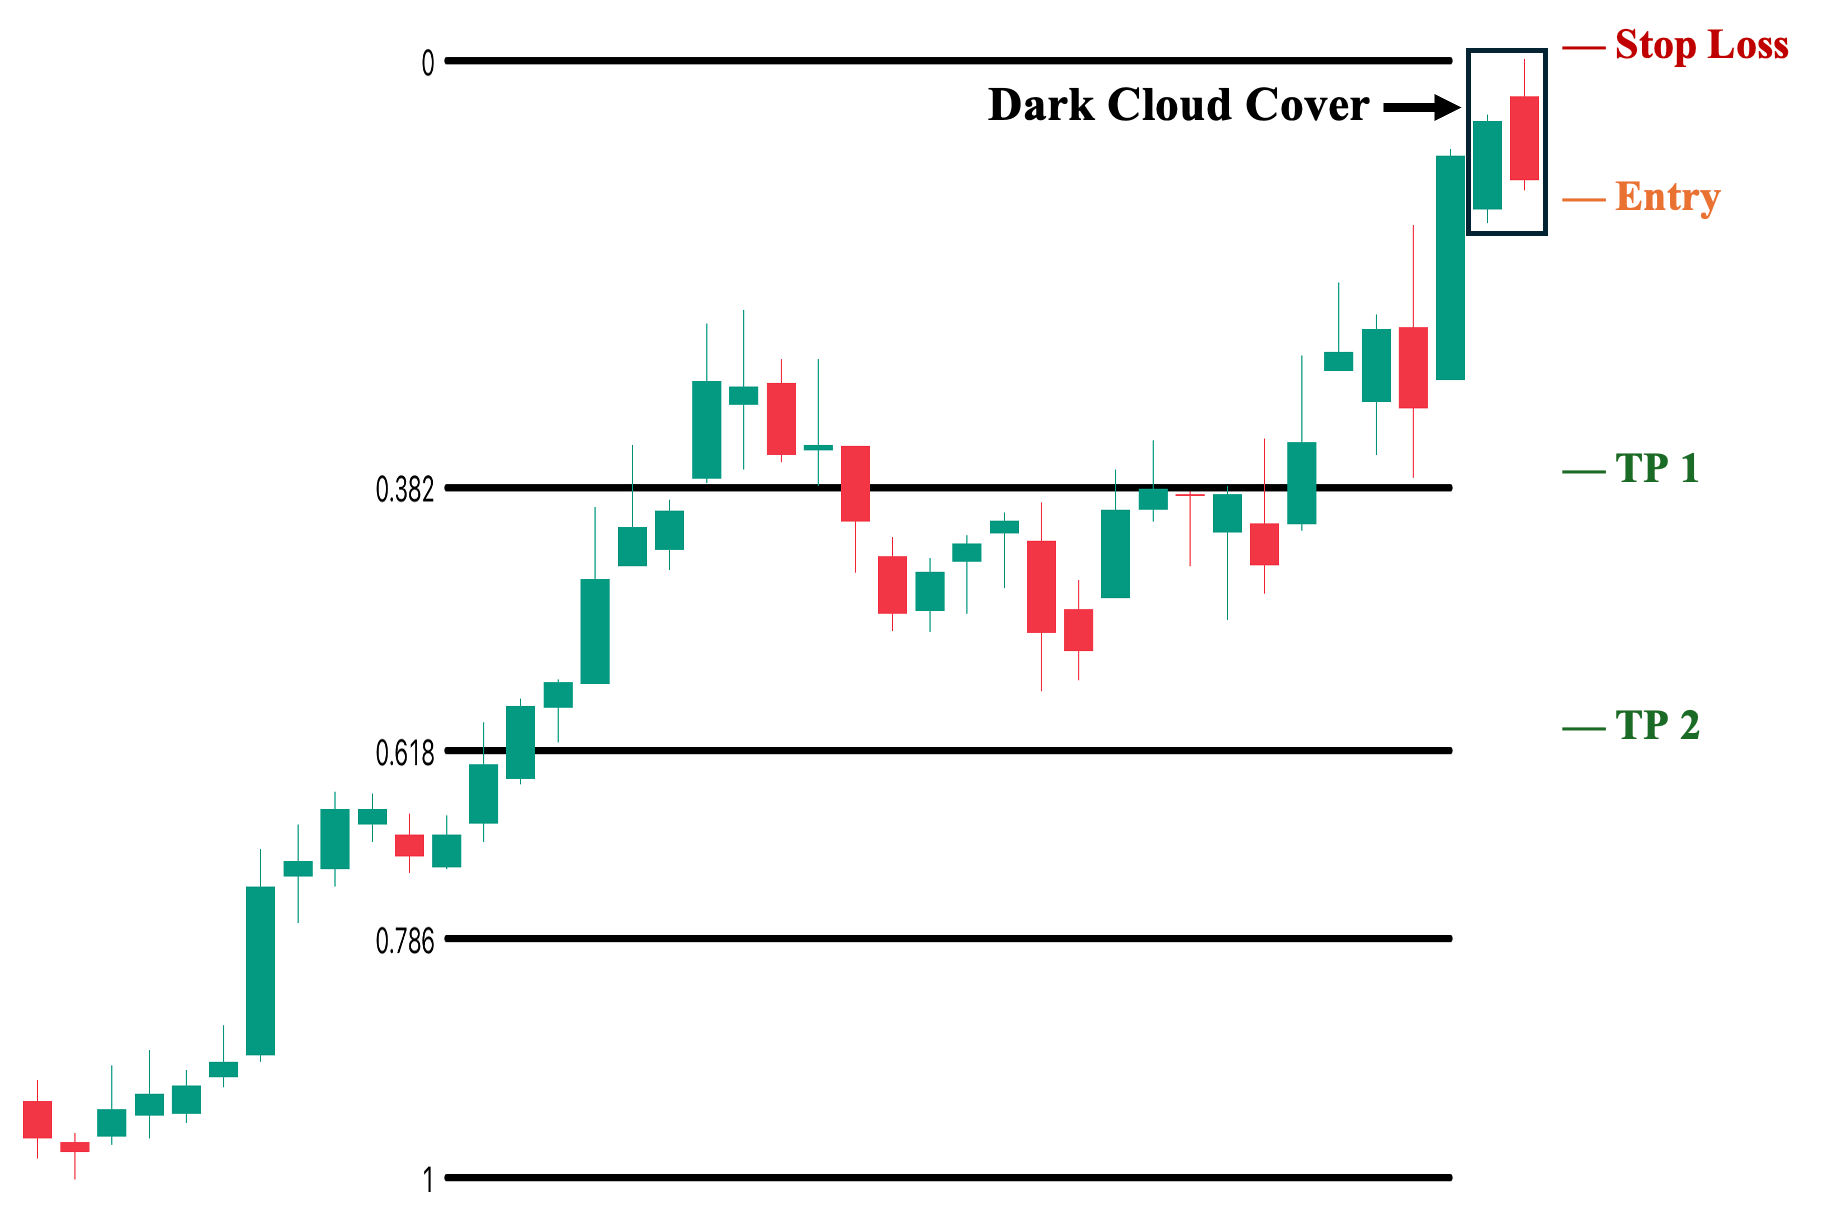
Sixth, Fibonacci (Fib) retracement levels are extremely useful after placing your long or short positions. In this context, Fib levels help identify key price levels where you can set your take-profit (TP) orders once the dark cloud cover candlestick pattern confirms a bearish reversal signal. In this trade example, we observe an uptrend leading to the pattern’s formation. If we take a short position, we can plot Fib levels to identify key support levels and place our TP orders. Additionally, we can sell in tranches based on these levels (e.g., place the first TP around 0.382, and if the price breaks this level, set the second TP at 0.618).
1. Entry Point: A few ticks below the low of the pattern’s second (bearish) candle.
2. Stop Loss Point: Set your stop loss a few ticks above the high of the pattern’s second (bearish) candle.
3. Take Profit (TP) Level: If your strategy involves selling in tranches, you can set your first TP a few ticks above the nearest Fib level (0.382) and your second TP a few ticks above the next Fib level (0.618).
4. Risk-Reward Ratio: The risk/reward ratio must be at least 1:1. We do not recommend taking trades with a ratio below this in any trading situation.
Dark Cloud Cover with Pivot Points
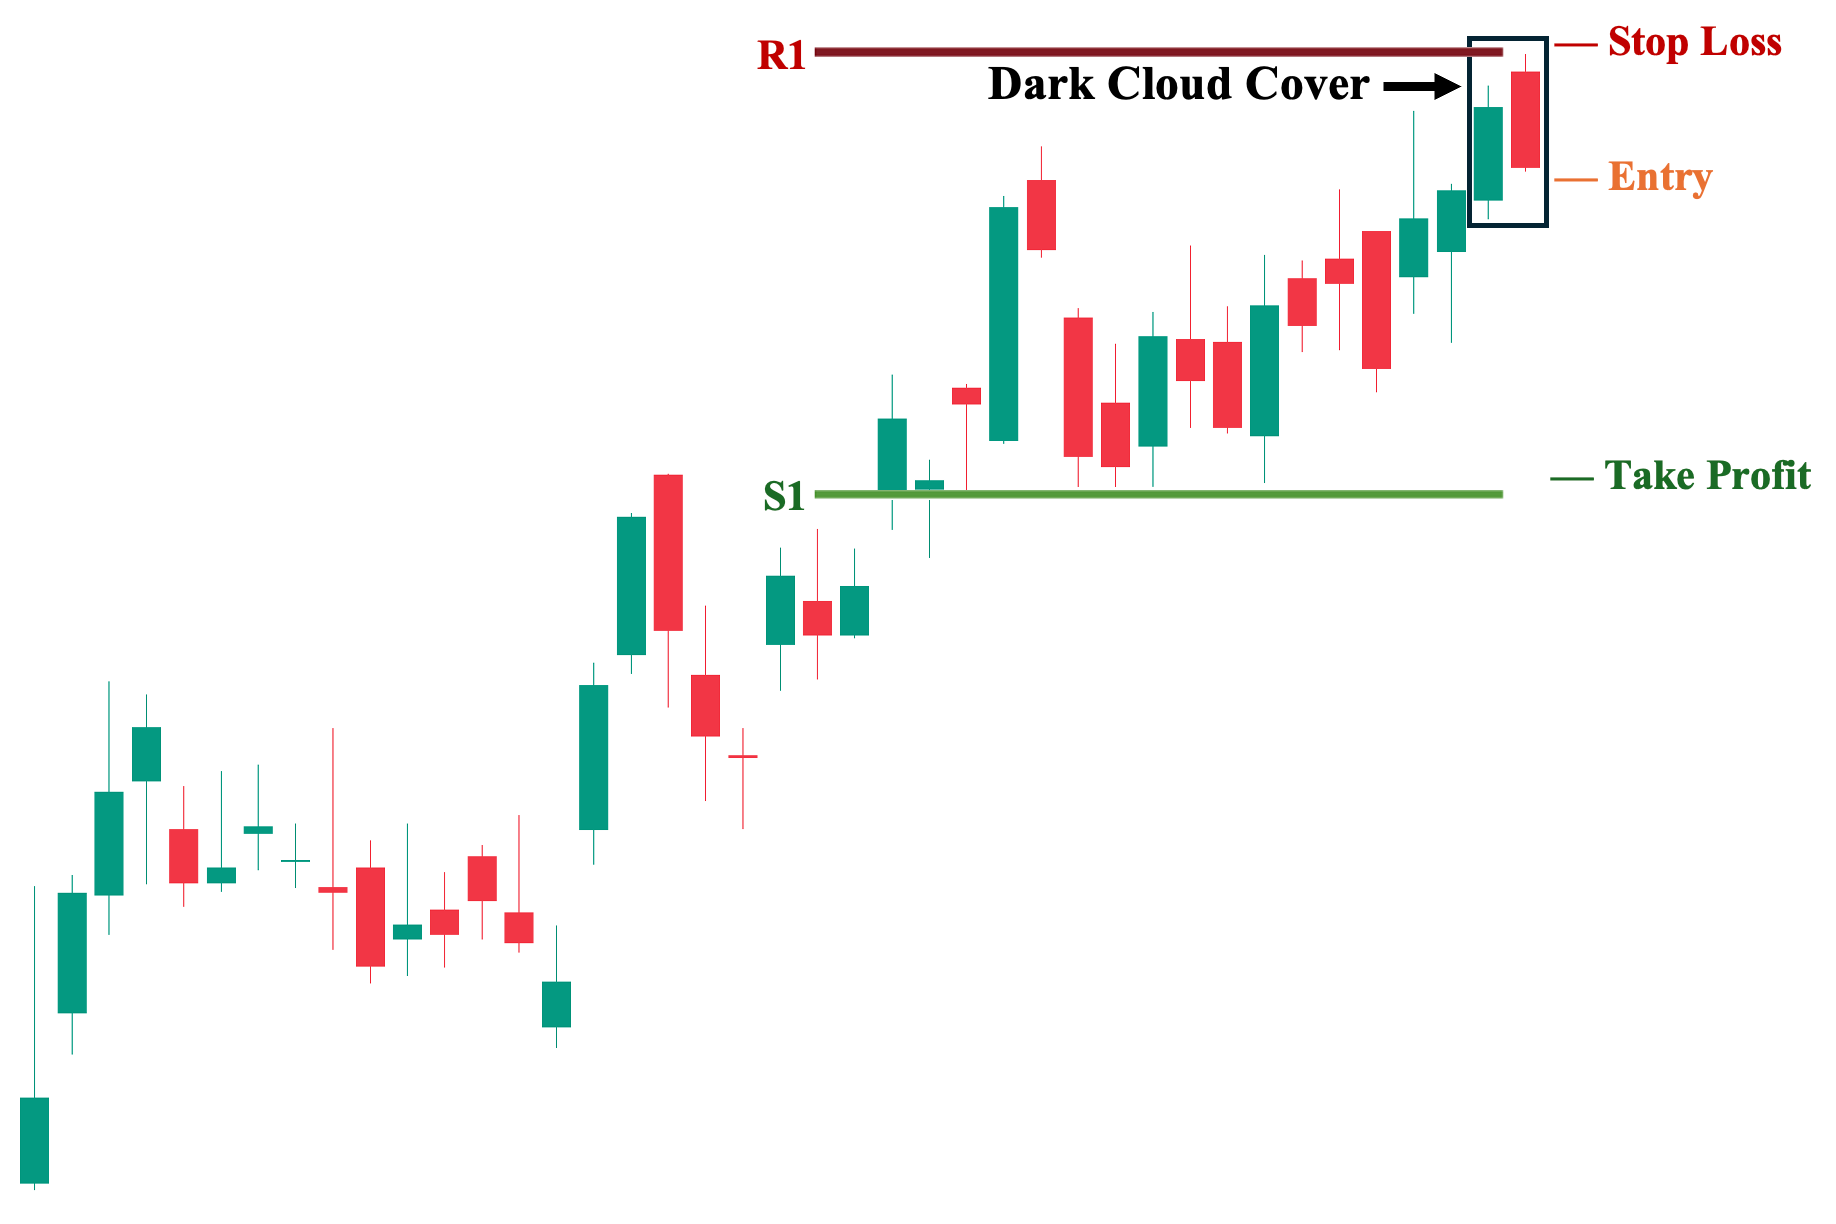
Seventh, as a technical analysis tool, pivot points can be used similarly to Fib levels to automatically identify potential key levels. In this example, we observe an uptrend before the formation of a dark cloud cover pattern. By generating pivot points, we can identify suggested support levels (S1, S2, etc.) and resistance levels (R1, R2, etc.). These key levels can then be used to plan a short position—placing a stop-loss around the first resistance level (R1) and a take-profit (TP) around the first support level (S1).
1. Entry Point: A few ticks below the low of the pattern’s second (bearish) candle.
2. Stop Loss Point: Set your stop loss a few ticks above the R1 level.
3. Take Profit (TP) Level: Set your TP a few ticks above the S1 level.
4. Risk-Reward Ratio: The risk/reward ratio must be at least 1:1. We do not recommend taking trades with a ratio below this in any trading situation.
Dark Cloud Cover with Volume Indicator
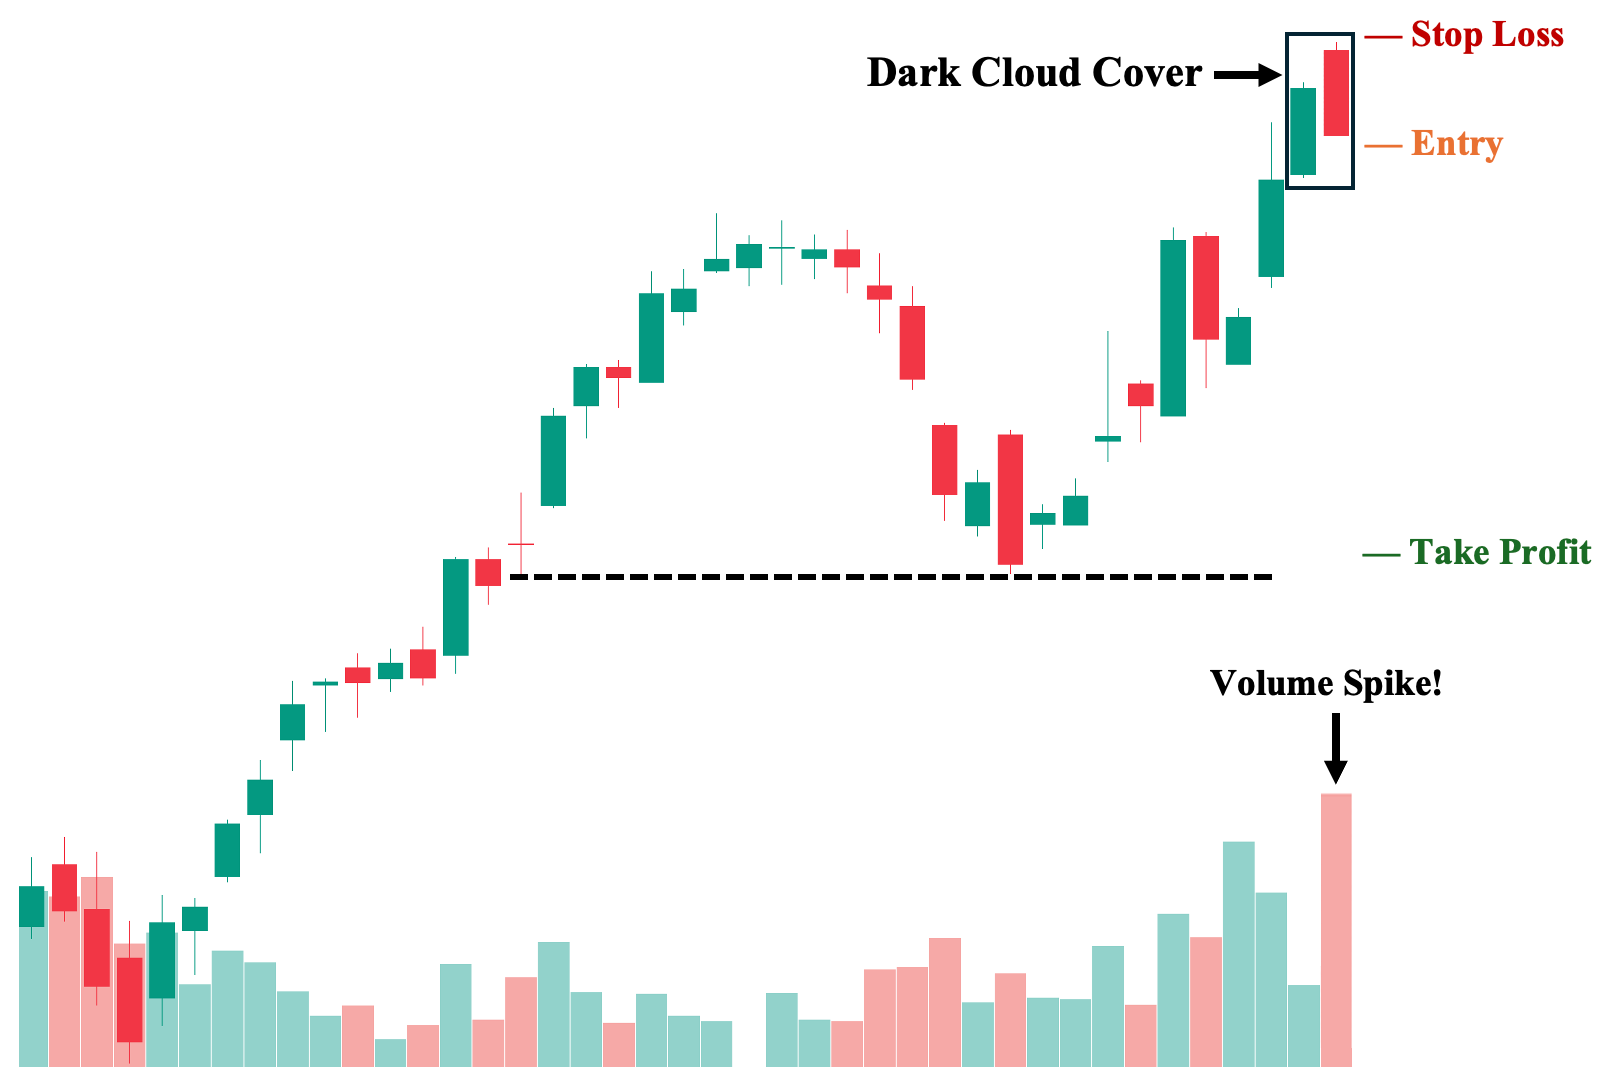
Finally, unlike other technical indicators, volume is completely independent of price action. Its value is not derived from price but represents the aggregate of all trades in a particular session. This makes it a valuable tool for independent evaluation when the dark cloud cover occurs.
Generally, we want to see above-average volume on the second candle of the dark cloud cover—preferably higher than the first, the previous bullish candle. A volume spike here signals strong selling pressure. Low volume on the second candle may indicate a normal pullback, while substantial volume suggests that sellers are taking control, making it a potent bearish signal.
1. Entry Point: A few ticks below the low of the pattern’s second (bearish) candle.
2. Stop Loss Points: Set your stop loss a few ticks above the high of the pattern’s second (bearish) candle.
3. Take Profit (TP) Level: Set your TP a few ticks above the nearest potential key structural support level.
4. Risk-Reward Ratio: The risk/reward ratio must be at least 1:1. We do not recommend taking trades with a ratio below this in any trading situation.
Advantages of Trading on the Dark Cloud Cover Pattern
Here are the key advantages of using the dark cloud cover pattern to help you make more informed trading decisions:
1. Decisive Reversal Signal
First, given the appropriate market context, the dark cloud cover candlestick pattern provides a relatively more decisive bearish reversal signal compared to other candlestick patterns. For instance, while a tweezer top, also classified as a bearish reversal pattern, highlights a rejection of higher prices and the inability of price to break above a two-candle “ceiling,” its strength lies in the fact that prices are not advancing further rather than being a catalyst for a potential sustained downward move. In comparison, a dark cloud cover does not only shows an active rejection of further price advance but also a decisive bearish move within the two day period.
2. Valuable Market Sentiment/Psychological Insight
Second, the dark cloud cover candlestick pattern provides a clear visual representation of market psychology—showing initial optimism from the first long bullish candle and the second candle’s gap-up, followed by a sudden and swift bearish countermove that erases much of the previous day’s gains and price advance. This indicates that sellers are in control of price action, as the price may be perceived as “too high,” or a bearish catalyst may have come to light. Thus, understanding dark cloud cover leads to a better grasp of the fuller picture of the overall market sentiment.
3. Excellent at Identifying Possible Exhaustion
Third, whether you are looking for new short positions or exiting long positions (assuming you are riding an asset’s uptrend until exhaustion), the dark cloud cover candlestick pattern provides valuable insight into the state of the ongoing uptrend. This is especially true for assets with extended uptrends where fundamentals are starting to deteriorate or at least do not meet expectations. Hence, the appearance of a dark cloud cover can then be viewed as the manifestation of a bearish outlook as bullish pressure begins to fade.
Disadvantages of Trading on the Dark Cloud Cover Pattern
Here are the key disadvantages of using the dark cloud cover pattern that you need to be aware of:
1. Dependent on Confirmation
First, while the dark cloud cover candlestick pattern is an incredibly decisive reversal signal, it hinges on the fact that it must be backed by overall market structure and/or received a confirmation from a valid technical indicator. It simply is not dependable on its own as it can be widely misused or misunderstood if used in pure isolation (i.e., in a naked chart without consideration of market context or even volume). In contrast, bearish reversal signals such as three black crows can be more dependable on its own.
2. Skewed Risk-Reward Due to Extended Candles
Second, understanding the dark cloud cover candlestick pattern reveals one of its major downsides, particularly when compared to other bearish reversal patterns such as bearish harami and tweezer tops—it has a less favorable risk-to-reward ratio by default. This is due to the fact that if we follow the default placement of entry, which is below the second candle’s low, and cut loss, which is above the second candle’s high, we would tend to have a bigger space between the two due to the second candle’s usually big range. Contrast this with bearish harami, which because of its second candle’s much smaller candle, gives it a closer placement between its entry and cut loss points.
3. Risky in Parabolic Move Plays
Third, the dark cloud cover candlestick pattern tends to give out false signals when they appear during parabolic phases. This is because, on a heightened bullish momentum, the appearance of a dark cloud cover may simply be a pullback, particularly if the pattern’s second candle did not register an above-average volume (which is incredibly difficult as the normal bullish candles during a parabolic move naturally have elevated volume levels, reflecting an abnormally high bullish pressure). Of course, it is still possible for a dark cloud cover to successfully serve as a bearish reversal pattern during a parabolic phase. However, the odds are not in your favor, especially if volume is lacking.
Dark Cloud Cover vs. Piercing Line Pattern
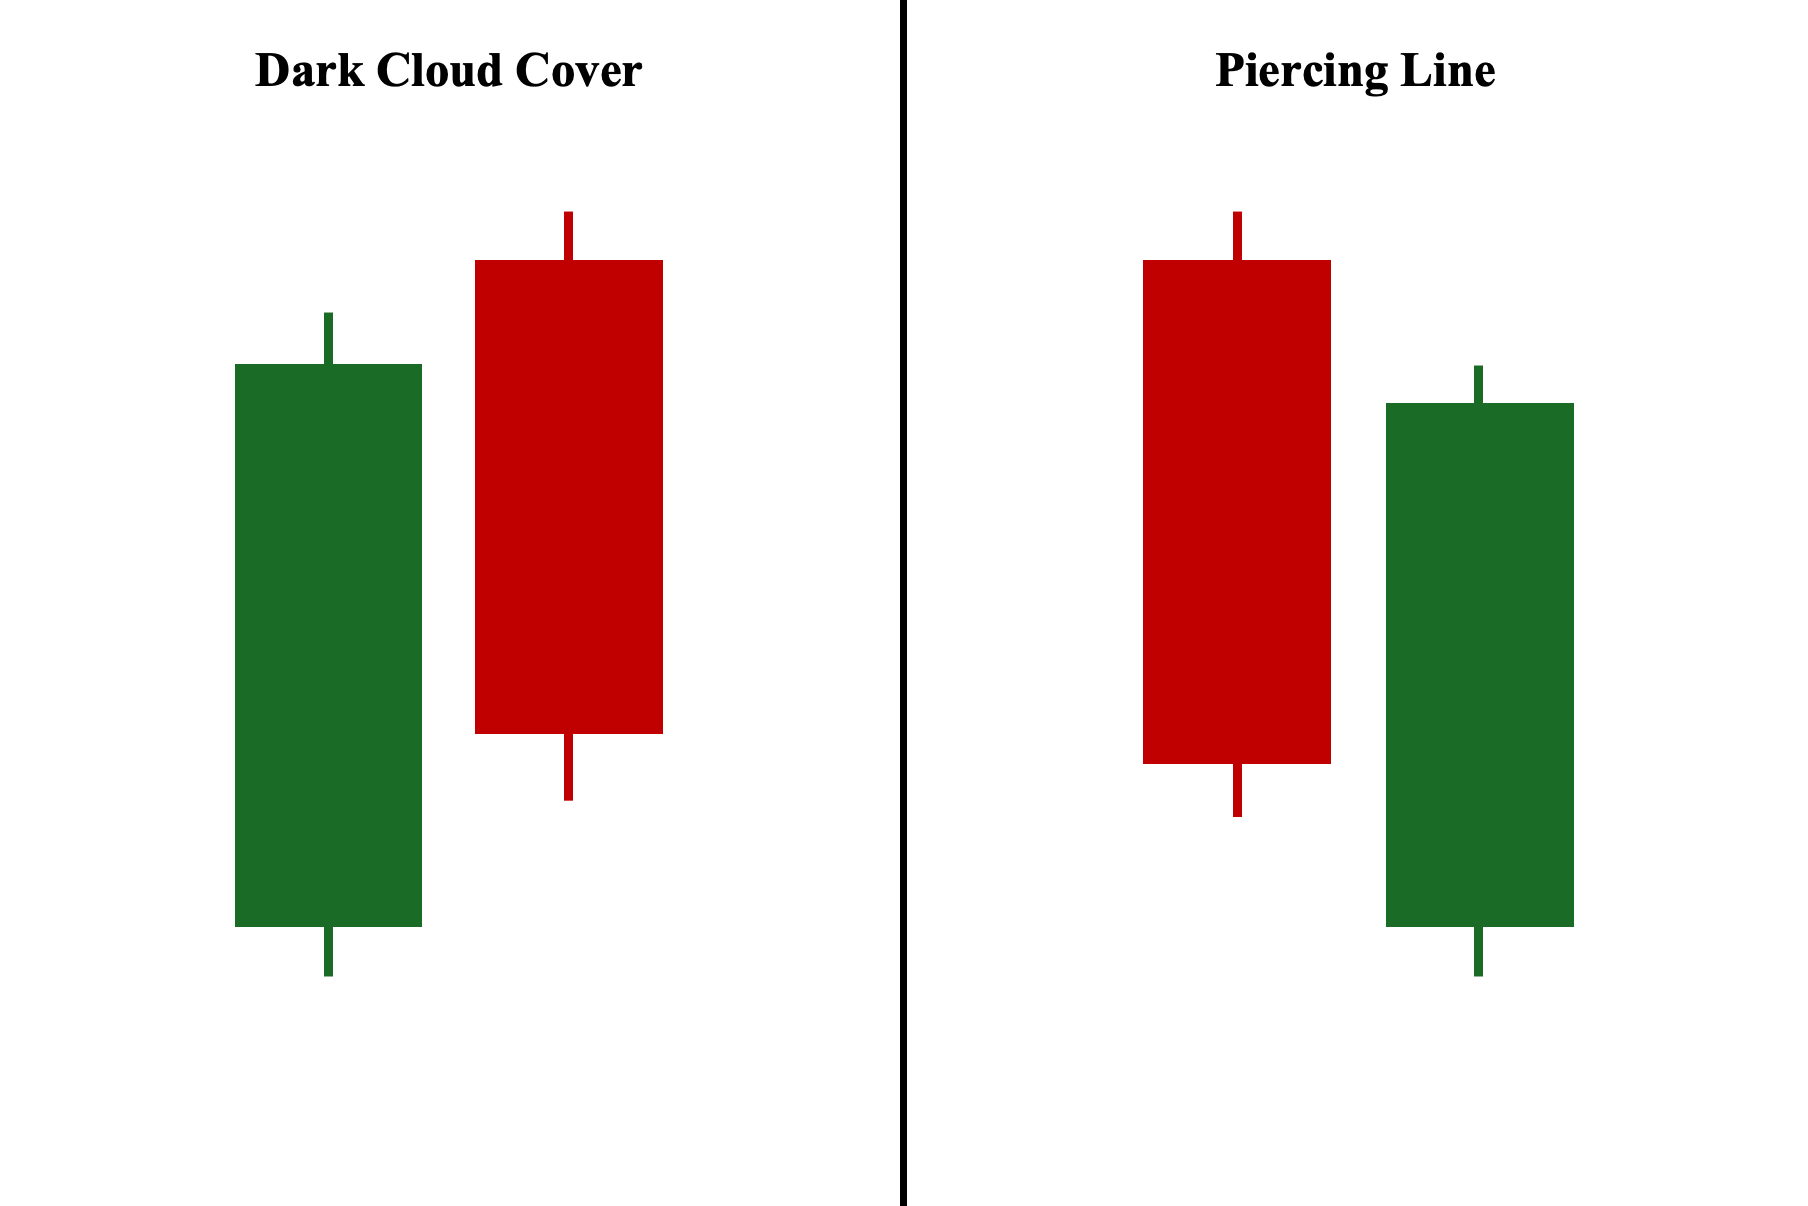
The piercing pattern is simply the bullish counterpart of the dark cloud cover. While the dark cloud cover is a bearish reversal found in an uptrend, composed of a long bullish candle (first candle) and a bearish candle (second candle) that closes below the midpoint of the previous bullish candle, the piercing pattern is the opposite—a bullish reversal pattern found in a downtrend. It consists of a long bearish candle (first candle) and a bullish candle (second candle) that closes above the midpoint of the previous bearish candle, indicating strong buying pressure.
Dark Cloud Cover vs. Bearish Engulfing Pattern
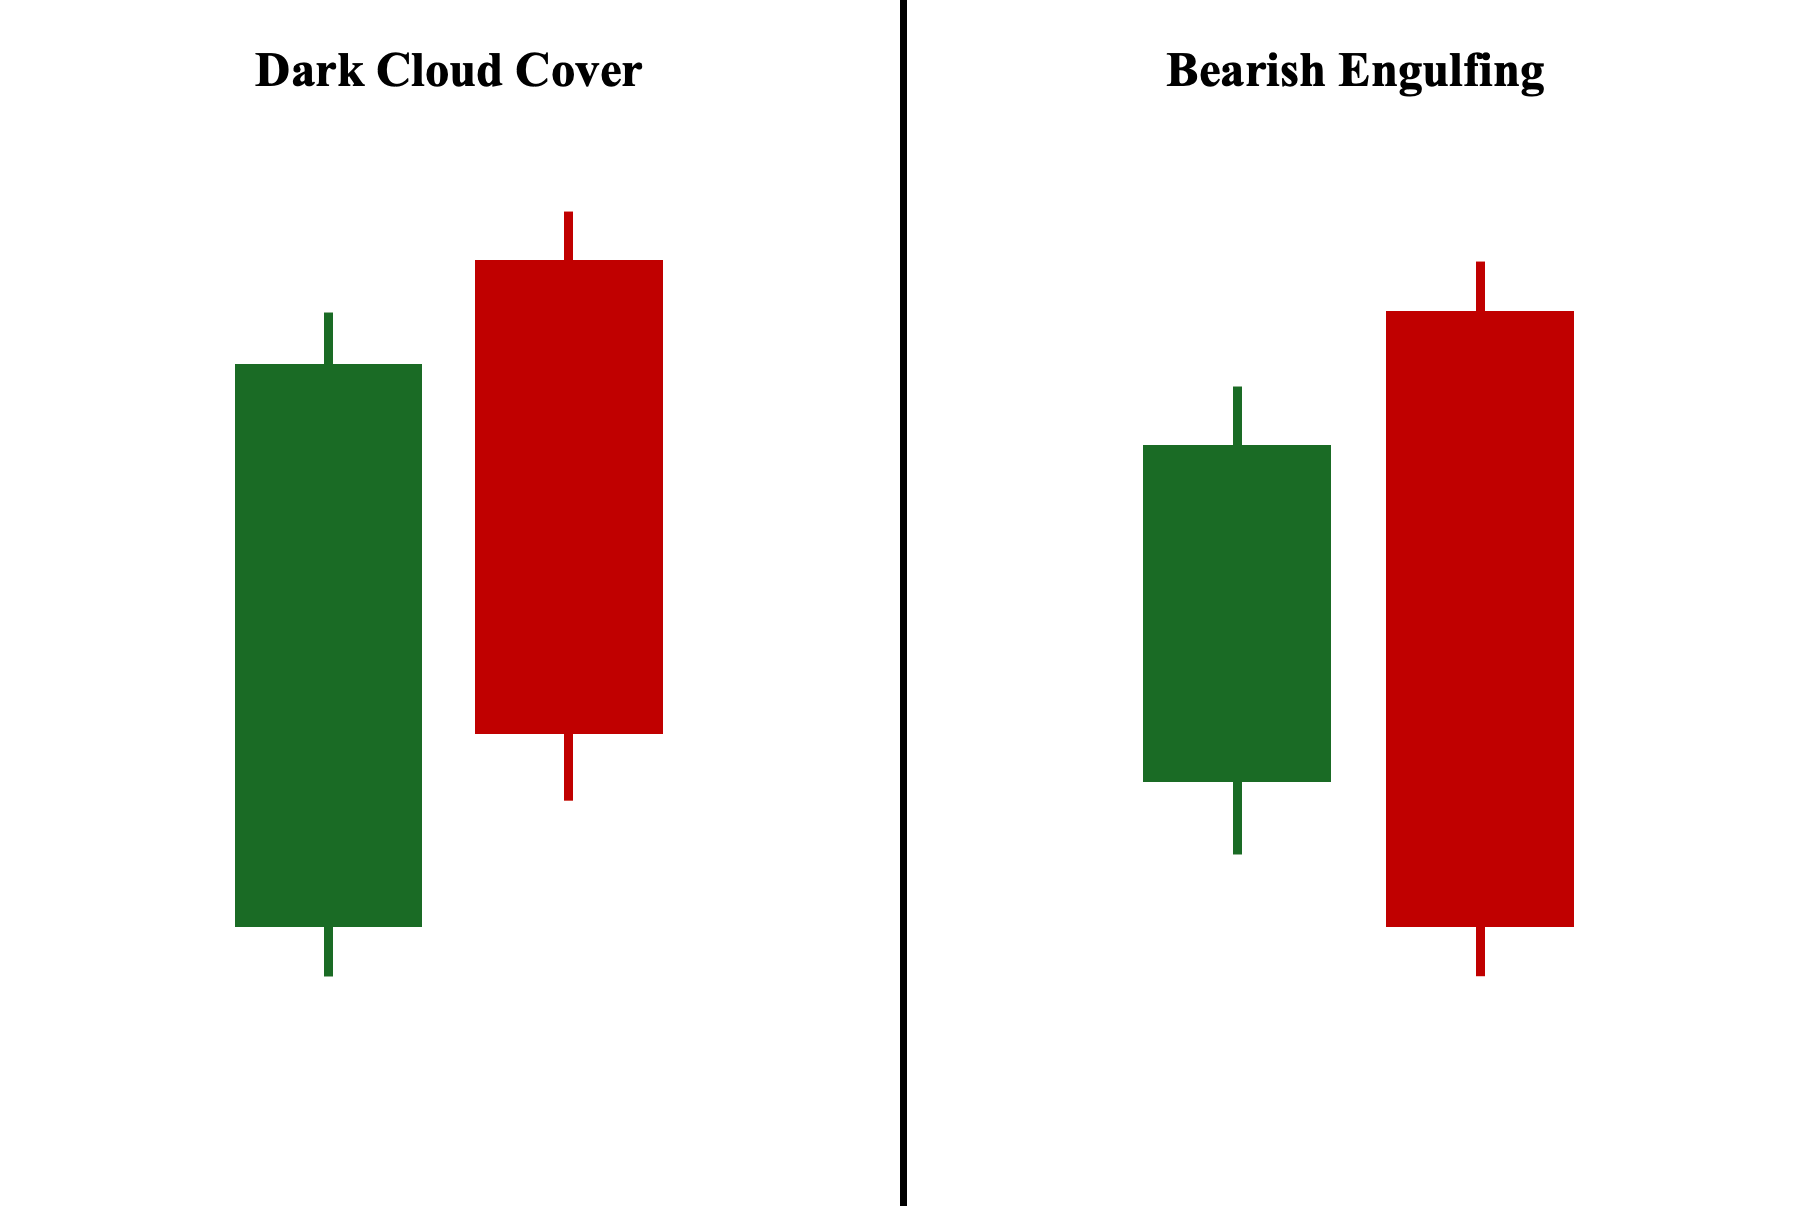
Both the bearish engulfing pattern and the dark cloud cover pattern are bearish reversal formations composed of a bullish candle followed by a bearish candle that closes lower. The key difference is that in the bearish engulfing pattern, the second bearish candle closes by completely engulfing the entire range of the previous candle. This makes the bearish engulfing a more potent bearish reversal signal compared to the dark cloud cover.
Dark Cloud Cover vs. Tweezer Top Pattern
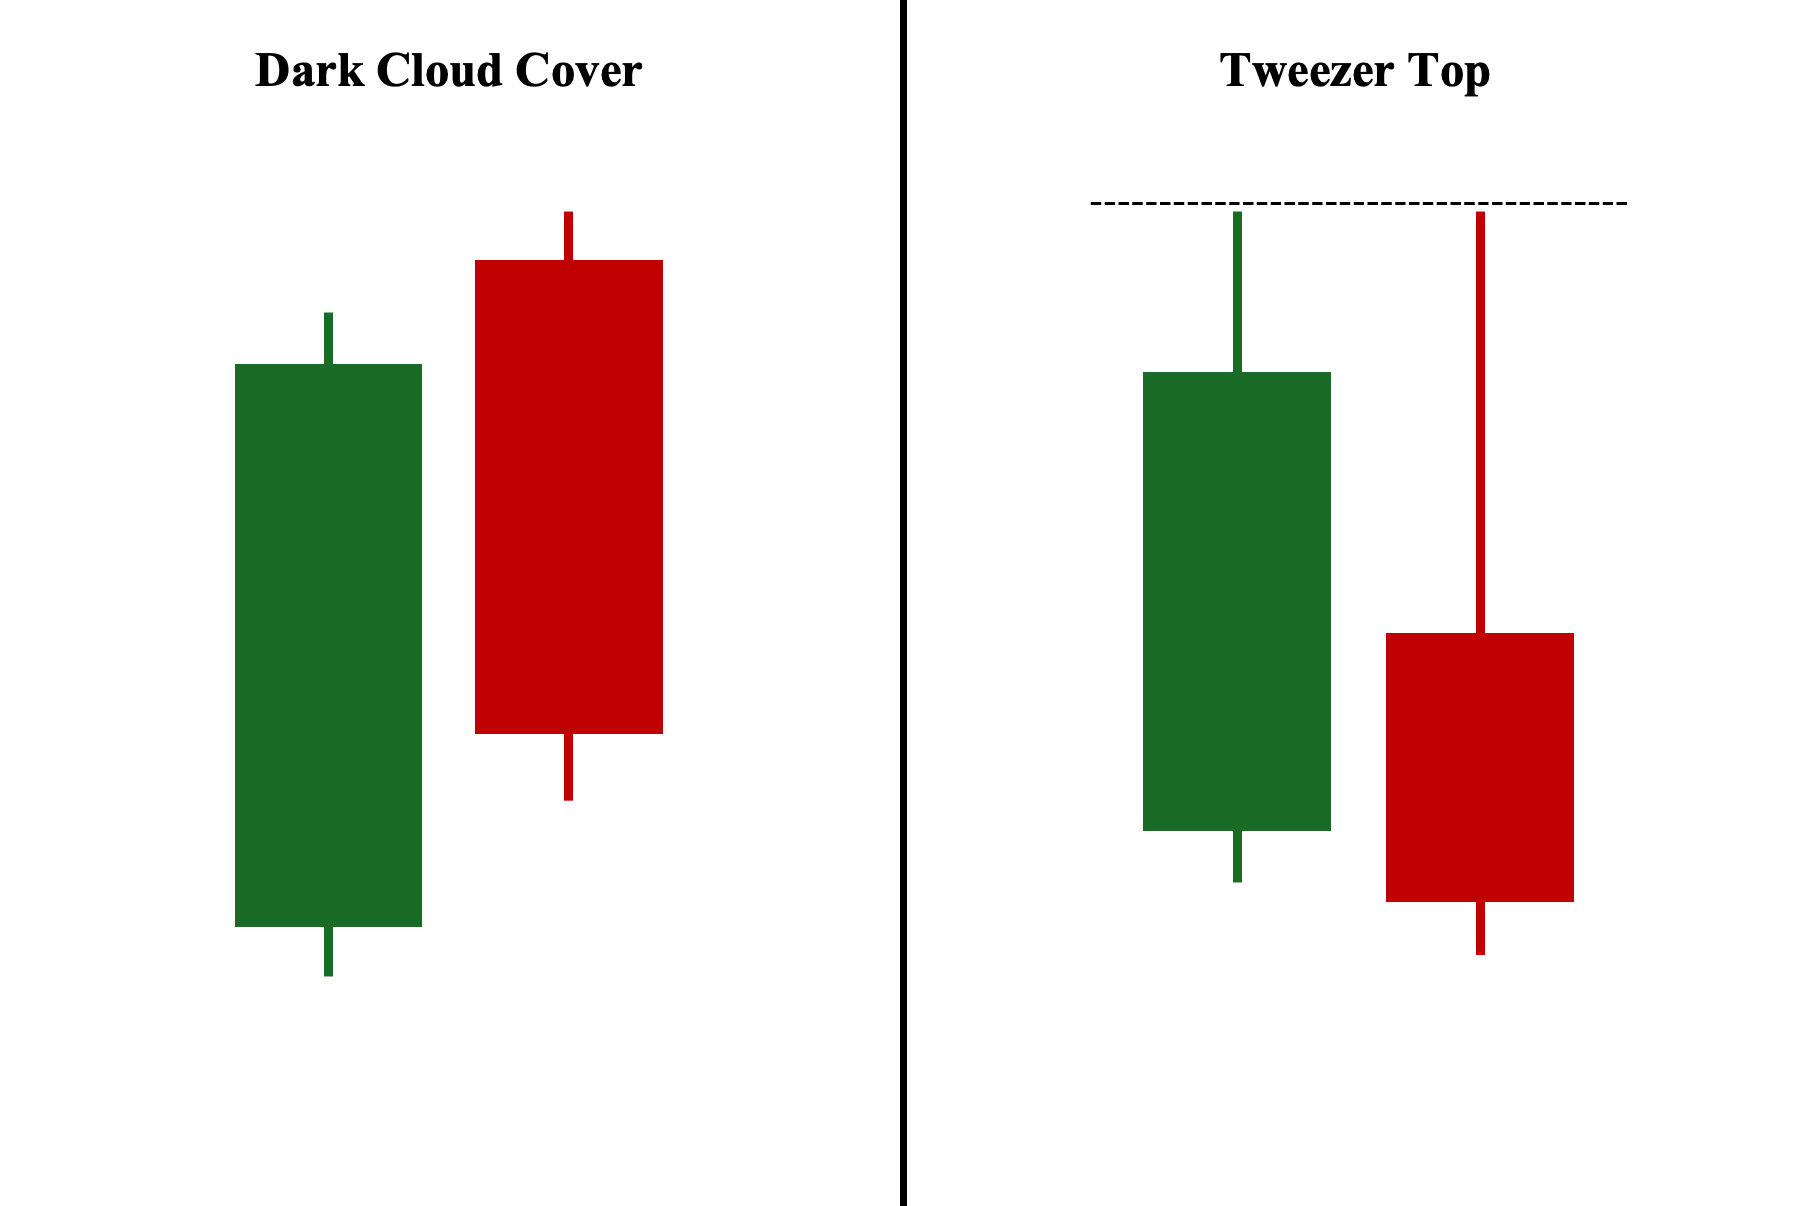
Both the dark cloud cover and tweezer top are bearish reversal patterns. However, unlike the dark cloud cover, the tweezer top’s two candles have identical or near-identical highs, with each candle preferably having a long upper shadow. These long, identical shadows signal the price’s inability to break past the previous candle’s high, indicating weakening buying pressure, growing selling pressure, or a combination of both at the top.
Dark Cloud Cover vs. Double Top Pattern
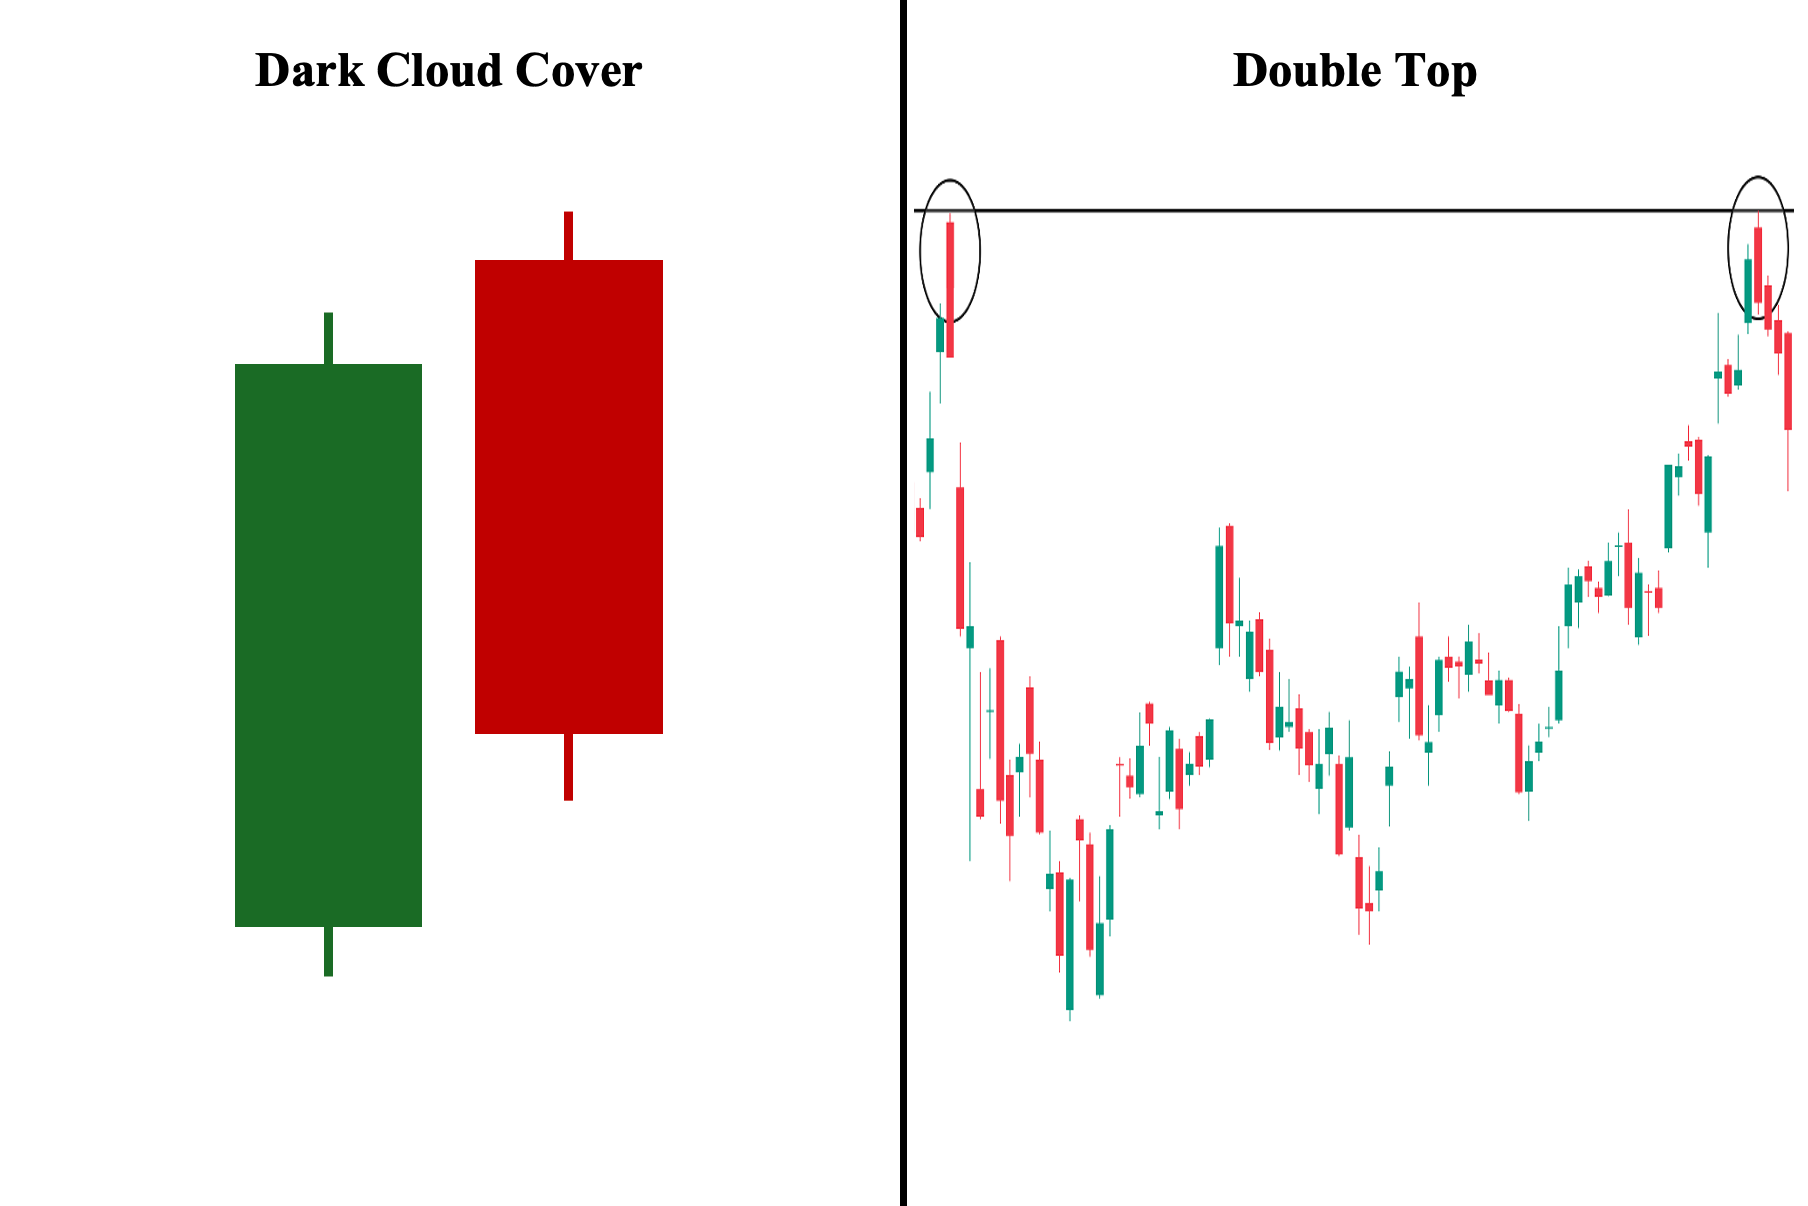
Both the dark cloud cover and double top formations signal bearish trend reversals. However, unlike the dark cloud cover, the double top is not a two-candlestick pattern but a longer-term formation consisting of two widely separated individual candles (as shown in the image above). The double top is generally considered a much stronger bearish reversal signal, as the distance between the two peaks reinforces that these levels represent a long-term price ceiling for the asset.
Dark Cloud Cover vs. Marubozu Pattern
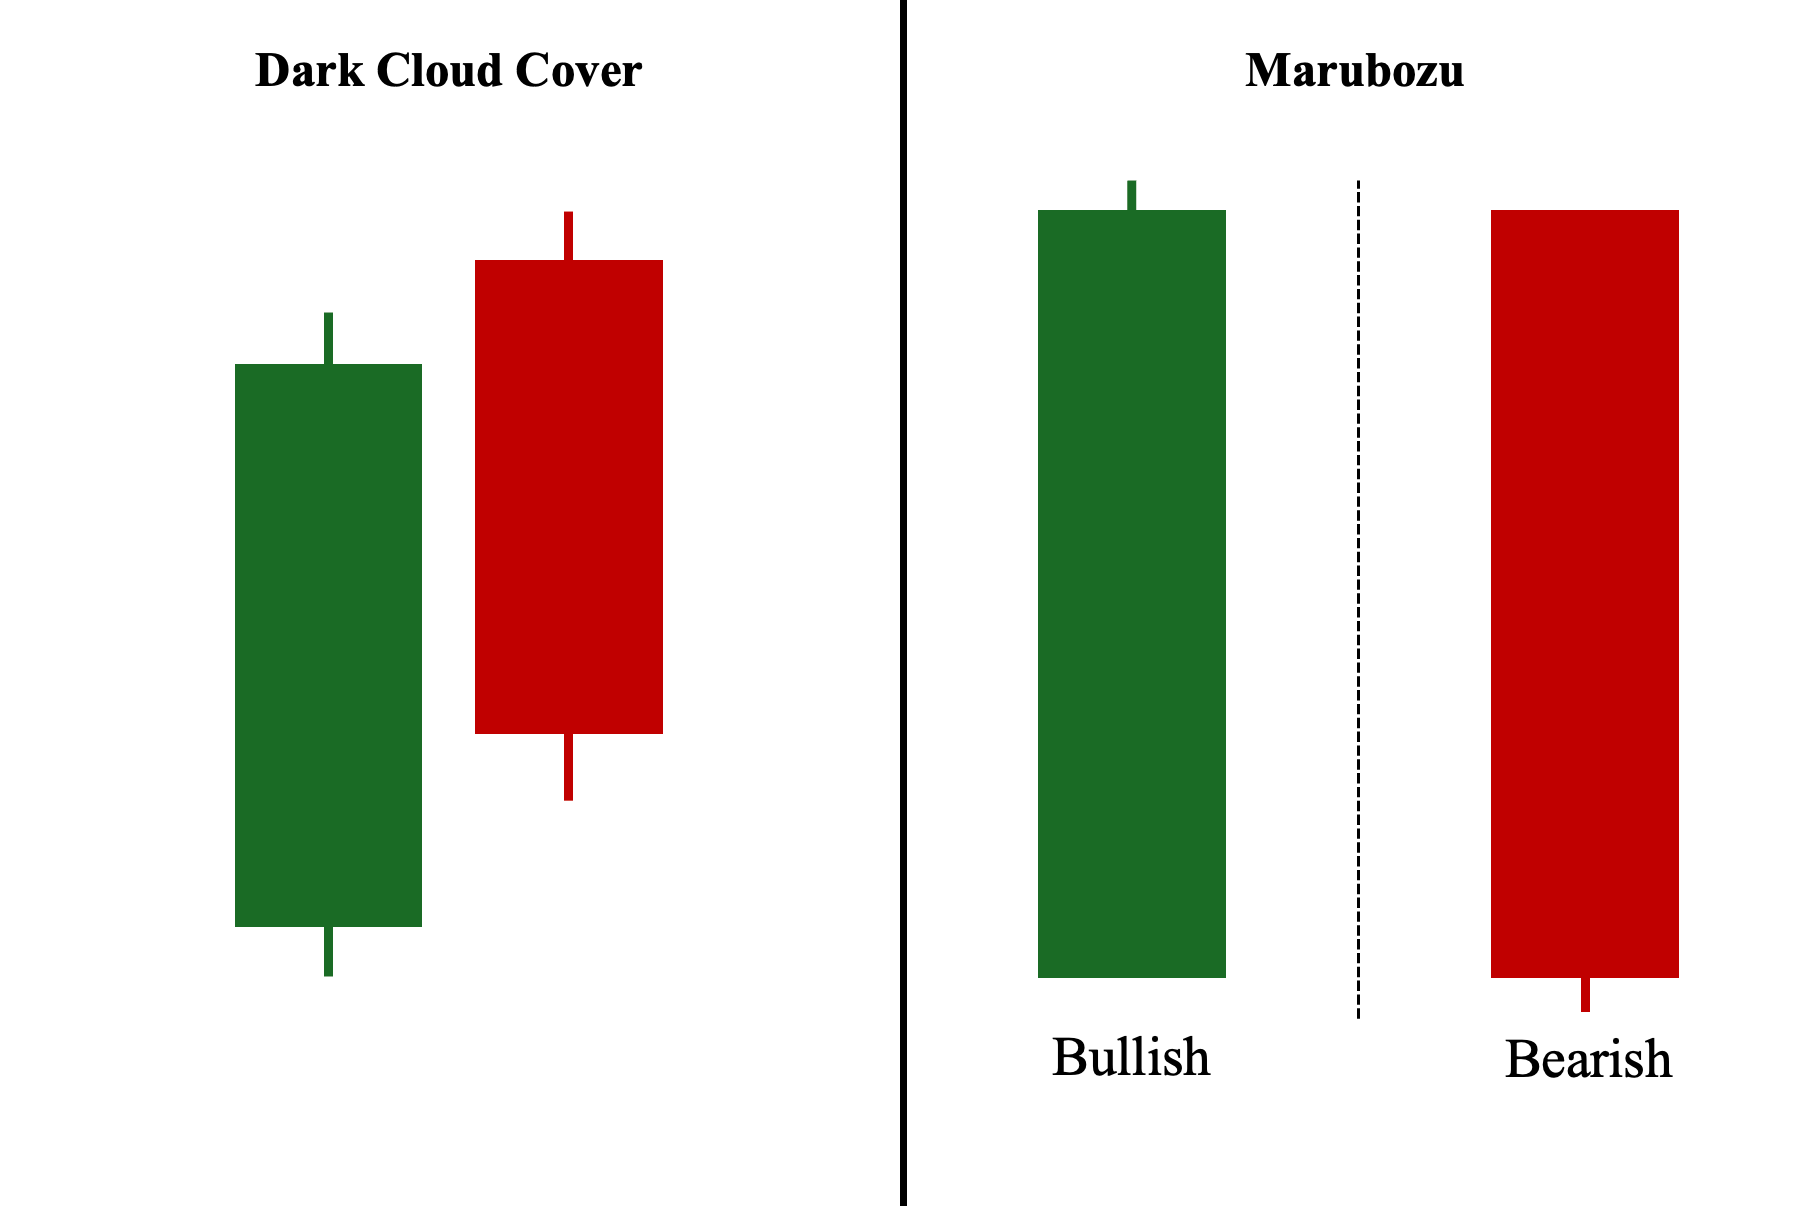
Unlike the dark cloud cover, which is strictly a bearish reversal pattern, the marubozu can be either a bullish or bearish reversal pattern, depending on its color and position on the chart. If a long-bodied bullish candle appears during a downtrend, it is considered a bullish marubozu and, thus, a one-candle bullish reversal pattern. Conversely, if a long-bodied bearish candle appears during an uptrend, it is considered a bearish marubozu, making it a one-candle bearish reversal pattern. Regardless of type, both marubozu patterns feature decisive closing prices with little to no shadows—indicating strong buying pressure in bullish marubozus or strong selling pressure in bearish ones.
Dark Cloud Cover vs. Three Black Crows Pattern
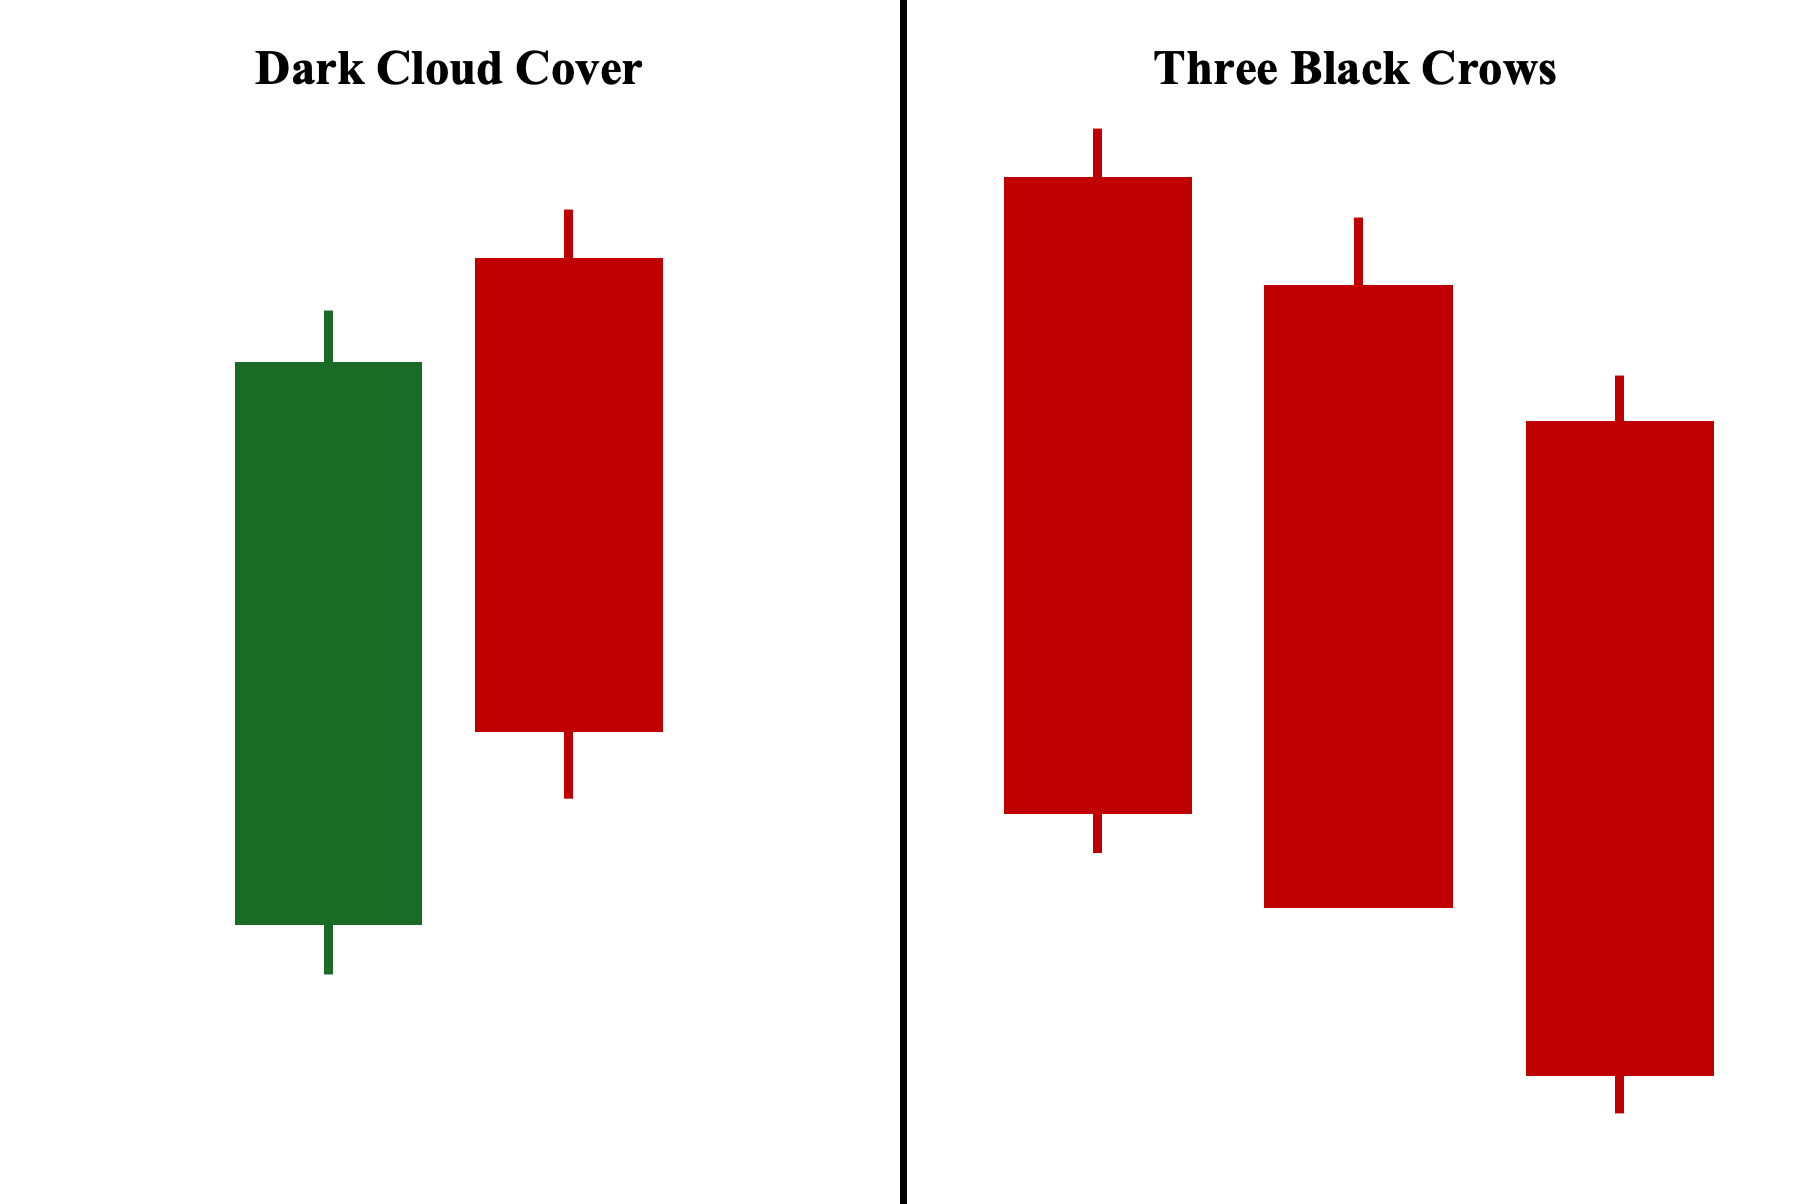
Finally, these two chart patterns—dark cloud cover and three black crows—are used to signal bearish trend reversals. When compared to the dark cloud cover, the three black crows are composed of three long-bodied bearish candles with successive low prices (both opening and closing prices). Each candle’s closing price breaks past below the previous candle’s closing price. Between the two candlestick patterns, the three black crows is arguably much more potent due to its highly bearish nature and the fact that three-candlestick patterns are generally more powerful than two-candlestick patterns.
What Are the Common Dark Cloud Cover Pattern Mistakes to Watch Out For?
Here are some of the most common mistakes to be aware of when using the dark cloud cover pattern:
1. Second Candle Not Closing Below the First Candle’s 50% Mark
The first mistake is failing to ensure that the second candle closes below the midpoint (50%) of the first candle’s body. It is important to note that the midpoint refers specifically to the body of the first candle, not its entire range (which includes the candle’s body and shadows). This distinction is crucial, as the midpoint of the first candle’s range is rarely the same as the midpoint of its body, unless the candle has little to no shadows.
2. Improper Position Sizing
Second, since the dark cloud cover can produce false signals, it is crucial to manage risk carefully. As discussed in the “disadvantages” section, the pattern has a relatively poor risk-to-reward ratio compared to other candlestick patterns. This is because, if we follow the default placement of entry below the second candle’s low and stop-loss above its high, the larger range of the second candle often results in a wider stop-loss, increasing risk.
3. Improper Usage in The Chart
Third, it is crucial to remember that dark cloud cover candlestick patterns are only valid when they appear during an uptrend. Therefore, when a dark cloud cover occurs in a downtrend or sideways (non-trending) market, the pattern is not valid for signaling a bearish reversal. This is because if it appears during a downtrend, the trend is already bearish, and if it appears in a sideways market, there is no trend to reverse to begin with.
4. Overlooking the Overall Market Context
Fourth, it’s also essential not to overlook the position in the chart where the dark cloud cover pattern appears. For example, suppose you see the pattern developing after a sustained upward price rally. Technically, as long as it meets all the requirements under the ‘How to Identify the Dark Cloud Cover’ section, then that would be a valid pattern that you can trade. However, the reality is that it is likely much more nuanced than that when we look at where precisely the pattern develops. If, for example, the pattern develops near a support level, then the pattern may not lead to a sustained downward move, as buyers could quickly step in at that support level, halting the bearish momentum.
5. Not Waiting for Confirmation
Finally, as mentioned in the ‘Disadvantages’ section, the dark cloud cover is not reliable on its own and can be misused or misunderstood if used in isolation. Therefore, waiting for confirmation is crucial, whether by checking the pattern against the overall market context, analyzing volume levels, or using complementary technical analysis tools to assess whether the pattern is likely to lead to a successful reversal. In addition, because the pattern can appear frequently, especially in lower time frames, waiting for confirmation helps ensure we take higher-quality trades with a greater probability of success.
Can a Dark Cloud Cover Appear in Forex?
It can, mostly likely on a weekly price chart. This is because trading with most firms is paused over the weekend. When trading resumes on Monday morning, there is an opportunity for prices to gap.
The red candle (second candle) within the dark cloud pattern technically needs to gap higher to entice market participants into thinking the bull trend is still in force. Shortly after gapping higher, the price would need to reverse lower finishing the candle in the lower half of the green candle’s range.
It is unlikely you would spot a dark cloud cover on a chart time frame other than weekly. This is because between Monday morning and Friday afternoon, forex is a 24 hour per day continuously traded market where price gaps occur, but are rarely visible on the chart.
Frequently Asked Questions (FAQs)
How often does the Dark Cloud Cover candlestick pattern occur?
Generally, the dark cloud cover pattern occurs more frequently on lower time frames, such as minute and hourly charts, and less frequently on longer time frames, such as daily and weekly charts.
What is the best time frame to use for the Dark Cloud Cover pattern?
Generally, the dark cloud cover is best used on longer time frames, such as daily and weekly charts, as these are favored by most traders and investors, particularly institutions. Additionally, since the dark cloud cover pattern occurs more frequently on lower time frames, like minute and hourly charts, it becomes less effective and more prone to market noise.
Who first identified the Dark Cloud Cover pattern?
Steve Nison is widely credited with bringing many candlestick patterns, including the dark cloud cover, into the mainstream in the early 1990s through his book Japanese Candlestick Charting Techniques.
What is the psychology behind the Dark Cloud Cover pattern?
As a candlestick pattern, the dark cloud cover demonstrates initial optimism from investors and traders, indicated by the first long bullish candle and the second candle’s gap-up. However, a swift, bearish countermove erases much of the previous day’s gains and price advances. This reflects sudden and unexpected selling pressure, potentially leading to panic selling and attracting short sellers anticipating a possible downtrend.
How reliable is the Dark Cloud Cover pattern?
The pattern’s reliability depends on whether it is used in isolation or alongside complementary technical analysis tools. When used alone, it becomes less reliable, as technical analysis and, by extension, trading, are multi-faceted. Hence, relying solely on the dark cloud cover gives a limited and restricted perspective. In contrast, evaluating the overall market structure and using additional tools provides a broader view, enhancing the overall reliability of the dark cloud cover pattern.
What is the opposite of the Dark Cloud Cover?
The counterpart of the dark cloud cover is the piercing line pattern. The piercing pattern occurs during a downtrend and signals a potential bullish trend reversal. It consists of a long bearish candle (first candle) followed by a bullish candle that gaps down at its opening price but closes beyond the midpoint of the first candle’s body, indicating strong bullish momentum from elevated buying pressure.
Is the Dark Cloud Cover pattern bullish or bearish?
The dark cloud cover is a bearish pattern signaling a potential trend reversal from an uptrend to a downtrend. When this pattern appears, it suggests that future price movements are likely to be bearish, with prices moving downwards.
Is the Dark Cloud Cover a bearish candlestick reversal pattern?
Yes, the dark cloud cover signals a potential bearish reversal from an uptrend to a downtrend. Therefore, for it to be valid, it must appear during an uptrend and cannot occur during a downtrend, as the market is already in a bearish trend.


